financial report to board - december 2013 · $ 430.3 $ 9.5 $ 1.9 $ (4.1) ... research overhead...
TRANSCRIPT
Financial Update Report to the Board of Trustees
December 6, 2013
I: 2013-14 Operating Budget Update
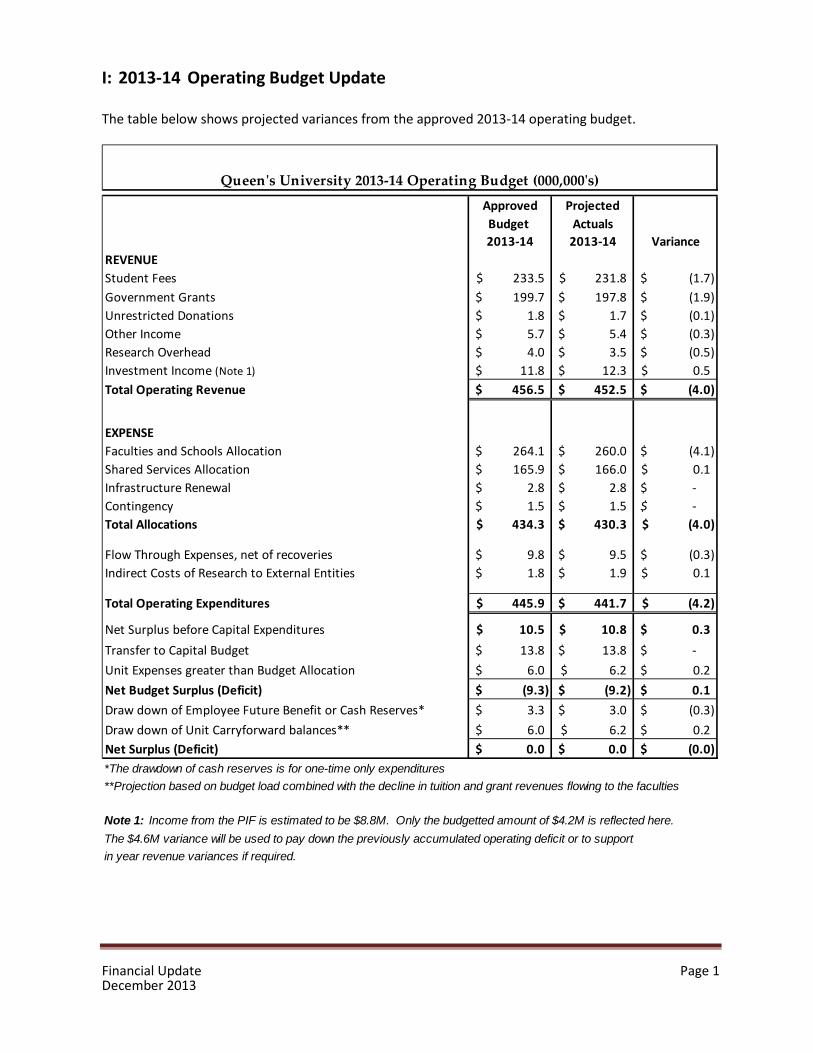
The table below shows projected variances from the approved 2013-14 operating budget.
Queen's University 2013-14 Operating Budget (000,000's)
REVENUE Student Fees Government Grants Unrestricted Donations Other Income Research Overhead Investment Income (Note 1)
Total Operating Revenue
EXPENSE Faculties and Schools Allocation Shared Services Allocation Infrastructure Renewal Contingency Total Allocations
Flow Through Expenses, net of recoveries Indirect Costs of Research to External Entities
Total Operating Expenditures
Net Surplus before Capital Expenditures Transfer to Capital Budget Unit Expenses greater than Budget Allocation Net Budget Surplus (Deficit) Draw down of Employee Future Benefit or Cash Reserves* Draw down of Unit Carryforward balances** Net Surplus (Deficit)
Approved Budget 2013-14
$ 233.5 $ 199.7 $ 1.8 $ 5.7 $ 4.0 $ 11.8
Projected Actuals
2013-14
$ 231.8 $ 197.8 $ 1.7 $ 5.4 $ 3.5 $ 12.3
Variance
$ (1.7) $ (1.9) $ (0.1) $ (0.3) $ (0.5) $ 0.5
$ 456.5 $ 452.5 $ (4.0)
$ 264.1 $ 165.9 $ 2.8 $ 1.5 $ 434.3
$ 9.8 $ 1.8
$ 260.0 $ 166.0 $ 2.8 $ 1.5 $ 430.3
$ 9.5 $ 1.9
$ (4.1) $ 0.1 $ -$ -$ (4.0)
$ (0.3) $ 0.1
$ 445.9 $ 441.7 $ (4.2)
$ 10.5 $ 13.8 $ 6.0
$ 10.8 $ 13.8 $ 6.2
$ 0.3 $ -$ 0.2
$ (9.3) $ (9.2) $ 0.1 $ 3.3 $ 6.0
$ 3.0 $ 6.2
$ (0.3) $ 0.2
$ 0.0 $ 0.0 $ (0.0) *The drawdown of cash reserves is for one-time only expenditures **Projection based on budget load combined with the decline in tuition and grant revenues flowing to the faculties
Note 1: Income from the PIF is estimated to be $8.8M. Only the budgetted amount of $4.2M is reflected here. The $4.6M variance will be used to pay down the previously accumulated operating deficit or to support in year revenue variances if required.
Financial Update Page 1 December 2013
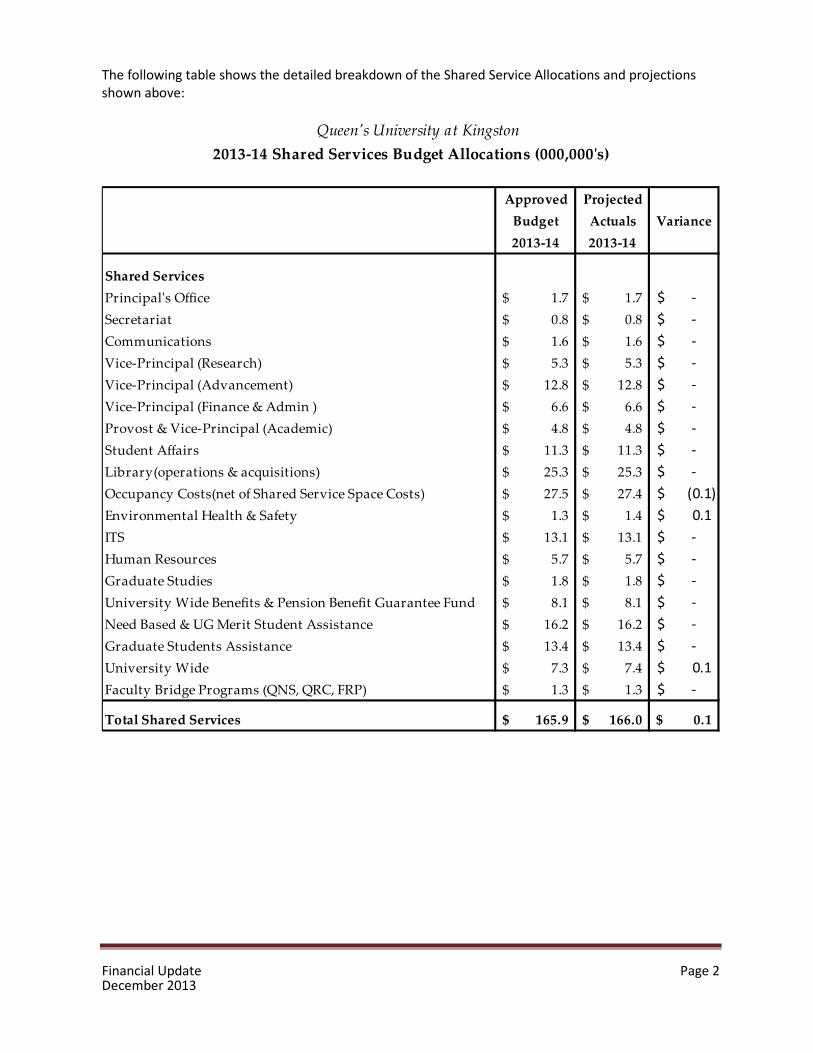
The following table shows the detailed breakdown of the Shared Service Allocations and projections shown above:
Queen's University at Kingston 2013-14 Shared Services Budget Allocations (000,000's)
Approved Budget 2013-14
Projected Actuals 2013-14
Variance
Shared Services Principal's Office $ 1.7 $ 1.7 $ -Secretariat $ 0.8 $ 0.8 $ -Communications $ 1.6 $ 1.6 $ -Vice-Principal (Research) $ 5.3 $ 5.3 $ -Vice-Principal (Advancement) $ 12.8 $ 12.8 $ -Vice-Principal (Finance & Admin ) $ 6.6 $ 6.6 $ -Provost & Vice-Principal (Academic) $ 4.8 $ 4.8 $ -Student Affairs $ 11.3 $ 11.3 $ -Library(operations & acquisitions) $ 25.3 $ 25.3 $ -Occupancy Costs(net of Shared Service Space Costs) $ 27.5 $ 27.4 $ (0.1) Environmental Health & Safety $ 1.3 $ 1.4 $ 0.1 ITS $ 13.1 $ 13.1 $ -Human Resources $ 5.7 $ 5.7 $ -Graduate Studies $ 1.8 $ 1.8 $ -University Wide Benefits & Pension Benefit Guarantee Fund $ 8.1 $ 8.1 $ -Need Based & UG Merit Student Assistance $ 16.2 $ 16.2 $ -Graduate Students Assistance $ 13.4 $ 13.4 $ -University Wide $ 7.3 $ 7.4 $ 0.1 Faculty Bridge Programs (QNS, QRC, FRP) $ 1.3 $ 1.3 $ -
Total Shared Services $ 165.9 $ 166.0 $ 0.1
Financial Update Page 2 December 2013
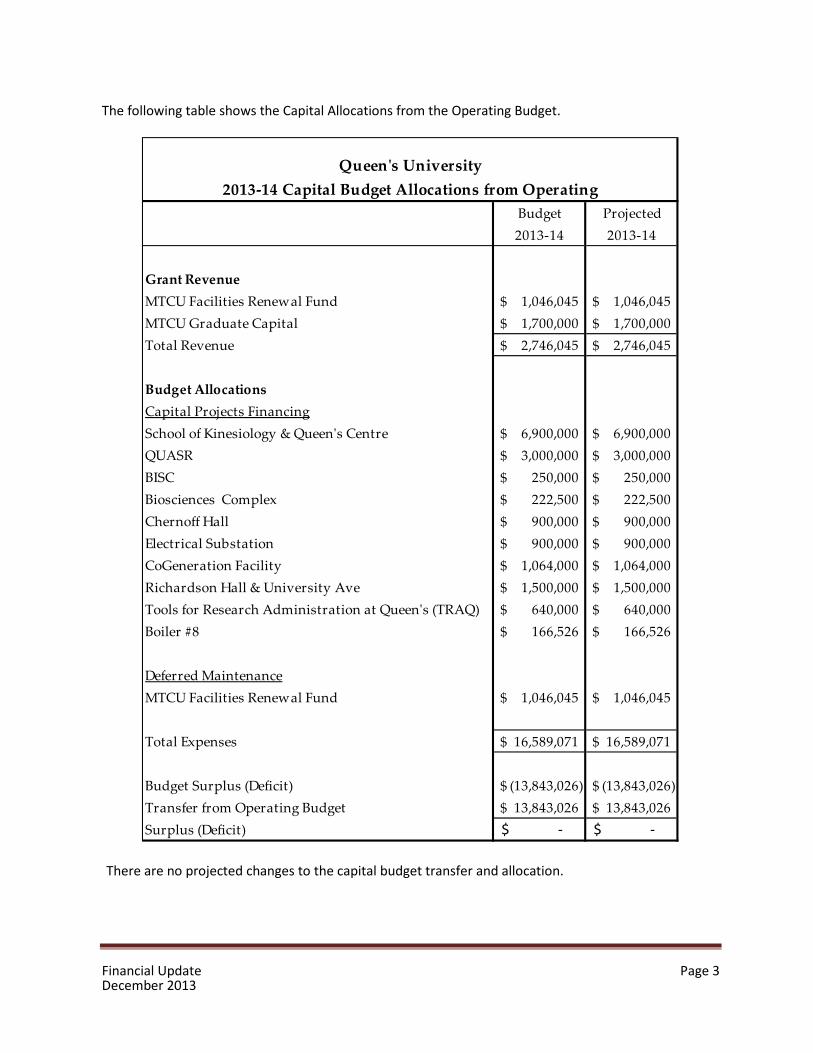
The following table shows the Capital Allocations from the Operating Budget.
Queen's University 2013-14 Capital Budget Allocations from Operating
Budget 2013-14
Projected 2013-14
Grant Revenue MTCU Facilities Renewal Fund MTCU Graduate Capital Total Revenue
Budget Allocations Capital Projects Financing School of Kinesiology & Queen's Centre QUASR BISC Biosciences Complex Chernoff Hall Electrical Substation CoGeneration Facility Richardson Hall & University Ave Tools for Research Administration at Queen's (TRAQ) Boiler #8
Deferred Maintenance MTCU Facilities Renewal Fund
Total Expenses
Budget Surplus (Deficit) Transfer from Operating Budget Surplus (Deficit)
$ 1,046,045 $ 1,700,000
$ 1,046,045 $ 1,700,000
$ 2,746,045 $ 2,746,045
$ 6,900,000 $ 3,000,000 $ 250,000 $ 222,500 $ 900,000 $ 900,000 $ 1,064,000 $ 1,500,000 $ 640,000 $ 166,526
$ 1,046,045
$ 6,900,000 $ 3,000,000 $ 250,000 $ 222,500 $ 900,000 $ 900,000 $ 1,064,000 $ 1,500,000 $ 640,000 $ 166,526
$ 1,046,045
$ 16,589,071 $ 16,589,071
$ (13,843,026) $ 13,843,026
$ (13,843,026) $ 13,843,026
$ - $ -
There are no projected changes to the capital budget transfer and allocation.
Financial Update Page 3 December 2013
Budget Analysis
The 2013-14 projected operating budget remains balanced. The budget variances are explained below:
Enrolment
Preliminary enrolment data suggests that we are below target against our overall enrolment projections at both the graduate and undergraduate levels.
Graduate tuition fee revenue is down marginally ($100K) because of lower than budgeted graduate enrolment at both the Master’s and PhD levels. There has also been a shift in enrolment from domestic to international students, which is responsible for a much larger decrease in the graduate accessibility grant of $868K. It should be noted that the revised projection assumes that the government will allow conversion of unfilled PhD spaces to Master’s spaces.
Undergraduate tuition revenue is showing a negative variance of $2M. Enrolments in Arts and Science, the Bader International Study Centre and Engineering are lower than planned. The decline in these areas is partially offset by higher than planned enrolments in the Queen’s School of Business. A positive variance of $400K in Athletics fees is also offsetting the decline in tuition revenues.
The lower than planned enrolment is producing a negative variance on the Undergraduate Accessibility grant of $1.1M. This figure presumes that the provincial government will fully fund our 2013-2014 undergraduate enrolment. Preliminary indications are that the system growth may exceed the government planning envelope. The government is currently collecting preliminary enrolment data from all Universities to determine if there will be enough funds available to fully fund all Undergraduate growth in 2013-14. If not, there is a risk that our growth funding will be discounted.
Unrestricted Donations
Donation revenue is difficult to forecast, however, based on current donations received and historical trends, Advancement is forecasting unrestricted donation revenues of $1.74M which is only $10K below budget.
Other Income
Other income has a negative variance due to a decline in Health Fee revenues which is directly related to lower than budgeted enrolments.
Research Overhead
Research Overhead revenues are difficult to project because they are linked to expenditures in research projects, but current projections suggest we are $500K lower than the budget amounted.
Investment Income
Investment income is showing a positive variance of 500K as a result of higher than budgeted short-term investment returns. The operating budget currently assumes revenue from the Pooled
Financial Update Page 4 December 2013
Investment Fund (PIF) of $4.2M, but current projections suggest the revenue may exceed $8.8M. Prudence dictates that we include only the budgeted amount of $4.2M in the updated projections and use the surplus income to reduce the cumulative operating fund deficit from previous years ($8.1M at April 30/13) or, if needed, fund in year expenses.
Expenditures
Under the new budget model all tuition and grant revenues are attributed directly to the Faculties and Schools, which means the lower than projected tuition and grant revenues have a direct effect on Faculty and School allocations. All research overhead is attributed to Faculties and Schools, so the reduction in revenue from this source will also be borne by Faculties and Schools.
Shared Services are showing higher than projected expenditures of $100K. This is due to increasing costs of medical and hazardous waste collection ($100K) and increased costs of University memberships ($100K). These are being offset by a decrease in municipal tax expenses of $100K. This tax expense is reflected in occupancy costs on the detailed table of shared services expenditures.
To date expenses on utilities expenses are tracking within budget.
Indirect costs to external entities have increased because the hospitals’ share of tri-council grants has increased. The total grant to Queen’s has not, however, increased, which means that the Faculties and Schools are now receiving a lower allocation than was originally budgeted.
Flow-through expenses net of recoveries are lower than was originally budgeted because of higher than expected ancillary overhead recoveries.
Operating Budget Surplus (or Deficit)
Current projections continue to show a balanced budget. The most significant risks to this projection are the possibility of discounting on Undergraduate Accessibility Grant funding and the rejection by government of our request for conversion of PhD spaces to Master’s spaces.
The budget approved by the Board reflects the in-year revenue and expenses or budget allocations. Many units are planning total expenditures that are higher than their budget allocation, with the additional expenditures being funded by prior-year reserves (carry-forwards). The preliminary projection was that the 2013-2014 operating budget would involve reserves being drawn down by $6.0M. When units presented their final budget projections, the projection was for a drawdown of $4.3M. Now, however, the lower than projected tuition and grant revenues that will flow through to the Faculties and Schools result in the projected drawdown rising from $4.3M to $6.2M. This said, past experience suggests units will by year end be drawing down their reserves to a lesser degree.
The budgeted $3.3M drawdown of the Employee Future Benefits and Cash reserve is now projected to be $3.0M because of higher than budgeted investment income revenues. This drawdown of cash is furthermore explicitly matched to one-time expenses.
It is important to note that there are a number of non-cash year end accounting adjustments for employee future benefits and derivatives that are dependent on year-end accounting valuations and
Financial Update Page 5 December 2013
are therefore not included in the Board approved operating budget. These accounting transactions will affect the operating surplus (or deficit) per the audited financial statements.
II: Ancillary Operations and Consolidated Entities
Overall, Ancillary Operations and Consolidated Entities are projecting increases in deficits over what was budgeted in excess of $2.3M, the majority of which is a result of Parteq one-time restructuring costs.
Community Housing is now projecting a $148K profit, $419K less than budgeted, because of a higher than expected vacancy rate. On the other hand, some suites have recently been furnished to address the need for furnished apartments, and this will increase the expected profit if the furnished apartments are rented for the winter term.
The Donald Gordon Centre’s profit is expected to be about $197K below budget because of lower than expected enrolment in some of the QSB programs that use the Centre. Strong winter enrolment could, however, help to bring the Centre closer to its original budget projection.
PARTEQ/Green Centre is projecting a deficit of $1.5M compared to a break-even budget, which is primarily a result of one-time-only expenditures related to restructuring with staff downsizing. Lower revenue is partially offset by on-going salary reductions.
The parking deficit of $2M is a result of debt servicing (principal and interest) payments related to the Union Street and Queen’s Centre underground parking garages (amortized over 30 years).
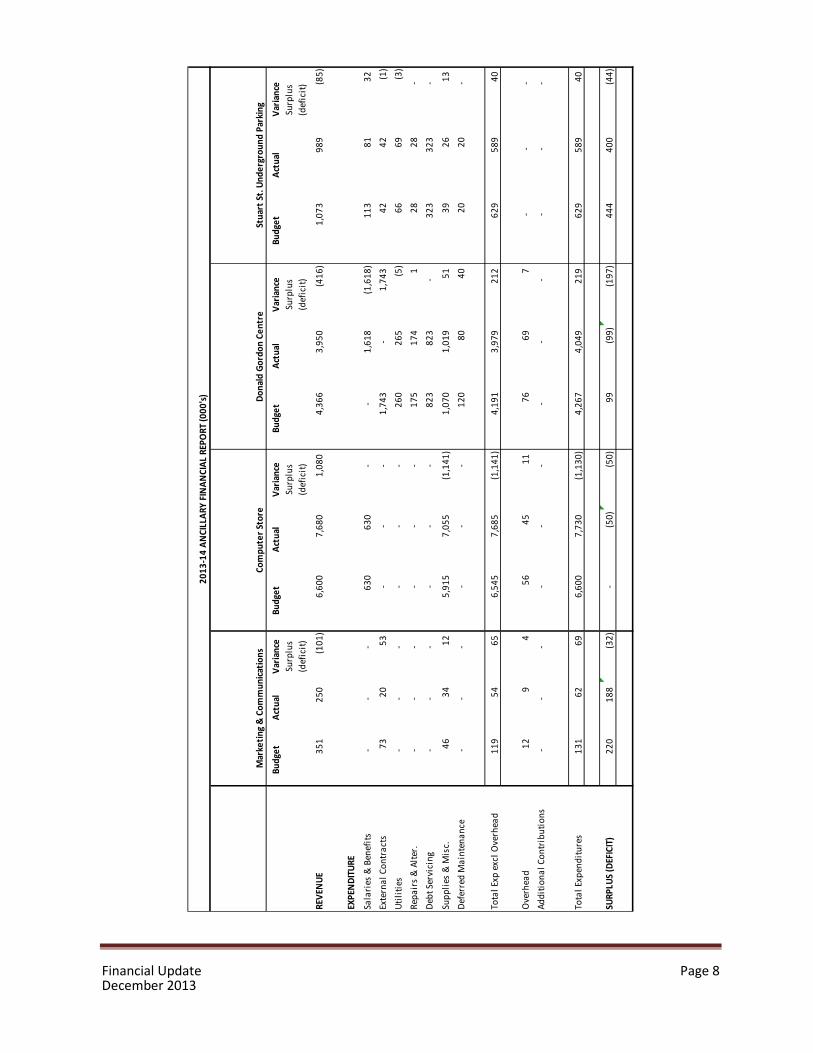
The following tables provide budget and projection details for the Ancillary Operations as well as for the Consolidated Entities.
Financial Update Page 6 December 2013
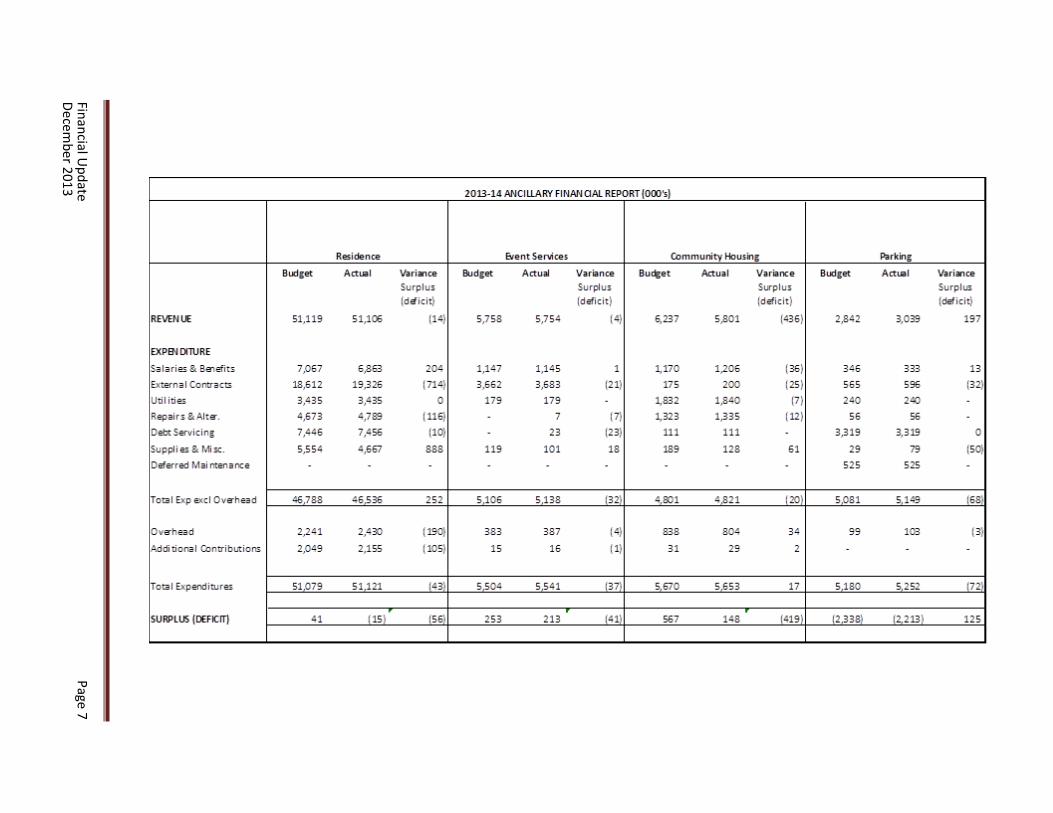
Clll.ARY Fl~JAJIWAL REPORT (OOO's)
Residence B/e,nt Se,rlli ce•5 (bmmunity Housing Parking
Budget A,rtual Variance Budget Actu<al Variance Budget Artu<al V a_rianoe B,udget A,rtual Varian re•
Surp•lus Surplu.s Surp,lus Surp,lus
(d e' i•c i~ (d cfic it l [d cficitl [dcf ic i
REVE~J UE 51,11'9 51,106 (141 5,758, 5,754 (41 6, 237 51SCll (43 61 21B-42 3}J3:! 1'97
EXPENDl1URE
Salaries& BBlcfit s 7JJ67 61&6:I 2()4 1,147 1,14 5 1 1,170 1,2G6 [361 34 6 333 13
Extern a I Oo ntracts lB,612 1'9,326 [7141 3,6-6.2 3,6S3 [211 17 5 2G·:l [251 565 5% [32l1
Utilitie;. 3,435 3,4 35 0 17'9 17'9 - 1,8,32 1,&40 (71 240 2
Rep airs &Alter. 4)i 73 4,7.88 [116) - 7 [71 1, 323 1,335 [121 56 56,
Debt Servk i ng 7,4,g,;; 7;I S6 [10) - 23 [23! 111 111 - 3,31'9 3)31'9
Suppli e;. & Misc. 5,554 4,6-67 ,8-8-S 11'9 llJl l& 18,'9 12,S 61 2'9 79
D•cferred M ai nten a nc e - - - - - - - - - 525 525
Tota I Exp exc I O v erh ead 4678-B 4 6536 252 5,10 6 5BS (32) 4 ID1 4 1821 f:CDI 5,081 5 1-.B
O v erhead 2,241 2,4 ~ [1'9-J) 3&3 3.87 (41 83.8 S,)4 34 '9:l 1GB (3il
Ad di ti,o na I Ge ntri b utio ns 2):14'9 2,155 [m s) 15 16 [11 31 2'9 2 - - -
Total Exp enditures 5107'9 51 ,121 (431 5,5•)4 5,54 1 (37) 5 670 5,653 17 5,180 5_,2 52 [7211
(1s 1 • (56) . .
(41'91 (2,33.Sj (2,2131 SURPLUS ( DE!FICTr) 4 1 253 213 (411 567 14 8 12 5
Financial Update
Page 7 Decem
ber 2013
,..
"'
"'
2013
-14
ANCI
LLAR
Y FI
NAN
CIAL
REP
ORT
(000
's)
Mar
ketin
g &
Com
mun
icatio
ns
Com
pute
r Sto
re
Dona
ld G
ordo
n Ce
ntre
St
uart
St.
Unde
rgro
und
Park
ing
REVE
NUE
EXPE
NDI
TURE
Sala
ries
& B
enef
its
Exte
rnal
Con
trac
ts
Utili
ties
Repa
irs
& A
lter.
Debt
Ser
vici
ng
Supp
lies
& M
isc.
De
ferr
ed M
aint
enan
ce
Tota
l Exp
exc
l Ove
rhea
d
Ove
rhea
d Ad
ditio
nal C
ontr
ibut
ions
Tota
l Exp
endi
ture
s
SURP
LUS
(DEF
ICIT
)
Budg
et
Actu
al
Varia
nce
Surp
lus
(def
icit)
351
250
(101
)
--
-73
20
53
-
--
--
--
--
46
34
12
--
-
Budg
et
Actu
al
Varia
nce
Surp
lus
(def
icit)
6,60
0 7,
680
1,08
0
630
630
--
--
--
--
--
--
-
5,91
5 7,
055
(1,1
41)
--
-
Budg
et
Actu
al
Varia
nce
Surp
lus
(def
icit)
4,36
6 3,
950
(416
)
-1,
618
(1,6
18)
1,74
3 -
1,74
3 26
0 26
5 (5
) 17
5 17
4 1
823
823
-
1,07
0 1,
019
51
120
80
40
Budg
et
Actu
al
Varia
nce
Surp
lus
(def
icit)
1,07
3 98
9 (8
5)
113
81
32
42
42
(1)
66
69
(3)
28
28
-32
3 32
3 -
39
26
13
20
20
-
119
54
65
6,54
5 7,
685
(1,1
41)
4,19
1 3,
979
212
629
589
40
12
9 4
--
-56
45
11
-
--
76
69
7 -
--
--
--
--
131
62
69
6,60
0 7,
730
(1,1
30)
4,26
7 4,
049
219
629
589
40
220
188
(32)
-
(50)
(5
0)
99
(99)
(1
97)
444
400
(44)
Financial Update Page 8 December 2013
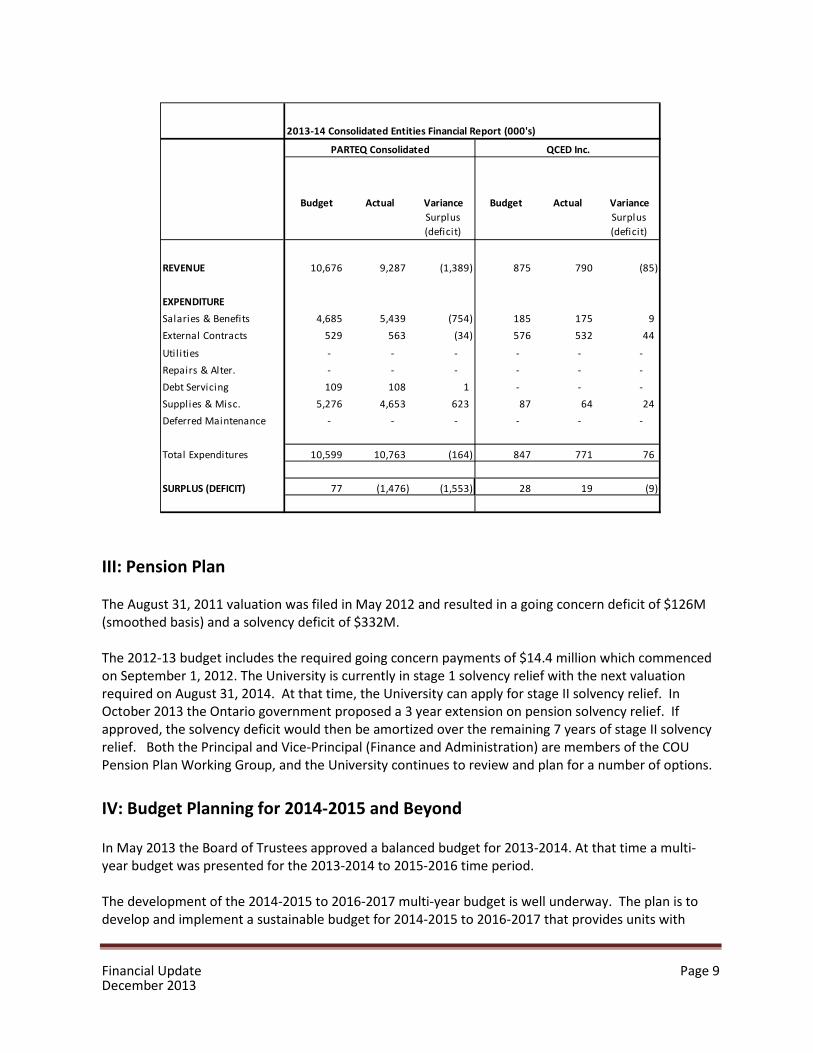
2013-14 Consolidated Entities Financial Report (000's)
PARTEQ Consolidated QCED Inc.
Budget Actual Variance Surplus (deficit)
Budget Actual Variance Surplus (deficit)
REVENUE
EXPENDITURE Salaries & Benefits External Contracts
Util ities Repairs & Alter. Debt Servicing Supplies & Misc. Deferred Maintenance
Total Expenditures
SURPLUS (DEFICIT)
10,676 9,287 (1,389)
4,685 5,439 (754) 529 563 (34)
- - -- - -
109 108 1 5,276 4,653 623
- - -
875
185 576
---87
-
790
175 532
---64
-
(85)
9 44
---24
-
10,599 10,763 (164) 847 771 76
77 (1,476) (1,553) 28 19 (9)
III: Pension Plan
The August 31, 2011 valuation was filed in May 2012 and resulted in a going concern deficit of $126M (smoothed basis) and a solvency deficit of $332M.
The 2012-13 budget includes the required going concern payments of $14.4 million which commenced on September 1, 2012. The University is currently in stage 1 solvency relief with the next valuation required on August 31, 2014. At that time, the University can apply for stage II solvency relief. In October 2013 the Ontario government proposed a 3 year extension on pension solvency relief. If approved, the solvency deficit would then be amortized over the remaining 7 years of stage II solvency relief. Both the Principal and Vice-Principal (Finance and Administration) are members of the COU Pension Plan Working Group, and the University continues to review and plan for a number of options.
IV: Budget Planning for 2014-2015 and Beyond
In May 2013 the Board of Trustees approved a balanced budget for 2013-2014. At that time a multi-year budget was presented for the 2013-2014 to 2015-2016 time period.
The development of the 2014-2015 to 2016-2017 multi-year budget is well underway. The plan is to develop and implement a sustainable budget for 2014-2015 to 2016-2017 that provides units with
Financial Update Page 9 December 2013
appropriate incentives to increase revenues and/or decrease costs in direct support of academic priorities. Cost containment opportunities are also being explored to ensure that resources are being used efficiently and effectively.
The work of supporting and running the new budget model continues to include a high level of participation by the Provost’s Advisory Committee on the Budget (PACB) and by Directors and Business Officers in both the Faculties and Schools and the shared service units.
When the 2013-2014 to 2015-2016 budget was presented for approval in May it was noted that there were a number of risks to the operating budget projections including:
• Reliance on government grant support and tuition and the effect of further changes in government policy
• Expiration of collective agreements during the three-year timeframe and the unknown outcomes of those negotiations
• Addressing the pension plan solvency shortfall in 2015-2016 • Significant investment required to support infrastructure renewal, both physical plant and
technology • Market volatility and the impact on investment income from the PIF • Provincial grant funding uncertainties
These risks continue into the new three-year planning window.
The uncertainties around provincial government funding will remain, but may be lessened once the discussions regarding the Strategic Mandate Agreements and the Differentiation Framework are concluded.
A number of collective agreements are due to expire in 2014 and 2015 including those with the Queen’s University Faculty Association, the Canadian Union of Public Employees and the United Steel Workers. The outcomes of these negotiations will bear critically on our ability to contain costs over the planning period.
The Government recently proposed a three-year extension of pension solvency relief, but the proposal, if accepted, will reduce the amortization period for the solvency payments to seven years (from 10). Work is also continuing on the review of alternative plans.
The 2013-2014 budget included an additional allocation for deferred maintenance and administrative system implementation and renewal. The continuation of, and, if possible, an increase in, this allocation have been identified as priorities for the 2014-2015 budget planning cycle.
The short-term budget planning framework continues to be extremely challenging. The Provost and Vice-Principal (Academic) provided Shared Service Units with Comprehensive Budget Plan Guidelines and preliminary budget allocations in June. The guidelines included planning parameters that work towards the management of the required balanced budget and the reduction and ultimate elimination of the reliance on carry-forward funds to fund core or structural activities. All shared service units submitted their budgets by the end of August and PACB meetings to discuss the submissions were held in late September. Preliminary budget allocation decisions for the shared service units have been made which allowed the determination of preliminary Faculty and School budget allocations. These were
Financial Update Page 10 December 2013
released mid-October, and Faculties and Schools are required to submit their multi-year budget plans by late November; PACB meetings to review the submissions are scheduled for December.
Following this, 2014-2015 to 2016-2017 budget projections will be developed in January. The preliminary projections will be presented to the Board of Trustees at its March meeting for information and consultation; the final projections will be presented to the board for approval at its May meeting.
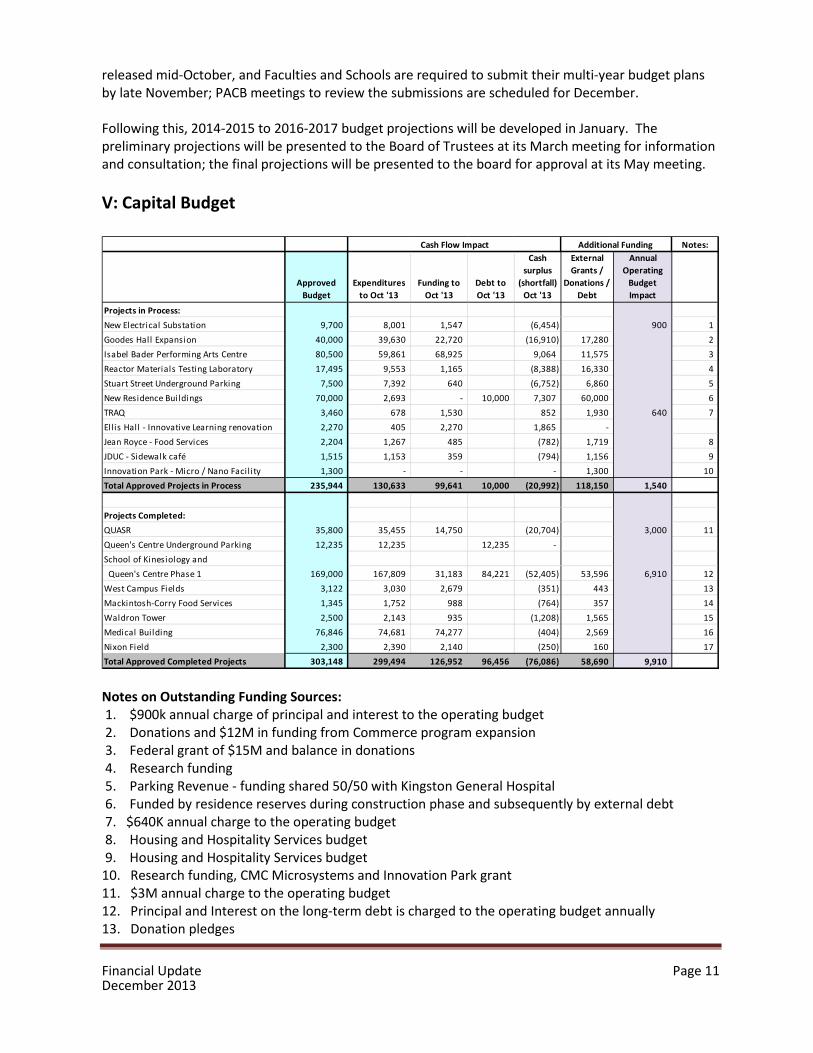
V: Capital Budget
Cash Flow Impact Additional Funding Notes:
Approved Budget
Cash surplus
Expenditures Funding to Debt to (shortfall) to Oct '13 Oct '13 Oct '13 Oct '13
External Grants /
Donations / Debt
Annual Operating
Budget Impact
Projects in Process: New Electrical Substation 9,700 8,001 1,547 (6,454) 900 1 Goodes Hall Expansion 40,000 39,630 22,720 (16,910) 17,280 2 Isabel Bader Performing Arts Centre 80,500 59,861 68,925 9,064 11,575 3 Reactor Material s Testi ng Laboratory 17,495 9,553 1,165 (8,388) 16,330 4 Stuart Street Underground Parking 7,500 7,392 640 (6,752) 6,860 5 New Residence Buildings 70,000 2,693 - 10,000 7,307 60,000 6 TRAQ 3,460 678 1,530 852 1,930 640 7 Ell is Hall - Innovative Learning renovation 2,270 405 2,270 1,865 -Jean Royce - Food Servi ces 2,204 1,267 485 (782) 1,719 8 JDUC - Si dewal k café 1,515 1,153 359 (794) 1,156 9 Innovation Park - Micro / Nano Facil ity 1,300 - - - 1,300 10 Total Approved Projects in Process 235,944 130,633 99,641 10,000 (20,992) 118,150 1,540
Projects Completed: QUASR 35,800 35,455 14,750 (20,704) 3,000 11 Queen's Centre Underground Parking 12,235 12,235 12,235 -School of Kinesiology and Queen's Centre Phas e 1 169,000 167,809 31,183 84,221 (52,405) 53,596 6,910 12 West Campus Fields 3,122 3,030 2,679 (351) 443 13 Mackintosh-Corry Food Services 1,345 1,752 988 (764) 357 14 Waldron Tower 2,500 2,143 935 (1,208) 1,565 15 Medical Building 76,846 74,681 74,277 (404) 2,569 16 Nixon Fiel d 2,300 2,390 2,140 (250) 160 17 Total Approved Completed Projects 303,148 299,494 126,952 96,456 (76,086) 58,690 9,910
Notes on Outstanding Funding Sources: 1. $900k annual charge of principal and interest to the operating budget 2. Donations and $12M in funding from Commerce program expansion 3. Federal grant of $15M and balance in donations 4. Research funding 5. Parking Revenue - funding shared 50/50 with Kingston General Hospital 6. Funded by residence reserves during construction phase and subsequently by external debt 7. $640K annual charge to the operating budget 8. Housing and Hospitality Services budget 9. Housing and Hospitality Services budget
10. Research funding, CMC Microsystems and Innovation Park grant 11. $3M annual charge to the operating budget 12. Principal and Interest on the long-term debt is charged to the operating budget annually 13. Donation pledges
Financial Update Page 11 December 2013
14. Food Services- Ancillary Operation 15. Residence revenues and reserves 16. Donations and the Faculty of Health Science has committed to fund any shortfall 17. $650K from athletics and recreation, $75K from Stuart Street underground parking garage project
and the balance in donations
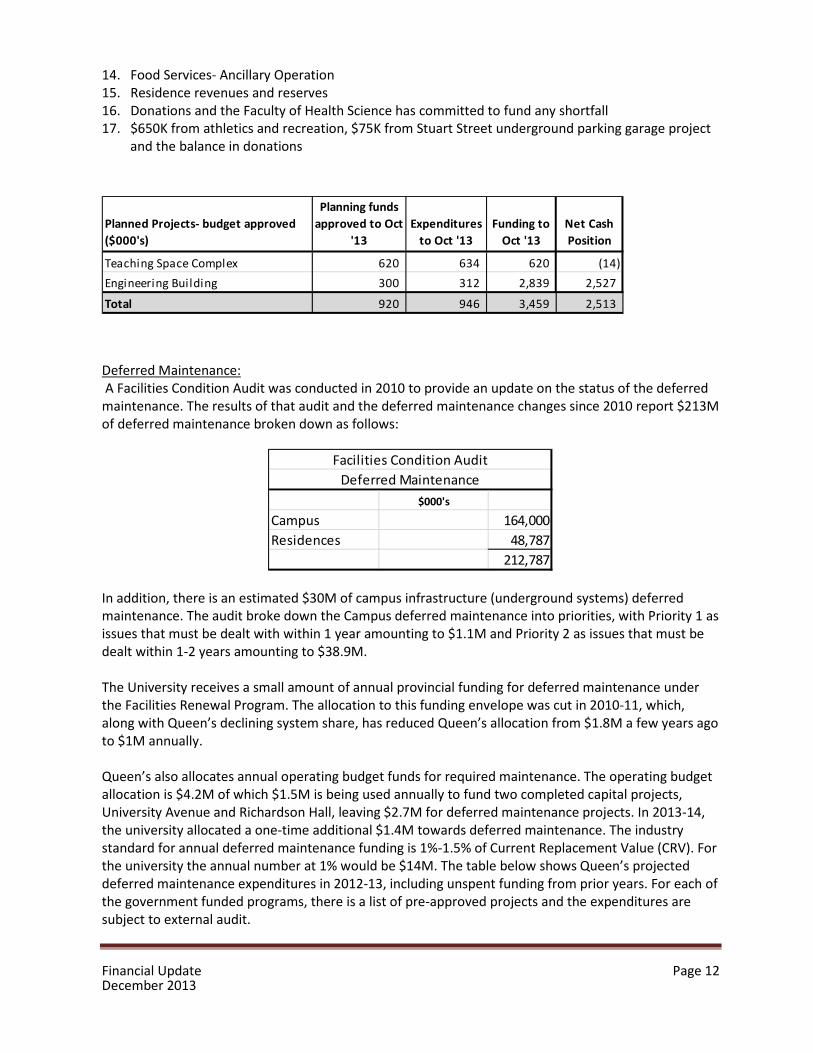
Planned Projects- budget approved ($000's)
Planning funds approved to Oct
'13 Expenditures
to Oct '13 Funding to
Oct '13 Net Cash Position
Teaching Space Complex Engineering Building
620 300
634 312
620 2,839
(14) 2,527
Total 920 946 3,459 2,513
Deferred Maintenance: A Facilities Condition Audit was conducted in 2010 to provide an update on the status of the deferred
maintenance. The results of that audit and the deferred maintenance changes since 2010 report $213M of deferred maintenance broken down as follows:
Facilities Condition Audit Deferred Maintenance
$000's
Campus Residences
164,000 48,787
212,787
In addition, there is an estimated $30M of campus infrastructure (underground systems) deferred maintenance. The audit broke down the Campus deferred maintenance into priorities, with Priority 1 as issues that must be dealt with within 1 year amounting to $1.1M and Priority 2 as issues that must be dealt within 1-2 years amounting to $38.9M.
The University receives a small amount of annual provincial funding for deferred maintenance under the Facilities Renewal Program. The allocation to this funding envelope was cut in 2010-11, which, along with Queen’s declining system share, has reduced Queen’s allocation from $1.8M a few years ago to $1M annually.
Queen’s also allocates annual operating budget funds for required maintenance. The operating budget allocation is $4.2M of which $1.5M is being used annually to fund two completed capital projects, University Avenue and Richardson Hall, leaving $2.7M for deferred maintenance projects. In 2013-14, the university allocated a one-time additional $1.4M towards deferred maintenance. The industry standard for annual deferred maintenance funding is 1%-1.5% of Current Replacement Value (CRV). For the university the annual number at 1% would be $14M. The table below shows Queen’s projected deferred maintenance expenditures in 2012-13, including unspent funding from prior years. For each of the government funded programs, there is a list of pre-approved projects and the expenditures are subject to external audit.
Financial Update Page 12 December 2013
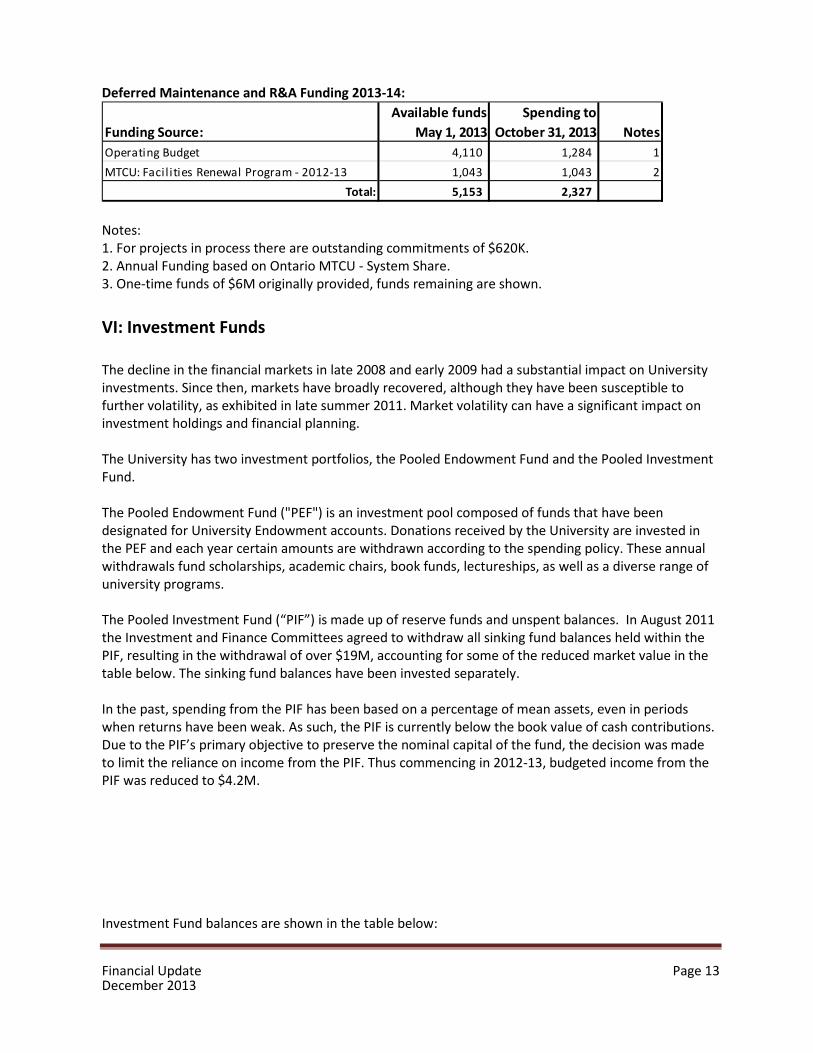
Deferred Maintenance and R&A Funding 2013-14:
Funding Source: Available funds
May 1, 2013 Spending to
October 31, 2013 Notes Operating Budget MTCU: Facil ities Renewal Program - 2012-13
4,110 1,043
1,284 1,043
1 2
Total: 5,153 2,327
Notes: 1. For projects in process there are outstanding commitments of $620K. 2. Annual Funding based on Ontario MTCU - System Share. 3. One-time funds of $6M originally provided, funds remaining are shown.
VI: Investment Funds
The decline in the financial markets in late 2008 and early 2009 had a substantial impact on University investments. Since then, markets have broadly recovered, although they have been susceptible to further volatility, as exhibited in late summer 2011. Market volatility can have a significant impact on investment holdings and financial planning.
The University has two investment portfolios, the Pooled Endowment Fund and the Pooled Investment Fund.
The Pooled Endowment Fund ("PEF") is an investment pool composed of funds that have been designated for University Endowment accounts. Donations received by the University are invested in the PEF and each year certain amounts are withdrawn according to the spending policy. These annual withdrawals fund scholarships, academic chairs, book funds, lectureships, as well as a diverse range of university programs.
The Pooled Investment Fund (“PIF”) is made up of reserve funds and unspent balances. In August 2011 the Investment and Finance Committees agreed to withdraw all sinking fund balances held within the PIF, resulting in the withdrawal of over $19M, accounting for some of the reduced market value in the table below. The sinking fund balances have been invested separately.
In the past, spending from the PIF has been based on a percentage of mean assets, even in periods when returns have been weak. As such, the PIF is currently below the book value of cash contributions. Due to the PIF’s primary objective to preserve the nominal capital of the fund, the decision was made to limit the reliance on income from the PIF. Thus commencing in 2012-13, budgeted income from the PIF was reduced to $4.2M.
Investment Fund balances are shown in the table below:
Financial Update Page 13 December 2013
- - -
Investment Portfolios (000's)
Pooled Investment Fund (PIF)
Pooled Endowment Fund (PEF) *
Market Value April 30, 2010
Market Value April 30, 2011
Market Value April 30, 2012
Market Value April 30, 2013
Market Value Oct. 31, 2013
148,797
565,852
196,185
613,440
168,436
611,732
156,463
694,010
165,276
735,053
Total 714,649 809,625 780,168 850,473 900,329
*Market value is reduced by pro-rated year end payout for the PEF
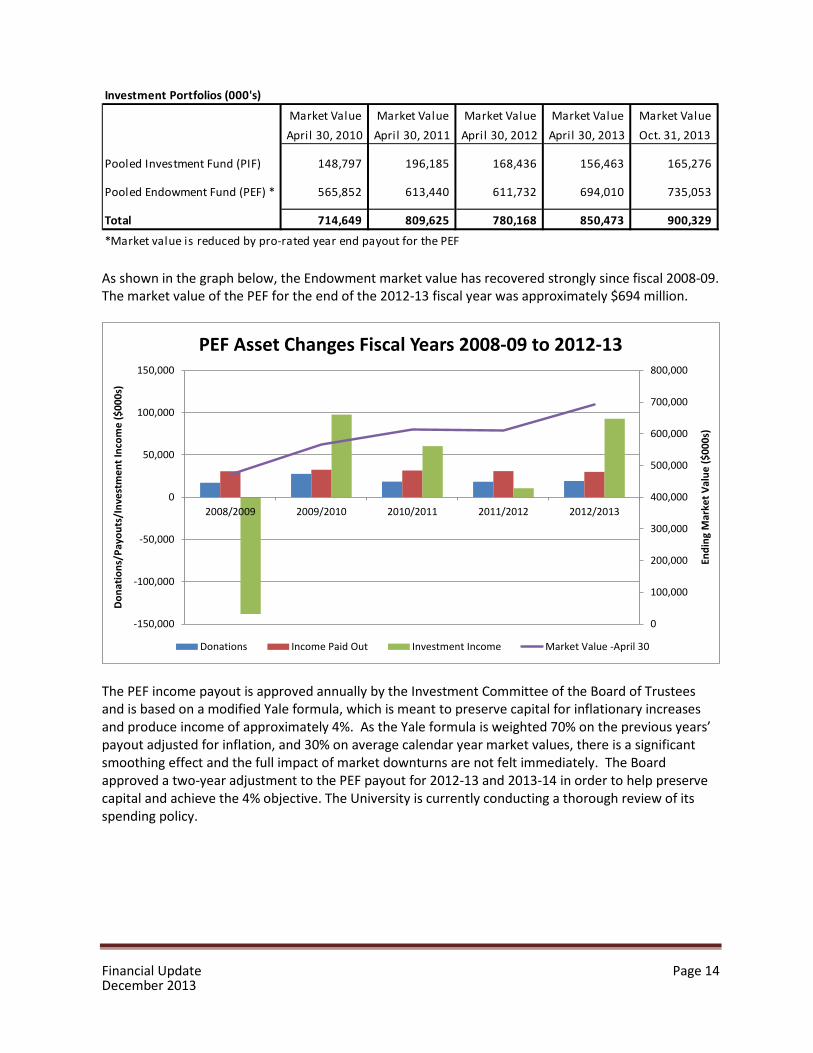
As shown in the graph below, the Endowment market value has recovered strongly since fiscal 2008-09. The market value of the PEF for the end of the 2012-13 fiscal year was approximately $694 million.
0
100,000
200,000
300,000
400,000
500,000
600,000
700,000
800,000
-150,000
-100,000
-50,000
0
50,000
100,000
150,000
2008/2009 2009/2010 2010/2011 2011/2012 2012/2013
Endi
ng M
arke
t Val
ue ($
000s
)
Dona
tions
/Pay
outs
/Inv
estm
ent I
ncom
e ($
000s
)
PEF Asset Changes Fiscal Years 2008-09 to 2012-13
Donations Income Paid Out Investment Income Market Value -April 30
The PEF income payout is approved annually by the Investment Committee of the Board of Trustees and is based on a modified Yale formula, which is meant to preserve capital for inflationary increases and produce income of approximately 4%. As the Yale formula is weighted 70% on the previous years’ payout adjusted for inflation, and 30% on average calendar year market values, there is a significant smoothing effect and the full impact of market downturns are not felt immediately. The Board approved a two-year adjustment to the PEF payout for 2012-13 and 2013-14 in order to help preserve capital and achieve the 4% objective. The University is currently conducting a thorough review of its spending policy.
Financial Update Page 14 December 2013
The 2013-14 projected PEF payouts are shown in the table below:
2013-14 Income from the Pooled Endowment Fund (000's)
General Operating Budget Trust Research
3,260 20,244
832
Total 24,336
VII: Debt and Liquidity
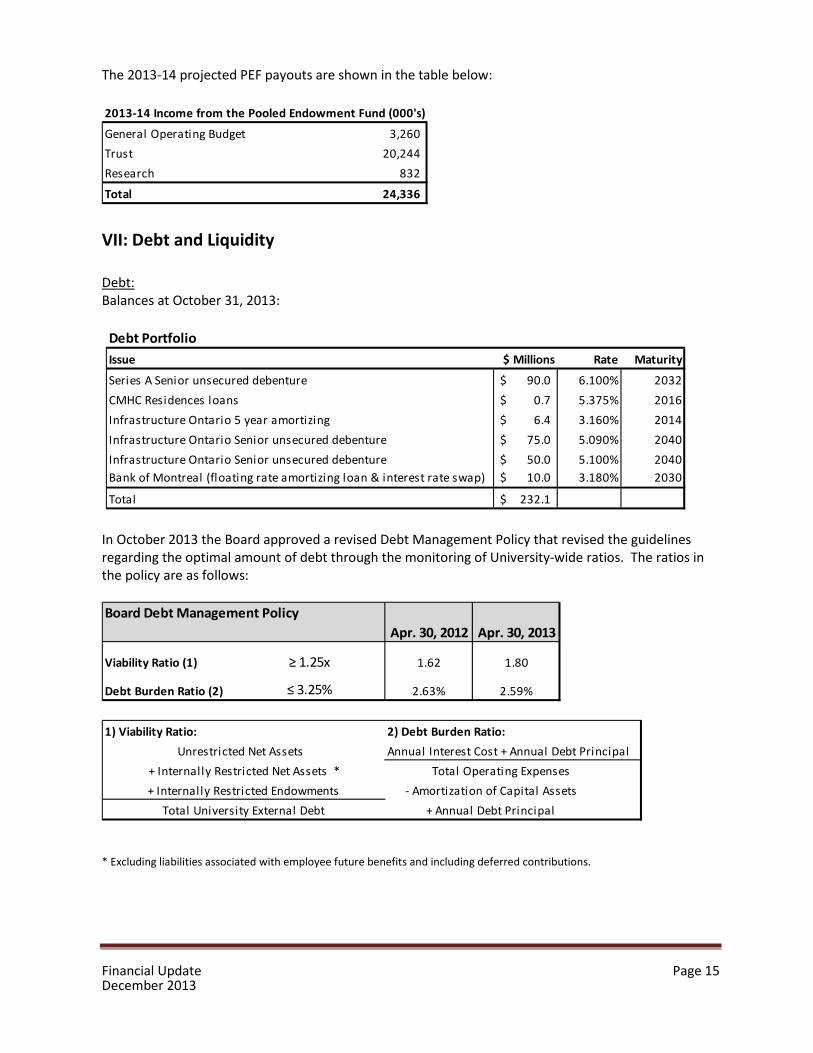
Debt: Balances at October 31, 2013:
Debt Portfolio Issue $ Millions Rate Maturity
Series A Senior unsecured debenture CMHC Residences loans Infrastructure Ontario 5 year amortizing Infrastructure Ontario Senior unsecured debenture Infrastructure Ontario Senior unsecured debenture Bank of Montreal (floating rate amortizing loan & interest rate swap)
$ 90.0 $ 0.7 $ 6.4 $ 75.0 $ 50.0 $ 10.0
6.100% 5.375% 3.160% 5.090% 5.100% 3.180%
2032 2016 2014 2040 2040 2030
Total $ 232.1
In October 2013 the Board approved a revised Debt Management Policy that revised the guidelines regarding the optimal amount of debt through the monitoring of University-wide ratios. The ratios in the policy are as follows:
Board Debt Management Policy Apr. 30, 2012 Apr. 30, 2013
Viability Ratio (1) ≥ 1.25x
Debt Burden Ratio (2) ≤ 3.25%
1.62
2.63%
1.80
2.59%
1) Viability Ratio: 2) Debt Burden Ratio: Unrestricted Net Assets Annual Interest Cost + Annual Debt Principal
+ Internally Restricted Net Assets * Total Operating Expenses+ Internally Restricted Endowments - Amortization of Capital Assets
Total University External Debt + Annual Debt Principal
* Excluding liabilities associated with employee future benefits and including deferred contributions.
Financial Update Page 15 December 2013
The University is within the established parameters of both the Viability Ratio and the Debt Burden Ratio.
Cash Flow: With tuition payments in September, there is always significant cash on hand in the fall and the beginning of the winter term. Cash-on-hand and short-term investments at October 31, 2013 was $134 million.
Financial Update Page 16 December 2013