financial results 1h 2016 - bank pekao · pdf file11 471 473 255 253 86 86 1q 16 2q 16...
TRANSCRIPT

FINANCIAL RESULTS 1H 2016
Warsaw, 03.08.2016
Growth in key volumes and core revenues

1
Disclaimer
This presentation (the ”Presentation”) has been prepared by Bank Polska Kasa Opieki Spółka Akcyjna („Bank”) for the clients, shareholders and financial analysts.
This presentation should not be treated as an offer or invitation to purchase any securities or financial instruments or as an advice or recommendation in respect
to such securities or financial instruments.
The presented data are only general information and does not refer to the offered by the Bank products or services. In order to take advantage of the services and
products of the Bank, one should be thoroughly familiar with the characteristics of the particular service or product, its rules, risk and legal and tax consequences
of the use of particular service or product.
The strategy presented in this presentation contains goals which are the ambition of the Management Board and do not constitute any financial results forecast.
Rights for the Presentation as a whole are entitled to the Bank. Presentation is a subject to the protection provided by the law, in particular: the Act dated on
February 4th, 1994 on Copyright and Related Rights (consolidated text in Journal. Laws of 2006, No. 90, item. 631, as amended); the Act dated on July 27th,
2001 on the Databases protection(Journal of Laws No. 128, item. 1402, as amended); the Act dated on April 16, 1993 on Combating Unfair Competition
(consolidated text in Journal of Laws of 2003 , No. 153, item 1503, as amended) and the Act dated on June 30, 2000 on Industrial Property Law (consolidated text
in Journal. Laws of 2003, No. 119, item. 1117 as amended).
This presentation may include forward looking statements, Bank’s outlook for the future, future plans and strategies or anticipated events that are not historical
facts. Since these statements are based on assumptions, expectations, projections and provisional data about future events, the content is inherently uncertain.
Factors that could cause or contribute to differences in current expectations include, but are not limited to: (i) general economic conditions, among which the
economic conditions of the business areas and the markets in which Bank and its subsidiaries operate, (ii) the performance of financial markets (iii) changes in
laws or regulations and (iv) general competitive conditions locally, regionally, nationally and/or internationally.
The Bank does not undertake to publish any updates, modifications or revisions of the information, data or statements contained herein should there be any
change in the strategy or intentions of the Bank, or should facts or events occur that affect the Bank’s strategy or intentions, unless such reporting obligations
arises under applicable laws and regulations.
Bank, nor any of its representatives shall not be responsible for any loss or damage it may arise from the use of this Presentation or of any information contained
herein or otherwise arising in connection to this Presentation.
This presentation is not for the distribution, in or into countries where the public dissemination of the information contained herein may be restricted or prohibited
by law.

2
▪ First half net profit of PLN 1 264m, +1.6% yoy; excluding banking tax PLN 1 465m, +17.8% yoy.
▪ First half core revenues +2.2% yoy, supported by Q2 acceleration +3.5% qoq.
▪ Double digit growth in key retail loans and retail deposits, + 11% yoy and +16% yoy respectively.
▪ Further improvement of NIM, +5bps qoq.
▪ Operational efficiency and effective risk management confirmed.
1H16 highlights

3
Net profit
691
573
1Q 16 2Q 16
+20.4%
- dynamic excluding impact of new banking tax; PLN 201m in H1 2016
1H 15 1H 16
1 244 1 264
+17.8%
PLNm
▪ First half net profit at PLN 1 264m, +1.6% yoy (excluding banking tax PLN 1 465m) with Q2 atPLN 691m, +20.4% qoq supported by commercial acceleration and VISA impact.
▪ ROE at 10.7% with Core Tier I at 18.1%.
+1.6%

4
1 005
1 201
1Q 16 2Q 16
+19.5%
▪ First half operating profit at PLN 2 206m +12.0% yoy, supported by good second quarter.
Gross operating profit
1 9692 206
1H 15 1H 16
+12.0%
PLNm

5
Operating incomePLNm
1 5871 533
284426
1Q 16 2Q 16
+10.8%
1 8172 013
3 1203 052
530710
1H 15 1H 16
+6.9%
3 5823 830
▪ First half core operating income up by +2.2% yoy, supported by strong Q2 results (+3.5%qoq).
▪ Total operating income after 6 months at PLN 3 830m, +6.9% yoy.
Core operating income Other
+3.5% +2.2%

6
1 0821 070
1Q 16 2Q 16
Net interest income (PLNm)
Net interest income and net interest margin
2 058 2 152
1H 15 1H 16
+1.1%
+4.5%
2,76%2,73% 2,73%
2,75%
2,80%
2Q 15 3Q 15 4Q 15 1Q 16 2Q 16
Net interest margin
▪ First half NII at PLN 2 152m, +4.5% yoy, driven by customer volumes.▪ NIM at 2.8% in Q2, +5bps qoq thanks to asset/liabilities mix improvement.

7
25 995
44 29641 851 43 828
25 264 24 695
Jun 15 Mar 16 Jun 16
48 97244 105
47 739
7 634 6 7646 752
Jun 15 Mar 16 Jun 16
Key corporate loans
Loans
+5.8%
+1.1%
Key retail loans Other retail loans
+11.0%
Other corporate loans(*)
+2.6%
(*) excl. BSB and reverse repo transactions
Retail loans (PLNm) Corporate loans (PLNm)
▪ Solid growth in both key retail lending +11.0% yoy and key corporate lending +5.8% yoy.

8
New key retail lending
▪ PLN 3.7bn in new retail loans in the second quarter driven by strong performance ofconsumer loans.
1 5001 659
1Q 16 2Q 16
1 294
2 005
1Q 16 2Q 16
+10.5%+55%
Consumer loans (PLNm) PLN mortgage loans (PLNm)

9
60 10165 362
57 586
Jun 15 Mar 16 Jun 16
Savings
-8.0%
+4.4%
Retail deposits MF
+16.1%
68 174
58 709
65 895
17 723 16 14016 338
Jun 15 Mar 16 Jun 16
+3.5%
(*) excl. SBB and repo transactions
Retail savings (PLNm) Corporate deposits (*) (PLNm)
▪ Double-digit growth in retail deposits +16.1% yoy, supported by strong quarterly performance+3.5% qoq.
▪ Corporate deposits dynamic reflecting tactical approach in safe liquidity management.
10
122 143
83
175 180
96
1Q 16 2Q 16
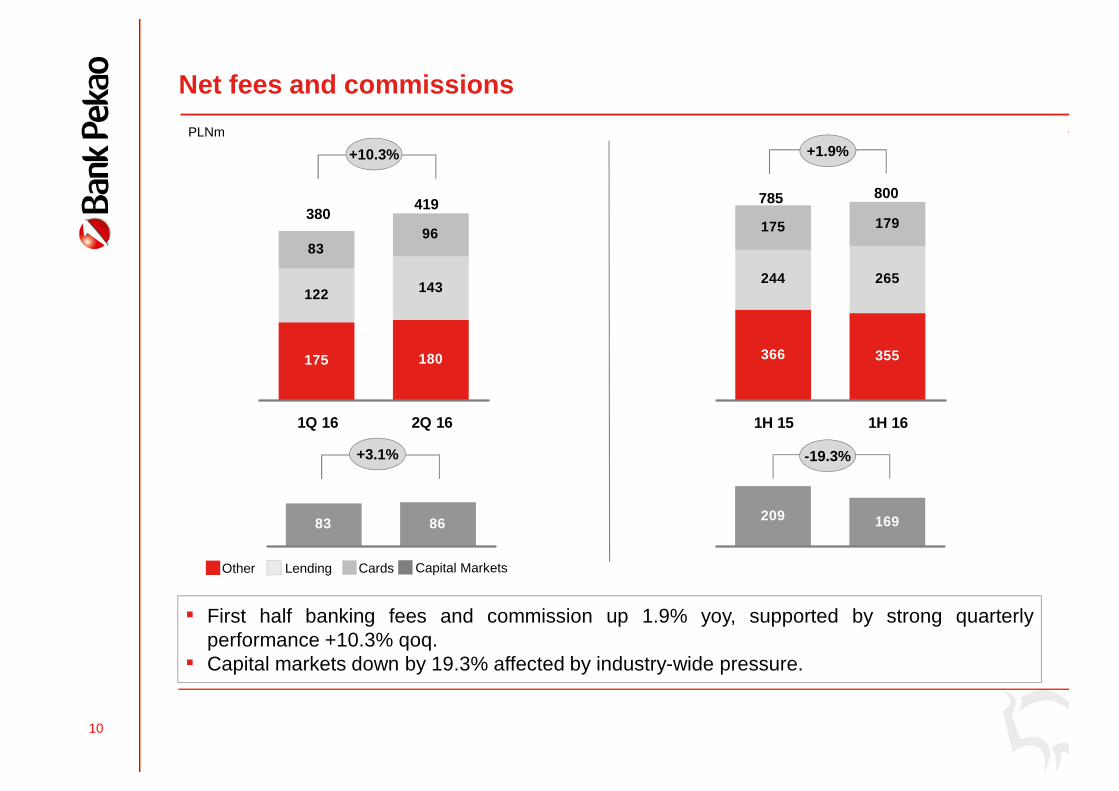
Net fees and commissions
LendingOther Cards Capital Markets
PLNm
▪ First half banking fees and commission up 1.9% yoy, supported by strong quarterlyperformance +10.3% qoq.
▪ Capital markets down by 19.3% affected by industry-wide pressure.
244 265
175
366 355
179
1H 15 1H 16
785 800
+10.3% +1.9%
380419
+3.1%
209 169
-19.3%
83 86

11
471 473
255 253
86 86
1Q 16 2Q 16
Operating costs
812
Non-personel costsPersonnel costs Depreciation
Cost
PLNm
812
952 944
496 509
165 171
1H 15 1H 16
1 613 1 624
+0.7%0.0%
960 996
BFG+ banking tax
Cost incl. BFG, banking tax
148 184
1 750 1 956
138 332
▪ First half operating costs PLN at 1 624m, +0.7% yoy, C/I at 42.4%.▪ Regulatory charges at PLN 332m.

12
2Q 15 1Q 16 2Q 16
8 425
117 517114 538109 653
7 964 8 030
Jun 15 Mar 16 Jun16
Assets quality
Provision coverage ratio
PerformingNPL NPL ratio
Jun 15 Mar 16 Jun 16
6.5%
73.8%
6.4%
Note: Performing loans excl. BSB and reverse repo transactions
Loans (PLNm)
▪ Cost of risk at 47 bp.▪ NPL ratio at 6.4%, coverage ratio at 74.2%.
7.1%
74.2%70.8%
Cost of risk
0.47%0.50% 0.47%
13
Conclusions
� First half net profit of PLN 1 264m, +1.6% yoy, supported by
strong Q2.
� Double digit growth of retail volumes and acceleration in key
corporate lending supporting sound core revenue
generation.
� Achieved results and solid commercial development, with
visible acceleration in Q2, confirm our 2016 single digit
ambition.

14
AGENDA
▪ Appendix

15
Polish economy outlook 2016
Note: Internal macroeconomic scenario
2015 2016F
GDP, % y/y 3.6 3.5
Consumption, % y/y 3.1 4.0
Investments, % y/y 5.8 2.3
Unemployment, % eop 9.8 9.0
CPI, % avg -0.9 -0.6
3M Wibor, % avg 1.72 1.70
Reference rate, % eop 1.50 1.50
Exchange rate EUR, eop 4.24 4.30
Exchange rate USD, eop 3.90 3.91
Public sector balance, % GDP -2.6 -2.9

16
Polish banking sector outlook 2016
(1) all non-mortgage retail loans
(2) Internal scenario
(3) deposits + assets in mutual funds dedicated to retail cliens
(4) assets in mutual funds dedicated to retail clients
2015 2016F(2)
Loans, % y/y 6.8 3,1
Retail, % y/y 6.6 3,7
Mortgage loans PLN 10.4 6,8
Consumer loans(1) 6.8 5,8
Corporate, % y/y 8.1 5,9
SME loans 7,0 4,0
Savings (3)
, % y/y 7,6 6,9
Deposits, % y/y 7.4 7,6
Retail, % y/y 9.4 9,9
Corporate, % y/y 10.3 8,7
Mutual Funds (4)
, % y/y 8,9 0,0

17
Polish economy trendsKey parameters (1)
TRADE BALANCE ACCOUNT (bln EUR)
GDP (% YoY) FIXED INVESTMENTS (% YoY)
PRIVATE CONSUMPTION (% YoY)
Source: Central Statistical Office; March 2007 – June 2016
7,7
1,9
0,90,1 0
0,51,8
2,63,3 3,3 3,3 3,3
3,63,1
3,44,3
33,3
5,3
54,84,94,8
4
3,6
1,5
2,1
4,2
1,92,7
5,5
7,36,9 6,9
4,93,7
2,33,3
-4
-2
0
2
4
6
8
1Q 0
72Q
07
3Q 0
74Q
07
1Q 0
82Q
08
3Q 0
84Q
08
1Q 0
92Q
09
3Q 0
94Q
09
1Q 1
02Q
10
3Q 1
04Q
101Q
112Q
11
3Q 1
14Q
11
1Q 1
22Q
12
3Q 1
24Q
12
1Q13
2Q13
3Q 1
34Q
13
1Q 1
42Q
14
3Q 1
44Q
14
1Q 1
52Q
15
3Q 1
54Q
15
1Q 1
62Q
GDP Pr Consumption contribution
Net export contribution Investment contribution
9,66,7
-0,1
-3,2
-4,9-
2,5
-3,5
-0,20,3
12,0
9,69,79,711
,85,8
4,44,4-1
,81,5
10,4
7,8
5,4
0,12,5
24,0
0,7
-9,3
-2,9
-4,7
-0,7
5,3
0,0
5,0
15,9
22,6
19,2
13,014
,5
1Q 0
72Q
07
3Q 0
74Q
07
1Q 0
82Q
08
3Q 0
84Q
08
1Q 0
92Q
09
3Q 0
94Q
09
1Q 1
02Q
10
3Q 1
04Q
10
1Q 1
12Q
11
3Q 1
14Q
11
1Q 1
22Q
12
3Q 1
24Q
12
1Q 1
32Q
13
3Q 1
34Q
13
1Q 1
42Q
14
3Q 1
44Q
14
1Q 1
52Q
15
3Q 1
54Q
15
1Q 1
62Q
2,4
2,1
0,8
0,2
0 0,2
-0,5
0,7
0,7
2,3
2,9
2,3 2,
8 3,1
3,1
3,1
3 3,2
3,8
66,4
5,96,
34,
9
6
3,2
5,8
42,
63,
6
1,7
2,7
8,2
3,1
2,6
3,7
3,6
3,3
1Q 0
72Q
07
3Q 0
74Q
07
1Q 0
82Q
08
3Q 0
84Q
08
1Q 0
92Q
09
3Q 0
94Q
09
1Q 1
02Q
10
3Q 1
04Q
10
1Q 1
12Q
11
3Q 1
14Q
11
1Q 1
22Q
12
3Q 1
24Q
12
1Q 1
32Q
13
3Q 1
34Q
13
1Q 1
42Q
14
3Q 1
44Q
14
1Q 1
52Q
15
3Q 1
54Q
15
1Q 1
62Q
-3,4-
2,8-2
,2-1
,2-1
,9-1
,10,50,3
-0,1
-0,8 -0
,4-1
,21,7
0,2-0
,91,11
,20,8
-3,3
-4,1
-2,5
-3,1
-3,5-3
,3
-2,3-2
,0
-2,1-1
,6
-6,5
-5,2
-4,1-3
,8-4
,6-5
,9
1Q 0
72Q
07
3Q 0
74Q
07
1Q 0
82Q
08
3Q 0
84Q
08
1Q 0
92Q
09
3Q 0
94Q
09
1Q 1
02Q
10
3Q 1
04Q
101Q
112Q
11
3Q 1
14Q
11
1Q 1
22Q
12
3Q 1
24Q
12
1Q 1
32Q
13
3Q 1
34Q
13
1Q 1
42Q
14
3Q 1
44Q
14
1Q 1
52Q
15
3Q 1
54Q
15
1Q 1
62Q

18
4 800,00
4 900,00
5 000,00
5 100,00
5 200,00
5 300,00
5 400,00
5 500,00
5 600,00
5 700,00
5 800,00
1Q 0
72Q
07
3Q 0
74Q
07
1Q 0
82Q
08
3Q 0
84Q
08
1Q 0
92Q
09
3Q 0
94Q
09
1Q 1
02Q
10
3Q 1
04Q
101Q
11
2Q 1
13Q
11
4Q 1
11Q
12
2Q 1
23Q
12
4Q 1
21Q
13
2Q 1
33Q
13
4Q 1
31Q
14
2Q 1
43Q
14
4Q 1
41Q
15
2Q 1
53Q
15
4Q 1
51Q
16
2Q
Polish economy trendsKey parameters (2)
UNEMPLOYMENT (%)
CORPORATE EMPLOYMENT (ths. eop)
RETAIL SALES (real terms, % YoY)
AVERAGE CORPORATE WAGES (% YoY)
5,47,8
8,99,81
0,111
,812,0
11,0
7,86,3
3,53,43,62,7
3,83,3
4,34,35,25,3
4,6
2,02,23,03,0
4,14,13,53,4
3,93,1
3,63,43,74,0
2,32,6
5,43,8
4Q 0
61Q
07
2Q 0
73Q
07
4Q 0
71Q
08
2Q 0
83Q
08
4Q 0
81Q
09
2Q 0
93Q
09
4Q 0
91Q
10
2Q 1
03Q
10
4Q10
1Q 1
12Q
11
3Q 1
14Q
11
1Q 1
22Q
12
3Q 1
24Q
12
1Q 1
32Q
13
3Q 1
34Q
13
1Q 1
42Q
14
3Q 1
44Q
14
1Q 1
52Q
15
3Q 1
54Q
15
1Q 1
62Q
16
Avg. Corporate Wages CPI
6,98,4
2,71,9-2
,00,01
,53,94,2
5,55,12,6
3,74,23,52,84,84,4
5,7
7,1
8,8
6,0
2,97,3
17,4
1,10,3
3,6
1,01,0
4,8 4,7
8,4
12,114
,012
,816
,111
,8
1Q 0
72Q
07
3Q 0
74Q
07
1Q 0
82Q
08
3Q 0
84Q
08
1Q 0
92Q
09
3Q 0
94Q
09
1Q 1
02Q
10
3Q 1
04Q
101Q
11
2Q 1
13Q
11
4Q 1
11Q
12
2Q 1
23Q
12
4Q 1
21Q
13
2Q 1
33Q
13
4Q 1
31Q
14
2Q 1
43Q
14
4Q 1
41Q
15
2Q 1
53Q
15
4Q 1
51Q
16
2Q 1
6
12,5
13,3
12,312,4
13,4
14,3
13,2
13,01
3,413,5
12,0
11,411,5
10,2
9,79,8108,8
9,4
10,9
11,6
12,3
11,2
8,9
12,1
9,511
,110
,610,9
13,0
11,7
14,3
12,4
11,5
13,3
11,9
11,8
11,5
1Q 0
72Q
07
3Q 0
74Q
07
1Q 0
82Q
08
3Q 0
84Q
08
1Q 0
92Q
09
3Q 0
94Q
09
1Q 1
02Q
10
3Q 1
04Q
101Q
11
2Q 1
13Q
11
4Q 1
11Q
12
2Q 1
23Q
12
4Q 1
21Q
13
2Q 1
33Q
13
4Q 1
31Q
14
2Q 1
43Q
14
4Q 1
41Q
15
2Q 1
53Q
15
4Q 1
51Q
16
2Q 1
6
Source: Central Statistical Office; March 2007 – June 2016

19
2,0 2,
4
3,5
4,1
3,2 3,
7
2,2
2,9
3,8
4,6
4,1 4,
64,
1
-0,7
-1,5 -0
,9 -0,7 -0,5
-0,9
-0,9
4,5 4,
8 5,0
5,8
3,5
3,5
3,5
3,5
3,5 3,
84,
54,
54,
54,
5 4,8
4,8
4,2
3,33,6
-0,3
0,30,
60,
7
0,5
1,3
2,9
3,94,
0
3,7
4,3
4,7
1,1
2,0
3,0
2,2
1,5
1,5
1,5
1,5
1,5
6,0
6,0
4,3
2,8
2,5 2,5
2,5
2,5
2,5
1,52,0
3,53,5
4,0 5,
03,
8
3,3
1,711,67
1,72
1,731,72
4,2
4,7
5,1 5,
7 6,2 6,7
6,6
5,9
4,4
4,2 4,
34,
13,
9 3,8 4,0 4,
24,
7
4,8
5,0
4,9 5,
14,
94,
1
3,4
2,7 2,7 2,
72,
72,
7
2,12,
3
1,9
1Q 0
7
2Q 0
7
3Q 0
7
4Q 0
7
1Q 0
8
2Q 0
8
3Q 0
8
4Q 0
8
1Q 0
9
2Q 0
9
3Q 0
9
4Q 0
9
1Q 1
0
2Q 1
0
3Q 1
0
4Q10
1Q 1
1
2Q 1
1
3Q 1
1
4Q 1
1
1Q 1
2
2Q 1
2
3Q 1
2
4Q 1
2
1Q 1
3
2Q 1
3
3Q 1
3
4Q 1
3
1Q 1
4
2Q 1
4
3Q 1
4
4Q 1
4
1Q 1
5
2Q 1
5
3Q 1
5
4Q 1
5
1Q 1
6
2Q 1
6
CPI
REF. RATE
3M WIBOR
Polish economy trendsKey parameters (3)
EXCHANGE RATES
INFLATION, INTEREST RATES
Source: NBP

20
8
14 13
26
3338
45
1214
1210
84
03 2 4 5 5 5 6 7 8
51 2
-4
3
14
2428
-40
19 1815 15
3 2 2 0 2
9 8 7
6 4 7
588 9
79
65
-9
1
11
21
31
41
51
4Q 0
24Q
03
4Q 0
44Q
05
4Q 0
64Q
07
4Q 0
84Q
09
4Q 1
04Q
11
1Q 1
22Q
12
3Q 1
24Q
12
1Q 1
32Q
13
3Q 1
34Q
13
1Q 1
42Q
14
3Q 1
44Q
14
1Q 1
52Q
15
3Q 1
54Q
15
1Q 1
62Q
16
Households
Corporate
Banking sector trendsKey parameters - yoy (4)
HOUSEHOLDS AND CORPORATE LENDING (% YoY) HOUSEHOLDS AND CORPORATE DEPOSITS (% YoY)
TOTAL SECTOR LENDING (% YoY) TOTAL SECTOR DEPOSITS (% YoY)
Source: NBP; December 2002 – June 2016
-2 -21
910 11
26
10
14 12 1313
89
8 6 6 5 6 79 8 9
11
2
17
4
10 1012
8
2 2
-8
-1
57
107
5
11 11 1210
8
15
9 10 9
2425 26
14
9
12
7
-9
-4
1
6
11
16
21
26
31
4Q 0
24Q
03
4Q 0
44Q
05
4Q 0
64Q
07
4Q 0
84Q
09
4Q 1
04Q
11
1Q 1
22Q
12
3Q 1
24Q
12
1Q 1
32Q
13
3Q 1
34Q
13
1Q 1
42Q
14
3Q 1
44Q
14
1Q 1
52Q
15
3Q 1
54Q
15
1Q 1
62Q
16
Households
Corporate
4 57 8 8 7
553
13
23
30
36
8 9
1413
119 9
2 4 4 45 5
-30369
121518212427303336
4Q 0
24Q
03
4Q 0
44Q
05
4Q 0
64Q
07
4Q 0
84Q
09
4Q 1
04Q
11
1Q 1
22Q
12
3Q 1
24Q
12
1Q 1
32Q
13
3Q 1
34Q
13
1Q 1
42Q
14
3Q 1
44Q
14
1Q 1
52Q
15
3Q 1
54Q
15
1Q 1
62Q
16
5
8 8 8 8 9 911
667 675
1212
99
15
3-
1010
21
15
13
8
4
-4
2
7
12
17
22
4Q 0
24Q
03
4 Q 0
44Q
05
4Q 0
64Q
07
4Q 0
84Q
09
4Q 1
04Q
11
1Q 1
22 Q
12
3Q 1
24Q
12
1Q 1
32Q
13
3Q 1
34Q
13
1Q 1
42Q
14
3 Q 1
44Q
14
1Q 1
52Q
15
3Q 1
54Q
15
1Q 1
62Q
16

21
-5%
0%
5%
10%
15%
20%
25%
30%
35%
I II III IV V VI VII VIII IX X XI XII
2007 2008 2009 20102011 2012 2013 20142015 2016
Banking sector trendsKey parameters - YTD (5)
HOUSEHOLDS LENDING (% YTD) HOUSEHOLDS DEPOSITS (% YTD)
CORPORATE DEPOSITS (% YTD)CORPORATE LENDING (% YTD)
Source: NBP; January 2007 – June 2016
-5%0%5%
10%15%20%
25%30%35%40%45%50%
XII' I II III IV V VI VII VIII IX X XI XII
2007 2008 20092010 2011 20122013 2014 20152016
-5%
0%
5%
10%
15%
20%
25%
30%
35%
XII' I II III IV V VI VII VIII IX X XI XII
2007 2008 20092010 2011 20122013 2014 20152016
-13%
-8%
-3%
2%
7%
12%
17%
XII' I II III IV V VI VII VIII IX X XI XII
2007 2008 2009 20102011 2012 2013 20142015 2016

22
Banking sector trendsNon-performing loans (6)
11,2%
7,4%
7,3%
11,4
%
11,5
%12,5
%
12,4
%
12,7
%
12,7
%
11,2
% 12,3
%
12,7
%
13,1
%
12,2
% 13,2
%
12,3
%
12,6
%13,4
%14,1%
12,4
%
9,9%
7,6%8,
2%8,8%9,
3%
9,0%9,
4%8,
4%9,1%9,
8%
9,7%
7,6%7,7%
8,7%
9,7%
9,6%
7,5%
6,6%
Mar
09
Sep
09
Mar
10
Sep
10
Mar
11
Sep
11
Mar
12
Sep
12
Mar
13
Sep
13
Mar
14
Sep
14
Dec
14
Mar
15
Jun
15
Sep
15
Dec
15
May
16
May
16
SME Corporate
CORPORATE NPL RATIO
Source: NBP
HOUSEHOLDS NPL RATIO
1,2%1,3%1,4%1,5%1,5%1,6%1,8%
1,9%2,0%2,1%2,2%2,3%2,5%2,6%2,7%2,8% 3,0%
3,0%3,1%
3,1%3,2%
3,2%
3,1%3,4%3,4%
3,3%
2,9%2,9%
2,9%
9,1%10
,0%11,3%
13,1%
14,8%15
,8%16,9%17
,2%18,0%
17,8%18
,2%
18,2%
17,8%
17,9%
17,3
%
16,1%
15,6%
14,7%
14,4
%14
,2%13
,9%12
,8%13
,0%12
,3%12
,2%12
,3%12
,4%12
,2%
2,9%
17,3%17
,8%
Mar
09
Sep
09
Mar
10
Sep
10
Mar
11
Sep
11
Mar
12
Sep
12
Mar
13
Sep
13
Mar
14
Sep
14
Mar
15
Sep
15
Mar
16
Mortgage Cash
4,5%4
,9%
6,0%
6,6%6,7%7,
2%7,
2%7,4%
7,2%7,3%
7,2%7,
5%7,
3%7,5%
7,4%7,5%
7,2%
7,1%
7,0%7,0%
6,9%
6,5%6,
8%6,
6%6,
5%6,
2%6,3%
6,2%7,
1%
Mar
09
Jun
09
Dec
09
Mar
10
Jun
10S
ep 1
0D
ec 1
0
Mar
11
Jun
11S
ep 1
1D
ec 1
1M
ar 1
2
Jun
12S
ep 1
2D
ec 1
2M
ar 1
3Ju
n 13
Sep
13
Dec
13
Mar
14
Jun
14S
ep 1
4
Dec
14
Mar
15
Jun
15S
ep 1
5D
ec 1
5
Mar
16
May
16
Total retail
11,5
%11
,5%
10,7
%11
,2%
11,3
%10
,9%
10,6%
9,8%
9,7%
9,5%
11,4
%
8,4%
9,6%
11,5
%11
,2%12
,2%
12,4
%11
,5%12
,2%
10,9
%10
,7%
10,5%
10,1
%
10,4
%11,1%11,3
%11
,7%
11,8
%11
,8%
Mar
09
Jun
09S
ep 0
9D
ec 0
9M
ar 1
0Ju
n 10
Sep
10
Dec
10
Mar
11
Jun
11S
ep 1
1D
ec 1
1M
ar 1
2Ju
n 12
Sep
12
Dec
12
Mar
13
Jun
13S
ep 1
3D
ec 1
3M
ar 1
4Ju
n 14
Sep
14
Dec
14
Mar
15
Jun
15S
ep 1
5D
ec 1
5M
ar 1
6M
ay 1
6
Total corporate

23
▪ Selected data

24
Consolidated income statement
(4) Operating cost excluding guarantee funds charges (3) Net profit attributable to equity holders of the Bank
(2) Costs excl. guarantee funds charges (1) NII and dividends and other income from equity investments
(5) ROE assuming TCR at 10%(6) NIM calculated based on average daily working assets(7) Loans excluding repo and buy-sell-back transactions, deposits includes only clients liabilities and debt issue excluding reverse repo transactions and sell–buy-back
mln PLN 2Q 15 1Q 16 2Q 16 Q/Q% Y/Y% 1H 2015 1H 2016 Y/Y %
Net interest income (1) 1 043 1 080 1 108 2,6% 6,2% 2 102 2 188 4,1%
Net fee and commission 513 463 505 9,0% -1,6% 994 968 -2,5%
Operating income 1 774 1 817 2 013 10,8% 13,5% 3 582 3 830 6,9%
Operating costs (2) -811 -812 -812 0,0% 0,1% -1 613 -1 624 0,7%
OPERATING PROFIT 963 1 005 1 201 19,5% 24,7% 1 969 2 206 12,0%
Provisions -130 -129 -131 1,4% 0,8% -267 -261 -2,5%
Guarantee funds charges -69 -67 -64 -4,3% -6,6% -138 -131 -4,7%
Banking tax 0 -81 -120 49,1% #DZIEL/0! #ARG! -201 #ARG!
PROFIT BEFORE INCOME TAX 763 729 884 21,3% 15,8% 1 539 1 612 4,8%
Income tax -144 -155 -193 24,4% 34,3% -295 -348 18,2%
GROUP NET INCOME (3) 619 573 691 20,4% 11,5% 1 244 1 264 1,6%
Cost/Income Ratio (%) (4) 45,7% 44,7% 40,3% 4,3 - 5,4 - 45,0% 42,4% 2,6 -
Cost of Risk (%) 0,50% 0,47% 0,47% 0,0 0,0 - 0,51% 0,47% 0,0 -
ROE (%) 10,3% 9,7% 11,7% 2,0 1,4 10,3% 10,7% 0,4
ROE normalised (%) (5) 15,5% 14,9% 18,4% 3,5 2,9 15,4% 16,7% 1,3
ROA (%) 1,5% 1,4% 1,5% 0,1 - 1,5% 1,5% -
TCR (%) - Basel 3 17,8% 18,4% 18,1% 0,3 - 0,3 17,8% 18,1% 0,3
NIM (%) (6) 2,76% 2,75% 2,80% 0,1 0,0 2,80% 2,80% -
L/D (%) (7) 90,7% 94,9% 93,6% 1,3 - 2,9 90,7% 93,6% 2,9
25
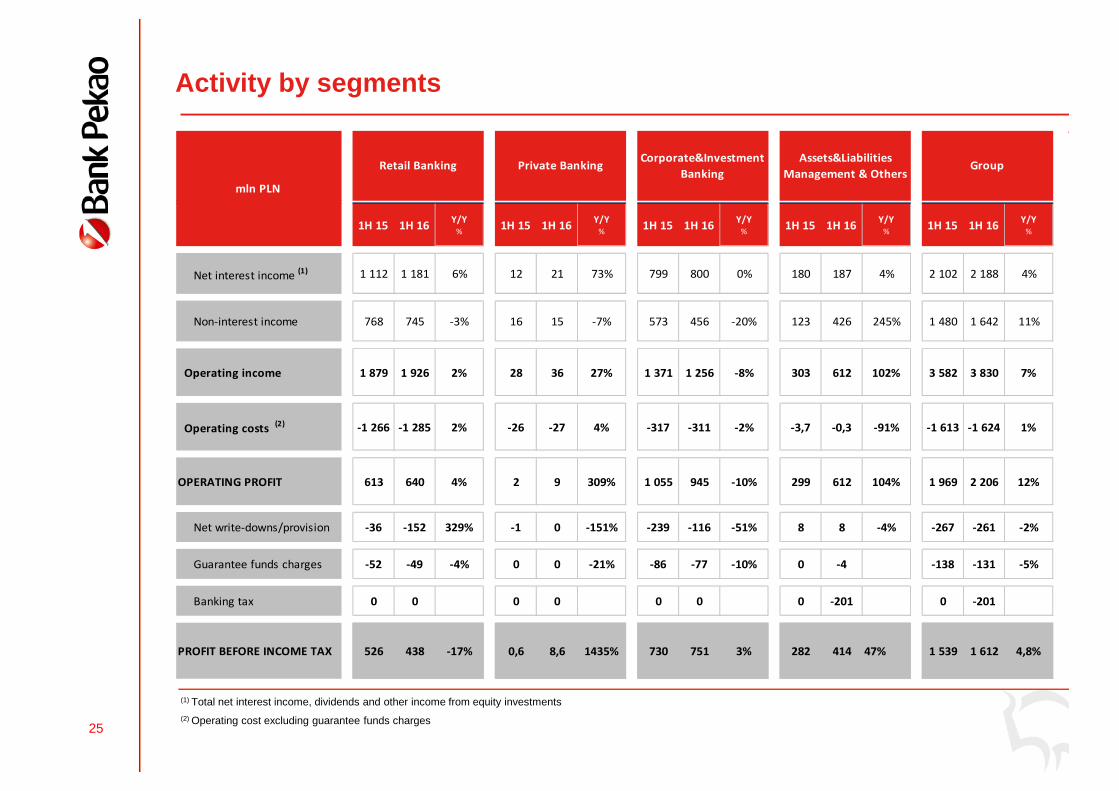
Activity by segments
(1) Total net interest income, dividends and other income from equity investments
(2) Operating cost excluding guarantee funds charges
1H 15 1H 16Y/Y
%1H 15 1H 16
Y/Y
%1H 15 1H 16
Y/Y
%1H 15 1H 16
Y/Y
%1H 15 1H 16
Y/Y
%
Net interest income (1) 1 112 1 181 6% 12 21 73% 799 800 0% 180 187 4% 2 102 2 188 4%
Non-interest income 768 745 -3% 16 15 -7% 573 456 -20% 123 426 245% 1 480 1 642 11%
Operating income 1 879 1 926 2% 28 36 27% 1 371 1 256 -8% 303 612 102% 3 582 3 830 7%
Operating costs (2) -1 266 -1 285 2% -26 -27 4% -317 -311 -2% -3,7 -0,3 -91% -1 613 -1 624 1%
OPERATING PROFIT 613 640 4% 2 9 309% 1 055 945 -10% 299 612 104% 1 969 2 206 12%
Net write-downs/provision -36 -152 329% -1 0 -151% -239 -116 -51% 8 8 -4% -267 -261 -2%
Guarantee funds charges -52 -49 -4% 0 0 -21% -86 -77 -10% 0 -4 -138 -131 -5%
Banking tax 0 0 0 0 0 0 0 -201 0 -201
PROFIT BEFORE INCOME TAX 526 438 -17% 0,6 8,6 1435% 730 751 3% 282 414 47% 1 539 1 612 4,8%
mln PLN
Retail Banking Private BankingCorporate&Investment
Banking
Assets&Liabilities
Management & OthersGroup

26
The structure of the Group net profit
(**) Group net profit attributable to equity holders of the Bank (reported)
NOTE: Data as reported
(*) Entities in liquidation, sold or indirect ownership not presented
mln PLN cumulative
Group's share in
capital % 6M 15 6M 16 Y/Y %
Bank Pekao S.A. Banking - Poland 1 348,8 1 303,9 -3,3%
Entities - consolidated under full method 121,9 53,8 -56%
of which: (*)
Pekao Leasing Sp. z o.o. Leasing 36% 18,8 18,3 -3%
Centralny Dom Maklerski Pekao S.A. Brokerage 100% 23,5 11,6 -51%
Pekao Bank Hipoteczny S.A. Mortgage Bank 100% 3,3 3,2 -3%
Pekao Pioneer PTE S.A. Pension Fund 65% 1,0 0,6 -40%
Pekao Faktoring Sp. z o.o. Factoring 100% 4,0 4,4 10%
Pekao Investment Banking S.A. Brokerage 100% 5,5 10,6 93%
Centrum Bankowości Bezpośredniej Sp. z o.o. Call Centre 100% 0,9 0,8 -11%
Pekao Financial Services Sp. z o.o. Servicing MF/PF 100% 4,1 3,8 -7%
Centrum Kart S.A. Cards 100% -0,3 0,4 -233%
Pekao Fundusz Kapitałowy Sp. z o.o. Business consulting 100% 0,1 0,2 100%
Pekao Property S.A. Real estate development 100% -0,1 -0,2 100%
FPB "MEDIA" Sp. z o.o. Real estate development 100% 0,2 0,1 -50%
Entities - valued under the equity method 30,1 19,8 -34%
Pioneer Pekao Investment Management S.A. Mutual Funds 49% 23,7 18,9 -20%
Krajowa Izba Rozliczeniowa S.A. Clearing Services 5,70% 5,5 0,0 -100%
Dom Inwestycyjny Xelion Sp. z o.o. Financial Advisory 50% 0,9 0,9 0%
Exclusions and consolidation adjustments -257,2 -114,0 -56%
Group Net Profit (**) 1 243,6 1 263,9 1,6%

27
Consolidated balance sheet
(*) Including loans and advances from customers and receivables from finance leases
mln PLN Jun 15 Mar 16 Jun 16Q/Q
%
Y/Y
%
Cash and amounts due from Central Bank 6 682 5 882 5 892 0% -12%
Loans and advances to banks 5 156 2 677 4 351 63% -16%
Loans and advances to customers* 120 814 117 237 120 247 3% 0%
Investment securities 27 362 26 615 26 613 0% -3%
Assets held for sale 63 46 50 8% -21%
Intangible assets 645 615 599 -3% -7%
Tangible fixed assets 1 484 1 429 1 409 -1% -5%
TOTAL ASSETS 170 897 159 695 166 012 4,0% -2,9%
Amounts due to the Central Bank 1 6 6 0% 566%
Amounts due to other banks 8 867 4 636 4 981 7% -44%
Financial liabilities held for trading 81 267 786 194% 872%
Amounts due to customers 125 311 121 819 126 894 4% 1%
Debt securities issued 3 980 2 354 2 085 -11% -48%
Total liabilities 148 779 135 642 143 812 6,0% -3,3%
Total Shareholders' equity 22 118 24 052 22 200 -7,7% 0,4%

28
Customers’ financing
(***) Total customers’ financing includes Loans and advances at nominal value , Securities issued by non monetary entities , reverse repo transactions and buy-sell-back
(*) Including debt securities eligible for rediscounting at Central Bank, net investments in financial leases to customers(**) Securities issued by non monetary entities including local governments
mln PLN Jun 15 Mar 16 Jun 16Q/Q
%
Y/Y
%
YTD
%
Loans* 106 697 109 635 112 525 2,6% 5,5% 2,3%
retail 51 738 54 491 55 737 2% 8% 3%
corporate 54 959 55 144 56 788 3% 3% 1%
Non quoted securities 11 178 12 511 12 623 0,9% 12,9% 2,3%
Other 515 628 612 -3% 19% 14%
Nominal value adjustment 103 282 291 3% 182% 19%
Impairment losses -5 963 -5 879 -5 954 1% 0% 2%
Net loans and advances 120 809 117 233 120 097 2% -1% -2%
Securities issues by non monetary
entities**980 869 879 1,2% -10,3% -1,5%
Reverse repo and buy-sell-back
transactions 8 278 57 149 160,9% -98,2% -96,9%
TOTAL CUSTOMERS’ FINANCING*** 127 132 123 072 126 176 3% -1% -1%

29
Selected data
(***) Pożyczka Ekspresowa (Express Loan)
(*) Number of accounts including pre-paid card accounts (**) Retail clients’ accounts
(*****) Pioneer Pekao Investment Management S.A.(******) Including: Dom Maklerski Pekao (Dom Maklerski), subsidiaryCentralny Dom Maklerski Pekao S.A. (CDM), and associated entity Dom Inwestycyjny Xelion Sp. z o.o. (Xelion)
(****) Credit Union (SKOK) Kopernik included since Dec 2014
Bank Jun 15 Mar 16 Jun 16Q/Q
%
Y/Y
%
YTD
%
Outlets 1 013 959 947 -1,3% -6,5% -2,9%
ATM's 1 789 1 750 1 754 0,2% -2,0% -0,3%
Employees 16 631 16 403 16 258 -0,9% -2,2% -0,8%
No of PLN current accounts (ths)* 5 248 5 338 5 377 0,7% 2,5% 1,2%
No of mortgage loan accounts (ths)** 299 314 319 1,4% 6,7% 2,8%
No of clients holding a consumer loan accounts (ths)*** 578 573 574 0,3% -0,6% -0,3%
Number of individuals with an access to electronic banking Pekao24 (ths) 2 788 2 955 3 019 2,2% 8,3% 4,1%
Number of individuals with an access to mobile banking (ths) 729 1 117 1 243 11,2% 70,5% 22,5%
Number of business clients (SME) with an access to electronic banking systems (ths) 243 250 252 0,8% 3,5% 1,6%
Group Jun 15 Mar 16 Jun 16Q/Q
%
Y/Y
%
YTD
%
Employees**** 18 629 18 315 18 150 -0,9% -2,6% -1,0%
Outlets**** 1 013 959 947 -1,3% -6,5% -2,9%
ATM's**** 1 789 1 750 1 754 0,2% -2,0% -0,3%
Number of MF accounts (ths)***** 894 826 810 -2,0% -9,4% -4,6%
Number of Brokerage accounts (ths)****** 350 346 345 -0,3% -1,5% -0,4%

30
Loans exposure - sectors
Note: Based on the annual Group data including current exposure and commitment
SECTOR DESCRIPTION* 31.12.2013 31.12.2014 31.12.2015 30.06.2016
Wholesale and retail trade; repair of motor vehicles and motorcycles 12,9% 14,2% 15,2% 15,2%
Public administration and defence; compulsory social security 13,0% 11,9% 10,9% 10,9%
Real estate activities 12,6% 10,4% 10,5% 12,0%
Electricity, gas, steam and air conditioning supply 8,8% 9,0% 8,6% 8,0%
Finanace and Insurance activity 5,9% 9,6% 7,8% 3,7%
Transportation and storage 6,3% 6,8% 7,2% 6,8%
Construction 5,8% 5,1% 6,3% 6,7%
Mining and quarrying 3,0% 3,9% 4,4% 3,3%
Manufacture of metals, metal products and machinery 3,8% 3,8% 4,0% 4,8%
Manufacture of beverages and food products 3,4% 3,1% 3,8% 4,0%
Manufacture of chemicals, pharmaceuticals and refined petroleum
products3,8% 2,8% 2,9% 4,5%
Information and communication 4,3% 5,0% 2,7% 2,6%
Manufacture of rubber, plastic and non-metalic products 2,3% 1,9% 2,1% 2,3%
Other manufacturing 5,4% 4,5% 5,2% 5,5%
Other sectors 8,7% 8,0% 8,4% 10,0%
Total 100% 100% 100% 100%

31
Mutual funds
Mutual funds – volumes (mln PLN )
Mutual funds - assets structure (PPIM SA)
Market share (%)
PPIM SA
Third party funds distributed by the Group
Note: Market share – funds distributed by Pekao Group, compared with the market of retail investment funds available for individuals
17 372 16 002 15 812
5 5535 266 5 364
Jun 15 Mar 16 Jun 16
17,3%17,4%18,2%
Jun 15 Mar 16 Jun 16
71%
16%
13%
Equity fundsBalance funds
Money and bonds funds
-0.4%
-7.6%
21 26722 925 21 176

32
Key lending productsStock
35 661 36 808 37 95538 729 39 538
Jun 15 Sep 15 Dec 15 Mar 16 Jun 16
9 4349 0098 9518 7088 444
Jun 15 Sep 15 Dec 15 Mar 16 Jun 16
PLN mortgage loans volumes (mln PLN) Consumer loans volumes (mln PLN)
+2.1%
+10.9% +11.7%
+4.7%

33
50,1%49,9%
Ownership structure
UniCredit GroupMinority shareholders
Before transaction After transaction
40,1%
59,9%
▪ UniCredit Group sold 10% stake on July 12th in successful accelerated book-buildingprocess, keeping after transaction controlling stake of 40.1%.

34
Ratings of Bank Pekao S.A.
FITCH RATINGS PEKAO POLAND
Long-term rating (IDR) A- A-
Short-term rating F2 F2
Viabil ity rating a-
Support rating 2
Outlook Stable Stable
S&P GLOBAL RATINGS* PEKAO POLAND
Long-term rating BBB+ BBB+
Short-term rating A-2 A-2
Stand-alone bbb+
Outlook Negative Negative
MOODY'S INVESTORS SERVICE LTDPEKAO
(unsolicited rating)POLAND
Long-term foreign-currency deposit rating A2 A2
Short-term deposit rating Prime-1 Prime-1
BCA baa1
Outlook Stable/ Negative** Negative
* On April 28, 2016, the name Standard & Poor's Ratings Services was changed to S&P Global Ratings.
** Outlook Stable on rating of liabilities in domestic currency / Negative on rating of liabilities in foreign currenciesBank Pekao S.A. has the highest viability rating assigned by Fitch Ratings, the highest Stand-Alone Credit Profile rating assigned by S&P Global Ratings, and the highest Baseline Credit Assessment as well as long- and short-term counterparty risk ratings assigned by Moody’s Investors Service.

35
Investor relations team’s contact and calendar
Dariusz ChoryłoExecutive Directorph.: +48 22 524 55 27 e-mail: [email protected]
Dorota Faszczewska-Wardph.: +48 22 524 55 30e-mail: [email protected]
Iwona Milewskaph.: +48 22 524 55 28 e-mail: [email protected]
Krzysztof Szlichci ńskiph.: +48 22 524 55 29 e-mail: [email protected]
Visit us at: www.pekao.com.plBlackout Period – two weeks period before publication of financial statements. During this period we do not organise meetings with investors and analysts
Q&A related to the presentation:
CONTACT DETAILS FINANCIAL CALENDAR
9 February 2016
26 April 2016
10 May 2016
20 July 2016
3 August 2016
27 October 2016
10 November 2016
Annual Report 2015 and Webcasting
Start of Blackout Period
First Quarter Report and Webcasting
Start of Blackout Period
Semi-annual Report and Webcasting
Start of Blackout Period
Third Quarter Report and Webcasting