financial results for the first half of 2015 - danske bank · pdf filefinancial results for...
TRANSCRIPT

22 July 2015
Thomas F. Borgen Chief Executive Officer
Financial results for the first half of 2015
Henrik Ramlau-Hansen Chief Financial Officer
2
Financial results for Q1 2013 Financial results for H1 2015
Agenda
Selected topics 7
Appendix 14
Executive summary and financial results 3
Q&A 13
Outlook for full-year 2015 12
Business unit update 5

3
Financial results for Q1 2013 Financial results for H1 2015
Executive summary for H1 2015
Net profit & ROE Net profit of DKK 9.4 bn and ROE of 12.5%
Income Total income of DKK 23.2 bn – up 6% vs H1 2014
Expenses Expenses of DKK 10.8 bn – down 2% vs H1 2014 – and cost/income ratio of 46.4%
Impairments Impairments of DKK 0.3 bn – down 78% vs H1 2014
Capital Common equity tier 1 ratio of 14.3% and total capital ratio of 18.7%
Share buy-back DKK 1.9 bn of the 5 bn share buy-back programme completed
Rating Moody’s upgrade in June to A2/P-1 and stable outlook from S&P in July
Outlook Revised guidance of net profit for 2015 of above DKK 16 bn – previously above DKK 14 bn

4
Financial results for Q1 2013 Financial results for H1 2015
Net profit: DKK 9.4 bn, up 36% from first half of 2014
Income statement & key figures (DKK m) Key points, H1 2015 vs H1 2014
Key points, Q2 2015 vs Q1 2015
• Return on equity improved to 12.5% from 9.4%
• Total income up 6%, with gains in all income lines except NII
• Expenses down 2%, with cost/income ratio of 46.4%
• Impairments down 78%
• Lending volume up 2% and deposit volume up 10%
• NII up 4%, owing partly to one-offs and mitigating effects offsetting margin pressure
• Trading and insurance income down owing to exceptionally strong Q1
• Other income up owing to one-off tax refund
• Expenses down 2%
• Net reversals in Q2: loan loss ratio of –5 bp in core activities
H1 2015 H1 2014 Index Q2 2015 Q1 2015 Index
Net interest income 10,829 10,836 100 5,516 5,313 104
Net fee income 6,134 5,207 118 3,088 3,046 101
Net trading income 4,240 4,152 102 1,525 2,715 56
Other income 866 674 128 506 360 141
Net income from insurance business 1,110 927 120 333 777 43
Total income 23,179 21,797 106 10,968 12,211 90
Expenses 10,750 11,021 98 5,313 5,437 98
Profit before loan impairment charges 12,429 10,776 115 5,655 6,774 83
Loan impairment charges 283 1,267 22 -219 502 -
Profit before tax, core 12,146 9,509 128 5,874 6,272 94
Profit before tax, Non-core 30 -794 - -60 90 -
Profit before tax 12,176 8,715 140 5,814 6,362 91
Tax 2,757 1,791 154 1,346 1,411 95
Net profit 9,419 6,924 136 4,468 4,951 90
Return on avg. shareholders' equity (%) 12.5 9.4 11.8 13.3
Cost/income ratio 46.4 50.6 48.4 44.5
Common equity tier 1 capital ratio (%) 14.3 14.4 14.3 14.0
EPS 9.2 6.9 4.4 4.9
Lending (DKK bn) 1,601 1,566 102 1,601 1,605 100
Deposits (DKK bn) 840 764 110 840 827 102

5
Financial results for Q1 2013 Financial results for H1 2015
Banking units: Strong performance vs H1 2014 at all units
Pre-tax return on allocated capital ex goodwill charge (%) Financial highlights, H1 2015 vs H1 2014
Income statement (DKK m)
Personal Banking
• Lower NII due to substantial pressure on margins • High fee income reflecting strong customer activity • Impairments down 32% as household finances improved
Business Banking
• Higher total income, with gains in all income lines • Net reversals driven by improved collateral values
C&I
• NII up because of higher volumes • Trading and fee income up on increased client activity • Impairments down owing to net reversals in Q2 C&I Business Personal
20.6
10.5
16.7
21.1
13.1 14.5
H1 2015 H1 2014
H1 2015 H1 2014 Index H1 2015 H1 2014 Index H1 2015 H1 2014 IndexNet interest income 4,728 5,343 88 4,537 4,368 104 1,363 1,288 106 Net fee income 2,734 2,186 125 1,139 1,017 112 1,156 1,033 112 Net trading income 416 318 131 442 315 140 2,973 2,212 134 Other income 340 330 103 339 266 127 2 3 88 Total income 8,218 8,177 101 6,457 5,966 108 5,494 4,535 121 Expenses 5,224 5,278 99 2,610 2,649 99 2,284 2,303 99 Profit before loan impairment charges 2,994 2,899 103 3,847 3,317 116 3,210 2,232 144 Loan impairment charges 375 553 68 -103 504 - 11 210 5 Profit before tax 2,619 2,346 112 3,950 2,813 140 3,199 2,022 158
Lending (DKK bn) 806 802 100 652 630 103 179 168 107 Deposits (DKK bn) 353 336 105 259 256 101 230 171 134
Personal Business C&I

6
Financial results for Q1 2013 Financial results for H1 2015
Danske Capital and Danica Pension: Strong performance continued in H1 2015
Danske Capital: Income statement (DKK m) Danica Pension: Income statement (DKK m)
Danica Pension: Financial highlights, H1 2015 vs H1 2014 Danske Capital: Financial highlights, H1 2015 vs H1 2014
• Result from insurance business up 1% owing to larger business volume
• Premiums of DKK 15.5 bn, up 8%
• Risk allowance booked in full for all four interest rate groups
• Shadow account balance unchanged at DKK 0.6 bn
• Total income up 12% owing to increased assets under management and a slight rise in margins
• Assets under management up 4% to DKK 803 bn vs DKK 770 bn in H1 2014
• Net sales of DKK 24 bn, with 21% to clients outside Denmark
• Danske Capital improved its positions in Norway and Sweden, with market shares of net sales increasing to over 20% and 10%, respectively
• In Q1, DKK 37 bn of assets were transferred to Danica Pension as a result of a new investment strategy in Danica
H1 2015 H1 2014 Index
Net interest income -3 1 -
Net fee income 1,150 1,023 112
- portion from performance fees 33 28 118
Other income 1 -1 -
Total income 1,148 1,023 112
Expenses 477 488 98
Profit before tax 671 535 125
Assets under management (bn) 803 770 104
H1 2015 H1 2014 Index
Premiums 15,475 14,364 108
Danica Traditionel (insurance result) 672 710 95
Unit-linked (insurance result) 300 302 99
Health and accident (ins. result) -81 -128 -
Result from insurance business 891 884 101
Return on investments 290 249 116
Financing result -29 -74 -
Special allotments -42 -51 -
Net income bef. postponed risk allow. 1,110 1,009 110
Change in shadow account - -82 -
Net income 1,110 927 120

7
Financial results for Q1 2013 Financial results for H1 2015
Expenses: Down 2% vs H1 2014 despite higher activity, bonuses and one-off pension charge Total expenses ex goodwill charge (DKK m) Change in expenses ex goodwill (DKK m)
90
H1 2015 10,750
Other costs 59
Depreciation, tangibles
122
Office expenses 171
IT 25
Severance payments
Staff costs 28
H1 2014 11,021
762
826
542
873
931 590
694
780
2014
22,641
19,810
2013
23,794
20,627
Other costs
Bonuses
Deposit scheme guarantee / bank packages
Severance payments
Consultants etc.
H1 2015
10,750
9,750
387
350 99
164

8
Financial results for Q1 2013 Financial results for H1 2015
Impairments: Loan loss ratio for Q2 of -5 bp for core activities and -4 bp for the entire Group Group impairments, 2011 to Q2 15 (DKK bn/bp) Impairments (DKK m)
* The loan loss ratio is defined as annualised impairment charges as a percentage of loans and guarantees.
Loan loss ratio, annualised (bp)
-4
26
99
59
-10
0
10
20
30
40
50
60
70
80
90
1005.0
4.5
4.0
3.5
3.0
2.5
2.0
1.5
1.0
0.5
0.0
-0.5
Q213 Q214 Q211 Q212
8
Q215
Loan loss ratio* (rhs) Impairments H1 15 H1 14 Index Q2 15 Q1 15 Index
Personal Banking 375 553 68 130 245 53
Business Banking -103 504 - -194 91 -
C&I 11 210 5 -153 164 -
Other activities 1 - - - 1 -
Total core 283 1,267 22 -219 502 -
Non-core -137 380 - -1 -136 -
Group 146 1,647 9 -220 366 -
H1 15 H1 14 Index Q2 15 Q1 15 Index
Personal Banking 9 14 64 6 12 50
Business Banking -3 17 - -12 6 -
C&I - 8 - -13 11 -
Total core 3 14 21 -5 11 -
Non-core -89 179 - -1 -176 -
Group 2 17 12 -4 8 -

9
Financial results for Q1 2013 Financial results for H1 2015
Impairments (continued): Improved credit quality and higher collateral values result in net reversals in Q2 Individual loan impairment charges* (DKK bn)
0.9
Q414
-0.1
Q314
0.8
Q214
0.0
Q115 Q215
-0.3
-2.5
1.5
0.8
Reversal Increased New
Impairment drivers, Q2 2015 vs Q1 2015
• Impairments decreased at all business units, with lower charges at Personal Banking and net reversals at Business Banking and C&I
• The lower impairment level at Personal Banking was driven by housing price increases in major Danish cities
• Reversals at Business Banking related mainly to commercial property, where residential rental property prices improved in Copenhagen
• Impairments at C&I relate to a few individual exposures
3.1
20.0
8.2
40.9
-11%
Q414
40.9
Q314
44.5
Q214
45.7
Q215 Q115
36.3
5.1
Business Banking Non-core
Corporates & Institutions Personal Banking
Allowance account by business unit (DKK bn)
* Excludes Baltics.

10
Financial results for Q1 2013 Financial results for H1 2015
Capital: Solid capital base, CET1 ratio of 14.3%, and Non-core deleveraging reduces REA CET1 ratio, Q1 15 to Q2 15 (%) Capital highlights
• Tier 1 capital ratio and total capital ratio of 16.5 % and 18.7 %, respectively
• Effect of CRR/CRD IV on fully loaded CET1 ratio is a decline of about 1 percentage point from the Q2 2015 ratio level
• CRD IV leverage ratio: 4.2% according to the transitional rules; 3.8% fully phased-in
10
6
?
Pro forma Q4 2015 ex. growth
895
Q1 2015*
-15
Credit risk
-4
Market and CCP models
Market and CCP risk
892
Q2 2015 Optimisation incl. Non-Core approx. 5-15
FSA orders and approvals
approx. 0-5
Growth
REA, Q1 2015 to Q4 2015 (DKK bn)
Q2 2015
14.3
REA impact
0.0
Expected dividends**
0.3
Net profit
0.6
Q1 2015*
14.0
* Adjusted for change in accounting for pension schemes at Danica Pension. ** 50% dividend accrual.
Core Non-core

11
Financial results for Q1 2013 Financial results for H1 2015
Business review: New operating model for Danske Bank Northern Ireland Business review findings Our Northern Irish branch network
Beginning in January 2016, Danske Bank Northern Ireland will operate as a separate business unit
Only limited operational synergies and customer interactions with the rest of the Group
More efficient operation as a stand-alone business
Enables local management to develop and protect the franchise for the benefit of customers
Continues to benefit from group cost efficiency
Strengthens the Nordic universal bank organisation
46 branches
20 % market share by lending

12
Financial results for Q1 2013 Financial results for H1 2015
Note: This guidance is subject to uncertainty and depends on economic conditions, including developments in monetary policy at central banks.
Total income Income is expected to increase from the level in 2014
Expenses Expenses are expected to be below DKK 22 bn
Impairments Impairment charges in our core activities are expected to decline to a level significantly lower than in 2014
Non-core Non-core pre-tax result is expected at around DKK 0 million
Net profit Net profit of above DKK 16 bn
Outlook for full-year 2015: Net profit of above DKK 16 bn

13
Financial results for Q1 2013 Financial results for H1 2015
Q&A session
www.danskebank.com/ir
Press * then 1 to ask a question Press * then 2 to cancel
Press “Ask a question” in your webcast player

14
Financial results for Q1 2013 Financial results for H1 2015
Appendix
Funding, liquidity and ratings 30
Business units 15
Tax 33
Macro, credit quality and portfolio reviews 25
Special topics: NII, trading income, expenses and allowance account 20
Contact details 34

15
Financial results for Q1 2013 Financial results for H1 2015
Personal Banking: Positive momentum in fees, impairments and costs in Q2; good trend in Norway continues Income statement & key figures (DKK m) Lending volume by country,* Q1 2014 = Index 100
Profit before tax by country (DKK m)
90
100
110
120
130
Q2 2015 Q1 2015 Q4 2014 Q3 2014 Q2 2014 Q1 2014
Northern Ireland
Norway
Sweden
Finland
Denmark
* Based on local currency lending volumes. ** Includes day effect, FX effect, capital costs and off-balance-sheet items
Q2 2015
1,322
Q1 2015
1,298
Q4 2014
929
Q3 2014
1,373
Q2 2014
1,315
Denmark
Finland
Sweden
Norway
Northern Ireland
Other
Personal Banking NII bridge (DKK m)
Q2 2015 Q1 2015 IndexNet interest income 2,330 2,398 97 Net fee income 1,383 1,351 102 Net trading income 148 268 55 Other income 187 153 122 Total income 4,048 4,170 97 Expenses 2,597 2,627 99 Profit before loan impairment charges 1,451 1,543 94 Loan impairment charges 130 245 53 Profit before tax 1,322 1,298 102
Lending (DKK bn) 806 808 100 Deposits (DKK bn) 353 335 105 FTE 6,695 6,713 100
707
4,728
H1 15 Other**
7
Lending volume
4
H1 14
5,343
Deposit margin
Deposit volume
4
Lending margin
77

16
Financial results for Q1 2013 Financial results for H1 2015
Business Banking: Positive trend in income, costs and impairments in Q2; good momentum in Nordic lending Income statement & key figures (DKK m)
Profit before tax by country (DKK m)
* Based on local currency lending volumes. ** Includes day effect, FX effect, capital costs and off-balance-sheet items
Lending volume by country,* Q1 2014 = Index 100
90
100
110
120
130
Q2 2014 Q1 2014 Q2 2015 Q1 2015 Q4 2014 Q3 2014
Northern Ireland
Norway
Sweden
Finland
Denmark
Q2 2015
2,182
Q1 2015
1,769
Q4 2014
1,465
Q3 2014
1,455
Q2 2014
1,541
Denmark
Finland
Sweden
Norway
Northern Ireland
Baltics
Other
Business Banking NII bridge (DKK m)
Q2 2015 Q1 2015 IndexNet interest income 2,313 2,224 104 Net fee income 567 572 99 Net trading income 230 212 108 Other income 165 174 95 Total income 3,275 3,182 103 Expenses 1,288 1,322 97 Profit before loan impairment charges 1,988 1,860 107 Loan impairment charges -194 91 -Profit before tax 2,182 1,769 123
Lending (DKK bn) 652 644 101 Deposits (DKK bn) 259 262 99 FTE 3,065 3,115 98
143
253 33499
H1 15
4,537
Other** Deposit margin
Deposit volume
9
Lending margin
Lending volume
H1 14
4,368

17
Financial results for Q1 2013 Financial results for H1 2015
Corporates & Institutions: NII up 6%; trading income down after exceptional Q1 Income statement & key figures (DKK m) Key points, Q2 15 vs Q1 15
Income breakdown (DKK m)
Q215
2,523
Q115
2,971
Q414
2,103
Q314
2,483
Q214
2,201
General Banking Capital Markets FICC
• Profit before tax down 6% after exceptionally strong Q1
• Trading income in Q2 in line with expectations as we managed the risks from interest rate increases
• Expenses down 3%
• Impairments driven by reversals
• The expected decline in capital consumption was delayed slightly as volatile market conditions continued
Corporates & Institutions NII bridge (DKK m)
Q2 2015 Q1 2015 IndexNet interest income 703 660 106 Net fee income 580 577 100 Net trading income 1,240 1,732 72 Other income - 2 - Total income 2,523 2,971 85 Expenses 1,126 1,158 97 Profit before loan impairment charges 1,398 1,813 77 Loan impairment charges -153 164 -Profit before tax 1,551 1,649 94
Lending (DKK bn) 179 190 94 Deposits (DKK bn) 230 230 100 FTE 1,832 1,826 100
141
90 77
105 1,363
H1 15 Other** Deposit margin
Deposit volume
Lending margin
25
Lending volume
H1 14
1,288
* Based on local currency lending volumes. ** Includes day effect, FX effect, capital costs and off-balance-sheet items

18
Financial results for Q1 2013 Financial results for H1 2015
Danske Capital: AuM down 1% in Q2 because of value adjustments despite good inflow Income statement (DKK m)
Net inflow – AuM (DKK bn)
0
5
10
15 2.5
2.0
1.5
1.0
0.5
0.0
Q314
1.1%
8.5
Q214
1.0%
7.7
Q215
12.3
1.5%
Q115
1.4%
11.4
Q414
0.8%
6.2
Net inflow as % of AuM (rhs) Net inflow
Key points, Q2 15 vs Q1 15
* Retail includes Danske Invest.
159
340
288
Q115 Q414 Q314 Q214 Q215
16 Life insurance Institutions
Retail* Private Equity
AuM — customer breakdown (DKK bn)
• Non-performance-based income up 2%
• Performance fee income of DKK 19 m vs DKK 14 m in Q1 15
• Expenses down 5% because of lower staff costs
• Assets under management down 1% to DKK 803 bn
Q2 2015 Q1 2015 Index
Net interest income -1 -2 -
Net fee income 583 567 103
- portion from performance fees 19 14 136
Other income -1 2 -
Total income 581 567 102
Expenses 233 244 95
Profit before tax 349 323 108
Assets under management (bn) 803 813 99

19
Financial results for Q1 2013 Financial results for H1 2015
Q2 2015 Q1 2015 Index
Premiums 7,122 8,353 85
Danica Traditionel (insurance result) 339 333 102
Unit-linked (insurance result) 147 153 96
Health and accident (ins. result) -45 -36 -
Result from insurance business 441 450 98
Return on investments -70 360 -
Financing result -17 -12 -
Special allotments -21 -21 -
Net income bef. postponed risk allow. 333 777 43
Change in shadow account - - -
Net income 333 777 43
Danica Pension: Full risk allowance booked for all four interest rate groups; investment return down owing to volatile market Income statement (DKK m) Investment allocation for Danica Traditionel, end-Q2 15 (%)
14 11 8
7 109
16
2111
148
49 6660
65
9 10
7
High
3
Medium Low
2
New schemes
Alternative investments Credit bonds
Property Bonds
Equities
% c
han
ge in
eq
uit
ies
Percentage point change in interest rates
Possibility of booking risk allowance in 2015 (%)
-25%
25%
-1,00% 0,00% 1,00%
Full risk allowance
Partial risk allowance

20
Financial results for Q1 2013 Financial results for H1 2015
Non-core: Commercial portfolio is almost run down; REA decline owing mainly to the sale of the SME portfolio
Property pipeline and sales (No. of properties)
Key points Non-core loan portfolio, Q2 2015 (DKK bn)
Total REA (DKK bn)
• Profit before tax rose to DKK 30 m in H1 2015 compared with a loss before tax of DKK -794 m in H1 2014
• Deleveraging of the commercial portfolio is almost complete, with DKK 2 bn left in net credit exposure
• Total loans decreased DKK 12 bn since H1 2014, although exposure to Personal Banking Baltics was transferred to the book in Q1 15
• REA fell DKK 15 bn from the level in Q1 15 owing to the sale of the SME portfolio and continuing deleveraging of the portfolio
28 31 35 37 27
2130
8
75
Total
42
Conduits etc.
9
Commercial portfolio
4
1
Personal customers
(incl. Baltics)
29
Performing credit exposure
Non-performing credit exposure
Allowance account
789
523 470
908
348405626
Sold
1,423
Agreed to sale On the market
1,634
2014 2013 H1 2015
34 33 33 36
23
9 8 8
7
8
Q414
42
Q314
41
Q215
Q115
45 42
Q214
-33%
30
Non-core conduits, etc.
Non-core Banking

21
Financial results for Q1 2013 Financial results for H1 2015
Net interest income: Flat vs. H1 2014 as lending effects and repayment of the state hybrid offset deposit margin pressure Quarterly net interest income (DKK m) Changes in net interest income (DKK m)
Balance sheet items (DKK bn)
-3%
Q215
5,516
Q115
5,313
Q414
5,742
Q314
5,735
Q214
5,681
271
355
288
H1 15 10,829
Other* 94
State hybrid
Deposit margin 1,118
Deposit volume 103
Lending margin
Lending volume
H1 14 10,836
840
820
800
780
760
0
1,610
1,600
1,590
1,580
1,570
0
Q215 Q115 Q414 Q314 Q214
Deposits (rhs) Loans and advances
* Contains FX effect, hold-to-maturity portfolio and a DKK 77 m one-off income in Q2 15 related to interest on a refund of payroll tax

22
Financial results for Q1 2013 Financial results for H1 2015
Trading income: Lower customer activity in financial markets and negative value adjustments in Q2 Trading income by business unit (DKK m) Key points
Refinancing income (DKK m)
Q115
2,715
Q414
928
Q314
1,613
Q214
2,251
Q215
1,525
Personal Business C&I Other incl. Treasury • Trading income down in Q2 owing to lower customer activity in financial markets
• Income from Treasury lower because of unrealised negative value adjustments on bonds
• Personal Banking and Business Banking benefitted from DKK 141 m in refinancing fees in Q1
Q4 2014
Q1 2015
141
186
Q1 2014
148
Q4 2013
242
Q1 2013
138

23
Financial results for Q1 2013 Financial results for H1 2015
Expenses: Down 2% because of continued cost focus and lower bonuses in Q2
Change in expenses ex goodwill (DKK m) Total expenses ex goodwill charge (DKK m)
82
45
Q2 2015 5,313
Other costs 41
IT
Severance payments
Bonuses 102
Staff costs ex. bonuses and severance
108
Q1 2015 5,437
Q1 15
5,437
4,867
Q4 14
6,090
5,174
Q3 14
5,530
4,861
Q2 14
5,589
4,921
Q2 15
5,313
4,882
Other costs
Deposit guarantee scheme/bank packages
Bonuses
Severance payments
Consultants etc.

24
Financial results for Q1 2013 Financial results for H1 2015
Allowance account: Commercial property and personal customers make up 52% of the individual allowance account
* In addition, the Group has booked DKK 5.7 bn in collective impairment charges. Note: Non-performing loans are loans in rating categories 10 and 11 against which individual impairments have been made.
Gross non-performing loans, ex Non-core (DKK bn)
1.4
Transportation
8.3
Consumer staples
7.6
Investment funds
2.6
Non-profit & associations
2.4
Materials
2.0
Industrial services etc
1.8 Construction & building products
1.5
Shipping
1.2
Consumer discretionary
1.0
Agriculture
0.4
Commercial property
0.3
Personal customers
0.2
Other
Individual allowance account by industry* (DKK bn)
9 9 11 11 11
19 19 19 19 18
31 31 29 3027
60
Q215
56
Q115
59
Q414
58
Q314
60
Q214
Net exposure, Not in default
Individual allowance account
Net exposure, In default
25
Financial results for Q1 2013 Financial results for H1 2015
90
100
110
120
130
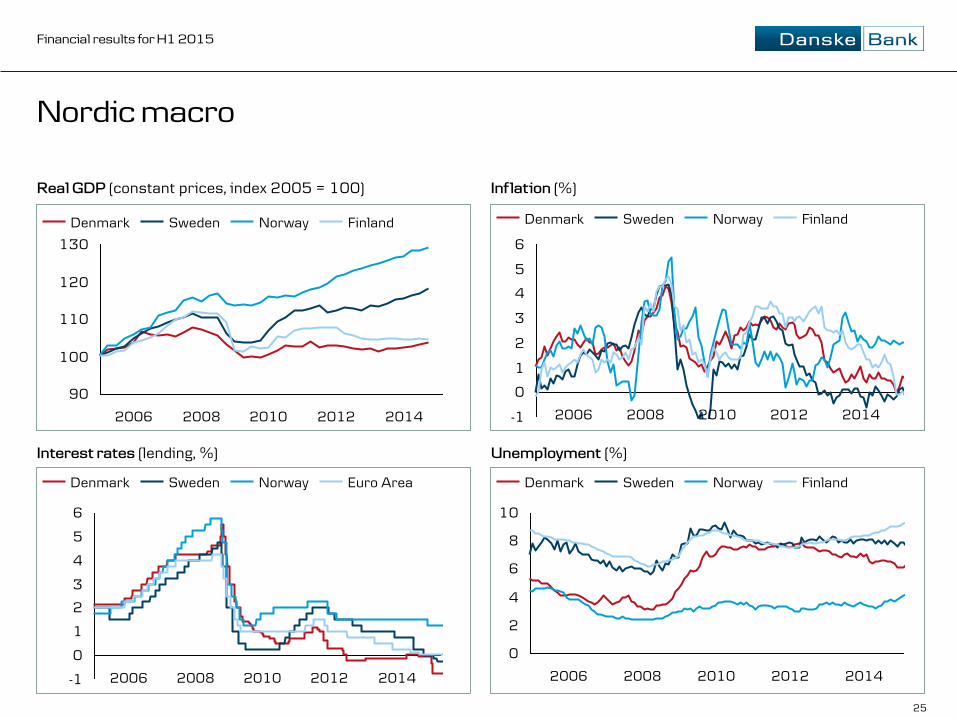
Nordic macro
Real GDP (constant prices, index 2005 = 100) Inflation (%)
Interest rates (lending, %) Unemployment (%)
2014 2008 2010 2006 2012
Finland Norway Sweden Denmark
0
2
4
6
8
10
2014 2012 2010 2008 2006
Finland Norway Sweden Denmark
-1
0
1
2
3
4
5
6
2014 2012 2010 2008 2006
Finland Norway Sweden Denmark
-1
0
1
2
3
4
5
6
2014 2012 2010 2008 2006
Denmark Euro Area Norway Sweden

26
Financial results for Q1 2013 Financial results for H1 2015
Nordic housing market
Apartment prices (index 2005 = 100) Apartment prices/nom. GDP (index 2005 = 100)
130
120
110
100
90
2014 2012 2010 2008 2006
Sweden Finland Norway Denmark
100
140
180
120
160
200
2010 2014 2008 2012 2006
Norway Denmark Sweden Finland
Property prices (index 2005 = 100) House prices/nom. GDP (index 2005 = 100)
2012 2006 2008
100
150
200
250
2014 2010
Sweden Denmark Finland Norway
100
2014 2006
80
180
2012
120
2008
140
160
2010
Denmark Sweden Norway Finland

27
Financial results for Q1 2013 Financial results for H1 2015
Realkredit Danmark and the Danish housing market: Portfolio overview Portfolio facts, Realkredit Danmark, end-Q2 15
Unemployment and foreclosures (%) Trend in mortgage margins, 80% LTV, owner-occupied (bp)
• Approx. 377,000 loans (residential and commercial)
• 2,131 loans in 3- and 6-month arrears
• 67 repossessed properties
• DKK 14 bn of loans with LTV ratio > 100%, including DKK 6 bn with public guarantee
• Average LTV ratio of 68%
LTV ratio at origination (legal requirement)
• Residential: max. 80%
• Commercial: max. 60%
52
68
86
101
118Adjustable rate Fixed rate All products
2011 Jan13: with amortisation Jan 13: interest-only
+ r
efin
anci
ng
fee*
+ r
efin
anci
ng
fee*
* We charge a fee of 30 bp of the bond price for refinancing of 1- and 2-year floaters and a fee of 20 bp for floaters of 3 or more years .
Stock of retail loans, Realkredit Danmark, end-Q2 15 (%)
8%
41%
26%
25%
Fixed rate interest-only
Variable rate interest-only
Fixed rate instalments
Variable rate instalments
0
5
10
0
500
1,000
1,500
No. of forced sales (rhs) 10Y swap rate
Unemployment
1997 2002 2006 2010 1993 2015

28
Financial results for Q1 2013 Financial results for H1 2015
Realkredit Danmark: Increase in fixed-rate loans driven by very low interest rates
* Based on the assumption that the portion of interest-only mortgages of new loans is unchanged and that the observed trend in customers who start to amortise at the end of the IO period continues.
Expected trend in RD portfolio* (%)
Loan portfolio, FlexLån F1 and F2 (DKK bn)
191160
130109 99 8090
-58%
Q1 15
Q4 14
Q3 14
107
Q2 14
Q1 14
111
Q4 13
Q3 13
161
Q2 13
Q1 13
169
Q4 12
Q2 15
Key points
• Trend away from short-term Flexlån® continued in Q2 2015
• The share of total new mortgages represented by fixed-rate instalment loans increased to 57% in Q2 2015 from 36% in Q2 2014
• Since end-Q4 2012, the amount of Flexlån® F1 and F2 loans has been reduced by DKK 111 bn, or 58%
50 50 51 52 53 54 56
50 50 49 48 47 46 44
2020E 2019E 2018E 2017E 2016E 2015E 2014
Interest-only Amortising
29
Financial results for Q1 2013 Financial results for H1 2015
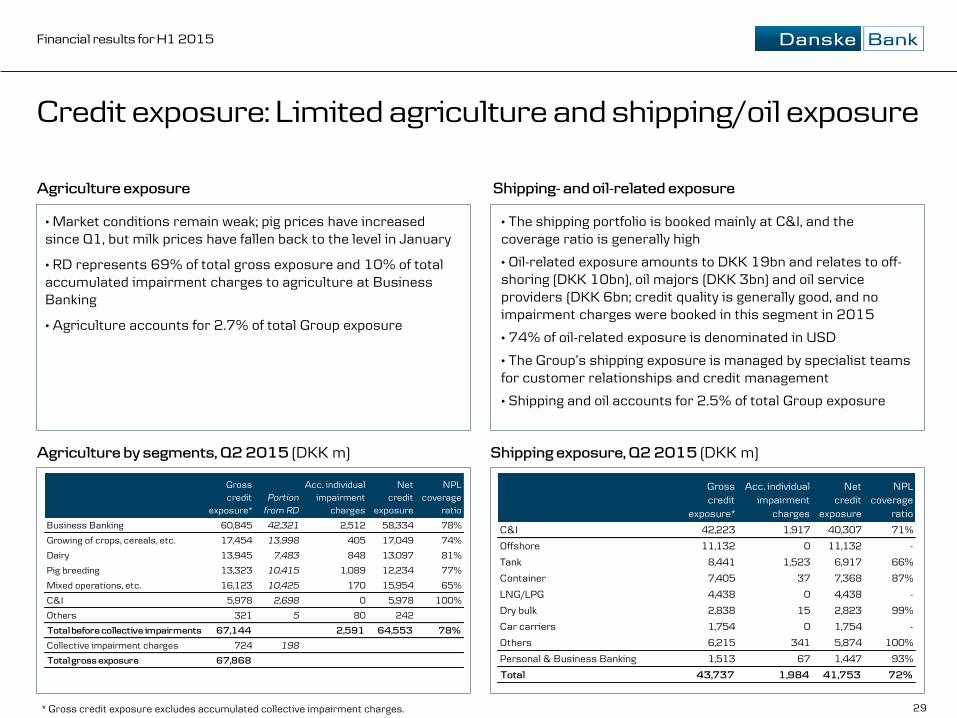
Credit exposure: Limited agriculture and shipping/oil exposure
Shipping- and oil-related exposure
Agriculture by segments, Q2 2015 (DKK m)
• Market conditions remain weak; pig prices have increased since Q1, but milk prices have fallen back to the level in January
• RD represents 69% of total gross exposure and 10% of total accumulated impairment charges to agriculture at Business Banking
• Agriculture accounts for 2.7% of total Group exposure
Shipping exposure, Q2 2015 (DKK m)
Agriculture exposure
• The shipping portfolio is booked mainly at C&I, and the coverage ratio is generally high
• Oil-related exposure amounts to DKK 19bn and relates to off-shoring (DKK 10bn), oil majors (DKK 3bn) and oil service providers (DKK 6bn; credit quality is generally good, and no impairment charges were booked in this segment in 2015
• 74% of oil-related exposure is denominated in USD
• The Group’s shipping exposure is managed by specialist teams for customer relationships and credit management
• Shipping and oil accounts for 2.5% of total Group exposure
Grosscredit
exposure*Portion
from RD
Acc. individualimpairment
charges
Netcredit
exposure
NPLcoverage
ratio
Business Banking 60,845 42,321 2,512 58,334 78%
Growing of crops, cereals, etc. 17,454 13,998 405 17,049 74%
Dairy 13,945 7,483 848 13,097 81%
Pig breeding 13,323 10,415 1,089 12,234 77%
Mixed operations, etc. 16,123 10,425 170 15,954 65%
C&I 5,978 2,698 0 5,978 100%
Others 321 5 80 242
Total before collective impairments 67,144 2,591 64,553 78%
Collective impairment charges 724 198
Total gross exposure 67,868
Grosscredit
exposure*
Acc. individualimpairment
charges
Netcredit
exposure
NPLcoverage
ratio
C&I 42,223 1,917 40,307 71%
Offshore 11,132 0 11,132 -
Tank 8,441 1,523 6,917 66%
Container 7,405 37 7,368 87%
LNG/LPG 4,438 0 4,438 -
Dry bulk 2,838 15 2,823 99%
Car carriers 1,754 0 1,754 -
Others 6,215 341 5,874 100%
Personal & Business Banking 1,513 67 1,447 93%
Total 43,737 1,984 41,753 72%
* Gross credit exposure excludes accumulated collective impairment charges.

30
Financial results for Q1 2013 Financial results for H1 2015
Funding and liquidity: 36 bn of long-term funding issued in H1; 45 bn of funding up for redemption in H2
64
39
95
73
2015E
50-70
36
2014 2013 2012 2011
Completed
Funding plan
133125 129 131 130
100
125
150
110***
Q2 15 Q1 15 Q4 14 Q3 14 Q2 14
* Spread over 3M EURIBOR. **LCR is calculated in accordance with the Danish FSA’s specifications and includes holdings of covered bonds and Danish mortgage bonds, including own issued bonds. ***Minimum requirement of the Danish FSA.
Changes in funding , 2015 (DKK bn and bp*)
Liquidity coverage ratio** (%)
Long-term funding ex RD (DKK bn)
6 52
1013
6
New H1 2015: DKK 36bn
574bp
37bp
11bp 21
Redeemed H1 2015: DKK 20bn
55bp
80bp
73bp
0
Redemptions 2015: DKK 65bn
0
62bp
107bp
51bp
33 26
Tier 1 Tier 2 Senior Cov. bonds
2018: DKK 52 bn
0
191bp
54bp
42bp
12 15
26
2017: DKK 58 bn
65bp
0
103bp
49bp
13
27
18
2016: DKK 60 bn
0 0
97bp 93bp
32 29
Maturing funding, 2016-18 (DKK bn and bp*)
Senior Tier 1 Tier 2 Cov. bonds

31
Financial results for Q1 2013 Financial results for H1 2015
Funding: Structure and sources; Danish mortgage system is fully pass-through Loan portfolio and long-term funding, Q2 15 (DKK bn)
740740
192319
840542
114
Issued RD bonds
Bank mortgages
RD mortgages
Covered bonds
Deposits Bank loans
Senior debt
Funding
1,886
Loans
1,601
Funding sources (%)
Short-term funding Long-term funding
9
2
11
6
47
18
1
6
Rep
os
CD
& C
P
Co
vere
d
bo
nd
s
Eq
uit
y
Su
bo
rd.
deb
t
Dep
osi
ts
cred
it in
st.
Dep
osi
ts
Sen
ior
u
nse
cure
d
Q2 2015 Q1 2015

32
Financial results for Q1 2013 Financial results for H1 2015
Three distinct methods of rating banks
Individual Rating/Viability Rating
Support Rating/Support Rating Floor
Issuer Default Rating (IDR)
IDR is the higher of the Viability Rating and the Support Floor
a
A-
A
(Stable)
Danske Bank’s rating
* Stand-Alone Credit Profile. ** Baseline Credit Assessment. *** Loss Given Failure.
Rating methodology
Anchor SACP*
Extraord. Support
Add. factors
Issuer Rating
+ + + = + + +
bbb+ +1 0 0 0 0 0 A
(Stable)
SACP
a-
= 1 2 3 4
1=Business Position 2=Capital & Earnings 3=Risk Position 4=Funding & Liquidity
ALAC
+1
+
Macro Profile
Quali- tative
Factors
Gov. Support
Issuer Rating + =
Strong
Plus
baa1 a1 baa2 ba1 0 +1
+ 1 2 3 4
1=Asset Risk 2=Capital 3=Profitability 4=Funding Structure 5=Liquidity Resources
BCA**
Baa1 a3
5
A2
(Stable)
+ LGF***
+1
+ + + + = Affiliate Support
0
+ +

33
Financial results for Q1 2013 Financial results for H1 2015
Tax
Tax drivers Actual and adjusted tax rates (DKK m)
• The difference between profit before tax and adjusted pre-tax profit relates mainly to previous years’ losses in Ireland
• Further, permanent non-taxable difference derives mainly from tax-exempt dividends and value adjustments of shares
Q22015 Q12015 Q42014 Q32014 Q22014
Profit before tax 5,814 6,362 -5,298 4,503 5,000
Ireland core and non-core -206 -433 434 79 87
Permanent non-taxable difference -278 20 8,969 45 -1,240
Adjusted pre-tax profit, Group 5,330 5,949 4,105 4,627 3,847
Tax according to P&L 1,346 1,411 987 1,231 953
Taxes from previous years -107 33 44 -60 -5
Adjusted tax 1,240 1,445 1,031 1,171 948
Adjusted tax rate 23.3% 24.3% 25.1% 25.3% 24.6%
Actual tax rate 23.2% 22.2% N/A 27.3% 19.1%

34
Financial results for Q1 2013 Financial results for H1 2015
Contacts
Henrik Ramlau-Hansen Direct: +45 45 14 06 66 Chief Financial Officer Mobile: +45 22 20 73 10 [email protected]
Claus Ingar Jensen Direct: +45 45 12 84 83 Head of IR Mobile: +45 25 42 43 70 [email protected]
John Bäckman Direct: +45 45 14 07 92 Chief IR Officer Mobile: +45 30 51 46 85 [email protected]
Robin Hjelgaard Løfgren Direct: +45 45 14 06 04 IR Officer Mobile: +45 24 75 15 40 [email protected]
Louisa Grue Baruch Direct: +45 45 13 92 34 IR Officer Mobile: +45 21 56 19 35 [email protected]

35
Financial results for Q1 2013 Financial results for H1 2015
Disclaimer
Important Notice
This presentation does not constitute or form part of and should not be construed as, an offer to sell or issue or the solicitation of an offer to buy or acquire securities of Danske Bank A/S in any jurisdiction, including the United States, or an inducement to enter into investment activity. No part of this presentation, nor the fact of its distribution, should form the basis of, or be relied on in connection with, any contract or commitment or investment decision whatsoever. The securities referred to herein have not been, and will not be, registered under the Securities Act of 1933, as amended (“Securities Act”), and may not be offered or sold in the United States absent registration or an applicable exemption from the registration requirements of the Securities Act. This presentation contains forward-looking statements that reflect management’s current views with respect to certain future events and potential financial performance. Although Danske Bank believes that the expectations reflected in such forward-looking statements are reasonable, no assurance can be given that such expectations will prove to have been correct. Accordingly, results could differ materially from those set out in the forward-looking statements as a result of various factors many of which are beyond Danske Bank’s control. This presentation does not imply that Danske Bank has undertaken to revise these forward-looking statements, beyond what is required by applicable law or applicable stock exchange regulations if and when circumstances arise that will lead to changes compared to the date when these statements were provided.