financial stability in the republic of belarus -2007 · publishing financial stability reviews is...
TRANSCRIPT
NATIONAL BANK OF THE REPUBLIC OF BELARUS
FINANCIAL STABILITY
IN THE REPUBLIC OF BELARUS
2007
MINSK, 2008

2
This publication was prepared by the Banking Supervision Directorate
in concert with the Monetary Policy and Economic Analysis Directorate, Banking Operations
Regulation Directorate, Monetary Operations Directorate, Balance of Payments and Banking
Statistics Directorate, and Payment System Directorate
of the National Bank of the Republic of Belarus
3
CONTENTS
INTRODUCTION
4
EXECUTIVE SUMMARY
6
CHAPTER 1. EXTERNAL AND INTERNAL MACROECONOMIC RISKS
7
CHAPTER 2. NON-FINANCIAL SECTOR
13
CHAPTER 3. FINANCIAL SECTOR
18
CHAPTER 4. FINANCIAL MARKETS
28
CHAPTER 5. PAYMENT SYSTEM
36
APPENDICES
38

4
INTRODUCTION
This publication is the first in a series of Financial Stability Reviews that the National Bank
of the Republic of Belarus is going to issue on an annual basis. Financial Stability Reviews––unlike
regular publications of the National Bank covering trends in the economy and monetary sector, as
well as the banking sector and banking supervision development––focus on the features of financial
sector risks and will constitute basic publications of the National Bank of the Republic of Belarus
on the issue in question.
The purpose of such publications is to inform the institutions concerned and the public about
the performance of the National Bank in analyzing and monitoring the financial stability in the
Republic of Belarus that is aimed at identifying systemic risks and preventing––at early stages of
development––systemic crises in the financial sector of the economy.
Publishing Financial Stability Reviews is expected to promote understanding of the risks
faced by financial intermediaries in the economic environment, alerting financial organizations and
market participants to a possible collective effect of single actions, and achieving consent on the
issue of financial stability and financial infrastructure improvement.
Besides, publications on financial stability provide persons concerned with information on
potential risks for the financial stability and the ways of overcoming them, assist financial sector
participants in assessing their own risks, and, finally, stimulate informed discussion inside the
country on the issues of financial stability.
Publications on financial stability will include sections covering external and internal
economic factors of financial stability, status of banks, non-bank financial institutions, financial
markets, and their infrastructure in the Republic of Belarus, as well as the results of scientific
research dealing with the most topical issues of ensuring financial stability.
The 2007 Financial Stability Review contains five main sections, while the basic results of
the analysis are presented in the Executive Summary.
The “External and Internal Macroeconomic Risks” Section describes the trends in the world
economy and world financial markets, and their impact on the financial stability of the Republic of
Belarus; the main trends in economic development of the Republic of Belarus; the main risk factors
determined by developments in foreign trade of the Republic of Belarus, as well as by the volume
and structure of foreign financing; national currency stability; analysis of the status of public
finances of the Republic of Belarus, and their impact on the financial stability of the Republic of
Belarus.

5
The main trends in the financial condition of enterprises, analysis of the financial capacity of
households of the Republic of Belarus, and its impact on operations of the financial sector are
presented in the “Non-financial Sector of the Economy” Section.
The “Financial Sector” and “Financial Markets” Sections contain analysis of the main trends
and risk profile of the banking sector and sector of non-bank financial organizations of the Republic
of Belarus. Particular stress in the publication is placed upon the activity of the banking sector
which is determined by its absolute dominance in the structure of the country’s financial sector.
The main risks typical of the payment system of the Republic of Belarus in 2007 and the
basic approaches of the National Bank to managing them are described in the “Payment System”
Section.
6
EXECUTIVE SUMMARY
The country’s economic development in the period under review was influenced by regional
external economic factors, which had both positive and negative impact on the environment for the
functioning of the country’s financial sector and domestic financial markets. The crises erupting in
the world financial markets in 2007 did not significantly affect financial stability in the Republic of
Belarus.
The environment for maintaining financial stability in 2007 was created by means of
maintaining high rates of domestic economic development against the background of a favorable
situation in the regional markets and increased demand for Belarusian exports in the Russian
Federation and other trading partners. Financial stability in 2007 was positively influenced by the
stability of public finances resulting from––among other things––increased state budget revenues
from foreign economic activity.
At the same time, a significant change in the terms of trade with the Russian Federation, a
sharp increase in prices for some groups of imported goods, and energy imports in particular, had a
number of negative impacts on the country’s economy and financial sector.
Increasing devaluation and inflation expectations in early 2007 led to instability in the foreign
exchange market, as well as a temporary deterioration in banking sector liquidity in 2007 QI.
Increases in aggregate domestic demand stemming from the growth of households’ money
incomes and in government spending––together with the impacts of the negative external shock––
stimulated creation of prerequisites for a rise in costs and inflation, deterioration in the current
account of the balance of payments, growth of external debt, and a heavier burden on the banking
sector.
In 2007, the financial sector of the Republic of Belarus was characterized as quite stable, the
majority of its stability indicators being within the reasonable range. However, strengthening risk
factors can have negative medium-term effects on the stability of financial sector functioning. Poor
development of the institutional structure and functional characteristics of the insurance sector and
other non-bank financial intermediaries were restraining, to a certain extent, potential development
and financial sector stability.
In spite of a number of negative impacts of external shocks, the financial markets were
functioning in a relatively stable way. The most significant internal factors adversely affecting
financial markets were the imbalances in securities market development and the limited range of
instruments used therein, as well as poor development of mechanisms of functioning of financial
markets as a whole.
In 2007, sustainable and smooth operation of the payment system was ensured.
7
CHAPTER 1. EXTERNAL AND INTERNAL MACROECONOMIC RISKS
In 2007, the development of the world economy was characterized by slowing economic
growth rates, increasing instability in international financial markets, and mounting long-
term investment risks.
In 2007, the dynamics of the aggregate output in the world economy was determined by two
main trends: the unfolding financial crisis, which had a negative impact on the rate of growth of
developed economies and accelerated growth of emerging market economies.
The worsening situation in the US domestic financial market adversely affected the
developed economies of the European Union, Japan, and Canada.
In 2007, world gross domestic product (hereinafter referred to as “GDP”)–calculated
according to the methodology used in the IMF World Economic Outlook––grew by 4.9 percent
compared to 5 percent in 2006, with the pace of economic growth in the USA, euro area countries,
Japan, and Canada slowing. GDP of this group of countries increased by 2.7 percent compared to
3 percent in 2006. The negative impact of decelerating rate of growth of developed economies on
the world economy was–to a certain extent–compensated by the growth trends in developing
economies, which grew by 7.9 percent in 2007 (Appendix 2).
Continued vigorous growth of world food and energy prices led to an increase in the general
level of inflation in the world economy. Price growth was more significant in transition and
developing economies which was the result of both the stable growth of aggregate domestic demand
and a significant share of food in the baskets of goods and services used to calculate price indices of
these countries.
Overall, the unstable situation in the major world financial markets, declining rate of world
economic development, and energy price growth predetermined the emergence of uncertainty in
relation to the world economy’s medium-term development and an increase in medium- and long-
term risks in the financial sphere.
The direct impact of instability in the world financial markets on the economy of the
Republic of Belarus was limited, but at the same time the factors associated with regional
economic development affected significantly the environment for the functioning of the
financial sector of the Republic of Belarus.
Due to the weak integration of the financial sector of the Republic of Belarus into the world
financial system, the deterioration of the world financial market situation in 2007 did not have a
significant impact on the existing conditions and structure of current account deficit financing in the
country’s balance of payments. However, the dynamics of world prices for raw materials, oil,
refined oil products, and natural gas, as well as demand for Belarusian exports in the countries-

8
major trading partners of the Republic of Belarus, notably in the Russian Federation, influenced
financial stability of the country’s economy significantly during this period.
In 2007, the Republic of Belarus was benefiting from benign foreign economic conditions
resulting from the high rates of energy and food price growth, taking advantage, to a large extent, of
rising prices in the external markets for a number of major commodities. The average dollar export
prices for oil increased by 28.5 percent, for oil products by 12.2 percent, for ferrous metals by
33.8 percent, for trucks by 31.3 percent, for lumber by 47 percent, for potash fertilizers by
21.2 percent, and for nitrogen fertilizers by 57 percent.
In this case the direct effect was ensured by a high demand for the products in the external
markets which made it possible to maintain a high level of capacity utilization of domestic
enterprises and accordingly raise the industrial output, while the indirect effect was ensured by the
increased state budget’s tax revenues and payments from foreign economic operations.
At the same time, a serious negative external shock to the Belarusian economy came in
2007 from the deteriorating terms of trade with the Russian Federation, which became evident in a
significant increase in prices for primary energy imports, changes in the terms of oil imports and oil
product exports, and import restrictions in the Russian Federation on a number of Belarusian goods
in the first half of 2007. The significant increase–by 127.1 percent–in prices for imported
intermediate goods, including increases in energy imports by 143.1 percent, gas and oil imports by
2.1 times and 134.6 percent respectively, and increasing export customs duties for oil products led
to increased costs and deteriorating financial condition of Belarusian enterprises in those industries,
which are major energy consumers.
Overall, from the point of view of financial stability, the internal economic
development of the Republic of Belarus in 2007 can be described as stable. At the same time,
some macroeconomic risks were increasing due to the growing current account deficit and
total external debt, and heavier burden on the banking system.
In 2007, the macroeconomic situation in the Republic of Belarus was characterized by high
rates of economic growth; continued business and investment activity in most industries; stable
public finances; and increased employment, households’ real money incomes, and foreign trade.
The deteriorating terms of trade with the Russian Federation (a significant energy import
price increase, changes in the terms of oil imports and oil product exports, restrictions on imports
into the Russian Federation of a number of Belarusian goods in the first half of 2007) were, to a
large extent, responsible for the increase in the current account deficit and changes in the main
characteristics of the balance of payments of the Republic of Belarus.
9
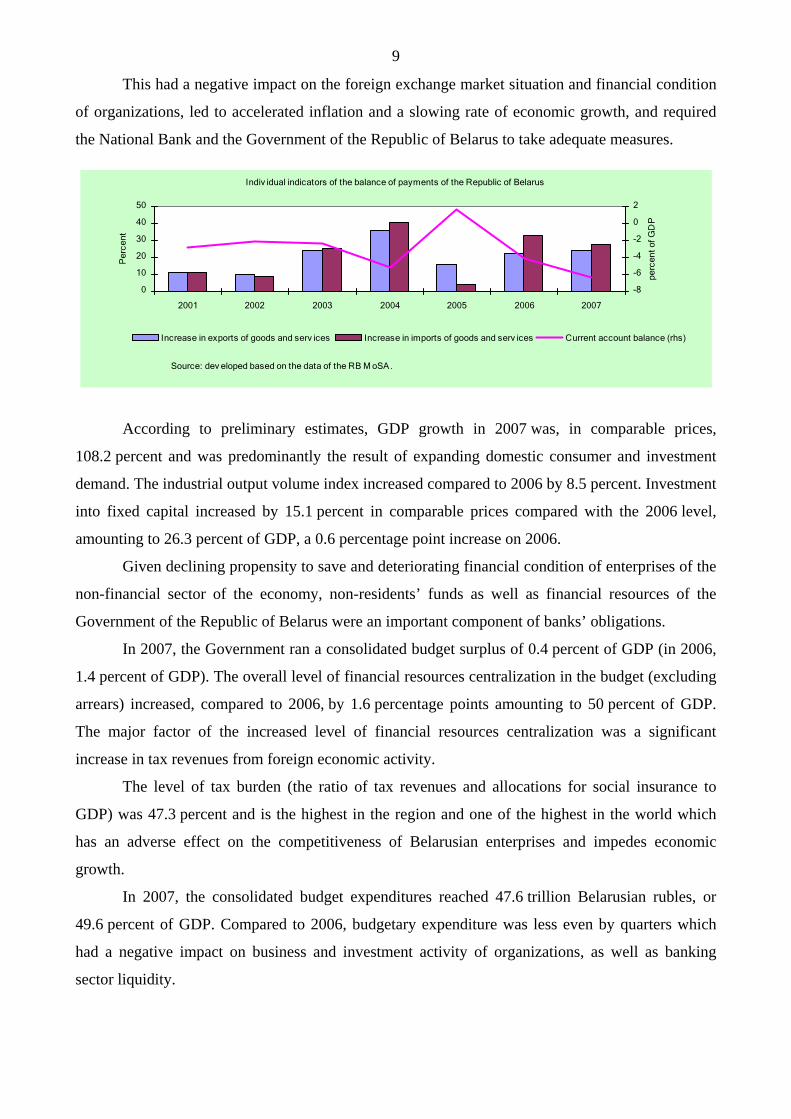
This had a negative impact on the foreign exchange market situation and financial condition
of organizations, led to accelerated inflation and a slowing rate of economic growth, and required
the National Bank and the Government of the Republic of Belarus to take adequate measures.
Indiv idual indicators of the balance of payments of the Republic of Belarus
0
10
20
30
40
50
2001 2002 2003 2004 2005 2006 2007
Per
cent
-8
-6
-4
-2
0
2
perc
ent o
f GD
P
Increase in exports of goods and serv ices Increase in imports of goods and serv ices Current account balance (rhs)
Source: dev eloped based on the data of the RB M oSA.
According to preliminary estimates, GDP growth in 2007 was, in comparable prices,
108.2 percent and was predominantly the result of expanding domestic consumer and investment
demand. The industrial output volume index increased compared to 2006 by 8.5 percent. Investment
into fixed capital increased by 15.1 percent in comparable prices compared with the 2006 level,
amounting to 26.3 percent of GDP, a 0.6 percentage point increase on 2006.
Given declining propensity to save and deteriorating financial condition of enterprises of the
non-financial sector of the economy, non-residents’ funds as well as financial resources of the
Government of the Republic of Belarus were an important component of banks’ obligations.
In 2007, the Government ran a consolidated budget surplus of 0.4 percent of GDP (in 2006,
1.4 percent of GDP). The overall level of financial resources centralization in the budget (excluding
arrears) increased, compared to 2006, by 1.6 percentage points amounting to 50 percent of GDP.
The major factor of the increased level of financial resources centralization was a significant
increase in tax revenues from foreign economic activity.
The level of tax burden (the ratio of tax revenues and allocations for social insurance to
GDP) was 47.3 percent and is the highest in the region and one of the highest in the world which
has an adverse effect on the competitiveness of Belarusian enterprises and impedes economic
growth.
In 2007, the consolidated budget expenditures reached 47.6 trillion Belarusian rubles, or
49.6 percent of GDP. Compared to 2006, budgetary expenditure was less even by quarters which
had a negative impact on business and investment activity of organizations, as well as banking
sector liquidity.

10
Indicators of public finances, percent of GD P
0
1
2
3
4
5
6
7
8
2001 2002 2003 2004 2005 2006 2007
-2,0
-1,5
-1,0
-0,5
0,0
0,5
1,0
1,5
2,0
Government domestic debt Government external debt Consolidated budget balance (rhs)
Source: developed based on the data of the RB MoF.
In spite of the consolidated budget surplus in 2007, budgetary expenditure increased by
27.5 percent compared to 2006, while nominal GDP grew by 21.2 percent which stimulated an
increase in aggregate demand, thereby spurring inflationary processes and increasing the balance of
payments’ current account deficit.
A 16.8 percent rise in the average export prices in 2007, as well as growth in the volume of
exports ensured commodity exports growth by 122.9 percent compared with the 2006 level. At the
same time, a significant hike in prices for imported intermediate goods (by 27.1 percent) and
growing domestic demand for imports in the economy of the Republic of Belarus owing to
increasing money incomes of households, government spending, and a high rate of growth of GDP
and fixed capital investment predetermined faster import growth in value terms which, in turn, led
to the increased current account deficit in the balance of payments of the Republic of Belarus.
As a result of the worsening situation with energy prices, net imports increased relative to
2006 by USD2.4 billion. There was a stable growth of non-energy imports outstripping production
development which was mainly due to the domestic economic factors, such as the need to renovate
machinery and equipment, high import intensity of production, and excess demand). As a result, the
deficit of foreign trade in goods and services amounted to USD2.7 billion, while the current account
deficit was USD2.9 billion, or 6.6 percent of GDP compared to 3.9 percent in 2006.
In 2007, the increased balance-of-payments deficit of the Republic of Belarus was
predominantly financed with the funds attracted from non-residents. A relatively low level of total
external debt at the beginning of the year, high rates of economic growth, and political stability
were conducive to attracting private foreign capital and borrowings at the level of the Government
of the Republic of Belarus.
The volume of external borrowings of enterprises of the financial and non-financial sectors
actually helped finance the balance of payments deficit. Besides, sales of state property worth
USD1.2 billion and the stabilization loan extended by the Government of the Russian Federation in
11
the amount of USD1.5 billion helped generate a surplus of the balance of payment in the amount of
USD2.8 billion, or 6.2 percent of GDP.
Increased borrowing led to the growth of total external debt, which by the end of
2007 amounted to USD12.7 billion, rising over the year from 18.4 to 28.4 percent of GDP.
In 2007, the financial condition of enterprises in the non-financial sector was deteriorating
as a result of the increase in prices for imported intermediate goods, with administrative price
regulation still in place. Expanding stocks of unsold output, decreasing own working capital, and
low profitability necessitated wider use of borrowed resources to finance current activity and capital
expenditure in the non-financial sector of the economy of the Republic of Belarus. As a result, there
was an increase in the rate of growth of enterprises’ payables and receivables, and their obligations
to banks.
The accelerated growth of energy import prices, as well as import prices for certain
groups of goods and services, world food price growth, faster growth of costs in the sector of
non-financial enterprises, as well as accelerated growth of aggregate domestic demand, and
increased tax burden pushed up inflation in the economy of the Republic of Belarus.
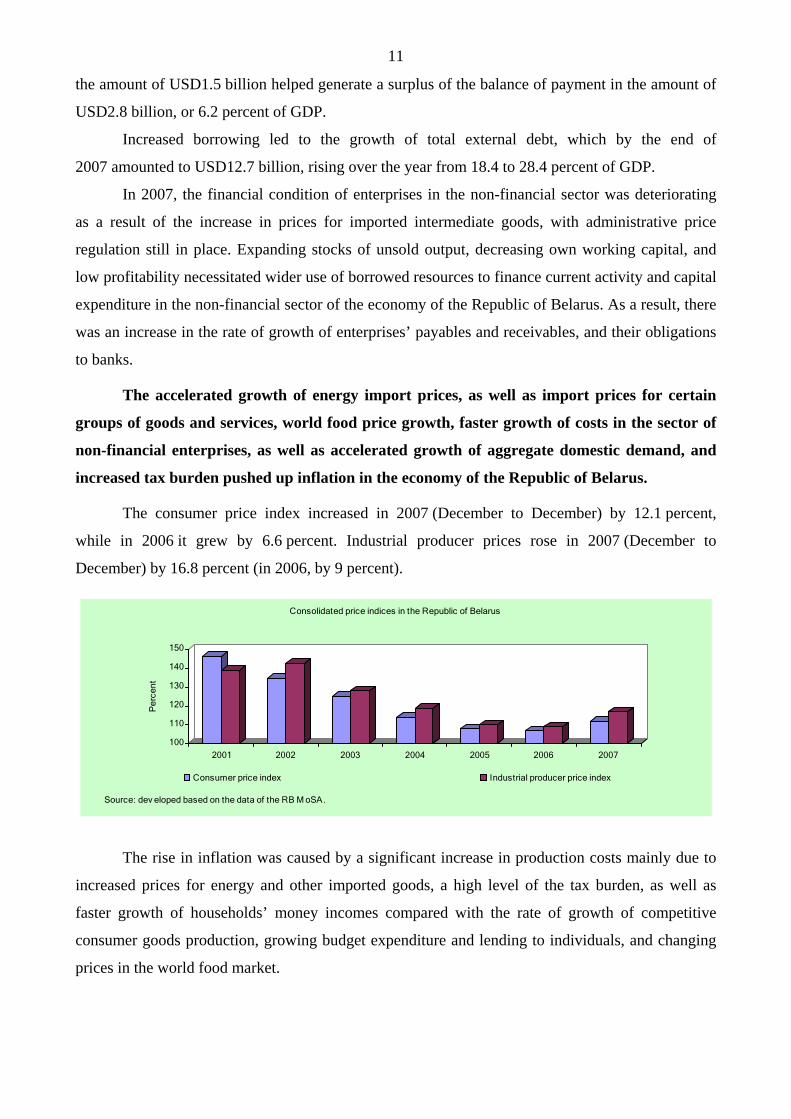
The consumer price index increased in 2007 (December to December) by 12.1 percent,
while in 2006 it grew by 6.6 percent. Industrial producer prices rose in 2007 (December to
December) by 16.8 percent (in 2006, by 9 percent).
100
110
120
130
140
150
Per
cent
2001 2002 2003 2004 2005 2006 2007
Consolidated price indices in the Republic of Belarus
Consumer price index Industrial producer price index
Source: dev eloped based on the data of the RB M oSA.
The rise in inflation was caused by a significant increase in production costs mainly due to
increased prices for energy and other imported goods, a high level of the tax burden, as well as
faster growth of households’ money incomes compared with the rate of growth of competitive
consumer goods production, growing budget expenditure and lending to individuals, and changing
prices in the world food market.
12
The average dollar import price index in 2007 amounted to 119.8 percent, 3 percentage
points higher than the growth of the average dollar export price index, while the nominal effective
Belarusian ruble exchange rate declined by 6.8 percent.
The dynamics of consumer prices was also significantly impacted by state regulation of
prices and tariffs. For example, in 2007, owing to direct administrative regulation, prices and tariffs
in the consumer market increased by 5.7 percent compared to 3.5 percent in 2006, or 47.1 percent
of the overall increase in the consumer price index.
13
CHAPTER 2. NON-FINANCIAL SECTOR OF THE ECONOMY
In 2007, the financial condition of the sector of non-financial enterprises in the
Republic of Belarus was characterized by the growth, in real terms, of sales and profits, the
reduction in the number of loss-making enterprises, and the increase in balances of economic
entities’ bank accounts.
Proceeds from sales of products, goods, works, and services of enterprises in 2007 in current
prices amounted to 203.7 trillion Belarusian rubles, up by 28 percent on a year earlier, with the
average prices in the economy growing by 12.1 percent.
Sales volumes increased owing to the favorable situation in the external market (the rise in
the average prices was responsible for a 76 percent increase in the goods export value) and the
increase in consumer and investment demand in the domestic market, which, in turn, was the result
of a significant growth of households’ real incomes (by 14.7 percent) and an increase in all sources
of capital investment financing (by 15.1 percent) in comparable prices.
2007 saw growth in real terms of all profit indicators in the economy as a whole and in a
number of its main industries. The volume of profits from sales of products increased by 2.7 percent
in real terms, profits before tax by 3.1 percent, and net profits by 2.8 percent.
A positive outcome of 2007 was the shrinking number of loss-making and uneconomic
enterprises. The share of loss-making enterprises in their total number dropped from 8.3 percent in
2006 to 6.3 percent in 2007, while the share of unprofitable ones from 24.1 to 19.9 percent. The
share of uneconomic and marginally profitable enterprises (with profitability from 0 to 5 percent) in
2007 amounted to 47.8 percent1, while in 2006 it was 50.6 percent.
In the whole of 2007, nominal volumes of economic entities’ deposits grew faster than in
2006. In the year under review, economic entities’ balances of domestic bank accounts increased by
2,779.8 billion Belarusian rubles, or by 41.2 percent in nominal terms and by 26 percent in real
terms, amounting to 9,520.3 billion Belarusian rubles as of January 1, 2008. At the same time,
during 10 months of 2007 nominal volumes of economic entities’ deposits were growing slower
than over the same period in 2006. Also, 2007 saw significant fluctuations in the dynamics of
deposits by month and by quarter.
At the same time, there were also negative trends, manifesting themselves in a reduced level
of profitability of enterprises as a whole, high rates of growth of total arrears, and a low provision of
enterprises’ with own working capital.
1 To calculate the number of loss-making enterprises, the measure of net losses is used, to calculate the number of unprofitable and marginally profitable enterprises, measures of profitability of products sold are used.

14
In 2007, compilation of financial indicators of the sector of non-financial enterprises was
characterized by a substantial increase in the average import prices of intermediate goods adversely
affecting financial indicators in industries that are principal energy consumers which, in turn, also
had a negative effect on major financial indicators in both industry and the economy as a whole.
The significant growth of import prices for intermediate goods and domestic prices for
production resources in 2007 caused a decline in sales profitability and worsened the provision of
enterprises’ with own working capital which has a negative effect on banks’ credit risks.
Financial performance of organizations
13,2
7,99,8 8,3
12,09,1 8,5
6,3
02
468
101214
Profitability of products sold Net profits to GDP Share of non-cash settlements Share of loss-makingorganizations
Per
cent
2006 2007Source: developed based on the data of the RB MoSA.
As a result of faster growth of production and sales costs, 2007 saw a decline in sales
profitability in those industries that focus on the domestic market, in particular, in communication
and construction, as well as in power, fuel, and petrochemical industries. In the economy as a
whole, sales profitability fell from 13.2 percent in 2006 to 12 percent in 2007. At the same time,
significant export price growth was responsible for profitability growth in most export-oriented
industries.
According to the Ministry of Statistics and Analysis of the Republic of Belarus, the working
capital in the whole of the economy increased in 2007 by 29.4 percent amounting to 73.2 trillion
Belarusian rubles. This notwithstanding, due to the deficit of own funding sources, 90.7 percent of
the working capital increase came from debt financing. The level of provision of own working
capital at most enterprises is extremely low. Over half of enterprises in the economy as a whole
have no own working capital or its provision is below the required level.
Given limited own working capital and declining profitability, high rates of bank
lending to organizations and increasing payables were a significant source of financing
production and commercial operations and an important factor of increasing money balances
of economic entities’ accounts.
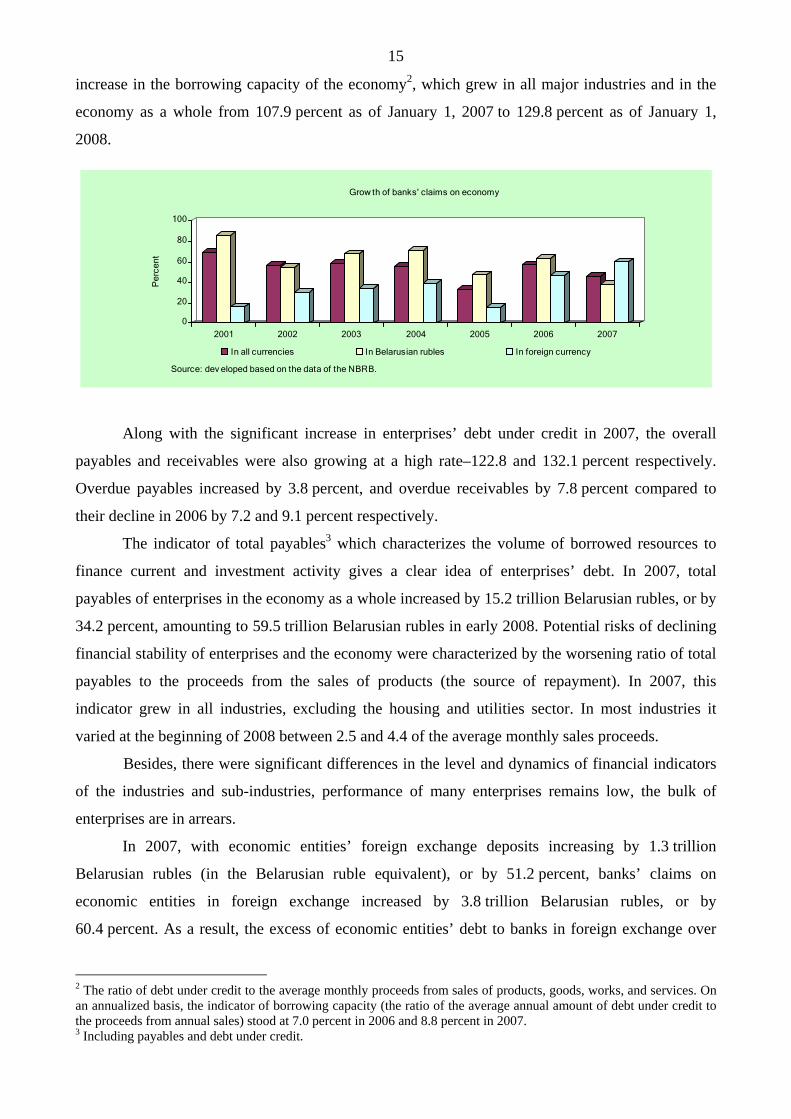
Banks’ claims on economic entities in 2007 increased by 46.1 percent, or by 7 trillion
Belarusian rubles. High rates of growth of debt under credit were also accompanied by a significant
15
increase in the borrowing capacity of the economy2, which grew in all major industries and in the
economy as a whole from 107.9 percent as of January 1, 2007 to 129.8 percent as of January 1,
2008.
0
20
40
60
80
100
Per
cent
2001 2002 2003 2004 2005 2006 2007
Grow th of banks' claims on economy
In all currencies In Belarusian rubles In foreign currency
Source: dev eloped based on the data of the NBRB.
Along with the significant increase in enterprises’ debt under credit in 2007, the overall
payables and receivables were also growing at a high rate–122.8 and 132.1 percent respectively.
Overdue payables increased by 3.8 percent, and overdue receivables by 7.8 percent compared to
their decline in 2006 by 7.2 and 9.1 percent respectively.
The indicator of total payables3 which characterizes the volume of borrowed resources to
finance current and investment activity gives a clear idea of enterprises’ debt. In 2007, total
payables of enterprises in the economy as a whole increased by 15.2 trillion Belarusian rubles, or by
34.2 percent, amounting to 59.5 trillion Belarusian rubles in early 2008. Potential risks of declining
financial stability of enterprises and the economy were characterized by the worsening ratio of total
payables to the proceeds from the sales of products (the source of repayment). In 2007, this
indicator grew in all industries, excluding the housing and utilities sector. In most industries it
varied at the beginning of 2008 between 2.5 and 4.4 of the average monthly sales proceeds.
Besides, there were significant differences in the level and dynamics of financial indicators
of the industries and sub-industries, performance of many enterprises remains low, the bulk of
enterprises are in arrears.
In 2007, with economic entities’ foreign exchange deposits increasing by 1.3 trillion
Belarusian rubles (in the Belarusian ruble equivalent), or by 51.2 percent, banks’ claims on
economic entities in foreign exchange increased by 3.8 trillion Belarusian rubles, or by
60.4 percent. As a result, the excess of economic entities’ debt to banks in foreign exchange over
2 The ratio of debt under credit to the average monthly proceeds from sales of products, goods, works, and services. On an annualized basis, the indicator of borrowing capacity (the ratio of the average annual amount of debt under credit to the proceeds from annual sales) stood at 7.0 percent in 2006 and 8.8 percent in 2007. 3 Including payables and debt under credit.

16
their foreign exchange deposits in 2007 increased to 6.2 trillion Belarusian rubles, or by
66.8 percent. The significant growth of this indicator characterizes increasing risks of default on
banks’ claims on economic entities in foreign exchange.
Vigorous growth of households’ money incomes and credit burden boosted
consumption, as well as investment, and was accompanied by declining propensity to save and
a slowing rate of growth of households’ bank deposits.
In 2007, households’ wages and money incomes continued to grow, albeit slower than in
2006. Nominal money incomes increased, compared to 2006, by 24.4 percent while consumer
prices grew by 8.4 percent (year-on-year). Per capita money incomes reached 492.8 thousand
Belarusian rubles per month, 1.8 and 2.7 times the minimum consumer budget and the subsistence
budget respectively4. Real money incomes5 in 2007 increased by 14.7 percent compared to 20066,
real disposable incomes by 14.9 percent. The share of households’ non-money incomes in GDP in
2007 was 61.4 percent compared to 59.8 percent in 2006.
Structure of households' money incomes in 2006 - 2007, percent
17.4
1.8
21.0
0.6
20.1
1.9
20.0
0.6
59.2 57.5
0
20
40
60
Other incomes Incomes from property Transfers to households Proceeds from sales ofagricultural products
Salaries and wages
2006 2007Source: developed based on the data of the RB MoSA.
The indicators of household’s income differences are at a relatively low level, increasing
slightly in 2007. The resources concentration coefficient (the Gini coefficient) increased from 0.262
in 2006 to 0.274 in 20077. Wage differential by industry persisted. For instance, in the oil refining
industry and ferrous metallurgy the average monthly wage in 2007 was approximately twice the
average wage in the economy, while in agricultural production 1.7-1.9 times below the average
wage.
The debt burden of households–the ratio of debt under credit extended by banks to natural
persons to the annual volume of money incomes–increased from 11.6 percent in 2006 to
4 At the beginning of 2007, per capita money incomes amounted to 427.1 thousand Belarusian rubles a month, or 158.3 percent of the minimum consumer budget and 246.1 percent of the subsistence budget. 5 Incomes adjusted for the consumer price index. 6 Households’ real money incomes in 2006 increased by 17.3 percent compared to 2005. 7 The Gini coefficient estimates the degree of inequality showing how evenly the analyzed indicator is distributed. The value of the Gini coefficient ranges from 0 to 1. In case of complete equality the Gini coefficient is close to zero; the higher the degree of polarization, the closer the coefficient is to one.

17
13.7 percent in 2007. To a certain degree, the increase in lending to households was caused by the
high rates of growth of housing prices in 2007 and softening requirements of banks to their
borrowers’ solvency.
From the banking point of view, the above-mentioned dynamic expansion of lending to
natural persons indicates that the diversification of bank lending in the Republic of Belarus
increased. Banks’ efforts to expand lending to natural persons are explained by the high yields of
these operations, with credit risk being relatively moderate. Fast growth of debt under credit
accompanied by a slowdown of real incomes growth and simplified lending procedures may lead to
increased risk of banks’ credit operations with the category of borrowers under consideration.
One of the substantial changes in
households’ use of money incomes is the
increase in the use of own and borrowed funds
to build apartments and houses from
4.4 percent (of the total amount of
households’ incomes) in 2006 to 6.1 percent
in 2007. Households’ demand for gold, silver,
and platinum bullion, as well as precious
stones increased. At the same time, the share
of households’ cash spent on purchasing
foreign exchange declined. In 2007, households spent USD605.3 million against USD839.1 million
in 2006 on net purchases of cash foreign exchange and payment documents in foreign exchange.
Growth of households’ aggregate consumption resulting from the growth of money incomes
and improved access to bank credit, as well as growth of households’ investments into real estate
were responsible for the declining propensity to save in 2007, which was 7.9 percent against
10.1 percent in 2006. Propensity to save, taking into account investment into housing construction,
also declined from 14.5 percent (of the total amount of households’ incomes) in 2006 to 14 percent
in 2007.
Households’ deposits in the national and foreign currencies with the banks of the Republic
of Belarus grew in 2007 by 20.6 percent in real terms, a 12.3 percentage points decrease on a year
earlier, with deposits denominated in Belarusian rubles increasing in real terms by 13.4 percent (in
2006, by 36.8 percent), foreign exchange deposits by USD600 million in the equivalent, or by
51.8 percent (in 2006, by 34.2 percent).
Increase in real money incomes and credit burden of
households of the Republic of Belarus in 2001 - 2007, percent
100
120
140
2001 2002 2003 2004 2005 2006 2007
25
50
75
Real money incomes, lhs
Credits to deposits of natural persons, rights
Source: dev eloped based on the data of the RB M oSA.
18
CHAPTER 3. FINANCIAL SECTOR OF THE ECONOMY
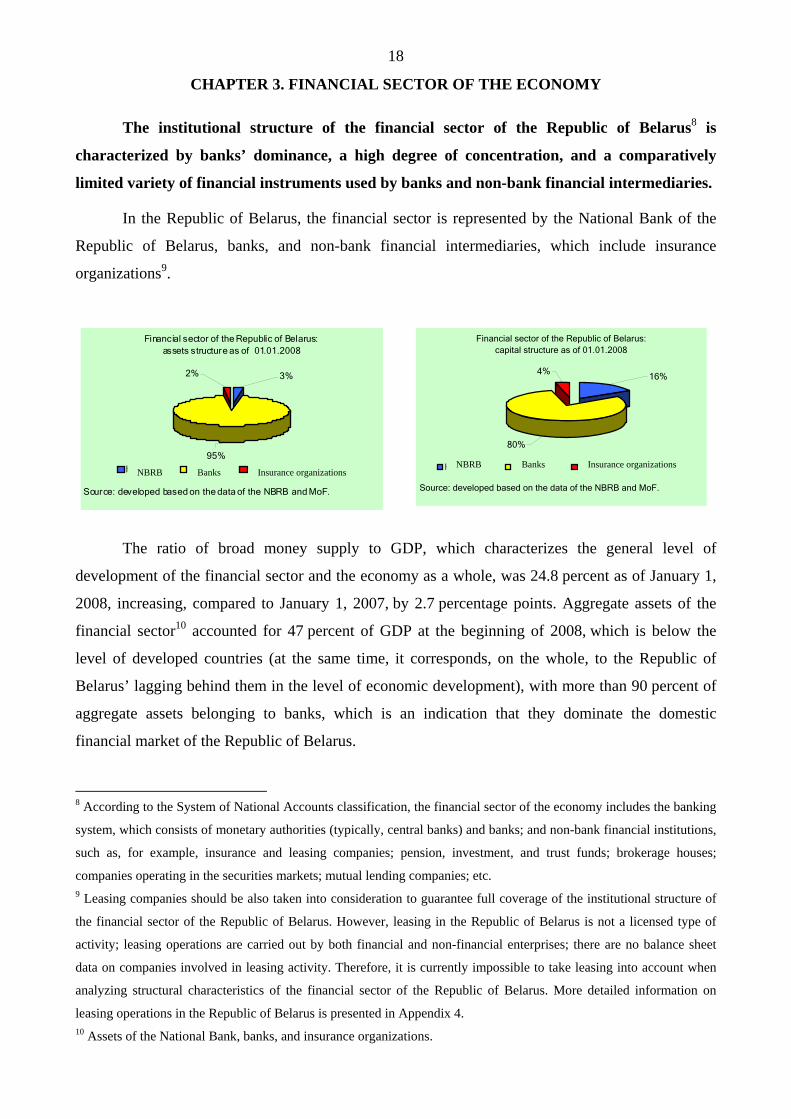
The institutional structure of the financial sector of the Republic of Belarus8 is
characterized by banks’ dominance, a high degree of concentration, and a comparatively
limited variety of financial instruments used by banks and non-bank financial intermediaries.
In the Republic of Belarus, the financial sector is represented by the National Bank of the
Republic of Belarus, banks, and non-bank financial intermediaries, which include insurance
organizations9.
The ratio of broad money supply to GDP, which characterizes the general level of
development of the financial sector and the economy as a whole, was 24.8 percent as of January 1,
2008, increasing, compared to January 1, 2007, by 2.7 percentage points. Aggregate assets of the
financial sector10 accounted for 47 percent of GDP at the beginning of 2008, which is below the
level of developed countries (at the same time, it corresponds, on the whole, to the Republic of
Belarus’ lagging behind them in the level of economic development), with more than 90 percent of
aggregate assets belonging to banks, which is an indication that they dominate the domestic
financial market of the Republic of Belarus.
8 According to the System of National Accounts classification, the financial sector of the economy includes the banking
system, which consists of monetary authorities (typically, central banks) and banks; and non-bank financial institutions,
such as, for example, insurance and leasing companies; pension, investment, and trust funds; brokerage houses;
companies operating in the securities markets; mutual lending companies; etc. 9 Leasing companies should be also taken into consideration to guarantee full coverage of the institutional structure of
the financial sector of the Republic of Belarus. However, leasing in the Republic of Belarus is not a licensed type of
activity; leasing operations are carried out by both financial and non-financial enterprises; there are no balance sheet
data on companies involved in leasing activity. Therefore, it is currently impossible to take leasing into account when
analyzing structural characteristics of the financial sector of the Republic of Belarus. More detailed information on
leasing operations in the Republic of Belarus is presented in Appendix 4. 10 Assets of the National Bank, banks, and insurance organizations.
Financial sector of the Republic of Belarus: assets structure as of 01.01.2008
95%
2% 3%
НБ РБ Банки Страховые организации
Source: developed based on the data of the NBRB and MoF.
Financial sector of the Republic of Belarus: capital structure as of 01.01.2008
4%
80%
16%
НБ РБ Банки Страховые организации
Source: developed based on the data of the NBRB and MoF.
NBRB Banks Insurance organizations NBRB Banks Insurance organizations
19
Banks perform main functions of financial intermediation in the Republic of Belarus: they
provide settlement and cash services to enterprises, organizations and households, accumulate
temporarily idle financial resources in the domestic and foreign markets, finance non-financial
sectors of the economy, and perform operations in the major domestic and foreign financial
markets.
The outstripping development of banking as a predominant type of financial intermediation
in the economy of the Republic of Belarus in the absence of institutional entities ensuring the
formation of long-term financial resources leads to mismatches between banks’ assets and liabilities
maturities, increases risks of banking and the country’s financial system as a whole, and jeopardizes
economic growth rates and well-being of the population. Due to poor development of other
segments of the financial sector, banks are able to use only basic financial instruments.
The banking sector of the Republic of Belarus is represented by universal banks, is
characterized by a significant concentration and dominance of the state in the ownership
structure.
The banking sector of the Republic of Belarus consists of 27 operating banks, of which
23 banks are banks with foreign capital participation, including seven wholly-foreign owned banks.
As of January 1, 2008, banks’ branch network included 365 branches. As at the end of
2007, six banks were given individual international ratings by Fitch, of which two were also given
ratings by Moody's Investors Service.
As of January 1, 2008, five largest banks accounted for 86 percent of assets and 84.2 percent
of capital of the banking sector (as at January 1, 2007, 87.0 and 87.3 percent respectively). As of
January 1, 2008, the Herfindahl-Hirschman index11 calculated on the basis of data about assets was
0.2265 (a decline of 0.0238 over the year), while the Gini coefficient was 0.796 (a decline of
0.022).
Currently the banking sector of the Republic of Belarus is dominated by banks with the
prevailing state stake. As of January 1, 2008, the share of government agencies and state entities in
the total authorized capital of banks was 86.3 percent, the share of non-residents 9.8 percent, and
the share of other investors 3.9 percent.
Structural indicators of profitability improved, and banks’ return on capital increased.
Investments into the banking sector together with profits earned by banks became the main
source used by banks to augment their capital. The capital of the banking sector grew in 2007 by
28.6 percent (in 2006, by 27.9 percent) amounting, as of January 1, 2008, to 6.7 trillion Belarusian 11 The Herfindahl-Hirschman index reflects the degree of concentration of the indicator. Its value ranges from 0 to 1. Value 0 corresponds to minimum concentration, less than 0.10 to a low level of concentration, from 0.10 to 0.18 to an average level of concentration, and over 0.18 to a high level of concentration.

20
rubles, with the rates of banking sector capitalization noticeably lagging behind the scope of banks’
assets operation expansion.
Total profits of the banking sector in 2007 amounted to 602 billion Belarusian rubles,
increasing by 46.5 percent compared to 2006. Operating expenses were 1,594 billion Belarusian
rubles, of which staff costs 707 billion Belarusian rubles. Taking into account net transfers to
reserves in the amount of 129 billion Belarusian rubles, profits of the banking sector before tax
amounted to 792 billion Belarusian rubles.
In the whole of 2007, banks’ return on assets (before tax) was 2.30 percent, compared with
2.39 percent in 2006; and banks’ return on capital (before tax) was 13.80 and 12.86 percent
respectively. Such an insignificant decline in return on assets in 2007 was due to the growth of
assets outstripping that of profits: while the average annual assets of the banking sector grew by
48 percent, net profit before tax increased by 42.3 percent.
Increasing profit margin, risk level, and financial leverage were beneficial to the return on
capital. At the same time, declining return on risk-weighted assets acted as a deterrent12.
The ratio of interest margin to gross income continued increasing from 38.91 percent in
2006 to 40.66 percent in 2007. One of the factors determining growth of this indicator was an
increase in banks’ lending operations. Besides, 2007 saw a decline in the ratio of non-interest
expenses to gross income and in the share of expenses on personnel in non-interest expenses. In the
whole of 2007, they amounted to 73.91 and 31.51 percent respectively, (in 2006, 74.85 and
33.23 percent).
The insurance sector of the Republic of Belarus is characterized by relatively small
volumes of capital and assets, a high degree of concentration, predominantly state ownership
and preferential treatment of state-controlled insurance organizations, and lack of proper
competition in the market of insurance services.
As of January 1, 2008, there were 23 insurance organizations in the insurance market of the
Republic of Belarus, of which 8 with the state share in their authorized capital, 9 with foreign
capital participation, and 4 organizations were offering voluntary life and additional pension
insurance. As at January 1, 2008, insurance companies’ own capital amounted to 305.6 billion
Belarusian rubles, or 0.3 percent of GDP, increasing over the year by 58 percent.
Authorized capital of insurance organizations was 174.9 billion Belarusian rubles as of
January 1, 2008, or 57.2 percent of own capital, increasing in 2007 by 72 percent predominantly
12 4 components can be identified in the structure of return on capital: profit margin, return on risk-weighted assets, risk level, and financial leverage. Profit margin is the ratio of profits (before tax) to net incomes from banking activity; return on risk-weighted assets is the ratio of net incomes from banking activity to risk-weighted assets; risk level is the ratio of risk-weighted assets to total assets; and financial leverage is the ratio of assets to capital.

21
owing to state investments. The insurance sector’s assets amounted to 836.9 billion Belarusian
rubles as of January 1, 2008, or 0.9 percent of GDP.
The Herfindahl-Hirschman index for the insurance sector calculated based on the indicator
of insurance premiums including re-insurance stood at 0.35 in 2007, while the Gini coefficient
calculated based on the same indicator was 0.87 which indicates a high level of concentration of the
insurance market in the Republic of Belarus.
In 2007, preferential treatment of state-controlled insurance organizations13, restrictions on
activity of insurance organizations with foreign capital14, as well as the state monopoly on
intermediation services in the re-insurance market reduced the ability of the insurance market to
develop dynamically and to raise capitalization of insurance organizations, the market value and
investment attractiveness of Belarusian insurance organizations for investors, above all non-
residents, and led to a rise in prices of insurance services in the Republic of Belarus. Given
anticipated growth of the extent of insurance and insurance coverage, all this creates preconditions
for declining sustainability of the insurance sector in the medium term.
In 2007, the insurance premiums received by Belarusian insurance organizations under
direct insurance and co-insurance increased by 20.5 percent, amounting to 666.1 billion Belarusian
rubles, or 0.7 percent of GDP. The share of voluntary types of insurance in the total amount of
insurance premiums received was 41.3 percent (in 2006, 37.2 percent). In the structure of voluntary
insurance premiums the share of personal insurance was 21.6 percent, property insurance
69.5 percent, and liability insurance 8.9 percent.
The share of compulsory types of insurance in the total amount of premiums was
58.7 percent (in 2006, 62.8 percent), of which personal insurance 43.6 percent of the amount of
collected compulsory insurance premiums, property insurance 4.7 percent, and liability insurance
51.7 percent. The insurance money and insurance coverage paid out in the country as a whole in
2007 amounted to 344.4 billion Belarusian rubles. In the structure of insurance payments the share
of voluntary insurance was 35.3 percent, and compulsory insurance 64.7 percent. Insurance
payments accounted for 51.7 percent of all insurance premiums received.
Unprofitability (the ratio of insurance payments to insurance premiums received) stood at
0.52 in 2007 and practically remained unchanged compared to 200615.
In 2007, all insurance organizations attained positive financial results (in 2006, 5 insurance
companies were in the red) totaling 56.4 billion Belarusian rubles in the sector as a whole. The ratio
13 Preserving their monopoly rights to engage in compulsory types of insurance. 14 Insurance organizations with a share of foreign capital exceeding 20 percent had no opportunity to engage in compulsory insurance, life insurance (cumulative types), insurance of valuable interests of state-owned enterprises and organizations, and some other types of insurance. 15 For voluntary insurance the level of unprofitability declined in 2007 from 0.50 to 0.44, while for mandatory insurance it increased from 0.55 to 0.57.

22
of insurance companies’ financials to the average annual amount of their own capital in
2007 declined by 4.6 percentage points remaining, however, at a high level (23.6 percent).
In 2007, one of the insurance organizations was given financial stability rating B by Fitch
and has a stable outlook.
Direct investment of financial institutions into other segments of the financial sector is
currently insignificant. The risk of contamination of banks and insurance organizations
through the channel of mutual participation in authorized capitals seems to be quite low.
Banks’ investments into the authorized capital of insurance organizations were about
2.2 billion Belarusian rubles as of January 1, 2008, which is equivalent to 0.05 percent of the
regulatory capital of the banking sector. The share of banks’ participation in the total authorized
capital of insurance organizations amounted to 1.2 percent. Banks’ investments into authorized
capital of organizations specializing in leasing operations amounted, according to estimates, to
3.8 billion Belarusian rubles as of January 1, 2008, which is equivalent to 0.06 percent of the
regulatory capital of the banking sector. Investments of insurance organizations into the authorized
capital of other deposit corporations, according to the National Bank, amounted to 0.6 billion
Belarusian rubles, which is equivalent to 0.2 percent of own capital of the insurance sector. The
share of insurance organizations’ participation in the total authorized capital of banks amounted to
0.01 percent.
Overall, at the end of 2007 the National Bank singled out–when supervising banking activity
on a consolidated basis–11 banks, which were head organizations of bank groups (holding
companies). The banks were dominant participants of these groups (holding companies), whilst the
share of other participants in total assets of the groups (holding companies) was insignificant.
The major risks in the banking sector in 2007 were associated with high rates of assets
growth, which significantly exceeded the rate of economic growth of the Republic of Belarus.
The rate of growth of banks’ lending operations continued increasing: the banking sector’s
assets exposed to credit risk grew from 45.7 percent in 2006 to 47.5 percent in 2007. Due to the
simultaneous increase of the share of lending operations with a high level of risk16, credit risk-
weighted assets (weighted to calculate regulatory capital adequacy) increased in 2007 by
68.3 percent compared to 42.1 percent in 2006.
As of January 1, 2008, in the structure of assets the share of banks’ claims on non-residents
of the Republic of Belarus was 6.4 percent of all assets of the banking sector (as of January 1, 2007,
3.2 percent). In the structure of the banking sector’s assets exposed to credit risk as of January 1,
16 Assets classified under Groups VI and VII according to credit risk to calculate regulatory capital adequacy.
23
2008 the largest share was accounted for by legal entities’ debt under credit (66.8 percent, a
0.5 percentage point reduction), credit to natural persons (23.6 percent, reduction by 0.4 percentage
points), and deposits placed with banks (9.6 percent, a 1.3 percentage point increase).
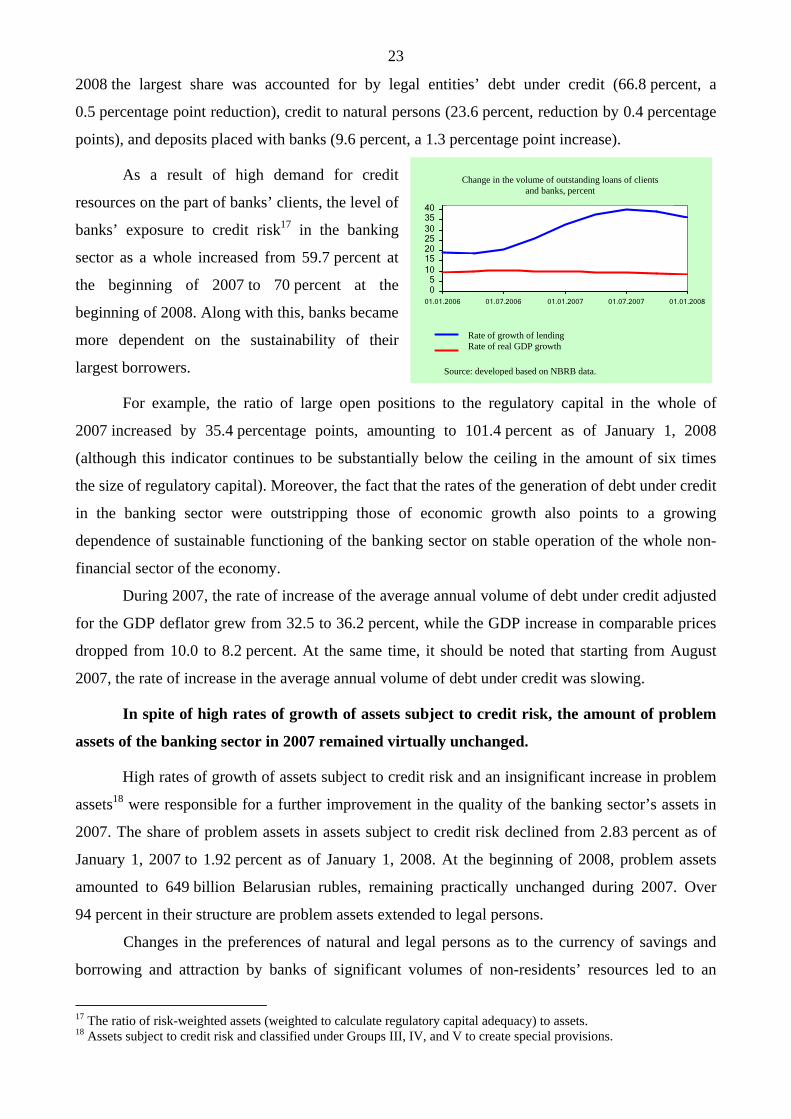
As a result of high demand for credit
resources on the part of banks’ clients, the level of
banks’ exposure to credit risk17 in the banking
sector as a whole increased from 59.7 percent at
the beginning of 2007 to 70 percent at the
beginning of 2008. Along with this, banks became
more dependent on the sustainability of their
largest borrowers.
For example, the ratio of large open positions to the regulatory capital in the whole of
2007 increased by 35.4 percentage points, amounting to 101.4 percent as of January 1, 2008
(although this indicator continues to be substantially below the ceiling in the amount of six times
the size of regulatory capital). Moreover, the fact that the rates of the generation of debt under credit
in the banking sector were outstripping those of economic growth also points to a growing
dependence of sustainable functioning of the banking sector on stable operation of the whole non-
financial sector of the economy.
During 2007, the rate of increase of the average annual volume of debt under credit adjusted
for the GDP deflator grew from 32.5 to 36.2 percent, while the GDP increase in comparable prices
dropped from 10.0 to 8.2 percent. At the same time, it should be noted that starting from August
2007, the rate of increase in the average annual volume of debt under credit was slowing.
In spite of high rates of growth of assets subject to credit risk, the amount of problem
assets of the banking sector in 2007 remained virtually unchanged.
High rates of growth of assets subject to credit risk and an insignificant increase in problem
assets18 were responsible for a further improvement in the quality of the banking sector’s assets in
2007. The share of problem assets in assets subject to credit risk declined from 2.83 percent as of
January 1, 2007 to 1.92 percent as of January 1, 2008. At the beginning of 2008, problem assets
amounted to 649 billion Belarusian rubles, remaining practically unchanged during 2007. Over
94 percent in their structure are problem assets extended to legal persons.
Changes in the preferences of natural and legal persons as to the currency of savings and
borrowing and attraction by banks of significant volumes of non-residents’ resources led to an
17 The ratio of risk-weighted assets (weighted to calculate regulatory capital adequacy) to assets. 18 Assets subject to credit risk and classified under Groups III, IV, and V to create special provisions.
Изменение объема кредитной задолженности
клиентов и банков, процентов
05
10152025303540
01.01.2006 01.07.2006 01.01.2007 01.07.2007 01.01.2008
Темп прироста объемов кредитования
Темп прироста реального ВВП
Источник: разработано на основе данных НБ РБ.
Change in the volume of outstanding loans of clients and banks, percent
Rate of growth of lending Rate of real GDP growth
Source: developed based on NBRB data.

24
increase in the share of foreign exchange components in the banking sector’s assets and liabilities,
the banking sector becoming more vulnerable to likely negative developments in the country’s
foreign exchange market.
During 2007, banks’ indebtedness to
non-residents grew by 2.4 trillion Belarusian
rubles (in the equivalent); while in 2006 they
increased by 1.1 trillion Belarusian rubles. The
rate of their increase was two times the rate of
domestic borrowing which led to the growth of
the share of non-residents’ resources in the total
volume of the banking sector’s liabilities to
12.8 percent. The resources attracted by banks
in 2007 from non-residents were predominantly short-term (subject to repayment during
12 months), while credit extended by banks to their clients in foreign exchange has longer
maturities. Given the unstable situation in international financial markets, such practice poses
increased risks to the banking sector.
The share of clients’ foreign exchange
debt under credit in the total amount of their debt
under credit increased by 3.6 percentage points
in 2007, while the share of clients’ foreign
exchange funds in all attracted deposits increased
by 2.1 percentage points. Where in 2006 assets
in Belarusian rubles subject to credit risk grew
by 61.4 percent, in 2007 they increased by
36.7 percent. And vice versa, in 2006 assets in
foreign exchange subject to credit risk grew by 25.3 percent, while 2007 saw a 65.6 percent
increase. Similar changes occurred with clients’ funds placed with banks. In 2006, their volume in
Belarusian rubles increased by 46.4 percent, in 2007 by 38.6 percent, in foreign exchange by
32.4 and 51.6 percent respectively.
The majority of foreign exchange claims of the banking sector are financial instruments
denominated in US dollars. As of January 1, 2008, their share in the total volume of claims
amounted to 57.0 percent, declining over the year by 3.2 percentage points. The share of claims in
euros increased insignificantly, reaching 32.3 percent at the beginning of 2008. There was a
Factors of change in the share of problem assets
-2
-1,5
-1
-0,5
0
0,5
1
01.01.2006 01.07.2006 01.01.2007 01.07.2007 01.01.2008
Pe
rcen
tage
poi
nts
Impact of problem assets increaseImpact of assets increaseChange in share of problem assets
Source: developed based on the NBRB data.
Ratio of foreign exchange components to total assets and liabilities, 2007
30
32
34
36
38
40
01.01.2006 01.07.2006 01.01.2007 01.07.2007 01.01.2008
Per
cent
Clients' resources Outstanding loans to clients
Source: developed based on the NBRB data.
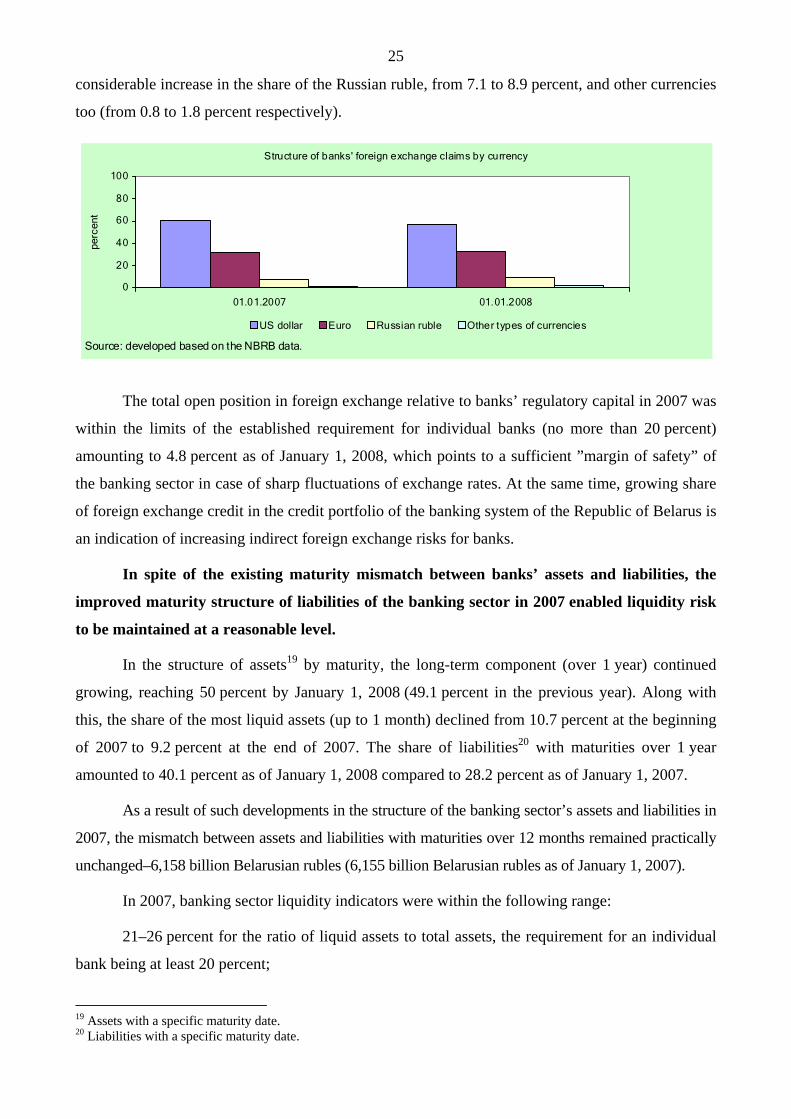
25
considerable increase in the share of the Russian ruble, from 7.1 to 8.9 percent, and other currencies
too (from 0.8 to 1.8 percent respectively).
Structure of banks' foreign exchange claims by currency
0
20
40
60
80
100
01.01.2007 01.01.2008
perc
ent
US dollar Euro Russian ruble Other types of currencies
Source: developed based on the NBRB data.
The total open position in foreign exchange relative to banks’ regulatory capital in 2007 was
within the limits of the established requirement for individual banks (no more than 20 percent)
amounting to 4.8 percent as of January 1, 2008, which points to a sufficient ”margin of safety” of
the banking sector in case of sharp fluctuations of exchange rates. At the same time, growing share
of foreign exchange credit in the credit portfolio of the banking system of the Republic of Belarus is
an indication of increasing indirect foreign exchange risks for banks.
In spite of the existing maturity mismatch between banks’ assets and liabilities, the
improved maturity structure of liabilities of the banking sector in 2007 enabled liquidity risk
to be maintained at a reasonable level.
In the structure of assets19 by maturity, the long-term component (over 1 year) continued
growing, reaching 50 percent by January 1, 2008 (49.1 percent in the previous year). Along with
this, the share of the most liquid assets (up to 1 month) declined from 10.7 percent at the beginning
of 2007 to 9.2 percent at the end of 2007. The share of liabilities20 with maturities over 1 year
amounted to 40.1 percent as of January 1, 2008 compared to 28.2 percent as of January 1, 2007.
As a result of such developments in the structure of the banking sector’s assets and liabilities in
2007, the mismatch between assets and liabilities with maturities over 12 months remained practically
unchanged–6,158 billion Belarusian rubles (6,155 billion Belarusian rubles as of January 1, 2007).
In 2007, banking sector liquidity indicators were within the following range:
21–26 percent for the ratio of liquid assets to total assets, the requirement for an individual
bank being at least 20 percent;
19 Assets with a specific maturity date. 20 Liabilities with a specific maturity date.

26
1.33–1.97 for the ratio of actual liquidity to required liquidity (short-term liquidity), the
requirement for an individual bank being at least 1;
104–152 percent for the ratio of demand assets to demand liabilities (instantaneous
liquidity), the requirement for an individual bank being at least 20 percent; and
92–112 percent for the ratio of current assets to current liabilities (current liquidity), the
requirement for an individual bank being at least 70 percent.
Banks’ capital adequacy ratios continued going down which suggests declining ability
to cover growing risks with capital.
0
50
100
150
200
Pe
rcen
t
01.01.2006 01.04.2006 01.07.2006 01.10.2006 01.01.2007 01.04.2007 01.07.2007 01.10.2007 01.01.2008
Banking sector l iquidity indicators
Liquid assets to total assets Short-term liquidity*100 Immediate liquidity Current liquidity
Source: developed based on the NBRB data.
The regulatory capital adequacy ratio in 2007 declined by 5.1 percentage points (in 2006, by
2.3 percentage points), amounting to 19.3 percent as of January 1, 2008, the requirement for an
individual bank being 8 percent. The core capital adequacy ratio in 2007 declined from 17.4 to
14 percent as of January 1, 2008 (the requirement for an individual bank being 4 percent), and the
ratio of capital to assets of the banking sector calculated based on banks’ balance sheet data fell
from 17.8 to 15.9 percent.
Banks' assets structure by maturity, as of 01.01.2008
9%13%
12%
16%
50%
Up to 1 month 1-3 months 3-6 months
6-12 months Over 12 months
Source: dev eloped based on the NBRB data.
Banks' liabilities structure by maturity, as of 01.01.2008
15%
11%
12%
22%
40%
Up to 1 month 1-3 months 3-6 months
6-12 months Over 12 months
Source: developed based on the NBRB data.
27
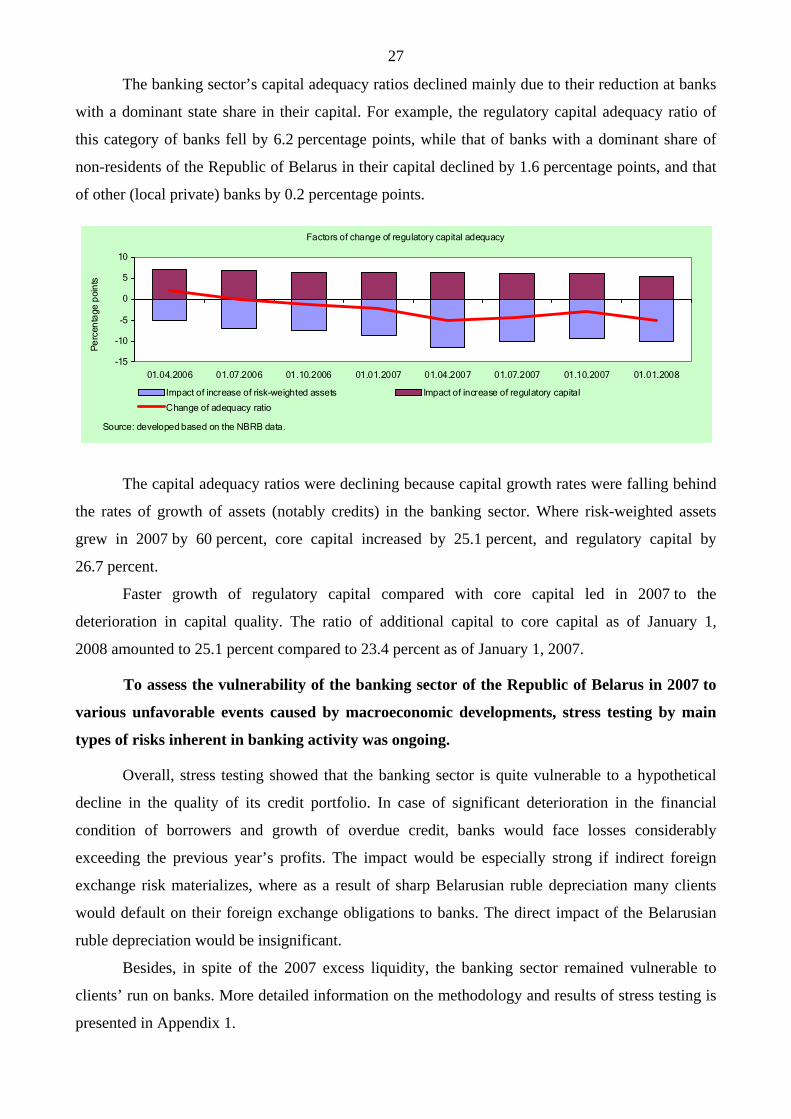
The banking sector’s capital adequacy ratios declined mainly due to their reduction at banks
with a dominant state share in their capital. For example, the regulatory capital adequacy ratio of
this category of banks fell by 6.2 percentage points, while that of banks with a dominant share of
non-residents of the Republic of Belarus in their capital declined by 1.6 percentage points, and that
of other (local private) banks by 0.2 percentage points.
Factors of change of regulatory capital adequacy
-15
-10
-5
0
5
10
01.04.2006 01.07.2006 01.10.2006 01.01.2007 01.04.2007 01.07.2007 01.10.2007 01.01.2008
Pe
rcen
tage
poi
nts
Impact of increase of risk-weighted assets Impact of increase of regulatory capital
Change of adequacy ratio
Source: developed based on the NBRB data.
The capital adequacy ratios were declining because capital growth rates were falling behind
the rates of growth of assets (notably credits) in the banking sector. Where risk-weighted assets
grew in 2007 by 60 percent, core capital increased by 25.1 percent, and regulatory capital by
26.7 percent.
Faster growth of regulatory capital compared with core capital led in 2007 to the
deterioration in capital quality. The ratio of additional capital to core capital as of January 1,
2008 amounted to 25.1 percent compared to 23.4 percent as of January 1, 2007.
To assess the vulnerability of the banking sector of the Republic of Belarus in 2007 to
various unfavorable events caused by macroeconomic developments, stress testing by main
types of risks inherent in banking activity was ongoing.
Overall, stress testing showed that the banking sector is quite vulnerable to a hypothetical
decline in the quality of its credit portfolio. In case of significant deterioration in the financial
condition of borrowers and growth of overdue credit, banks would face losses considerably
exceeding the previous year’s profits. The impact would be especially strong if indirect foreign
exchange risk materializes, where as a result of sharp Belarusian ruble depreciation many clients
would default on their foreign exchange obligations to banks. The direct impact of the Belarusian
ruble depreciation would be insignificant.
Besides, in spite of the 2007 excess liquidity, the banking sector remained vulnerable to
clients’ run on banks. More detailed information on the methodology and results of stress testing is
presented in Appendix 1.

28
CHAPTER 4. FINANCIAL MARKETS
In 2007, the money market conditions of the Republic of Belarus were under the
impact of external factors associated with changes in the terms of trade with the Russian
Federation and inflow of non-residents’ funds into the banking sector.
Increasing inflation and devaluation expectations of enterprises and households of the
Republic of Belarus in late 2006–early 2007 resulting from emerging external shocks had a number
of negative effects on the monetary sector of the country, including, in particular, growing net
demand for foreign exchange, declining gold and foreign exchange reserves, growing demand for
credit in domestic and foreign currency, and changing currency structure of banks’ assets and
liabilities.
Growing speculative demand for instruments in foreign exchange and outflow of household
deposits in 2007 QI led to liquidity shortage in the banking sector which caused a significant
increase in interest rates in the money market. In this situation the National Bank took measures to
tighten monetary policy. In particular, in January 2007 interest rates on permanently available
instruments and bilateral transactions forming the upper end of the range of the interest rate on
interbank credit were raised from 16 to 20 percent per annum, and in February the refinance rate
was raised from 10 to 11 percent per annum.
These measures, combined with limited maintenance of banks’ liquidity, made it possible to
keep interest rates of the interbank market at a higher level during 2007 QI. The average weighted
interest rate on intraday interbank credit was at the level of 13.4 percent per annum in January 2007,
19.8 percent per annum in February, and 19.4 percent per annum in March.
Monetary policy tightening in early 2007 was conducive to the inflow of private foreign
capital in the subsequent months. Banks were actively attracting non-residents’ resources, basically
of short-term nature. All this helped to close the gap between demand and supply in the domestic
foreign exchange market caused by the increased current account deficit of the balance of
payments. Eliminating negative expectations stimulated capital inflow of the financial account
which was conducive to keeping the movement of the national currency exchange rate within the
target range and building up gold and foreign exchange reserves to the level ensuring the
implementation of a more flexible exchange rate policy. Confidence in the national currency
savings was restored.
In QII-QIV, the situation in the ruble interbank market was developing against the
background of excess liquidity in the banking sector. That period was characterized by a decline in
the level of interest rates which was caused by the significant volume of idle resources in the

29
banking sector. The National Bank was seeking to withdraw banks’ excess liquidity and maintain
interest rate on intraday interbank credit at the level close to the refinance rate.
Thus, in the whole of 2007 the
National Bank ensured efficient functioning of
the market of interbank credit denominated in
the national currency and redistribution by the
same of resources in the volumes sufficient for
smooth settlements. The ruble interbank
market did not experience significant changes
in 2007 compared to the previous year in
terms of either duration of transactions (over
80 percent of which are one-day transactions)
or volumes of operations (37.6 trillion Belarusian rubles in 2007 compared to 44.2 trillion
Belarusian rubles in 2006). A slight decline in its capacity is explained by the fact that the period of
extensive use of interbank credit, when the volume of transactions in 2007 exceeded the volume of
transactions within the same period of the previous year, was limited to QI. But much of 2007 was
characterized by excess liquidity which reduced demand for interbank resources compared to 2006.
Credit risk (risk that a borrower will default on a payment due) in this segment of the market
remained low in 2007. The share of problem debts in the total volume of the market of interbank
credit denominated in the national currency was close to zero. Active presence of the National Bank
in the market and improved instruments of liquidity regulation and prudential supervision were
conducive to eliminating the threat of increased credit risk, liquidity risk, and interest rate risk,
which the remaining asymmetry of the structure of the ruble interbank market was fraught with
(two largest banks accounted for over 76 percent of demand, while in the supply of resources the
share of the largest lender did not exceed 12.5 percent). The risk level also declined thanks to the
development of the secured segment of the interbank market–REPO transactions, for which the
average daily outstanding amount in 2007 was over 95 billion Belarusian rubles (nearly 2.6 times
the growth compared to 2006).
Interest rate risk and liquidity risk in the ruble interbank market in 2007 had clear-cut
dynamics resulting from the response to the external economic shock: they grew in QI and then
declined and remained at a low level.
Reduced supply of resources and raised interest rates in the market in early 2007, the need to
tighten monetary policy expressed in the widening interest rate band owing to an increase in its
upper end, and reduced support provided by the National Bank through auctions raised banks’ risks
of unfavorable changes in the interest rate and impossibility to make deals on reasonable terms.
Dynamics of transaction volumes in the ruble
interbank market, billion rubles
0
1000
2000
3000
4000
5000
6000
Jan
ua
ry
Fe
bru
ary
Ma
rch
Ap
ril
Ma
y
Jun
e
July
Au
gu
st
Se
pte
mb
er
Octo
be
r
No
vem
be
r
De
cem
be
r
2007 2006
Source: developed based on the NBRB data.

30
However, it should be noted that having implemented a set of measures, which stimulated banks’
borrowings abroad and offering more attractive terms for time deposits domestically, the National
Bank efficiently controlled the level of risks keeping them within the established limits. For
example, owing to timely support of the banking system’s liquidity by means of permanently
available instruments and bilateral operations at a fixed rate, the National Bank prevented the
interbank market rate from significantly exceeding the upper end of the interest rate band and
payment crises from occurring.
Dynamics of intraday ruble interbank credit rate and NBRB instrument rates in 2007.
0
2
4
6
8
10
12
14
16
18
20
22
24
янв фев мар апр май июн июл авг сен окт ноя дек
Per
cent
ann
ual
Overnight credit Short-term bond auction, cutting-off rate Intraday interbank credit
2-day deposits (from 18.04.07 - 1-day) Refinance rate Deposit auction, cutting-off rate
Lombard auction, cutting-off rate обратное РЕПО
Source: developed based on the NBRB data.
Upon the stabilization of market situation in 2007 QII, albeit the interest rate band was not
narrowed, the interbank market rate was approaching the target, i.e. the refinance rate, thanks to the
National Bank’s auction operations of liquidity withdrawal and provision. Thus, the volatility of the
interbank resources cost was significantly reduced. The average monthly range of fluctuations of
interest rates on intraday ruble interbank credit dropped from 7.4 percentage points in 2007 QI to
4.2 percentage points in May-December.
The intraday interest rate spread also declined significantly which points to the leveling out
of conditions for market participants and reduced level of interest rate and liquidity risks.
The interest rate on new ruble
time deposits increased from 9.7 percent
per annum in December 2006 to
12.7 percent per annum in March 2007,
easing back gradually to 10.1 percent per
annum subsequently. In QI, interest rates
on new time deposits of legal and
Dynamics of interest rates in 2007, percent per annum
8,010,012,014,016,0
янв.07 мар.07 май.07 июл.07 сен.07 ноя.07Ставка по новым рублевым кредитам (без учета льготных)Ставка по новым срочным рублевым депозитамСтавка рефинансирования
Source: developed based on the NBRB data.
Interest rate on new ruble credit (without soft credit) Interest rate on new time ruble deposits Refinance rate
Jan. 07 Mar. 07 May 07 July 07 Sep. 07 Nov. 07
Reverse REPO
Jan Feb March Apr May June July Aug Sept Oct Nov Dec

31
natural persons tended to increase21, and beginning in QII they moved in opposite directions22.
Growth of interest rates on deposits of natural persons was stemming from the need to keep them at
a positive level in real terms because of higher inflation rates in 2007 compared to 200623.
The yield of new time foreign exchange deposits in 2007 was within the range of 6.5-
7.5 percent per annum remaining, on the whole, unchanged compared to 2006.
In 2007, the share of the foreign exchange component in credits and deposits increased
(growth of currency replacement) which was a significant risk factor in respect of financial
stability in the medium term.
Growing interest rates on ruble credits, especially in 2007 QI, against the background of
inflow of non-residents’ funds into the banking sector quickened the pace of lending in foreign
exchange. The interest rate on new ruble credits24 increased from 12.8 percent per annum in
December 2006 to 14.9 percent per annum in March 2007, thereafter declining gradually to 13.1
percent per annum by December 2007. The interest rate on new foreign exchange credits in
2007 increased insignificantly–from 10.6 percent per annum in December 2006 to 11 percent per
annum in December 2007.
With the euro and Russian ruble exchange rates growing in the world markets, higher rates
of growth of foreign exchange deposits of natural persons and organizations compared to ruble ones
led to deteriorating money supply structure, whose ruble component fell by 3.5 percentage points in
2007, while the foreign exchange component of broad money supply grew correspondingly, which
is an indication of growing currency replacement.
Increasing volumes of exports and imports of goods and services and capital flows
were responsible for high activity of market participants in 2007 in foreign exchange purchase
and sales operations.
The domestic foreign exchange
market turnover increased compared to
2006 by 17.1 percent. The OTC segment
of the foreign exchange market accounted
for the largest share in the structure of
21 From 9.4 percent per annum in December 2006 to 12.7 percent per annum in March 2007 for legal persons, and from 10.9 to 12.4 percent per annum, respectively, for natural persons. 22 By December 2007 the interest rate on deposits of legal persons decreased to 9.6 percent per annum, while on deposits of natural persons it increased to 13.5 percent per annum. 23 In real terms in 2007, interest rate on new time deposits of natural persons in domestic currency amounted to 1 percent per annum, while in 2006 it was 5 percent per annum. 24 Without soft credits extended by decisions of the President of the Republic of Belarus, Government, as well as credits extended with the use of relevant credits of the National Bank and government authorities.
Structure of operations in particular segments of domestic foreign exchange market in the Republic of Belarus,
2004 - 2007.
0%
50%
100%
2004 2005 2006 2007
outside BCSE BCSE Cash
Source: developed based on the NBRB data.

32
operations, and has remained dominant thus far–61.2 percent of operations. The trend towards
increasing the volume of foreign exchange operations in the cash foreign exchange market
continued to run its course, the share of such operations in 2007 amounted to 18.5 percent. The
capacity of the foreign exchange market increased as a result of considerable growth of operations
of economic entities, households, and banks, while participation of non-residents in foreign
exchange market operations declined significantly.
As a result of faster growth of purchase compared with the growth of sales, the volume of
net foreign exchange sales by resident economic entities fell by 39.6 percent, amounting to
USD757 million compared to USD1,255 million in 2006. The volume of net demand for foreign
exchange on the part of households (paid for in cash and by non-cash transfers) decreased from
USD757 million in 2006 to USD418 million in 2007. Non-residents’ net demand for foreign
exchange declined 3.2 times, from USD852 million to USD263 million25. In 2007, resident banks
sold foreign exchange on net basis in the amount of USD224 million compared to USD402 million
in 2006.
Balance of operations of foreign exchange market participants in the Republic of Belarus in 2007.
-360%
-260%
-160%
-60%
40%
140%
240%
340%
Janu
ary
Feb
ruar
y
Mar
ch
Apr
il
May
June
July
Aug
ust
Sep
tem
ber
Oct
ober
Nov
embe
r
Dec
embe
r
Economic entities Banks Non-residents Households Consolidated balance
Source: dev eloped based on the NBRB data.
In 2007, the Belarusian securities market continued to experience uneven development.
Its most developed segment is the government securities (hereinafter referred to as “GS”)
market. At the same time, securities market liquidity, including the GS market, lacks
adequate characteristics.
In 2007, the volume of GS in circulation increased by 556 billion Belarusian rubles (by
17 percent), to 3.8 trillion Belarusian rubles at face value as of January 1, 2008. The average
weighted GS maturity was 414 days (294 days in 2006), the average weighted yield was
10.84 percent per annum (10.3 percent in 2006).
25 Reduction of non-residents’ operations in the domestic foreign exchange market was primarily caused by the
reduction of Belarusian ruble use in foreign trade operations settlements by 31.4 percent in 2007 compared to 2006, as well as by poor development of the domestic financial market.

33
In spite of the growing volume of GS in circulation, banks’ claims on the Government of the
Republic of Belarus (excluding the National Bank’s portfolio) denominated in securities fell in
2007 by 80.3 billion Belarusian rubles at book value, or by 3.1 percent, amounting to 2,517 billion
Belarusian rubles. This was due to a significant increase in the GS portfolio of the National Bank
during 2007 (more than twofold) as a result of GS purchase ”until redemption“ from banks’
portfolio and restructuring of debt under credit extended by the National Bank to the Government of
the Republic of Belarus into securities.
As of January 1, 2008, a mere 47 percent of GS in circulation (excluding the National
Bank’s portfolio) were actively traded in the secondary market and had a market value which is an
indication that the GS market is insufficiently liquid.
During 2007, the National Bank engaged in operations designed to withdraw liquidity by
means of placing own short-term bonds. Their maturities varied from 6 to 90 days depending on the
current situation in the market; the average weighted maturity in 2007 was 14 days, declining by
7 days compared to 2006. The average weighted yield of short-term bonds in 2007 was
10.21 percent per annum (9.61 percent in 2006); the volume of placement was 8 trillion Belarusian
rubles at sales price (2 trillion Belarusian rubles in 2006).
The segment of corporate securities in the Republic of Belarus is represented mainly by
shares and bonds. Financial instruments of the term market (futures, options) based on underlying
assets are practically not used because of lack of a liquid underlying asset.
Capitalization of the primary market of shares (volume of share issue) as of January 1,
2008 was 16.8 trillion Belarusian rubles, or 17.4 percent of GDP which is much lower than the level
of developed market economies. The total amount of issue of shares of joint-stock companies in
2007 (owing to new issues and changes in the face value) for issuers operating as of January 1,
2008 amounted to 3 trillion Belarusian rubles.
In 2007, 59 issues of corporate bonds were registered totaling 385 billion Belarusian rubles,
USD21.5 million, and EUR13.4 million, of which about 70 percent were banks’ bonds secured by
obligations to repay credit for housing construction, reconstruction, or purchase against security of
immovable property.
In 2007, the total volume of transactions involving shares in the secondary market amounted
to 6.1 trillion Belarusian rubles, whilst the volume of stock exchange operations was as low as
7.9 billion Belarusian rubles which proves that activity in this segment of the market remains low.
Significant volumes of OTC transactions are associated with targeted privatization transactions on
selling state-owned blocks of shares of enterprises of the financial and non-financial sectors of the
Belarusian economy to strategic foreign investors.

34
The volume of secondary operations with securities in the stock exchange in 2007 in
aggregate amounted to 254 billion Belarusian rubles, significantly exceeding the 2006 level
(3.1 billion Belarusian rubles).
The bank credit market remained one of the major sources of funding the non-
financial sectors of the economy of the Republic of Belarus in 2007, and the rate of growth of
bank lending to the economy was significantly higher than the rate of GDP growth.
Lending is used by banks to compensate the shortage of economic entities’ financing from
other sources which leads to excessive development of banks’ lending function to the detriment of
the development of their investment and trade operations with securities and is reflected in poor
diversification of banks’ assets.
The compensatory role of bank lending was most of all reflected in financing investment
into fixed capital and other long-term investment in the sector of non-financial enterprises. As of
January 1, 2008, the share of debt under long-term credit in banks’ credit portfolio amounted to
75.7 percent, increasing during 2007 by 21.7 percentage points. 57.4 percent of long-term bank
credit was used to finance enterprises’ working capital.
In 2007, the gap between growth of banks’ claims on the economy in comparable prices and
real GDP growth expanded. The increase in banks’ claims on the economy in Belarusian rubles and
in foreign exchange in real terms in 2007 averaged 35 percent relative to 200626, with real GDP
growing by 8.2 percent in 2007.
Credit expansion of banks in the Republic of Belarus was to a large extent stimulated
through the mechanism of government programs, in which banks’ participation carries a
number of risks to the banking system.
As of January 1, 2008, debt under credit and other asset operations restructured in
accordance with Decrees of the President of the Republic of Belarus amounted to 330 billion
Belarusian rubles, increasing fivefold over the year. The volume of new credits extended by banks
under government programs, a significant part of which are long-term credits, increased by
41.2 percent in 2007, amounting to 6.1 trillion Belarusian rubles, or 13.3 percent of the total volume
of credits in 2007.
Given current structure of obligations, the growing share of long-term debt in banks’ credit
portfolio is conducive to maintaining maturity mismatch between assets and liabilities in the
banking sector and banks’ requirements to use long-term (revolving) centralized credit resources to
refinance their assets, as well as reduces the capacity of further lending to the economy and has a
negative impact on the profitability of banking activity. 26 The calculation has been made based on the GDP deflator of 112.1 percent.
35
Bank lending under government programs to industries, regions, and enterprises plays the
role of a non-market means of competition which increases credit indebtedness of borrowers with a
low level of economic efficiency. State-owned banks’ liquidity gets increasingly dependent on
budget planning and centralized resources. The volumes of funds spent by the state on building up
state-owned banks’ capital are inadequate compared to the volume of bank lending under
government programs.
In 2007 and during 2008, the problem of conditionality of guarantees of the Government of
the Republic of Belarus and local executive and administrative authorities retained its topicality
which increases banks’ credit risk when they implement government programs.
The problem of liquidity of those banks that participate in financing government programs is
partially tackled by means of placing with state-owned banks time deposits of the Government of
the Republic of Belarus (which, however, are insufficient to adequately provide financed programs
with resources), but this practice has a negative impact on the mechanism of banking sector
liquidity regulation and limits the effectiveness of monetary policy.

36
CHAPTER 5. PAYMENT SYSTEM OF THE REPUBLIC OF BELARUS
In 2007, measures were taken to ensure stable and smooth operation of the payment
system of the Republic of Belarus; work was ongoing to improve the procedures for managing
main risks affecting systemically important payment systems.
The most important achievement in the operation of the payment system of the Republic of
Belarus in 2007 was smooth performance of settlements and payments for all economic entities
within the framework of the automated system of interbank settlements (hereinafter referred to as
the “ASIS”). From the point of view of financial stability, the major object of monitoring in the
payment system was systemic risk and its main components: settlement risk (liquidity and credit
risks) and operational risk.
Risk management in the payment system of the Republic of Belarus was effected on the
basis of measures aimed at full compliance with the Core Principles for Systemically Important
Payment Systems developed by the Committee on Payment and Settlement Systems of the Bank for
International Settlements (Appendix 5). In accordance with the international practice and
recommendations of international organizations, a special subdivision was established at the
National Bank in August 2007 to effect oversight of the country’s payment system which monitors
the main risks associated with the system’s operation.
The major approaches to managing systemic risk and its components in 2007 were the
improvement of the software and hardware infrastructure of the payment system and
implementation of efficient tariff policies.
Putting the modernized BISS system–a system of interbank settlements operating on the
gross basis with some elements of clearing–into industrial operation in 2005 made it possible in
2007, along with the expansion of the ASIS operation characteristics, to implement procedures for
managing credit and liquidity risks based on the division of payment flows into urgent and non-
urgent electronic payment documents and the off-setting of non-urgent electronic payment
documents.
In 2007, liquidity risk was managed by means of improving tariff policies aimed at ensuring
even distribution of payment flows within a transaction day through the use of differentiated ratios
applied to tariffs for processing payments at different time intervals, as well as procedures for
providing banks with intraday liquidity of the National Bank. One of the key measures aimed at
improving the procedures for providing banks with intraday liquidity of the National Bank within
the framework of liquidity risk management in 2007 was to enhance efficient functioning of the
mechanism of required reserves creation and their use in settlements.
37
One of the priority measures to prevent technical and technological components of
operational risk in the Republic of Belarus in 2007 was to improve the procedures for oversight of
the status and functioning of the ASIS software and hardware infrastructure. To this end, the
National Bank, together with other banks, paid much attention to training staff in a force-majeure
environment to ensure smooth operation of the ASIS and restore its functioning in the shortest time
possible in case of failure or malfunction, as well as in case of possible man-caused disasters and
other circumstances, which can impair the efficiency of software and hardware complexes and
telecommunication networks.
The current system of software and hardware standardization and certification in the area of
banking services and technologies continued improving; a number of technical regulatory legal acts
were developed to establish requirements to the software and hardware used in the payment system
to be complied with. On the whole, the implementation of the aforementioned measures made it
possible to reduce the number of failures in the ASIS, as well as down-time resulting therefrom. At
the end of 2007, the average value of the parameter of clients’ access to the ASIS (cumulative from
the beginning of the year) amounted to 99.83 percent, the requirement being at least 99.5 percent.

38
Appendix 1
ASSESSING VULNERABILITY OF THE BANKING SECTOR
OF THE REPUBLIC OF BELARUS
To assess the vulnerability of the banking sector of the Republic of Belarus to various
shocks caused by macroeconomic developments, all major types of risks inherent in banking
activity were stress tested.
To stress test the vulnerability of the banking sector to credit, foreign exchange, and interest
risks, a methodology was used underlying which was the calculation of net losses caused by the set
shocks and the charging of those losses to the capital account. The capital adequacy ratio was
calculated simultaneously with the comparison of losses with profits gained by banks in the
preceding 12 months.
In stress testing vulnerability to liquidity risk, the change in liquidity ratios in case of a sharp
change in the level of liquid liabilities was calculated.
The banking sector’s sensitivity was tested on the following assumptions:
– the share of problem assets increases by 15 percentage points on the assumption that the
structure of problem assets remains in the proportions close to those existing as of January 1, 2008
in the banking sector as a whole, and the share of Group II assets increases by a similar amount
(shock 1);
– the Belarusian ruble/US dollar exchange rate declines by 20 percent (shock 2);
– there is a parallel increase in the Belarusian ruble yield curve by 1,000 basis points
(shock 3); and
– natural and legal persons withdraw 20 percent of their deposits in banks (shock 4).
Findings of stress testing suggest that the banking sector is highly vulnerable to a significant
deterioration in asset quality. If the chosen shock materializes, the regulatory capital adequacy ratio
would decline by 7.7 percentage points, although its value would remain above the level prescribed
for individual banks.
Foreign banks1 in which the decline in regulatory capital adequacy would be the largest,
reaching, however, the lowest level compared to other banks, would be hit hardest. From the point
1 Here and hereinafter:
All banks (ALL) State-owned banks (SOB), i.e. a group of banks with the predominant share of government agencies and state
entities in the authorized capital. Foreign banks (FB), i.e. a group of banks with the predominant share of foreign capital in their authorized
capital. Private banks (PB), i.e. a group of banks not included in groups SOB and FB. Large banks (LB), i.e. a group of banks whose share of assets exceeds 5 percent of total assets of the banking
sector.

39
of view of the size of losses, state-owned banks would incur the largest losses (5.7 times exceeding
their annual profits). Losses in the banking sector as a whole would exceed banks’ annual profits
nearly fivefold, amounting to 3 percent of GDP.
Table
FINDINGS OF STRESS TESTING the banking sector (impact on the regulatory capital adequacy ratio), percent
Value ALL SOB FB PB LB MB SB
Actual 19.31 19.63 17.84 19.81 18.62 17.68 42.46
Credit shock (shock 1)
Calculated 11.65 12.01 9.78 13.21 10.84 10.00 37.62
Change -7.66 -7.62 -8.06 -6.60 -7.78 -7.68 -4.84
Foreign exchange risk (shock 2)
Calculated 19.22 19.52 17.81 19.75 18.50 17.67 42.55
Change -0.09 -0.11 -0.03 -0.06 -0.12 -0.01 0.09
Interest risk (shock 3)
Calculated 17.78 17.89 17.11 18.67 16.96 16.95 41.62
Change -1.53 -1.74 -0.73 -1.14 -1.66 -0.73 -0.84
Combination of foreign exchange and credit risks (shock 5)
Calculated 11.46 12.75 5.20 10.54 11.23 3.87 37.72
Change -7.85 -6.88 -12.64 -9.27 -7.39 -13.81 -4.74
Source: developed based on the NBRB data.
Testing banks’ sensitivity to direct foreign exchange risk showed that the consequences of
the chosen shock for banks would be insignificant. The regulatory capital adequacy ratio would
decline by about 0.1 percentage points and losses about 6.5 percent of annual profits.
If interest rates go up by 1,000 basis points, the banking sector would incur losses
comparable to its annual profits. It would primarily apply to state-owned banks, whose losses would
exceed annual profits 1.4 times, while losses of foreign and private banks would amount to 62 and
32 percent of profits respectively.
If a crisis hits causing withdrawal of 20 percent of funds placed with banks by natural and
legal persons, the banking sector would face serious challenges. With the exception of the
instantaneous liquidity ratio, all liquidity ratios calculated for the banking sector would be below
the requirements set for individual banks. As a result of this shock, the ratio of liquid assets to total
assets would fall to 12.7 percent, the current liquidity ratio to 56.5 percent, and the short-term
liquidity ratio to 0.7. This deterioration in the banking sector liquidity is primarily due to the lack of
liquid assets in state-owned banks, whose liquidity indicators would be substantially below the
Medium banks (MB), i.e. a group of banks whose share of assets exceeds 5 percent of assets of banks not
included in group LB. Small banks (SB), i.e. a group of other banks not included in groups LB and MB.

40
requirements, while foreign and private banks have enough liquidity to honor their liabilities to
clients on demand.
Table
FINDINGS OF STRESS-TESTING the banking sector (impact on liquidity ratios)
Value ALL SOB FB PB LB MB SB
Instantaneous liquidity ratio, percent
Actual 104.05 74.91 145.96 158.38 98.44 133.55 119.99
Calculated 59.91 0.07 123.59 72.10 56.61 70.29 89.58
Change -44.14 -74.84 -22.37 -86.28 -41.83 -63.26 -30.41
Current liquidity ratio, percent
Actual 98.78 83.27 127.05 128.87 93.51 118.14 141.29
Calculated 56.52 19.82 116.27 100.72 45.94 93.00 136.93
Change -42.26 -63.45 -10.78 -28.15 -47.57 -25.14 -4.36
Short-term liquidity ratio
Actual 1.97 1.66 3.07 2.75 1.80 2.80 2.73
Calculated 0.71 0.43 2.51 1.02 0.60 1.82 1.62
Change -1.26 -1.23 -0.56 -1.73 -1.20 -0.98 -1.11
Ratio of liquid assets to total assets, percent
Actual 22.60 17.90 39.02 30.03 21.00 33.06 31.97
Calculated 12.73 6.47 33.70 20.71 10.71 24.83 26.72
Change -9.87 -11.43 -5.32 -9.32 -10.29 -8.23 -5.25
Source: developed based on the NBRB data.
Along with sensitivity tests, the National Bank conducted scenario analysis aimed at
assessing the degree of vulnerability of the banking sector in case of a combined foreign
exchange and credit risks shock (shock 5). The scenario was based on the following
assumptions: the Belarusian ruble/ US dollar exchange rate drops by 20 percent; as a result,
80 percent of foreign exchange credits extended to agriculture, construction, and households,
as well as 20 percent of credits to industry and other sectors would become problem ones and
would be classified as Group V assets.
The results of scenario analysis showed that if the scenario materializes, the banking sector
would incur significant losses. The regulatory capital adequacy ratio would decline by
7.9 percentage points amounting to 11.5 percent. Hardest hit would be medium-size and foreign
banks, whose regulatory capital adequacy would be the lowest among corresponding groups of
banks–3.9 and 5.2 percent respectively. The amount of losses in the banking sector as a whole
would be six times the volume of profits earned by banks over the year, or 3.7 percent of GDP.
On the whole, stress testing has shown that the banking sector is highly vulnerable to a
hypothetical reduction in the quality of its credit portfolio. If the financial condition of borrowers
deteriorates substantially and the volume of past-due credits increases, banks would face losses
significantly exceeding their profits in the previous year. This would especially show up if indirect
41
foreign exchange risk materializes, when as a result of a sharp depreciation of Belarusian ruble
many clients would default on their foreign exchange obligations to banks. The direct impact of
Belarusian ruble depreciation would be insignificant.
Besides, in spite of excess liquidity in 2007, the banking sector remained vulnerable to
clients’ run on banks.

42
Appendix 2
MACROECONOMIC INDICATORS
Table
WORLD ECONOMIC DEVELOPMENT in 2007: rates of real GDP growth, % of previous period2
Region
2006
2007
2008
2009
World economy in general 5 4.9 3.7 3.8
Developed countries 3 2.7 1.3 1.3
USA 2.9 2.2 0.5 0.6
Euro zone 2.8 2.6 1.4 1.2
Germany 2.9 2.5 1.4 1
France 2 1.9 1.4 1.2
Italy 1.8 1.5 0.3 0.3
Spain 3.9 3.8 1.8 1.7
Japan 2.4 2.1 1.4 1.5
UK 2.9 3.1 1.6 1.6
Canada 2.8 2.7 1.3 1.9
Other developed countries 4.5 4.6 3.3 3.4
New industrialized economies of the Asian region 5.6 5.6 4 4.4
Emerging market economies 7.8 7.9 6.7 6.6
Africa 5.9 6.2 6.3 6.4
South Sahara 6.4 6.8 6.6 6.7
Central and Eastern Europe 6.6 5.8 4.4 4.3
CIS 8.2 8.5 7 6.5
Russia 7.4 8.1 6.8 6.3
Without Russia 10.1 9.6 7.4 7
Developing Asian countries 9.6 9.7 8.2 8.4
China 11.1 11.4 9.3 9.5
India 9.7 9.2 7.9 8
ASEAN countries 5.7 6.3 5.8 6
Middle East 5.8 5.8 6.1 6.1
Western hemisphere 5.5 5.6 4.4 3.6
Brazil 3.8 5.4 4.8 3.7
Mexico 4.8 3.3 2 2.3
European Union 3.3 3.1 1.8 1.7
Source: World Economic Outlook / April 2008. – Washington D.C.:IMF, 2008. – P.1
2 Based on the IMF World Economic Outlook methodology.

43
Table
MAIN MACROECONOMIC INDICATORS of instability emergence and development in the banking sector as at January 1, 2008
Indicators, whose dynamics is evidencing the downturn
(maintenance at the same level) in the potential emergence of instability in the banking sector in 2007
Indicators, whose dynamics is evidencing the upsurge in the potential emergence of instability in the banking sector in 2007
Real GDP growth was 108.2 percent (in 2006, 110 percent). Exports, imports, current account deficit (in 2007, the rates of
export growth were 24.6 percent, those of imports - 28.0 percent;
the negative balance of foreign trade was USD2,738.7 million
compared with USD1,514.9 million in 2006).
Real industrial output growth was 108.5 percent (in 2006, 111.4
percent).
Rate of inflation (in 2007, the CPI grew by 12.1 percent, compared
with 6.6 percent in 2006). The PPI grew by 16.8 percent (in 2006,
9 percent).
Share of loss-making enterprises in their total number was
6.3 percent in 2007, compared with 8.3 percent in 2006.
Level of profitability of sold industrial products dropped from
13.2 percent in 2006 to 12 percent in 2007.
As at January 1, 2008, stocks of unsold output in industry as a
whole increased in actual prices by 25.6 percent compared with
January 1, 2007, with the PPI growing by 17.1 percent.
As of January 1, 2008, domestic government debt was 6.4 percent
of GDP, compared with 6.5 percent of GDP as of January 1, 2007.
Dollarization of the economy (the share of foreign exchange in the
broad money supply increased by 3.4 percentage points,
amounting to 32.2 percent as at January 1, 2008).
Consolidated budget surplus (422.1 billion Belarusian rubles, or
0.4 percent of GDP).
In 2007, external debt increased by USD1,499 million, amounting
to USD2,337 million as at January 1, 2008, or 5.2 percent of GDP,
compared with 2.3 percent of GDP as at January 1, 2007.
Share of the time component in М2 (share of time deposits in the
ruble money supply as of January 1, 2008 was 43.6 percent,
increasing over the year by 0.9 percentage points).
In 2007, external debt increased to USD12.9 billion, or by 91.1
percent.
Relative level of gold and foreign exchange reserves in months of
imports (increased to 1.65 months as at January 1, 2008 from
0.7 months as at January 1, 2007).
Source: developed based on the RB MoSA and NBRB data.

44
Table
MAIN INDICATORS of international operations of the Republic of Belarus in 2005-2007, million USD
Indicators 2005 2006 2007 Foreign trade balance 341.8 -1,514.9 -2,738.7
% of GDP 1.2 -4.1 -6.1
Current account balance 435.5 -1,431.2 -2,944.2
% of GDP 1.5 -3.9 -6.6
Balance of investments -45.7 1,706.2 5,376.8
% of GDP -0.2 4.6 12.0
of which, net inflow of direct investment 302.5 351.0 1,768.9
1.0 0.9 4.0
Balance of payments (increase in reserve assets) 539.2 -1.4 2,778.1
% of GDP 1.8 0.0 6.2
Foreign debt (as at January 1 of the following year) 5,740.8 6,785.7 12,719.2
% of GDP 19.4 18.4 28.4
of which, short-term debt 4,509.1 4,719.8 8,045.3
% of GDP 15.2 12.8 18.0
Macroeconomic ratios
Export of goods to GDP, % 61.5 53.6 54.6
Import of goods to GDP, % 60.3 59.8 63.3
Reserve assets in days of import of goods and services 26.2 22.5 53.2
Source: developed based on the RB MoSA and NBRB data.
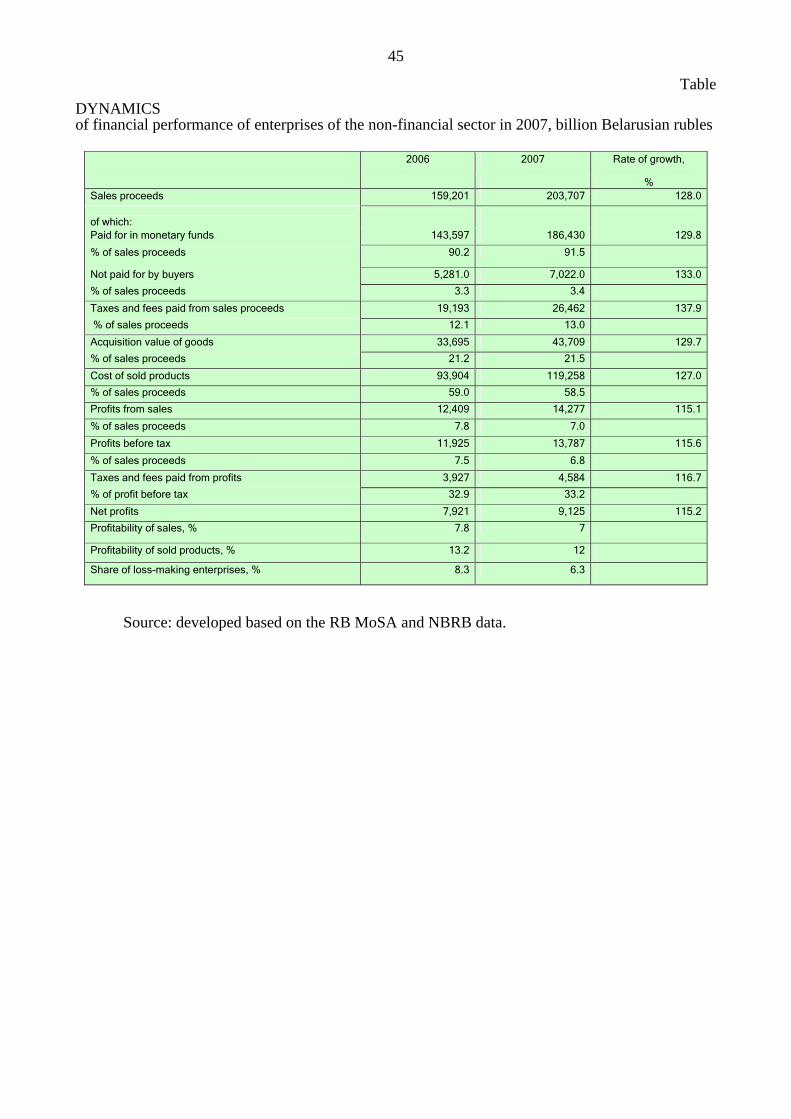
45
Table DYNAMICS of financial performance of enterprises of the non-financial sector in 2007, billion Belarusian rubles
2006 2007 Rate of growth,
% Sales proceeds 159,201 203,707 128.0
of which: Paid for in monetary funds 143,597 186,430 129.8
% of sales proceeds 90.2 91.5 Not paid for by buyers 5,281.0 7,022.0 133.0
% of sales proceeds 3.3 3.4
Taxes and fees paid from sales proceeds 19,193 26,462 137.9
% of sales proceeds 12.1 13.0
Acquisition value of goods 33,695 43,709 129.7
% of sales proceeds 21.2 21.5
Cost of sold products 93,904 119,258 127.0
% of sales proceeds 59.0 58.5
Profits from sales 12,409 14,277 115.1
% of sales proceeds 7.8 7.0
Profits before tax 11,925 13,787 115.6
% of sales proceeds 7.5 6.8
Taxes and fees paid from profits 3,927 4,584 116.7
% of profit before tax 32.9 33.2
Net profits 7,921 9,125 115.2
Profitability of sales, % 7.8 7 Profitability of sold products, % 13.2 12 Share of loss-making enterprises, % 8.3 6.3
Source: developed based on the RB MoSA and NBRB data.

46Table
RATE OF GROWTH of profits by industry in 2007, %
Rates of profit growth
From products sale Before tax Net nominal Real nominal real nominal real
Republic of Belarus 115.1 102.7 115.6 103.1 115.2 102.8
of which:
Industry 109.2 97.4 109.7 97.9 109.5 97.7
Power industry 90.9 81.1 95.9 85.5 103.8 92.6
Fuel industry 40.8 36.4 39 34.8 36.2 32.3
Ferrous metallurgy 168.2 150.0 204.1 182.1 247.2 220.5
Chemical and petrochemical industry 125.1 111.6 128.2 114.4 124.3 110.9
Machinery building and metal processing 136.5 121.8 139.4 124.4 139.7 124.6
Timber, woodworking and pulp and paper industry 184.1 164.2 184.2 164.3 214.8 191.6Construction materials 163.5 145.9 177 157.9 198.3 176.9
Light industry 134.4 119.9 128.1 114.3 124.9 111.4
Food industry 143.8 128.3 137.4 122.6 137 122.2
Agriculture 294.1 262.4 132.1 117.8 133.2 118.8
Transport 135.8 121.1 152.9 136.4 179.3 159.9
Construction 112.1 100.0 108.2 96.5 104.4 93.1
Trade and public catering 141.7 126.4 128.7 114.8 124.5 111.1
Source: developed based on the RB MoSA data.

47
Table PROFITABILITY of sold products, work, and services in 2007, %
Deviation, 2006 2007 percentage points
Total 13.2 12 -1.2
of which:
Industry 15.6 13 -2.6
Power industry 12.9 8.4 -4.5
Fuel industry 29.7 7.8 -21.9
Oil refining 22.7 3.1 -19.6
Ferrous metallurgy 17.5 22.4 4.9
Chemical and petrochemical industry 27.1 26.1 -1
Chemical 26.7 27.6 0.9
Petrochemical 29.1 19.3 -9.8
Machinery building and metal processing 13.4 14.3 0.9
Timber, woodworking and pulp and paper industry 7.4 10.8 3.4Construction materials 10.2 12.4 2.2
Light industry 6.6 7.9 1.3
Food industry 8.4 10.1 1.7
Agriculture 2.1 5.2 3.1
Transport 14 15.7 1.7
Communication 45.1 40.4 -4.7
Construction 11.2 9.7 -1.5
Trade and public catering 16.4 17.9 1.5
Logistics and sales 31.6 34.7 3.1
Housing and utilities 4 4 0
Source: developed based on the RB MoSA data.

48
Table DYNAMICS of payables and receivables in 2007, billion Belarusian rubles
01.01.2007 01.01.2008 Increase
Rate of growth, %
Payables 25,955 31,860 5,905 122.8
of which: in arrears 4,091.1 4,246 155 103.8
% of total15.8 13.3
Receivables 18,586.9 24,560 5,973 132.1
of which: in arrears 3,603.8 3,883 279 107.7
% of total19.4 15.8
Net payables 7,368 7,300 -68 99.1
% of receivables39.6 29.7
Net payables in arrears 487
363
-124
74.5
% of receivables13.5
9.3
Share of organizations having arrears (% of total number)
payables 56.9 55.2
receivables 66 65.7
External payables: 4,732 6,997 2,265 147.9
of which: in arrears 568 674 106 118.7
% of total external payables
12.0
9.6
External receivables 2,752 4,651 1,899 169.0
of which: in arrears 263 342 79 130.0
% of total external receivables9.6
7.4
Net external payables 1,980
2,346
366
118.5
% of external payables
71.9
50.4
Net external payables in arrears 305
332
27
108.9
% of net external payables
15.4
14.2
Monetary funds on organizations’ accounts 4,712 6,660 1,948 141.3
Current solvency, % 115.2 156.9
Source: developed based on the RB MoSA data.

49
Table DYNAMICS of monetary funds on enterprises’ accounts, billion Belarusian rubles
01.01.2007 01.01.2008 Increase Share in increase, %
Rate of growth, %
Total 4,712.9 6,659.9 1,947.0 100 141.3
of which:
Industry 2,428.7 3,285.7 857.0 44.0 135.3
Power industry 59.4 89.0 29.6 1.5 149.8
Fuel industry 690.8 497.5 -193.3 -9.9 72.0
Oil refining 633.2 479.5 -153.7 -7.9 75.7
Ferrous metallurgy 68.1 139.8 71.7 3.7 205.3
Chemical and petrochemical industry 308.6 403.6 95.0 4.9 130.8
Chemical 277.7 363.5 85.8 4.4 130.9
Petrochemical 31.0 40.1 9.1 0.5 129.4
Machinery building and metal processing 905.6 1,574.1 668.5 34.3 173.8
Automobile 553.9 851.8 297.9 15.3 153.8
Tractor and agricultural machinery building 38.0 293.8 255.8 13.1 773.2
Timber, woodworking and pulp and paper industry 46.2 71.7 25.5 1.3 155.2
Construction materials 68.6 98.3 29.7 1.5 143.3
Light industry 70.2 64.2 -6.0 -0.3 91.5
Food industry 127 230.6 103.6 5.3 181.6
Flour-and-cereals and combined fodder industry 23.6 15.4 -8.2 -0.4 65.3
Agriculture 118 154.1 36.1 1.9 130.6
Transport 286.5 583.7 297.2 15.3 203.7
Pipeline transportation 151.6 405.5 253.9 13.0 267.5
Communication 243.8 393.6 149.8 7.7 161.4
Construction 439.2 522.2 83.0 4.3 118.9
Trade and public catering 426.5 622.1 195.6 10.0 145.9
Logistics and sales 72.6 51.6 -21.0 -1.1 71.1
Housing and utilities 95.9 157.0 61.1 3.1 163.7
Source: developed based on the RB MoSA data.

50
Table DYNAMICS of outstanding bank loans in 2007, billion Belarusian rubles
01.01.2007 01.01.2008 Increase Share in increase, %
Rate of growth, %
Total 14,301.9 22,029.1 7,727.2 100 154.0
of which:
Industry 6,628.5 10,285.8 3,657.3 47.3 155.2
Power industry 496.2 643.7 147.5 1.9 129.7
Fuel industry 213.7 1,477.4 1,263.7 16.4 691.3
Oil refining 176.3 1,220.1 1,043.8 13.5 692.1
Ferrous metallurgy 570.6 955.9 385.3 5.0 167.5
Chemical and petrochemical industry 534.3 888.0 353.7 4.6 166.2
Chemical 509.9 691.2 181.3 2.3 135.6
Petrochemical 24.4 196.8 172.4 2.2 8.1 р.
Machinery building and metal processing 1,611.9 1,946.0 334.1 4.3 120.7
Automobile 368.8 351.4 -17.4 -0.2 95.3
Tractor and agricultural machinery building 521.2 557.4 36.2 0.5 106.9
Timber, woodworking and pulp and paper industry 263.7 307.4 43.7 0.6 116.6
Construction materials 171.6 305.7 134.1 1.7 178.1
Light industry 307.0 343.8 36.8 0.5 112.0
Food industry 1,836.6 2,445.5 608.9 7.9 133.2
Flour-and-cereals and combined fodder industry 424.4 700.7 276.3 3.6 165.1
Agriculture 3,398.0 4,643.2 1,245.2 16.1 136.7
Transport 402.9 1,156.0 753.1 9.7 286.9
Pipeline transportation 41.9 673.9 632.0 8.2 16.1 р.
Communication 251.6 432.3 180.7 2.3 171.8
Construction 381.4 690.7 309.3 4.0 181.1
Trade and public catering 1,294.5 2,105.7 811.2 10.5 162.7
Logistics and sales 832.1 1,219.7 387.6 5.0 146.6Housing and utilities
253.4 298.4 45.0 0.6 117.8
Source: developed based on the RB MoSA data.

51
Table DYNAMICS of current solvency in 2007 (ratio of monetary funds to payables in arrears), %
01.01.2007
01.04.2007 01.10.2007 01.01.2008
Total 115.2 106.2 112.1 156.9
Industry 140.7 119.5 133.7 193.8
Agriculture 11.5 13.6 12.0 13.4
Transport 185.1 394.9 224.3 288.4
Construction 199.6 91.2 118.2 191.5
Trade and public catering 115.6 87.8 132.3 146.6
Logistics and sales 122.2 321.7 92.3 87
Housing and utilities 35.4 37.0 43.0 71.5
Source: developed based on the RB MoSA data.

52
Appendix 3
INDICATORS OF PERFORMANCE OF THE BANKING SECTOR OF THE REPUBLIC OF BELARUS, 2006-2007 Table
MAIN INDICATORS of performance of the banking sector of the Republic of Belarus
All banks3 Large banks Medium banks Small banks Date ALL SOB FB PB SOB FB PB SOB FB PB
Number of banks, units 01.01.2007 29 4 1 0 0 4 2 1 12 5
01.01.2008 27 4 1 0 0 6 1 1 9 5
Assets, trillion Belarusian rubles 01.01.2007 29.18 23.01 2.36 0 0 1.39 1.22 0.13 0.46 0.60
01.01.2008 41.94 31.86 4.19 0 0 3.56 0.99 0.21 0.54 0.59
Liabilities, trillion Belarusian rubles 01.01.2007 23.99 18.84 2.00 0 0 1.21 1.08 0.08 0.33 0.44
01.01.2008 35.26 26.66 3.77 0 0 3.07 0.89 0.10 0.35 0.42
Capital, trillion Belarusian rubles 01.01.2007 5.19 4.17 0.36 0 0 0.18 0.14 0.05 0.13 0.16
01.01.2008 6.68 5.20 0.42 0 0 0.48 0.10 0.11 0.19 0.17
Profits, billion Belarusian rubles 01.01.2007 411.2 270.6 70.4 0 0 33.5 19.7 1.8 -1.0 16.1
01.01.2008 602.4 393.4 76.6 0 0 75.1 13.0 7.1 19.0 18.2
Share of bank groups in assets, % 01.01.2007 100.0 78.9 8.1 0 0 4.8 4.2 0.4 1.6 2.1
01.01.2008 100.0 76.0 10.0 0 0 8.5 2.4 0.5 1.3 1.4
Share of bank groups in liabilities, % 01.01.2007 100.0 78.5 8.3 0 0 5.0 4.5 0.3 1.4 1.8
01.01.2008 100.0 75.6 10.7 0 0 8.7 2.5 0.3 1.0 1.2
Share of bank groups in capital, % 01.01.2007 100.0 80.3 7.0 0 0 3.5 2.7 0.9 2.5 3.1
01.01.2008 100.0 77.9 6.3 0 0 7.2 1.6 1.6 2.8 2.6
Source: developed based on the NBRB data.
3 As of January 1, 2007 the balance sheet and statistical reports were submitted to the National Bank by 29 banks, as of January 1, 2008 – by 27 banks.

53
Table
INDICATORS of financial stability of the banking sector of the Republic of Belarus, 2006-2007, %
INDICATORS 01.01.2006 01.01.2007 Change 01.01.2007 01.01.2008 Change
Capital adequacy
1 Regulatory capital adequacy ratio 26.66 24.39 -2.27 24.39 19.31 -5.08
2 Fixed capital adequacy ratio (Tier I) 18.75 17.37 -1.38 17.37 14.03 -3.34
3 Capital to assets 19.67 17.79 -1.88 17.79 15.92 -1.87
CREDIT RISK
4 Growth of credit to the economy 18.88 32.52 13.64 32.52 36.19 3.58
5 Large open positions to regulatory capital 69.18 65.99 -3.19 65.99 101.43 35.44
6 Share of problem assets in total assets exposed to credit risk 3.12 2.83 -0.29 2.83 1.92 -0.91
7 Share of problem assets in total credit to the economy 1.88 1.16 -0.66 1.16 0.65 -0.51
8 Problem assets less provisions actually created against them to
capital 6.29 6.12 -0.17 6.12 3.82 -2.30
9 Distribution of loans by branch
industry 40.25 37.85 -2.40 37.85 37.09 -0.76
agriculture 18.15 20.19 2.04 20.19 19.81 -0.38
construction 2.71 2.99 0.28 2.99 3.72 0.73
trade and public catering 9.84 10.72 0.88 10.72 11.16 0.44
housing and utilities 3.02 2.28 -0.74 2.28 1.42 -0.86
Other 26.04 25.97 -0.07 25.97 26.80 0.83
Incomes/returns
10 Return on assets 2.57 2.39 -0.18 2.39 2.30 -0.09
11 Return on capital 12.94 12.86 -0.08 12.86 13.80 0.94
12 Interest margin to gross income 37.13 38.91 1.78 38.91 40.66 1.75
13 Non-interest expenses to gross income 75.03 74.85 -0.18 74.85 73.91 -0.94
14 Staff costs to non-interest expenses 30.15 33.23 3.08 33.23 31.51 -1.72
15 Interest rates spread
for all loans and deposits in Belarusian rubles 4.50 3.70 -0.80 3.70 5.30 1.60

54
INDICATORS 01.01.2006 01.01.2007 Change 01.01.2007 01.01.2008 Change
for new loans and deposits in Belarusian rubles 5.50 3.20 -2.30 3.20 3.00 -0.20
for all foreign exchange loans and deposits 5.40 4.40 -1.00 4.40 4.40 0
for new foreign exchange loans and deposits 4.60 3.40 -1.20 3.40 3.60 0.20
Liquidity
16 Liquid assets to total assets 30.36 24.11 -6.25 24.11 22.60 -1.51
17 Short-term liquidity, times 1.89 1.81 -0.08 1.81 1.97 0.16
18 Immediate liquidity 117.76 128.85 11.09 128.85 104.05 -24.80
19 Current liquidity 95.93 96.69 0.76 96.69 98.78 2.09
For information:
Maturity mismatch between assets and liabilities over 12 months,
trillion Belarusian rubles -4.789 -6.155 -1.366 -6.155 -6.158 -0.003
Foreign exchange risk
20 Total open foreign exchange position to regulatory capital 13.14 9.53 -3.61 9.53 4.79 -4.74
21 Share of clients’ debt on loans and other assets operations in
foreign exchange in clients’ total debt on loans and other assets
operations
38.54 35.50 -3.04 35.50 39.11 3.61
22 Share of clients’ resources in foreign exchange in total resources
attracted from clients 36.99 34.68 -2.31 34.68 36.75 2.07
Source: developed based on the NBRB data.

55
Table
DISTRIBUTION OF BANKS by regulatory capital adequacy in 2007
Bank group Number of banks
01.01.2007 CA* <= 0 0 < CA <= 8 8 < CA <= 16 16 < CA <= 24 24 < CA <= 30 30 < CA Total
Banking sector 1 0 4 6 5 13 29
State-owned banks 0 0 2 1 0 2 5
Foreign banks 1 0 1 4 2 9 17
Private banks 0 0 1 1 3 2 7
Large banks 0 0 2 2 0 1 5
Medium banks 0 0 2 3 1 0 6
Small banks 1 0 0 1 4 12 18
01.01.2008 CA <= 0 0 < CA <= 8 8 < CA <= 16 16 < CA <= 24 24 < CA <= 30 30 < CA Total
Banking sector 0 0 5 7 2 13 27
State-owned banks 0 0 2 1 1 1 5
Foreign banks 0 0 2 5 1 8 16
Private banks 0 0 1 1 0 4 6
Large banks 0 0 3 1 1 0 5
Medium banks 0 0 2 4 0 1 7
Small banks 0 0 0 2 1 12 15
Source: developed based on the NBRB data.
*Regulatory capital adequacy ratio.

56
Table
DISTRIBUTION OF BANKS by share of problem assets in 2007
Bank group Number of banks
01.01.2007 share = 0 0 < share <= 1 1 < share <= 2 2 < share <= 4 4 < share <= 8 8 < share Total
Banking sector 3 5 6 6 4 5 29
State-owned banks 0 2 1 1 1 0 5
Foreign banks 3 2 3 3 1 5 17
Private banks 0 1 2 2 2 0 7
Large banks 0 1 1 2 1 0 5
Medium banks 0 1 2 2 1 0 6
Small banks 3 3 3 2 2 5 18
01.01.2008 share = 0 0 < share <= 1 1 < share <= 2 2 < share <= 4 4 < share <= 8 8 < share Total
Banking sector 4 10 6 4 2 1 27
State-owned banks 0 2 2 0 1 0 5
Foreign banks 4 5 3 4 0 0 16
Private banks 0 3 1 0 1 1 6
Large banks 0 2 2 0 1 0 5
Medium banks 0 2 2 3 0 0 7
Small banks 4 6 2 1 1 1 15
Source: developed based on the NBRB data.
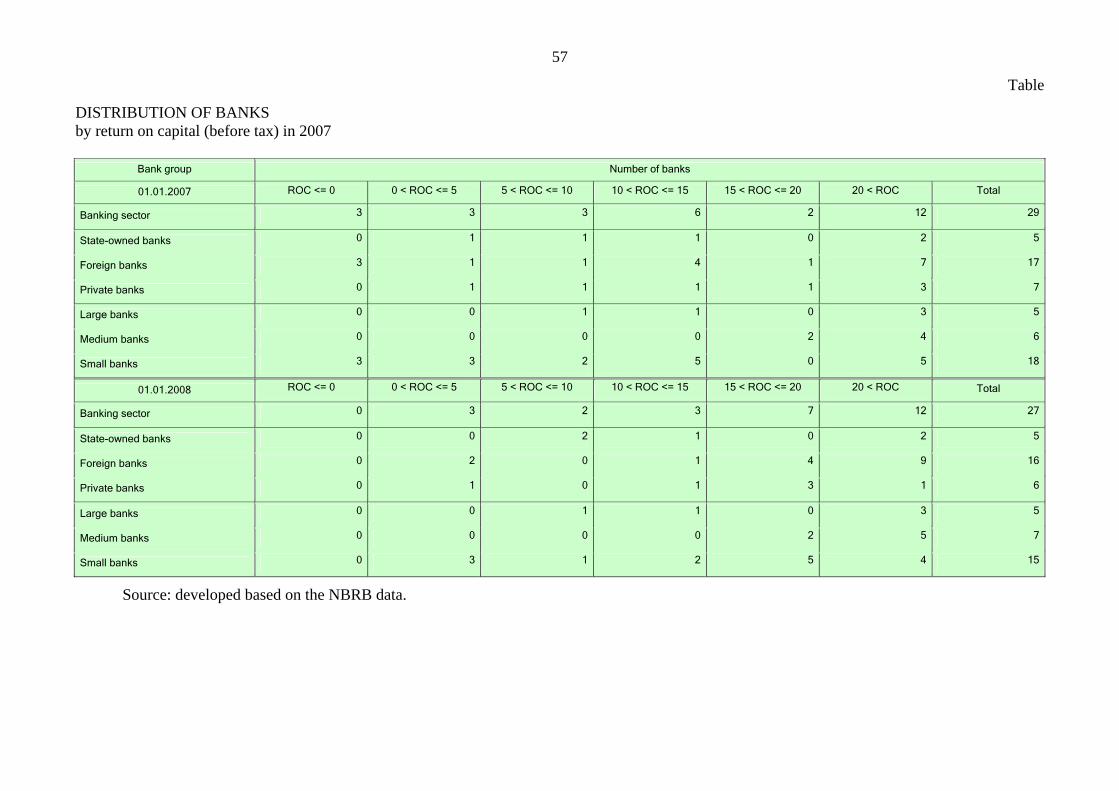
57
Table
DISTRIBUTION OF BANKS by return on capital (before tax) in 2007
Bank group Number of banks
01.01.2007 ROC <= 0 0 < ROC <= 5 5 < ROC <= 10 10 < ROC <= 15 15 < ROC <= 20 20 < ROC Total
Banking sector 3 3 3 6 2 12 29
State-owned banks 0 1 1 1 0 2 5
Foreign banks 3 1 1 4 1 7 17
Private banks 0 1 1 1 1 3 7
Large banks 0 0 1 1 0 3 5
Medium banks 0 0 0 0 2 4 6
Small banks 3 3 2 5 0 5 18
01.01.2008 ROC <= 0 0 < ROC <= 5 5 < ROC <= 10 10 < ROC <= 15 15 < ROC <= 20 20 < ROC Total
Banking sector 0 3 2 3 7 12 27
State-owned banks 0 0 2 1 0 2 5
Foreign banks 0 2 0 1 4 9 16
Private banks 0 1 0 1 3 1 6
Large banks 0 0 1 1 0 3 5
Medium banks 0 0 0 0 2 5 7
Small banks 0 3 1 2 5 4 15
Source: developed based on the NBRB data.
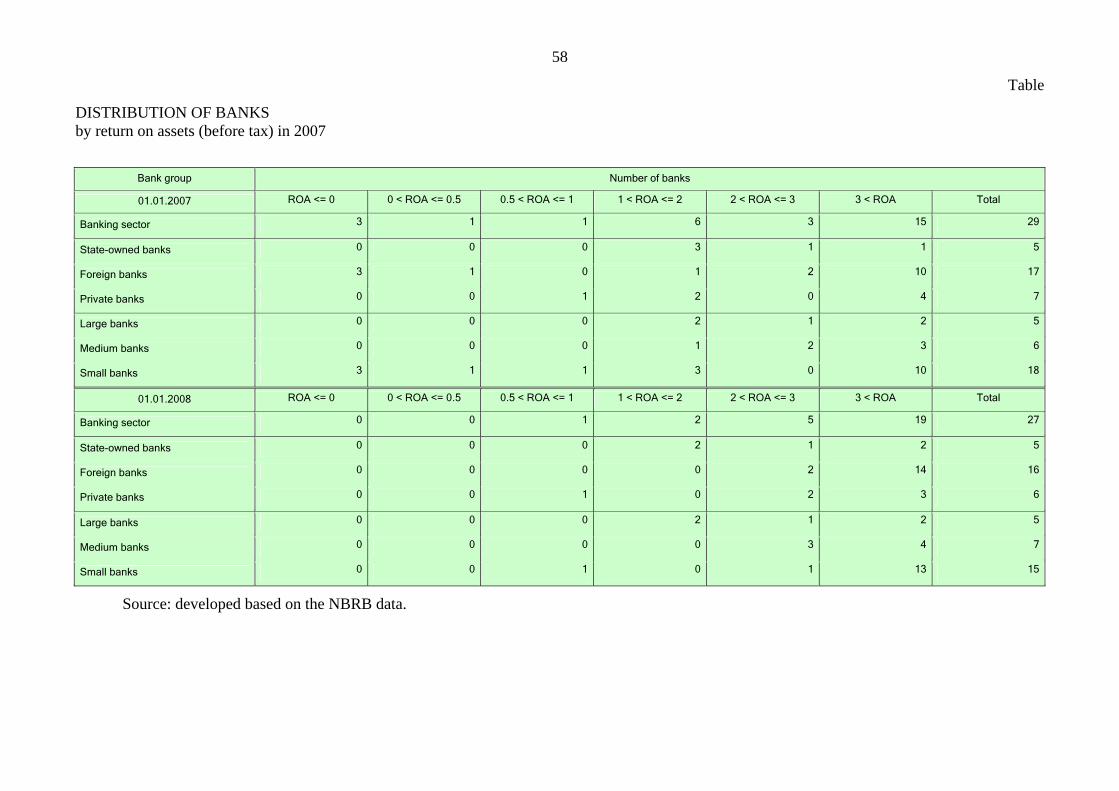
58
Table
DISTRIBUTION OF BANKS by return on assets (before tax) in 2007
Bank group Number of banks
01.01.2007 ROA <= 0 0 < ROA <= 0.5 0.5 < ROA <= 1 1 < ROA <= 2 2 < ROA <= 3 3 < ROA Total
Banking sector 3 1 1 6 3 15 29
State-owned banks 0 0 0 3 1 1 5
Foreign banks 3 1 0 1 2 10 17
Private banks 0 0 1 2 0 4 7
Large banks 0 0 0 2 1 2 5
Medium banks 0 0 0 1 2 3 6
Small banks 3 1 1 3 0 10 18
01.01.2008 ROA <= 0 0 < ROA <= 0.5 0.5 < ROA <= 1 1 < ROA <= 2 2 < ROA <= 3 3 < ROA Total
Banking sector 0 0 1 2 5 19 27
State-owned banks 0 0 0 2 1 2 5
Foreign banks 0 0 0 0 2 14 16
Private banks 0 0 1 0 2 3 6
Large banks 0 0 0 2 1 2 5
Medium banks 0 0 0 0 3 4 7
Small banks 0 0 1 0 1 13 15
Source: developed based on the NBRB data.

59
Appendix 4
LEASING OPERATIONS IN THE REPUBLIC OF BELARUS IN 2007
According to the Ministry of Statistics and Analysis of the Republic of Belarus, the
number of assets hired out by lessors (excluding real estate operations) had increased by 18.7
percent by January 1, 2008, amounting to 77.8 thousand units. The contract value of these assets
increased by 41.0 percent to 3,106.1 billion Belarusian rubles.
By the end of 2007, economic entities classified as belonging to the branch of the
economy under “banking activity” had hired out assets worth 1,204.8 billion Belarusian rubles,
or 38.8 percent of the total value of lease assets. Economic entities classified as belonging to the
branch of the economy under “other financial and credit organizations” had hired out assets
worth 1,901.4 billion Belarusian rubles, or 61.2 percent of the value of lease assets.
As of January 1, 2008, financial leasing accounted for the major share, in terms of both
the number of current agreements and the contract value of lease assets, in the structure of
leasing operations (99.9 percent), while the share of operational leasing was 0.1 percent.
As at December 31, 2007, the major lease assets were machinery and equipment (53.6
percent of the value of all lease assets) and means of transportation (36.3 percent), with the value
of hired out means of transportation increasing over the year by 94.5 percent, machinery and
equipment by 16.6 percent, and lease assets by 40.9 percent. Correspondingly, lessors’ major
potential risks can be associated with the worsening of the financial situation in those industries
which make an extensive use of these assets (for instance, transportation industry).
One can assume that in conducting leasing operations, non-bank intermediaries’ risk
management systems are less efficient than those of the banking sector.
For example, past-due lease payments increased markedly in 2007, exceeding the volume
of the economy’s and households’ problem debt under credit. According to the Ministry of
Statistics and Analysis of the Republic of Belarus, overdue debt under lease contracts increased
during the year by 52.9 percent and as of January 1, 2008 amounted to 237.4 billion Belarusian
rubles, or 9.8 percent of the total amount of debt under lease contracts (as of January 1, 2007 it
was 155.3 billion Belarusian rubles, or 9.0 percent).
For the sake of comparison: according to the National Bank, the economy’s and
households’ problem debt to banks (less financial leasing) dropped in the previous year by
6.4 percent to 182.8 billion Belarusian rubles, amounting as at the end of 2007 to 9.8 percent of
the total debt under credit. Problem debt under banks’ financial leasing operations declined
during 2007 by 65.0 percent to 2.7 billion Belarusian rubles, amounting to 0.4 percent of clients’
60
total debt to banks under financial leasing operations. As at the end of 2007, six banks had
problem debt under financial leasing operations, one bank accounting for 91.6 percent of its
amount.
Banks engaged in financial leasing operations mainly in foreign exchange. The share of
debt in foreign exchange under financial leasing in the total amount of banks’ debt under
financial leasing amounted to 75 percent as of January 1, 2008 (as of January 1, 2007 it was 63.6
percent). This gives grounds to assume that in the segment of leasing operations as a whole, the
share of leasing operations in foreign exchange can also be significant. Correspondingly, leasing
companies formally transfer foreign exchange risks to their clients. But, in fact, capacity of
lessees to repay foreign exchange obligations can be assured only if they have stable sources of
foreign exchange proceeds. If such sources are non-existent, then in case of unfavorable and
unexpected for the lessees exchange rate changes the risk of untimely lease payments can
increase jeopardizing financial stability of leasing companies.
At the same time, risks associated with leasing operations seem to be limited for the
banking sector as a whole owing to the insignificant share of such operations in banks’ asset
operations. For example, in 2007, the amount of banks’ financial leasing operations was 2.7
percent of banks’ long-term credits, or 1.1 percent of the total amount of extended credits.

61
Appendix 5
PAYMENT SYSTEM OF THE REPUBLIC OF BELARUS
Table MAIN RESULTS of assessment of the payment system of the Republic of Belarus as to its compliance with the Core Principles for Systemically Important Payment Systems
Category of assessment Core principles by category of assessment Complied with
CP I CP II CP IV CP VI CP IX Responsibility D
The system should have a well-developed legal basis. The system’s rules and procedures should enable participants to have a clear understanding of the system’s impact on each of the financial risks they incur due to the participation in it. The system should provide prompt final settlement as at the end of the day. Assets used for settlement should bear an insignificant or zero credit risk and liquidity risk. The system should have objective and publicly disclosed criteria for participation, which ensure a fair and open access. When ensuring the safety and efficiency of the payment system by applying the Core Principles the central bank should cooperate with other central banks and authorities.
Generally complied with
CP III CP VII CP VIII CP X Responsibility А
The system should have clearly defined risks management procedures. The system should ensure a high degree of security and reliability and have contingency arrangements for timely completion of daily payments processing. The methods of payments should be practical for its users and efficient for the economy. The procedures for managing the system should be efficient, accountable and transparent. The central bank should clearly define its objectives regarding the payment systems and disclose to the public its role and major policies with respect to the systemically important payment systems.
Source: developed based on the NBRB, IMF data.