financial stability report 40 - oenb
TRANSCRIPT

FINANCIAL STABILITYREPORT 40
Stability and Security.FIN
AN
CIA
L ST
ABI
LIT
Y R
EPO
RT 4
0 N
OV
EMBE
R 2
020
NOVEMBER 2020
OESTERREICHISCHE NATIONALBANKE U RO S Y S T EM

The OeNB’s semiannual Financial Stability Report provides regular analyses of Austrian and international developments with an impact on financial stability. In addition, it includes studies offering in-depth insights into specific topics related to financial stability.
Publisher and editor Oesterreichische NationalbankOtto-Wagner-Platz 3, 1090 ViennaPO Box 61, 1011 Vienna, [email protected] (+43-1) 40420-6666Fax (+43-1) 40420-046698
Editorial board Vanessa Redak, Doris Ritzberger-Grünwald, Martin Schürz, Markus Schwaiger
Coordinators Andreas Greiner, Stefan Kavan, Walter Waschiczek
Editing Joanna Czurda, Dagmar Dichtl, Ingrid Haussteiner, Ingeborg Schuch
Layout and typesetting Sylvia Dalcher, Andreas Kulleschitz
Design Information Management and Services Division
Printing and production Oesterreichische Nationalbank, 1090 Vienna
Data protection information www.oenb.at/en/dataprotection
ISSN 2309-7272 (online)
© Oesterreichische Nationalbank, 2020. All rights reserved.
May be reproduced for noncommercial, educational and scientific purposes provided that the source is acknowledged.
Printed in accordance with the Austrian Ecolabel guideline for printed matter.
Please collect used paper for recycling. EU Ecolabel: AT/028/024
REG.NO. AT- 000311

FINANCIAL STABILITY REPORT 40 – NOVEMBER 2020 3
Editorial close: October 28, 2020
Opinions expressed by the authors of studies do not necessarily reflect the official
viewpoint of the Oesterreichische Nationalbank or the Eurosystem.
Contents
Call for applications: Klaus Liebscher Economic Research Scholarship 4
Recent developmentsNonfinancial coporations and households in Austria severely hit by COVID-19 7
Austrian financial sector proves resilient to initial COVID-19 shock 14
Recommendations by the OeNB 18
Box 1: COVID-19-related support and relief measures for banks and their implications for financial stability 19
Special topics Nontechnical summaries in English 24
Nontechnical summaries in German 27
Austrian banks’ exposure to climate-related transition risk 31
Stefano Battiston, Martin Guth, Irene Monasterolo, Benjamin Neudorfer, Wolfgang Pointner
Green finance – opportunities for the Austrian financial sector 45
Andreas Breitenfellner, Susanne Hasenhüttl, Georg Lehmann, Andreas Tschulik
Modeling the COVID-19 effects on the Austrian economy and banking system 63
Martin Guth, Christian Lipp, Claus Puhr, Martin Schneider
The Austrian bank branch network from 2000 to 2019 from a spatial perspective 87
Helmut Stix
Annex: Key financial indicators 104

4 OESTERREICHISCHE NATIONALBANK
Call for applications: Klaus Liebscher Economic Research Scholarship
Please e-mail applications to [email protected] by the end of October 2021. Applicants will be notified of the jury’s decision by end-November 2021.
The Oesterreichische Nationalbank (OeNB) invites applications for the “Klaus Liebscher Economic Research Scholarship.” This scholarship program gives outstanding researchers the opportunity to contribute their expertise to the research activities of the OeNB’s Economic Analysis and Research Department. This contribution will take the form of remunerated consultancy services.
The scholarship program targets Austrian and international experts with a proven research record in economics and finance, and postdoctoral research experience. Applicants need to be in active employment and should be interested in broadening their research experience and expanding their personal research networks. Given the OeNB’s strategic research focus on Central, Eastern and Southeastern Europe, the analysis of economic developments in this region will be a key field of research in this context.
The OeNB offers a stimulating and professional research environment in close proximity to the policymaking process. The selected scholarship recipients will be expected to collaborate with the OeNB’s research staff on a prespecified topic and are invited to participate actively in the department’s internal seminars and other research activities. Their research output may be published in one of the department’s publication outlets or as an OeNB Working Paper. As a rule, the consultancy services under the scholarship will be provided over a period of two to three months. As far as possible, an adequate accommodation for the stay in Vienna will be provided.1
Applicants must provide the following documents and information:• a letter of motivation, including an indication of the time period envisaged for
the consultancy• a detailed consultancy proposal• a description of current research topics and activities• an academic curriculum vitae• an up-to-date list of publications (or an extract therefrom)• the names of two references that the OeNB may contact to obtain further infor-
mation about the applicant• evidence of basic income during the term of the scholarship (employment contract
with the applicant’s home institution)• written confirmation by the home institution that the provision of consultancy
services by the applicant is not in violation of the applicant’s employment contract with the home institution
1 We assume that the coronavirus crisis will abate in the course of 2021. We are also exploring alternative formats to continue research cooperation under the scholarship program for as long as we cannot resume visits due to the pandemic situation.

Financial stability means that the financial system – financial intermediaries, financial markets and financial infrastructures – is capable of ensuring the efficient allocation of financial resources and fulfilling its key macroeconomic functions even if financial imbalances and shocks occur. Under conditions of financial stability, economic agents have confidence in the banking system and have ready access to financial services, such as payments, lending, deposits and hedging.

FINANCIAL STABILITY REPORT 40 – NOVEMBER 2020 7
Recent developments
Nonfinancial corporations and households in Austria severely hit by COVID-19The measures adopted to contain the COVID-19 pandemic have sent Austria into the quickest and deepest recession in recent economic history. In the second quarter of 2020, Austrian GDP was down 14.3% year on year in real terms. The wide-ranging economic and social restrictions imposed to contain coronavirus abruptly changed the conditions under which businesses operate, causing a sharp drop in cash flow for many firms. Economic sectors were affected to varying degrees, with accommodation as well as the arts, entertainment and recreation having been hit hardest by the lockdown and social distancing (see Guth, M., C. Lipp, C. Puhr and M. Schneider (2020) in this publication). Falling demand, reduced capacity utilization and heightened uncertainties resulted in sharply reduced investment in the second quarter of 2020.
Beyond the COVID-19 impact, there have been risks on an interna-tional scale because of increased trade tensions between the U.S.A. and China and the uncertainties surrounding Brexit. Given the looming end of the Brexit transition period, the ongoing negotiations between the EU and the U.K. could be accompanied by increased market volatility. On a positive note, European fiscal support measures adopted in response to COVID-19 are set to boost growth. In particular, the impact of the debt financed extra-budget recovery fund (“Next Generation EU”) worth EUR 750 billion is likely to be amplified by higher than normal multipliers, as stimulus is expected to ease the particularly elevated macroeconomic uncertainty. The fund may even foster productivity when properly targeted to critical investment needs. On a negative note, the implementation of the fund and the regular long-term budget risk could be delayed since the final negotiations have been riddled with fundamental issues (rule-of-law conditionality) and require the consent of all national parliaments.
Profitability deteriorated amid the sharp contraction of economic activity. Gross value added of nonfinancial corporations fell by 19% year on year in real terms in the second quarter of 2020 and thus faster than the compensation of employees (–10%). However, due to a surge of production subsidies (by almost 900%) as a result of the various support measures (which, however, had not yet been completely disbursed in the second quarter), the gross operating surplus1 of Austrian nonfinancial corporations increased by 3.4% year on year in real terms. This rise also supported internal financing, the most important source of funds for Austrian nonfinancial corporations. That said, it must also be noted that the current figures do not reflect problems that still lie ahead.
External financing exclusively took the form of debt in the first half of 2020. Total external financing of Austrian nonfinancial corporations increased slightly against the same period of the year before, according to preliminary financial accounts data. While equity financing – which had already been rather subdued in the two years before – was negative in net terms at EUR –0.9 billion, as foreign investors reduced their investments in resident corporations, debt financing rose by 26% to EUR 17.3 billion, the highest half-year value recorded in more than two decades. Loans by domestic banks, whose share in debt financing had already been comparatively high in recent years, accounted for almost 40% of debt financing.
1 Including mixed income (self-employed and other nonincorporated businesses income).

Recent developments
8 OESTERREICHISCHE NATIONALBANK
Bank loans have been a central instrument for safeguarding the liquidity of companies during the COVID-19 pandemic. Responding to firms’ immediate liquidity needs, fiscal, prudential and monetary policies all aimed to uphold the flow of bank lending to the real economy. The government provided loan guarantees for bridging loans to Austrian enterprises. Prudential authorities supported the banking system in maintaining the flow of credit through several capital and operational relief measures. Moreover, the Eurosystem’s monetary policy eased banks’ refinancing conditions by implementing multiple instruments, including direct asset purchases (under the pandemic emergency purchase programme – PEPP) as well as lending operations, in particular targeted longer-term refinancing operations (TLTRO-III) to encourage banks to extend loans to the private sector. Thus, despite a substantial fall in corporate investment, loan growth slowed down only slightly against the high growth rates recorded in the years 2017 to 2019. In August 2020, the annual growth rate of MFI loans reached 6.3% (adjusted for securitization as well as for reclassifications, valuation changes and exchange rate effects, see left-hand panel of chart 1). In an environment of compressed cash flows, the growth in bank lending to firms was mainly driven by firms’ needs for working capital as well as the need to provide for possible liquidity shortages. Moreover, bank loans were strongly supported by public guarantees and loan moratoria, with the latter reducing repayments, thereby impacting loan growth.2
Net lending surged in the first two months of the pandemic but abated in the following months. In March and April 2020, when the crisis struck and firms tried to secure short-term funding, monthly net transactions3
2 For an overview of COVID-19-related moratoria and public guarantees, see the box “COVID-19-related support and relief measures for banks and their implications for financial stability.”
3 Changes in stocks adjusted for securitization as well as for reclassifications, valuation changes and exchange rate effects.
Annual change in %
Loans to nonfinancial corporations
12
10
8
6
4
2
0
–2
–4
–6
Annual change in %
Loans to households
12
10
8
6
4
2
0
–2
–4
–6
MFI loans to Austrian nonfinancial corporations and households
Chart 1
Source: OeNB.
Total Total Housing loansConsumer loans Other loans
Long-term loans (over 1 year)
2008 2010 2012 2014 2016 2018 2020 2008 2010 2012 2014 2016 2018 2020

Recent developments
FINANCIAL STABILITY REPORT 40 – NOVEMBER 2020 9
amounted to EUR 2.0 billion, against EUR 0.5 billion in the same months of the years 2018 and 2019, in which the growth of loans to nonfinancial corporations had been very buoyant. In May to August 2020, monthly net transactions fell to EUR 0.6 billion. Short-term loans (with a maturity of up to one year), which had made a large contribution to loan growth at the beginning of the COVID-19 pandemic, were repaid on a net basis from May 2020 onward. In contrast, the outstanding amount of medium- and long-term loans increased, to a large extent reflecting the scope of government guarantees given for bridging loans with medium-term maturities.
Credit standards for loans to enterprises were tightened slightly by Austrian banks in the third quarter of 2020, according to the Austrian r esults of the euro area bank lending survey (BLS). Yet, up to now the degree of tightening was less pronounced than during the great financial crisis of 2008–09 (GFC), which had introduced a period of relatively tight credit standards. Public loan guarantee schemes made it less risky for banks to lend to companies and compensated for deteriorating risk perception and lower risk tolerance. The share of rejected appli-cations for loans by enterprises, which had remained stable in the first half of 2020, also increased somewhat in the third quarter, according to the survey.
Credit conditions tightened somewhat since the outbreak of the pandemic. Between March and August 2020, interest rates on new loans to non-financial corporations rose on average by 10 basis points, the easing monetary policy stance notwithstanding. This likely reflected higher risk premia due to the economic impact of the pandemic on firms’ revenues. However, interest rates varied widely across different loan segments. While interest rates on larger loans (with a volume of more than EUR 1 million) rose, rates on smaller loans decreased. This was especially true for interest rates on loans with an interest fixation period of 1 to 5 years, which fell by 82 basis points between March and August 2020. This is typically the size and maturity bracket of guaranteed loans, for which risk considerations are less of a concern. The risk aspect was also reflected in the results of the BLS, where banks stated that in the first three quarters of 2020, interest margins on riskier loans to firms were widened to a larger extent than on loans with average risk (which had been observed already in the years before). Other terms and conditions, such as collateral requirements and loan cove-nants, were also tightened in the second and the third quarters, according to the survey.
Since the onset of the pandemic, nonfinancial corporations have built up substantial liquidity re-serves. On top of the loans disbursed to firms, banks provided additional liquidity in the form of new credit lines. In the period from March to August 2020, the monthly average of new credit lines granted to nonfinancial corporations was 7% above the 2018–19 average. However, as firms have so far made
EUR billion EUR billion
48
46
44
42
40
38
36
34
75
70
65
60
55
50
45
40
Indicators of Austrian nonfinancial corporations’ liquidity
Chart 2
Source: OeNB.
Undrawn credit lines (left-hand scale)Overnight deposits (right-hand scale)
2017 2018 2019 2020

Recent developments
10 OESTERREICHISCHE NATIONALBANK
only partial use of the credit lines granted to them, undrawn credit lines available to enterprises increased briskly in recent months, rising by 19% year on year in August 2020 (see chart 2). Additionally, firms’ transferable deposits continued to rise (by 17% in August 2020), to a large extent reflecting funds raised from banks and on the bond market which have not yet been spent.
Corporate bond issuance increased substantially since the beginning of the COVID-19 pandemic. In the period from April to August 2020, Austrian nonfinancial corporations raised close to EUR 6 billion in debt securities, which is almost half more than the net amount obtained via MFI loans, after debt securities issuance had decreased in the three previous years. This increase reflected financing needs, but also benefited from the narrowing of corporate bond spreads facilitated by the enhancement of the ECB’s securities purchase programmes, which include corpo-rate bonds. In the second quarter of 2020, net corporate bond issuance was equivalent to 54% of total external financing (after having been negligible in the first quarter). However, this form of finance was only used by a small number of large firms.
COVID-19 seriously affects the debt sustainability of Austrian com-panies. After the GFC, nonfinancial corporations successfully reduced the debt-to-income ratio by 23 percentage points from its peak in 2013 to 2018, although in the second half of 2019, the ratio already started to rise again (see left-hand panel of chart 4).4 In the first half of 2020, the corporate sector’s debt-to-income ratio surged by 13 percentage points to 324%, mainly as a result of rising debt. Looking ahead, while additional debt is essential to make up for lost revenues of firms, debt sustainability is bound to weaken over the medium and long term, especially in an environment of reduced corporate profits. The ensuing weakening of the corporate sector’s internal financing potential will not only diminish the funds available to service outstanding debt but also impede the buildup of equity through internal finance. At the same time, raising external equity in the current situation is seriously hampered by the bleak economic outlook. Thus, it will be crucial to facilitate the buildup of equity of Austrian enterprises, especially SMEs, as they constitute the majority of domestic enterprises.5
The interest burden of nonfinancial corporations remained low in the first half of 2020. The ratio of interest payment obligations for (domestic) bank loans to gross operating surplus remained stable at 3%, compared to more than 9% in 2008, the sizable increase of loan volumes notwithstanding. As the majority of guaranteed loans have medium-term interest rate fixation periods, the share of variable rate loans declined by 7.4 percentage points year on year to 77.4% in the second quarter of 2020.
Insolvency numbers have fallen significantly since the start of the pandemic, but there is a risk of catch-up effects as support measures will eventually be phased out. In order to protect companies from going
4 This measure follows Eurostat’s and the European Commission’s debt measures for the macroeconomic imbalance procedure (MIP) surveillance mechanism. It excludes pension scheme liabilities, which are not very significant in Austria, and other accounts payable, such as trade credit and other items due to be paid, mostly on a short-term basis. These items essentially constitute operational debt, i.e. liabilities that a firm incurs through its primary activities. Data are presented in consolidated terms, i.e. transactions within the corporate sector are not taken into account.
5 First steps in that direction have been a COVID-19 start-up support fund in the amount of EUR 50 million and a company established by the City of Vienna (also with an initial funding volume of EUR 50 million) aimed at investing equity into Vienna-based companies threatened by the COVID-19 pandemic.
EUR billion
14
12
10
8
6
4
2
0
–2
Net financial investment of households
Chart 3
Source: OeNB. 1 Debt securities, mutual fund shares and listed shares.2 Unlisted shares and other equity.3 Insurance contracts, pension entitlements, severance funds.
Currency and depositsCapital market instruments1
Direct equity holdings2
Insurance and pension schemes3
OtherTotal
H1 14 H1 15 H1 16 H1 17 H1 18 H1 19 H1 20

Recent developments
FINANCIAL STABILITY REPORT 40 – NOVEMBER 2020 11
only partial use of the credit lines granted to them, undrawn credit lines available to enterprises increased briskly in recent months, rising by 19% year on year in August 2020 (see chart 2). Additionally, firms’ transferable deposits continued to rise (by 17% in August 2020), to a large extent reflecting funds raised from banks and on the bond market which have not yet been spent.
Corporate bond issuance increased substantially since the beginning of the COVID-19 pandemic. In the period from April to August 2020, Austrian nonfinancial corporations raised close to EUR 6 billion in debt securities, which is almost half more than the net amount obtained via MFI loans, after debt securities issuance had decreased in the three previous years. This increase reflected financing needs, but also benefited from the narrowing of corporate bond spreads facilitated by the enhancement of the ECB’s securities purchase programmes, which include corpo-rate bonds. In the second quarter of 2020, net corporate bond issuance was equivalent to 54% of total external financing (after having been negligible in the first quarter). However, this form of finance was only used by a small number of large firms.
COVID-19 seriously affects the debt sustainability of Austrian com-panies. After the GFC, nonfinancial corporations successfully reduced the debt-to-income ratio by 23 percentage points from its peak in 2013 to 2018, although in the second half of 2019, the ratio already started to rise again (see left-hand panel of chart 4).4 In the first half of 2020, the corporate sector’s debt-to-income ratio surged by 13 percentage points to 324%, mainly as a result of rising debt. Looking ahead, while additional debt is essential to make up for lost revenues of firms, debt sustainability is bound to weaken over the medium and long term, especially in an environment of reduced corporate profits. The ensuing weakening of the corporate sector’s internal financing potential will not only diminish the funds available to service outstanding debt but also impede the buildup of equity through internal finance. At the same time, raising external equity in the current situation is seriously hampered by the bleak economic outlook. Thus, it will be crucial to facilitate the buildup of equity of Austrian enterprises, especially SMEs, as they constitute the majority of domestic enterprises.5
The interest burden of nonfinancial corporations remained low in the first half of 2020. The ratio of interest payment obligations for (domestic) bank loans to gross operating surplus remained stable at 3%, compared to more than 9% in 2008, the sizable increase of loan volumes notwithstanding. As the majority of guaranteed loans have medium-term interest rate fixation periods, the share of variable rate loans declined by 7.4 percentage points year on year to 77.4% in the second quarter of 2020.
Insolvency numbers have fallen significantly since the start of the pandemic, but there is a risk of catch-up effects as support measures will eventually be phased out. In order to protect companies from going
4 This measure follows Eurostat’s and the European Commission’s debt measures for the macroeconomic imbalance procedure (MIP) surveillance mechanism. It excludes pension scheme liabilities, which are not very significant in Austria, and other accounts payable, such as trade credit and other items due to be paid, mostly on a short-term basis. These items essentially constitute operational debt, i.e. liabilities that a firm incurs through its primary activities. Data are presented in consolidated terms, i.e. transactions within the corporate sector are not taken into account.
5 First steps in that direction have been a COVID-19 start-up support fund in the amount of EUR 50 million and a company established by the City of Vienna (also with an initial funding volume of EUR 50 million) aimed at investing equity into Vienna-based companies threatened by the COVID-19 pandemic.
EUR billion
14
12
10
8
6
4
2
0
–2
Net financial investment of households
Chart 3
Source: OeNB. 1 Debt securities, mutual fund shares and listed shares.2 Unlisted shares and other equity.3 Insurance contracts, pension entitlements, severance funds.
Currency and depositsCapital market instruments1
Direct equity holdings2
Insurance and pension schemes3
OtherTotal
H1 14 H1 15 H1 16 H1 17 H1 18 H1 19 H1 20
bankrupt, the obligation to file for bankruptcy due to overindebtedness was temporarily suspended. As a result, the number of insolvencies dropped by 46% in the second and third quarters of 2020, compared to the same period of the previous year. Other policy measures, such as loan guarantees and moratoria, which temporarily shielded firms from the economic effects of the pandemic have also contributed to this decline. Despite the considerable fall in the number of insolvency proceedings, total insolvency liabilities more than doubled in the second and third quarters of 2020 against the same period in 2019 to EUR 1.9 billion, reflecting a number of large bankruptcies. Yet, while COVID-19-related relief measures have so far helped mitigate liquidity shortages and thus avoid widespread bankruptcies, they have shifted insolvency risks into the future (and possibly also delayed the insolvency of unviable firms). Not only is there a danger of catch-up effects when bankruptcy relief measures will be phased out, but the deterioration of the economic environment might also touch off additional insolvencies, especially in industries hit particularly hard by the crisis. The sectors suffering the most severe output losses were the arts, entertainment and recreation as well as accommodation and food services industries, which, consequently, are expected to experience the largest increases in insolvency rates, according to the corporate insolvency model developed by the OeNB (see Guth, M., C. Lipp, C. Puhr and M. Schneider (2020) in this publication). Moreover, the increased borrowing that went along with a number of those policy measures may impair the future repayment capacity of enterprises, a situation which may be further aggravated by the fact that loans to industries that have been hit hardest by the crisis expanded most.
In the household sector, the COVID-19 pandemic has resulted in a sharp reduction of incomes. This concerned all types of income, from property income (–48% in the first half of 2020 compared to the same period of the year before) to self-em-ployment income6 (–5%) to employee compensation (–2.3%) amid a significant decrease in employment triggered by the economic downturn. Yet, govern-ment support for short-time work schemes and other government transfers had a stabilizing effect. Household con-sumption was affected by the lockdown in the spring more directly and to a larger extent than household income. Limited opportunities to consume and high uncertainties regarding future income increased precautionary saving. In real terms, consumption dropped by 16.1% year on year in the second quarter of 2020. Accordingly, the savings rate of
6 Operating surplus and mixed income.
Recent developments
12 OESTERREICHISCHE NATIONALBANK
households rose to 23% (not seasonally adjusted) in the second quarter of 2020 (compared to 15% in the same quarter of the preceding year).
Financial investment flows of households almost doubled in the first half of 2020. Mirroring the jump in the savings rate, households’ financial investment flows rose by 87% year on year to EUR 12.8 billion (see chart 3). Reflecting high uncertainty, liquid assets contributed two-thirds to this rise as households increased their cash holdings by EUR 1.4 billion and overnight deposits by EUR 7.3 billion. Other bank deposits were reduced by EUR 2.5 billion as the shift from time and saving deposits to overnight deposits continued.
Households’ capital market investment holdings have registered sizable valuation losses during the pandemic so far. In the first half of 2020, net financial investments in capital market instruments amounted to EUR 1.7 billion, the highest half-year value in almost a decade. Households reduced their direct holdings of debt securities but continued to invest in mutual fund shares and listed shares. Reflecting the massive price declines in national and international capital markets following the COVID-19 shock in spring 2020, households encountered (unrealized) valuation losses amounting close to EUR 15 billion in the first quarter of 2020. However, as capital markets recouped a significant share of these declines in the second quarter, financial assets recovered almost half of these losses so that the net effect on the securities portfolios of households was about EUR 8 billion, equivalent to 6.3% of the outstanding amount at the end of last year. By comparison, the cumulative effects of the GFC in 2008 had been significantly more pronounced, at EUR –19 billion. As the results of the Household Finance and Consumption Survey (HFCS) for Austria show, capital market investments are very much concentrated in the portfolios of higher-income households, which are in a better position to bear such valuation losses.7
After the onset of the pandemic, growth of lending to households decreased slightly. Between February and August 2020, the annual growth rate of bank loans to households slowed from 4.3% to 4.0% year on year (adjusted for reclassifications, valuation changes and exchange rate effects; see right-hand panel of chart 1). This moderation reflected uncertainties among households about the impact of the pandemic on their disposable income and employment prospects. Moreover, policy measures aimed at supporting the household sector were to a lesser extent channeled through the banking sector than support for the corporate sector; in the case of households, such measures mainly took the form of loan moratoria for persons who have suffered substantial cuts in incomes as a result of the pandemic. Like in the corporate loan segment, reduced repayments due to moratoria affected the volume of outstanding loans to households and thus growth rates. In line with the decrease in consumption of durables and the extraordinary fall in consumer confidence in the first half of 2020, consumer loans were down 3.0% year on year in August 2020. Other loans, which include loans to sole pro-prietors and unincorporated enterprises (which were eligible for loan guarantees), rose by 2.0%. As in past years, the main contribution to loan growth came from housing loans, not only because the latter are the most important loan category for households – accounting for more than two-thirds of the outstanding volume of
7 For instance, only 2.6% of households in the lowest income quintile but 18.4% in the highest income quintile own mutual fund shares. For stocks, the percentages are 1.6% and 11.3%, respectively.

Recent developments
FINANCIAL STABILITY REPORT 40 – NOVEMBER 2020 13
loans to households – but also because they registered the highest growth rate of all loan purposes, reaching 5.8% year on year in August 2020. According to the BLS, Austrian banks slightly tightened their credit standards for housing loans in the second and third quarters of 2020, as they had done throughout 2019, mainly because of the perception of increased risk and lower risk tolerance. At the same time, banks reported a slight increase in the demand for housing loans in the third quarter of 2020 (as in 2019 and the first quarter of this year).
The conditions for housing loans remained favorable. Interest rates on new bank loans fell by 5 basis points in the period from March to August 2020. Interest rates on housing loans fell by 16 basis points, while those on consumer loans rose by 55 basis points. BLS results show that banks’ margins for riskier housing loans were tightened in each of the first three quarters of this year but those for loans with an average risk profile were tightened only in the second quarter.
Debt sustainability of households did not deteriorate noticeably in the first half of 2020. Households’ debt-to-income ratio increased slightly – by 3.3 percentage points – to 91.5% against the year before, as disposable income receded while debt rose slightly. The loan moratoria for borrowers affected by COVID-19 eased the financial pressure on households that made use of this measure for the time being but might increase the burden of debt servicing once they expire. However, as is the case with financial assets, households that have taken out a loan tend to have higher incomes, according to HFCS 2017 data. About 21% of households in the lowest income quintile, but 46% of the highest income quintile had taken out a loan in 2017. Thus, a significant share of household debt is held by households that are more likely to have sufficient funds to service their loans. The share of variable rate loans (with an initial rate fixation period of up to one year) in new loans fell from 55% in the second quarter of 2019 to 47% in the second quarter of 2020 (see right-hand panel of chart 4). Foreign currency loans continued to be a risk factor despite having decreased further in the first half of 2020 to less than 8% of all outstanding loans (and to 10% of housing loans). The share of foreign currency loans in total new loans edged up from 0.8% in the first quarter to 0.9% in the second quarter of 2020.
% of gross operating surplusof nonfinancial corporations
% of disposable incomeof households
Debt1
335
330
325
320
315
310
305
100
95
90
85
Risk indicators for Austrian nonfinancial corporations and households
Chart 4
Source: OeNB, Statistics Austria.1 Debt of nonfinancial corporations is consolidated, i.e. transactions within the corporate sector are not taken into account.
Nonfinancial corporations Households
% of gross operating surplusof nonfinancial corporations
% of disposable incomeof households
Interest expenses
6
5
4
3
2
1
0
6
5
4
3
2
1
0
% of total new (euro-denominated) loans
Variable rate loans
120
100
80
60
40
20
02010 2012 2014 2016 2018 2020 2010 2012 2014 2016 2018 2020 2010 2012 2014 2016 2018 2020

Recent developments
14 OESTERREICHISCHE NATIONALBANK
Residential property prices in Austria rose further in the first half of 2020. In the second quarter of 2020, prices increased by 4.1% year on year. Especially prices for single-family houses have recorded pronounced increases since the onset of COVID-19 (possibly related to increased working from home and the lockdown experience in general). Given that remote working is assumed to continue to play a bigger role in the future, it is likely that there will be a shift from office to residential space, which, as a consequence, will change the price structure in both the commercial and residential real estate markets. The OeNB fundamentals indicator for residential property prices reached 16.8% in the second quarter of 2020. This signals that residential real estate price developments continue to deviate from the changes in the explanatory factors that the indicator tracks; this warrants continued close attention.8
Austrian financial sector proves resilient to initial COVID-19 shockAustrian banks’ resilience, which had increased substantially since the GFC, has remained strong despite the initial COVID-19 shock. In the first half of 2020, the consolidated common equity tier 1 (CET1) ratio of the Austrian banking system remained at 15.5%, as lending by Austrian banks continued to be strong and regulatory capital relief measures proved supportive. In this respect, the OeNB recommends that banks continue to focus on a solid capital base and take a careful approach regarding the distribution of profits.
Stress test results show a well-capitalized Austrian banking sector. Aggregate results suggest that the Austrian banking system is well positioned to weather the fallout of the pandemic. Thanks to government support, many of the expected corporate defaults could be avoided, which, in turn, has limited losses in banks’ equity. Even under the adverse scenario, the Austrian banking system remains well capitalized, with all significant institutions and most major less significant banks being more resilient now than during the GFC a decade ago.9
Traditional loan quality indicators have improved. However, as nonperforming loans (NPLs) are expected to rise, banks have started to increase provisioning. In the current situation, payment moratoria as well as fiscal and monetary measures supported a further improvement of loan quality ratios in the first half of 2020. The consolidated NPL ratio of the Austrian banking sector came down to 2.0%, nearly 20 basis points lower than at end-2019. For the domestic loan book, the NPL ratio improved to 1.5%. Those improvements were both driven by the inflow of new loans and the reduction in existing NPLs. However, the share of loans assigned to stage 210 according to IFRS 9 increased markedly, from 10% at end-2019 to 16% in June 2020. For corporate loans, this share even increased from 10% to 22%. This signals a deterioration in credit quality and, con-sequently, Austrian banks increased their loan loss provisioning. The consolidated coverage ratio rose by 74 basis points to nearly 50%. Proper credit risk provisioning at an early stage remains key to mitigate risks to financial stability both in Austria and foreign host markets.
8 For more information on the property market in Austria, see the latest edition of our quarterly publication “Immobilien aktuell” (available in German only) at https://www.oenb.at/Publikationen/Volkswirtschaft/immobilien-aktuell.html.
9 Detailed stress test results can be found from page 79.10 Stage 2 loans in the context of IFRS 9 are loans whose credit quality has deteriorated significantly since initial
recognition but offer no objective evidence of a credit loss event.
Recent developments
FINANCIAL STABILITY REPORT 40 – NOVEMBER 2020 15
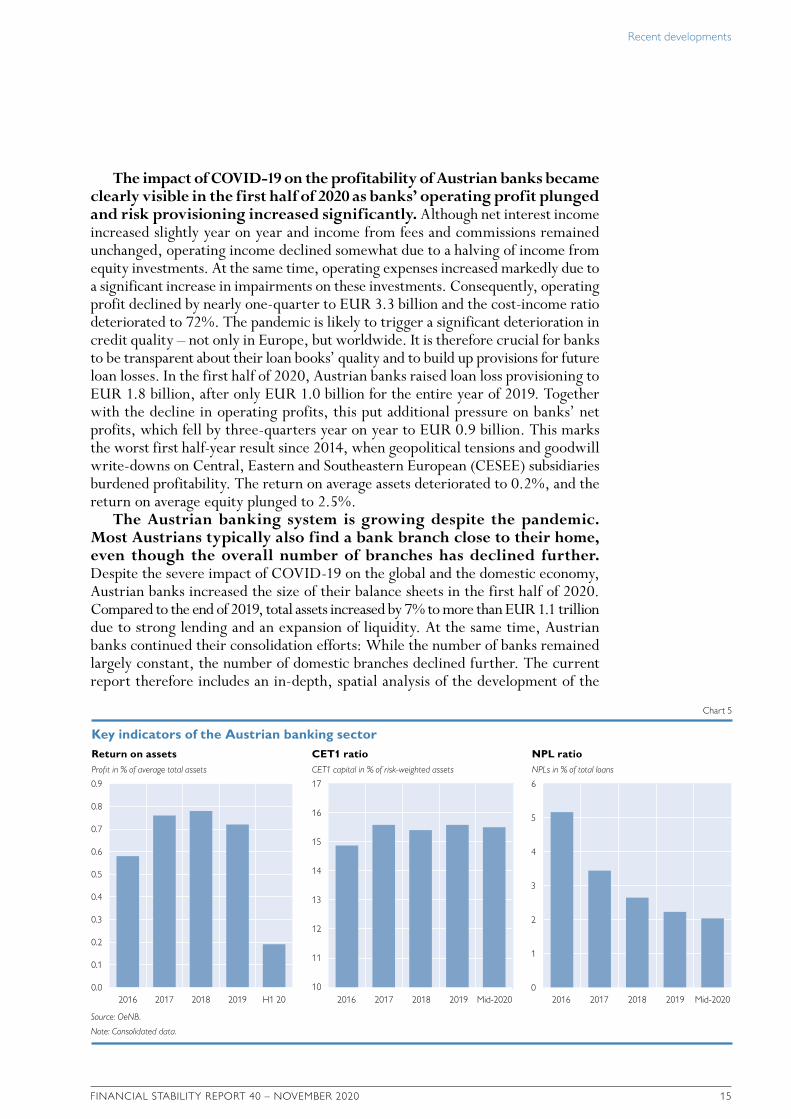
The impact of COVID-19 on the profitability of Austrian banks became clearly visible in the first half of 2020 as banks’ operating profit plunged and risk provisioning increased significantly. Although net interest income increased slightly year on year and income from fees and commissions remained unchanged, operating income declined somewhat due to a halving of income from equity investments. At the same time, operating expenses increased markedly due to a significant increase in impairments on these investments. Consequently, operating profit declined by nearly one-quarter to EUR 3.3 billion and the cost-income ratio deteriorated to 72%. The pandemic is likely to trigger a significant deterioration in credit quality – not only in Europe, but worldwide. It is therefore crucial for banks to be transparent about their loan books’ quality and to build up provisions for future loan losses. In the first half of 2020, Austrian banks raised loan loss provisioning to EUR 1.8 billion, after only EUR 1.0 billion for the entire year of 2019. Together with the decline in operating profits, this put additional pressure on banks’ net profits, which fell by three-quarters year on year to EUR 0.9 billion. This marks the worst first half-year result since 2014, when geopolitical tensions and goodwill write-downs on Central, Eastern and Southeastern European (CESEE) subsidiaries burdened profitability. The return on average assets deteriorated to 0.2%, and the return on average equity plunged to 2.5%.
The Austrian banking system is growing despite the pandemic. Most Austrians typically also find a bank branch close to their home, even though the overall number of branches has declined further. Despite the severe impact of COVID-19 on the global and the domestic economy, Austrian banks increased the size of their balance sheets in the first half of 2020. Compared to the end of 2019, total assets increased by 7% to more than EUR 1.1 trillion due to strong lending and an expansion of liquidity. At the same time, Austrian banks continued their consolidation efforts: While the number of banks remained largely constant, the number of domestic branches declined further. The current report therefore includes an in-depth, spatial analysis of the development of the
Profit in % of average total assets
Return on assetsCET1 capital in % of risk-weighted assets
CET1 ratioNPLs in % of total loans
NPL ratio
0.9
0.8
0.7
0.6
0.5
0.4
0.3
0.2
0.1
0.0
17
16
15
14
13
12
11
10
6
5
4
3
2
1
0
Key indicators of the Austrian banking sector
Chart 5
Source: OeNB.
Note: Consolidated data.
2016 2017 2018 2019 H1 20 2016 2017 2018 2019 Mid-2020 2016 2017 2018 2019 Mid-2020
Recent developments
16 OESTERREICHISCHE NATIONALBANK
Austrian bank branch network, which shows that around a quarter of all Austrian municipalities lacked a branch at the end of 2019. On average, however, Austrian bank customers travel only 1.5 kilometers to the nearest branch.11
Austrian banks’ foreign exposure increased further in the first half of 2020. Total assets of Austrian banking subsidiaries in CESEE (worth EUR 231 billion) continue to be concentrated in a handful of EU host markets. The foreign exposure of the Austrian banking system increased by 6% in the first half of 2020 to EUR 425 billion.12 Austrian banks expanded their activities for instance in the Czech Republic, Germany, Slovakia and France, and reduced business in Russia and Turkey. At the end of June 2020, the exposure to CESEE was nearly EUR 260 billion, somewhat higher than at end-2019. More than one-third of total assets in CESEE are located in the Czech Republic. Slovakia and the Czech Republic together account for more than half of all Austrian CESEE subsidiaries’ assets as at mid-2020. Other important markets are Romania, Hungary and Croatia, which means that the top 5 host countries are all EU Member States (see chart 6). When it comes to absolute profits in the first half of 2020, however, it is Russia that leads the ranking (a first since 2013), just slightly ahead of the Czech Republic, and Romania trailing by some distance (see chart 7).
In the first half of 2020, Austrian banking subsidiaries in CESEE earned EUR 0.9 billion, one-third less than during the same period of 2019. Given that operating income remained almost flat year on year and operating costs increased by 3%, operating profits declined to 1.8 billion (–5% year on year). Credit risk provisioning, however, soared from just EUR 77 million to EUR 625 million, reflecting both very low levels of credit risk before the COVID-19 pandemic as well as its initial impact. Consequently, the total profit of Austrian banking subsidiaries in CESEE dropped to EUR 0.9 billion in the first half of 2020. Despite its substantial decrease, this profit made a vital contribution to the Austrian banking system’s consolidated profitability.
At mid-2020, the NPL ratio of Austrian banking subsidiaries in CESEE was 2.3%, even slightly below the pre-COVID level of 2.4%. This decline was caused by stagnating NPL volumes in the first half of 2020, while the gross book value of loans rose by 4%. Credit quality at the subsidiaries continued to be highly heterogeneous, with subsidiaries in the Czech Republic reporting an aggregate NPL ratio of just 1.1%, while, e.g., the NPL ratio of subsidiaries in Croatia stood at 5.3%. The aggregate coverage ratio continued its upward trend and stood at 68%. However, as the pandemic has meanwhile also hit the CESEE region with full force, credit quality is expected to deteriorate markedly, which is already reflected in the large increase in credit risk provisioning.
The capitalization of Austrian banking subsidiaries in CESEE is solid and their funding situation balanced. At mid-2020, the aggregate CET1 ratio stood above 17% and the loan-to-deposit ratio at 77%. These solid levels bear testimony to past efforts of banks and their host and home supervisors to improve banking systems’ resilience and foster financial stability. Austrian banking subsidiaries in CESEE are better prepared to cope with the impact of the
11 A detailed analysis can be found in Stix, H. (2020) in this publication ( from p. 87).12 Foreign exposure is measured in terms of the ultimate risk of all Austrian banks (growth is not exchange rate
adjusted).
Total assets: EUR 231 billion
Total assets of Austrian banking subsidiaries in CESEE
Chart 6
Source: OeNB.
Note: Data as of mid-2020.
36%
15%11%
9%
8%
7%
14%
CZ SK RO HUHR RU Other
EUR billion
3.0
2.5
2.0
1.5
1.0
0.5
0.0
–0.5
.–1.0
–1.5
–2.0
Profit of Austrian banking subsidiaries in CESEE
Chart 7
Source: OeNB.
CZ SK RO HUHR RU Other
2009 2011 2013 2015 2017 2019 H119
H1 20

Recent developments
FINANCIAL STABILITY REPORT 40 – NOVEMBER 2020 17
pandemic than they were when dealing with the effects of the GFC. However, as the Austrian banking system’s profits depend to a great extent on the CESEE region, the slowdown in those economies will further burden its profitability.
Austria’s supervisory policy toolkit includes several macro-prudential capital buffers.13 The systemic risk buffer (SyRB) aims at mitigating noncyclical long-term risks, which emerge in the context of capital-ization, the banking sector’s size, the size of foreign exposures as well as banking group’s ownership and structure. The SyRB was implemented in early 2016 and has been activated for 13 Austrian banks on a consolidated level. The second macroprudential policy measure is a capital buffer for banks that are of sys-temic importance for Austria’s financial system (O-SII buffer). Third, there is the countercyclical capital buffer (CCyB), which stood at 0% in September 2020.
Thanks to the analytical work of the OeNB, Austria’s macropruden-tial policy is effective in mitigating systemic risks. During the COVID-19 pandemic, Austrian banks have at their disposal EUR 19 billion of macropruden-tial capital buffers to be used for absorbing losses and maintaining lending. The sys-tem’s resilience was increased further by retained profits as recommended by the Austrian Financial Market Authority (FMA), the OeNB and the Single Super-visory Mechanism (SSM). Macropruden-tial capital buffers also improve investors’ and rating agencies’ perception of Austrian banks, and, consequently, domestic banks benefit from better refinancing conditions compared to their peers. This will allow them to support the real economy over the next challenging quarters.
Currently, both the SyRB and the O-SII buffer are applicable and the higher of the two rates applies, but this will change by the end of 2020. The new Capital Requirements Directive V (CRD V), which is to be implemented
13 See https://www.fmsg.at/en for further details. In Austria, the countercyclical capital buffer will be maintained at 0% of risk-weighted assets in the absence of excessive credit growth. See FMSB recommendation 2/2020 (June 15, 2020).
Austrian bank branch network, which shows that around a quarter of all Austrian municipalities lacked a branch at the end of 2019. On average, however, Austrian bank customers travel only 1.5 kilometers to the nearest branch.11
Austrian banks’ foreign exposure increased further in the first half of 2020. Total assets of Austrian banking subsidiaries in CESEE (worth EUR 231 billion) continue to be concentrated in a handful of EU host markets. The foreign exposure of the Austrian banking system increased by 6% in the first half of 2020 to EUR 425 billion.12 Austrian banks expanded their activities for instance in the Czech Republic, Germany, Slovakia and France, and reduced business in Russia and Turkey. At the end of June 2020, the exposure to CESEE was nearly EUR 260 billion, somewhat higher than at end-2019. More than one-third of total assets in CESEE are located in the Czech Republic. Slovakia and the Czech Republic together account for more than half of all Austrian CESEE subsidiaries’ assets as at mid-2020. Other important markets are Romania, Hungary and Croatia, which means that the top 5 host countries are all EU Member States (see chart 6). When it comes to absolute profits in the first half of 2020, however, it is Russia that leads the ranking (a first since 2013), just slightly ahead of the Czech Republic, and Romania trailing by some distance (see chart 7).
In the first half of 2020, Austrian banking subsidiaries in CESEE earned EUR 0.9 billion, one-third less than during the same period of 2019. Given that operating income remained almost flat year on year and operating costs increased by 3%, operating profits declined to 1.8 billion (–5% year on year). Credit risk provisioning, however, soared from just EUR 77 million to EUR 625 million, reflecting both very low levels of credit risk before the COVID-19 pandemic as well as its initial impact. Consequently, the total profit of Austrian banking subsidiaries in CESEE dropped to EUR 0.9 billion in the first half of 2020. Despite its substantial decrease, this profit made a vital contribution to the Austrian banking system’s consolidated profitability.
At mid-2020, the NPL ratio of Austrian banking subsidiaries in CESEE was 2.3%, even slightly below the pre-COVID level of 2.4%. This decline was caused by stagnating NPL volumes in the first half of 2020, while the gross book value of loans rose by 4%. Credit quality at the subsidiaries continued to be highly heterogeneous, with subsidiaries in the Czech Republic reporting an aggregate NPL ratio of just 1.1%, while, e.g., the NPL ratio of subsidiaries in Croatia stood at 5.3%. The aggregate coverage ratio continued its upward trend and stood at 68%. However, as the pandemic has meanwhile also hit the CESEE region with full force, credit quality is expected to deteriorate markedly, which is already reflected in the large increase in credit risk provisioning.
The capitalization of Austrian banking subsidiaries in CESEE is solid and their funding situation balanced. At mid-2020, the aggregate CET1 ratio stood above 17% and the loan-to-deposit ratio at 77%. These solid levels bear testimony to past efforts of banks and their host and home supervisors to improve banking systems’ resilience and foster financial stability. Austrian banking subsidiaries in CESEE are better prepared to cope with the impact of the
11 A detailed analysis can be found in Stix, H. (2020) in this publication ( from p. 87).12 Foreign exposure is measured in terms of the ultimate risk of all Austrian banks (growth is not exchange rate
adjusted).
Total assets: EUR 231 billion
Total assets of Austrian banking subsidiaries in CESEE
Chart 6
Source: OeNB.
Note: Data as of mid-2020.
36%
15%11%
9%
8%
7%
14%
CZ SK RO HUHR RU Other
EUR billion
3.0
2.5
2.0
1.5
1.0
0.5
0.0
–0.5
.–1.0
–1.5
–2.0
Profit of Austrian banking subsidiaries in CESEE
Chart 7
Source: OeNB.
CZ SK RO HUHR RU Other
2009 2011 2013 2015 2017 2019 H119
H1 20

Recent developments
18 OESTERREICHISCHE NATIONALBANK
by the end of 2020, states that the two buffers will become additive. Given that this legal change comes at a time of high economic uncertainty, the Financial Market Stability Board (FMSB) recommended – subject to the transposition of the CRD V into Austrian law – that the size of the buffers be adjusted to prevent the effective buffer requirements from increasing between end-2020 and end-2022 just because of legal changes. Ultimately, this means that the overall buffer requirements have been left largely unchanged.14
The OeNB follows a comprehensive approach in macroprudential supervision, considering both crisis prevention and crisis resolution. This ensures consistency between macroprudential regulation, the resolution regime and the deposit guarantee schemes (DGSs). The OeNB performed a systemic risk analysis of the Austrian DGSs in 2017 and identified room for improvement. Together with the FMA, it called for reforms to improve the availability of alternative funding (beyond ex ante funds and ex post contributions). In 2020, the DGSs implemented such reforms. A recent OeNB systemic risk analysis has found that the DGSs have remained resilient and credible, despite a substantially reduced volume in a fund after two deposit insurance events in the first half of 2020.
Recommendations by the OeNBThe Austrian financial sector has weathered the COVID-19 pandemic well so far. However, reduced economic output, nonfinancial corporations’ higher debt burden as well as a rise in insolvencies are increasing medium-term risks to financial stability. Alongside persistent challenges from the low interest rate environment, deteriorating credit quality and rising provisioning needs have put downward pressure on banks’ profitability. More than half a year into the COVID-19 pandemic, legal and voluntary bank measures – such as debt repayment moratoria or the suspension of the obligation to file for insolvency in case of overindebtedness – have provided strong support for the real economy, but at the same time made it more complicated for banks, investors and supervisory authorities to assess risks. In these challenging times, the OeNB recommends that banks take the following measures:• In view of future credit risks and increased uncertainty: focus on a solid capital
base, i.e. avoid share buybacks and carefully consider profit distributions (dividends, management bonuses) in accordance with European recommendations.15
• Prepare for the time when public support measures in Austria and in CESEE expire and ensure transparency regarding the credit quality of loan portfolios.
• Apply sustainable lending standards in real estate lending, both in Austria and in CESEE, and comply with the quantitative guidance issued by the Financial Market Stability Board.
• Continue efforts to improve cost efficiency and operational profitability, even under the currently difficult circumstances.
• Further develop strategies to deal with the challenges of digitalization, new tech-nologies and cybersecurity, especially in light of the experience of the pandemic.
14 See FMSB recommendation 3/2020 (June 15, 2020).15 Please also refer to the ECB Single Supervisory Mechanism’s and the FMA’s information about COVID-19 measures
(https://www.bankingsupervision.europa.eu/home/search/coronavirus/html/index.en.html and https://www.fma.gv.at/en/covid-19/).

Recent developments
FINANCIAL STABILITY REPORT 40 – NOVEMBER 2020 19
Box 1
COVID-19-related support and relief measures for banks and their implications for financial stability16
Since March 2020, the Austrian government has put in place a number of measures to support the economy during the COVID-19 pandemic that also facilitate bank lending in difficult times. Parliament adopted a legislative moratorium on credit and interest payments due between April 1, 2020, and January 31, 2021, which offers household or micro- business borrowers suffering from COVID-19-related income losses the option to defer payments for a period of ten months and to extend loan tenors by the duration of the moratorium.17 Furthermore, the Austrian Financial Market Authority (FMA) notified the European Banking Authority (EBA) of a sector-wide nonlegislative moratorium, including (retrospective) deferrals in the period from March 15, 2020, to August 31, 2020. In addition, banks and their customers agreed bilaterally on voluntary individual forbearance measures. Also, the Austrian government created a COVID-19-related public guarantee scheme for newly originated loans: Eligible nonfinancial corporations can use guarantees to obtain bridge financing, thereby increasing their cash buffers.
By end-June 2020, Austrian banks had granted COVID-19-related payment extensions (including payment modifi-cations from other countries) in the amount of EUR 46 billion on a consoli-dated level.18 In Austria, payment deferrals in the amount of EUR 16 billion had been granted by Austrian banks by end-October (see chart 8), which corresponded to 4.5% of total outstanding credit to households and nonfinancial corporations or 1.6% of unconsol-idated total assets.19 This volume had declined from its EUR 31 billion peak in June as bank clients restarted servicing their debt and some payment extensions expired. At the same time, around 20,200 loans subject to COVID-19-related public guarantees totaling EUR 6 billion had been requested in Austria, representing around 10% of newly issued loans to nonfinancial corporations since the beginning of April.
To support the real economy and banks during these difficult times, the EBA has clarified in its guidelines20 of
16 Compiled by Stephan Fidesser, Ines Ladurner, Zofia Mrazova, Vanessa Redak, Christof Schweiger, Ralph Spitzer, Daniela Widhalm and Elisabeth Woschnagg.
17 The data used in this box do not allow an assessment of households’ and private companies’ degree of indebtedness.18 Based on data from regular supervisory reporting (FINREP) and the new reporting scheme defined in EBA Guideline
07/2020. Only limited data from this reporting were available at the time of writing. Please note that EBA reporting data are not directly comparable to the voluntarily reported data mentioned below due to differences in definitions, bank sample, consolidation level and observation period.
19 Austrian banks voluntarily report data to the OeNB about loans subject to the relief measures in Austria.20 EBA/GL/2020/02 (https://eba.europa.eu/regulation-and-policy/credit-risk/guidelines-legislative-and-non-legislae-
tive-moratoria-loan-repayments-applied-light-covid-19-crisis). The EBA phased out these guidelines by the end of September. The regulatory treatment set out in the guidelines will continue to apply to all payment holidays granted under eligible payment moratoria prior to September 30, 2020.
EUR billion Number of loans in thousand
35
30
25
20
15
10
5
0
250
200
150
100
50
0
Volume of loans subject to COVID-19-related payment deferrals in Austria by borrowers
Chart 8
Source: OeNB.
Note: Payment deferrals include the legislative moratorium, the sector-wide nonlegislative moratorium and voluntary individual forbearance measures.
Self-employedOther householdsNonfinancial corporationsTotal number (right-hand scale)
End-May
End-June
End-July
End-Aug.
End-Sept.
End-Oct.
28.630.6
25.123.2
17.3 15.6

Recent developments
20 OESTERREICHISCHE NATIONALBANK
April 2020 that payment deferrals under moratoria do not trigger a classification of these exposures as forborne or defaulted under distressed restructuring, provided the moratoria follow general principles. Importantly, it is crucial that the moratorium was launched in response to the COVID-19 pandemic and was applied before September 30, 2020. In addition, the measures taken need to be based on the applicable national law or on industry- or sector-wide private initiatives agreed and applied broadly by the relevant credit institutions. Measures meeting these principles are defined as “EBA-compliant.” EBA-compliant moratoria will interrupt day counting for the “90-days-past-due” criterion of the definition of default. However, institutions are still obliged to assess on a case-by-case basis the obligor’s unlikeliness to pay. The Austrian legislative moratorium as well as the sector-wide nonlegislative moratorium fall under the category “EBA-compliant.” Hence, banks are still in an early stage of including the impact of COVID-19 in their balance sheets.
Austrian banks are now more resilient than they were during the GFC. This is reflected in strong micro- and macroprudential capital buffers, modest levels of nonperforming loans (NPLs) and high coverage ratios. Banks can use the currently relatively favorable conditions for issuing debt instruments to further strengthen their liquidity and capital positions. In addition, Austrian banks have reduced their credit risk in recent years.21 Their exposure to nonfinancial corporations operating in Austrian industries most affected by the lockdowns and other contain-ment measures represents only 6% of the total loan volume (see Guth, M., C. Lipp, C. Puhr and M. Schneider (2020) in this publication for sectoral output losses in different scenarios). Payment extensions are overrepresented22 in the sectors hotels, restaurants and health ser-vices, and underrepresented in professional services, manufacturing and construction. Public guarantees have been granted to a higher extent not only to hotels and restaurants, but also to the trade, manufacturing and construction sectors.
The COVID-19 pandemic will have negative effects on Austrian banks’ profit-ability, in particular when the relief measures expire. While an effect on NPL ratios is not yet visible, the share of loans assigned to stage 2 according to IFRS 923 increased markedly in the first half 2020.
In a hypothetical scenario in which half of the exposures currently covered by relief measures24 in Austria and abroad default, NPLs would increase markedly.25 However, such estimates must be interpreted with caution: First, they represent an extreme scenario, assuming that half of the borrowers currently benefiting from relief measures default. Second, an increase in the NPL stock does not directly translate into provisions, as parts of this portfolio are collateralized or have already been provisioned for. Third, it can be assumed that an increase in the NPL stock may occur not at once in 2020; instead, it may stretch over a certain period, also given the different phaseout of the support measures. In this adverse scenario, NPLs of the Austrian banking sector could potentially increase to EUR 44 billion (compared to EUR 16.4 billion currently), with an associated consolidated NPL ratio of around 6% (currently 2.1%, at a 50% coverage ratio).
Risk provisions in response to deteriorating loan quality will be burdening profitability in the upcoming months. The cost of risk26 (CoR) for the consolidated Austrian banking sector increased sharply from 13 basis points at end-2019 to 46 basis points in June 2020. At the same time, the CoR is still below the average of domestic banks’ European peers
21 Kerbl, S. and K. Steiner. 2020. Austrian banks’ lending risk appetite in times of expansive monetary policy and tightening capital regulation. In: Financial Stability Report 39. OeNB. 88–109.
22 I.e. in relation to their share in the total loan volume not subject to either measure.23 Stage 2 loans in the context of IFRS 9 are loans that have deteriorated significantly in credit quality since initial
recognition but offer no objective evidence of a credit loss event.24 These include exposures subject to COVID-19-related payment extensions, forborne exposures not subject to
COVID-19 measures and the uncollateralized exposure of loans subject to COVID-19 guarantees by end-June 2020. 25 This simple scenario is not meant to substitute fully-fledged and more complex scenario analyses (see Guth, M., C. Lipp,
C. Puhr and M. Schneider (2020) in this publication).26 Cost of risk is measured as annual risk provisions built up relative to gross total loans.

Recent developments
FINANCIAL STABILITY REPORT 40 – NOVEMBER 2020 21
(55 basis points for Austrian signif icant institutions as compared to the SSM average of 72 basis po ints) and has remained at low levels in the past years (the average between 2014 and 2019 was 35 basis points). If half of the loan book subject to relief measures in Austria and abroad as of June 2020 turned nonperforming and if banks maintained their current coverage ratio, the CoR would be slightly above 200 basis points. Thus, the CoR would be higher than the 2009 peak of 130 basis points. However, such an increase is unlikely to materialize within one year; rather, it will occur over a certain period. The actual annual level would therefore be much lower. Banks have taken different approaches to dealing with COVID-19-related credit risks, with some already frontloading risk provisions in the first half of 2020 to cover an expected rise in defaults amid a rise in unemployment and corporate bankruptcies. These differences in timing can contribute to smoothing risks and the negative impact on profitability over time.
Given the sequential phaseout of public support measures, there seems to be a low probability of cliff effects in the form of high, suddenly occurring losses in the banking sector in the near future, while medium-term risks appear to be more likely. A marked deterioration in credit quality caused by the pandemic is expected in the medium term. Still, this assessment is subject to a high level of uncertainty. In the short term, there will be a double catch-up effect: First, a regular effect in insolvency filings that would take place even in the absence of a crisis but which are currently postponed due to payment deferrals as well as the partial suspension of insolvency law. Second, and in addition, there will be a crisis-induced effect, i.e. additional insolvencies due to COVID-19 (see page 73 ff. for insolvency numbers and the scenario analysis in Guth, M., C. Lipp, C. Puhr and M. Schneider (2020) in this publication). In the medium-term, we see a risk of additional defaults due to the global decrease in demand, consequences of the second lockdown triggered by the second wave of infections, delayed defaults and potentially long-lasting structural changes (e.g. in tourism and transport). With a view to maintaining transparency in banks’ balance sheets and allowing banks to conduct proper risk management, payment moratoria should be phased out or adjusted and replaced by more selective measures targeting specific sectors.
What remains key is adequate risk provisioning by banks at an early stage (including moving from generic risk provisioning to an approach more targeted at individual customers) as well as forward-looking action as regards the allocation of profits. Banks are expected to duly monitor their loan exposures challenged by COVID-19. Clients’ short-term liquidity challenges may become long-term financial difficulties and should therefore be seen as an early warning indicator. Transparent reporting of the development of credit quality is important to be able to assess the impact of support measures on banks’ balance sheets and, hence, to maintain confidence in the banking sector. In addition, profit allocation that focuses on strengthening the capital base remains key, especially as the impact of the second lockdown is difficult yet to assess.

Special topics

24 OESTERREICHISCHE NATIONALBANK
Nontechnical summaries in English
Austrian banks’ exposure to climate-related transition riskStefano Battiston, Martin Guth, Irene Monasterolo, Benjamin Neudorfer, Wolfgang PointnerClimate change poses several risks to the value of financial assets and to financial stability. In this study, we estimate the exposure of the Austrian banking sector to climate risks that might arise from a disorderly transition from an econ-omy largely based on fossil fuel-driven energy sources to a carbon-neutral economy.
To this end, we identify climate policy-relevant sectors (CPRSs), i.e. sectors which are particularly sensitive to these transition risks, and categorize them as follows: (1) fossil fuels, (2) utilities, (3) energy-intensive sector, (4) buildings, (5) transportation, and (6) agriculture. In a next step, we analyze data on outstanding credits and bonds held by Austrian banks. In total, about 26% of the assets held by Austrian banks, or EUR 228 billion, are exposed to the six abovementioned CPRSs. Climate risks could result from disruptive changes in climate policies, technological break-throughs or shocks triggered by changes in demand. Banks’ exposure to fossil fuels and utilities appears limited; the buildings sector accounts for the lion’s share of banks’ exposure to CPRSs. We break down our results by various bank characteristics, namely bank size, banking sector, banks’ geographical location and by instruments used. Bonds deemed to be green by stock exchanges amount to 2% of all outstanding bonds. However, we do not see any concentrations in specific segments of Austrian banks’ bond holdings.
We conclude that the Austrian banking sector’s direct exposure to CPRSs seems to be comparable to that seen in other countries. However, some banks are particularly exposed to climate transition risk. Thus, this risk should be generally on banks’ radar and monitored closely for supervisory purposes. We also found that a thorough analysis considering individual asset characteristics is still difficult for lack of more detailed data.
Green finance – opportunities for the Austrian financial sectorAndreas Breitenfellner, Susanne Hasenhüttl, Georg Lehmann, Andreas TschulikClimate change and the internationally agreed transition of the global economy from fossil to renewable energy sources not only pose risks to the financial sector and the economy but also open up opportunities. Central banks and financial supervisors, as a rule, focus on the risks since they are, among other things, responsible for safeguarding financial stability. In finance – and not only there – risks go hand in hand with potential benefits. To get a better grasp of the potential offered by green or sustainable financing, we take a closer look at Austria’s green finance markets.
We start out by identifying how much investment is needed at the global, European and Austrian level to fund a transition to a carbon-free economy. In Austria, annual investment needs will come to some EUR 17 billion between 2021 and 2030 according to the Austrian government’s national energy and climate plan. Public funding alone will not suffice to meet this sizable demand. In addition, private capital will have to be increasingly mobilized for funding sustainable projects. To this end, green finance will have to break out of its niche and scale up. Though very dynamic, the development of Austria’s green finance markets is still sobering. The Austrian market for sustainable finance pro-ducts is, indeed, underdeveloped by international standards, it is dominated by mutual funds and driven by institutional, and not by private, investors. Depending on the definition of green finance, such holdings in Austria amount to EUR billion figures in the low double digits. This, however, merely translates into a low single-digit share in total financial wealth. And even this share may not necessarily reflect only climate-friendly investments as the commonly used umbrella term also covers social and governance aspects apart from narrowly defined green finance (environmental – social – governance, ESG).
While customers’ awareness of sustainable finance products is still low, demand will continue to pick up in future judging from surveys on customer preferences. Transparency has yet to be increased as the absence of common defini-tions of sustainability may give rise to “greenwashing,” i.e. making misleading claims about the environmental sustain-ability of a financial product. To prevent this, regulators and supervisors should help overcome market barriers and dysfunction on the supply and demand side. Several measures can support this, e.g. drawing up common definitions for sustainable finance products, raising their profile, advancing harmonization, offering certification and imposing mandatory disclosure rules as well as providing financial advice and education. Noteworthy efforts in this respect are the European Commission’s action plan on sustainable finance, the announcement of the European Central Bank of

Nontechnical summaries in English
FINANCIAL STABILITY REPORT 40 – NOVEMBER 2020 25
paying greater attention to climate issues and the Austrian government’s green finance agenda. In the same vein, independent ecolabels and online platforms provide good quality information about sustainable finance products.
All in all, green finance may only complement, but not replace, legislation that reflects a broad consensus of all economic stakeholders. Predefining a credible pathway for linking carbon pricing to internationally agreed greenhouse gas emission targets would probably be the most effective – and least distorting – way to foster green finance and a smooth transition. After all, the overarching aim is to redress market failure and internalize external costs in line with the polluter pays principle. This way, economic agents get ample lead time to brace themselves for predefined price increases for emitting carbon dioxide (equivalents). Given planning certainty, suitable incentives can drive the funding of an orderly transition to a carbon-neutral economy.
Modeling the COVID-19 effects on the Austrian economy and banking systemMartin Guth, Christian Lipp, Claus Puhr, Martin Schneider To date, the COVID-19 pandemic has taken a high toll on society in general and economic activity in particular. While saving lives, the measures taken worldwide to contain the spread of the novel coronavirus, have also led to the largest peacetime economic shock since the Great Depression. To cushion the blow to companies and households, governments around the globe have adopted various mitigating measures. In this paper, we examine the effects of both the contain-ment and mitigating measures on the Austrian economy and banking system. Our aim is to quantify the COVID-19-related impact on corporations and banks in Austria to project developments for a three-year horizon.
To this end, we have developed a corporate insolvency model that helps us assess Austrian incorporated firms’ liquidity and solvency. In light of their substantial revenue losses, we may thus gauge their ability to meet their payment obligations, such as bills and salaries, in the short and in the long run. Based on macroeconomic scenarios and simulated firm-level data, we calculate insolvency rates for 17 economic sectors for the years 2020, 2021 and 2022. We then feed these insolvency rates into the OeNB’s stress testing model, which serves to evaluate the effects that extreme situations may have on Austrian banks. This analysis allows us to project the implications of various insolvency scenarios both on individual banks and on the banking sector as a whole.
Our corporate insolvency model points to a strong increase in potential COVID-19-related insolvencies in the forecasting period. However, the government’s mitigating measures help to substantially reduce the risk of insolvency, above all in the hardest-hit sectors, namely “arts, entertainment and recreation” and “accommodation and food service activities.” In addition, the Austrian banking sector indirectly benefits from the government’s support for businesses as banks suffer lower credit losses. In the baseline scenario, which reflects a “no policy change” scenario and is the starting point for our projections, both the Austrian banking system and individual banks prove resilient to the COVID-19 impact. The same is more or less true for the adverse scenario, which simulates a worst-case scenario; several smaller banks could, however, run into difficulties. Our model analysis shows that the Austrian banking system should be in a position to cope with the expected increase in corporate insolvencies, not least thanks to the Austrian government’s generous mitigating measures supporting the real economy, i.e. production, sales and consumption. However, from today’s perspective, a significant worsening of the situation due to the COVID-19 pandemic could change this assessment.
The Austrian bank branch network from 2000 to 2019 from a spatial perspectiveHelmut StixThroughout the past decades retail banks in many countries, including Austria, have downsized their branch networks. This paper provides disaggregated information on the spatial distribution of the bank branch network in Austria and aims to establish benchmarks for assessing future changes in the branch network. Specifically, we use a geolocation dataset of Austrian bank branches from January 2000 to December 2019 to study two questions: (1) How many and which municipalities have no bank branch? How did this number change over time? (2) What is the average distance for Austrians to their closest bank? Which geographical areas have limited access?
Results show that 555 municipalities (27% of 2,096 Austrian municipalities) did not have a bank branch at the end of 2019, which compares with 271 municipalities in January 2000. We show that the bulk of the increase in “branchless” municipalities occurred after 2014. Among the 555 municipalities without a bank branch, 305 still had a bank branch

Nontechnical summaries in English
26 OESTERREICHISCHE NATIONALBANK
in 2000, which, however, closed in the years to 2019. The closure of the last branch in a municipality occurred predo-minantly in municipalities with fewer than 2,000 inhabitants; overall, only a relatively small share of the Austrian population (4.6% or 410,000 inhabitants) live in municipalities that became branchless.
Having said this, we look into the distance Austrians have to travel from their home to reach the nearest bank branch (as at end-2019). We find that this distance varies from 2.7 km in municipalities with fewer than 2,000 inhabi-tants to 0.7 km in larger cities. On average, Austrian residents travel 1.5 km to the closest branch. A total of 77% of the population resides within a travel distance of 2 km from a bank branch. Our results suggest that on average across the entire country, Austrians’ access to bank branches can be considered reasonable. However, a more disaggregated analysis also identifies municipalities for whose residents travel distances are longer. For example, about 433,000 resi-dents (or 4.9% of the population) have to travel more than 5 km to the closest bank branch. Municipalities with a high share of residents who travel farther than 5 km have, on average, 1,000 inhabitants and are located in all provinces (except Vienna).
Survey information indicates that a very high share of Austrians is satisfied with their access to bank branches. Satisfaction is even high in rural areas where people have to travel longer distances, which suggests that bank clients do not perceive somewhat longer distances to be problematic. Moreover, 6 out of 10 Austrians aged 14 or older use online banking services and visit bank branches only occasionally. Accordingly, we suspect that longer travel distances are problematic mainly for – mostly older – people that do not use digital banking and payment products.
The results established in this study can be used to analyze such questions, i.e. by combining the results on travel distances with data from other sources (e.g. information on the socio-economic structure of municipalities, surveys on the take-up of digital banking products). This would allow identifying areas where bank clients’ access is unsatisfactory from their perspective and developing a framework for defining threshold values for physical access.

FINANCIAL STABILITY REPORT 40 – NOVEMBER 2020 27
Nontechnical summaries in German
Österreichische Banken und die Risiken des KlimawandelsStefano Battiston, Martin Guth, Irene Monasterolo, Benjamin Neudorfer, Wolfgang PointnerDer Klimawandel bringt einige Risiken mit sich, die den Wert von Finanzanlagen und die Finanzstabilität beeinträchtigen können. Die Umstellung der Wirtschaftsproduktion von fossilen Brennstoffen auf erneuerbare Energieträger kann, wenn sie ungeordnet abläuft, zu so genannten Übergangs- oder Transitionsrisiken des Klimawandels führen. Ziel dieser Studie ist es, eine Einschätzung darüber abzugeben, wie stark der österreichische Bankensektor derartigen Risiken ausgesetzt ist.
In einem ersten Schritt identifizieren wir jene Wirtschaftssektoren, die vom Klimawandel besonders betroffen sind, und teilen sie in folgende Kategorien ein: (1) fossile Brennstoffe, (2) Energieversorger, (3) energieintensive Aktivitäten, (4) Gebäude, (5) Transport und (6) Landwirtschaft. In einem nächsten Schritt analysieren wir Daten zu aushaftenden Bankkrediten und von Banken gehaltenen Anleihen. Insgesamt sind etwa 26 % der Finanzanlagen der österreichischen Banken, also 228 Mrd EUR, den sechs oben genannten Sektoren zuzuordnen. Auslöser für Übergangsrisiken könnten disruptive Änderungen in der Klimapolitik, technologische Innovationen oder nachfrageseitige Schocks sein. Während sich das Engagement der Banken in den Bereichen fossile Brennstoffe und Energieversorger in Grenzen zu halten scheint, entfällt der Großteil der von Klimarisiken gefährdeten Anlagen auf den Gebäudesektor. Wir schlüsseln unsere Ergebnisse nach unterschiedlichen Bankcharakteristika auf: Bankengröße, Bankensektor, geografischer Lage der Bank sowie Finanzinstrumenten. Von Börsen als nachhaltig eingestufte Anleihen machen 2 % der aushaftenden Anleihen aus. Eine Clusterbildung in bestimmten Segmenten des Anleiheportfolios der österreichischen Banken ist nicht erkennbar.
Unserer Einschätzung zufolge zeigt das direkte Engagement des österreichischen Bankensektors in Bereichen, die Klimarisiken ausgesetzt sind, im Ländervergleich keine Auffälligkeiten; allerdings sind einige Banken erhöhten Transi-tionsrisiken ausgesetzt. Daher sollte dieses Risiko allgemein sowohl von den Banken als auch von der Bankenaufsicht beobachtet werden. Zudem kamen wir zu dem Fazit, dass eine tiefer gehende Analyse, in der individuelle Anlagefaktoren berücksichtigt werden, noch stärker aufgeschlüsselter Bankdaten bedarf.
Green Finance – Chancen für den österreichischen FinanzsektorAndreas Breitenfellner, Susanne Hasenhüttl, Georg Lehmann, Andreas Tschulik Der Klimawandel und der international vereinbarte Umstieg der Weltwirtschaft von fossilen auf erneuerbare Energie-quellen bergen sowohl Risiken als auch Chancen für den Finanzsektor und die Wirtschaft. Für gewöhnlich stehen Risiken im Fokus der Zentralbanken und Aufsichtsbehörden, da ihr Mandat die Überwachung der Finanzmarktstabili-tät einschließt. Gerade im Finanzmarkt können Risiken aber auch mit Ertragschancen verbunden sein, weshalb wir in dieser Studie die Entwicklung und das Potenzial grüner bzw. nachhaltiger Finanzierungen („Green Finance“) analysieren.
Zunächst beleuchten wir, wie viel auf globaler bzw. europäischer und österreichischer Ebene investiert werden muss, um für einen Übergang zu einer kohlenstofffreien Wirtschaft zu sorgen. In Österreich sieht der nationale Energie- und Klimaplan der Regierung zwischen 2021 und 2030 Investitionsausgaben von jährlich rund 17 Mrd EUR vor. Diese enorme Herausforderung lässt sich nicht allein durch öffentliche Mittel bewältigen. Daher sollen auch verstärkt private Mittel in nachhaltige Projekte fließen. Um die nötige Größenordnung zu erreichen, muss jedoch Green Finance aus seiner derzeitigen Nische herauswachsen. Vor diesem Hintergrund erscheint die – wenn auch sehr dynamische – Entwicklung der grünen Finanzmarktsegmente in Österreich eher ernüchternd. Der österreichische Green-Finance-Markt ist inter-national betrachtet unterentwickelt und wird von Investmentfonds sowie eher von institutionellen als privaten Investoren dominiert. In Österreich belaufen sich die Bestandsgrößen nachhaltiger Finanzierungsinstrumente je nach Definition auf bis zu niedrige zweistellige Milliardenbeträge. Ihr Anteil am Gesamtvermögen der Volkswirtschaft liegt jedoch in einem niedrigen einstelligen Prozentbereich. Und selbst darin ist der Anteil tatsächlich klimaschonender Investitionen unbestimmt; der marktübliche Überbegriff fasst nämlich die Schwerpunkte Umwelt, Soziales und Kontrollstrukturen (Environmental – Social – Governance, kurz ESG) zusammen.
Umfragen zeigen zwar einen geringen Bekanntheitsgrad nachhaltiger Finanzprodukte in der Bevölkerung, jedoch sind die angegebenen Präferenzen von Kundinnen und Kunden ein Hinweis darauf, dass die Nachfrage hier weiter rasch steigen wird. Ein Problem stellt jedoch die teilweise mangelnde Transparenz dar: Finanzprodukte werden mitunter als nachhaltig beworben, obwohl sie dies nur unzureichend sind (Stichwort „Greenwashing“). Konsequenterweise greifen

Nontechnical summaries in German
28 OESTERREICHISCHE NATIONALBANK
Regulierungs- und Aufsichtsbehörden ein, um Marktbarrieren bzw. Funktionsstörungen in Angebot und Nachfrage abzubauen. Taugliche Mittel dazu sind etwa die Festlegung einheitlicher Definitionen für nachhaltige Finanzprodukte, Erhöhung der Sichtbarkeit, Standardisierung, Zertifizierung oder Verpflichtungen zur Offenlegung sowie Kundenbera-tung und Finanzbildung. In diesem Sinne sind etwa folgende Initiativen zu begrüßen: der Aktionsplan zur Finanzierung nachhaltigen Wachstums der Europäischen Kommission, die stärkere Berücksichtigung von Klimaaspekten durch die Europäische Zentralbank (EZB) sowie die Green Finance Agenda der österreichischen Regierung. Aber auch unabhängige Siegel und Informationsplattformen tragen zur Transparenz nachhaltiger Finanzprodukte bei.
Insgesamt ergänzt Green Finance jedoch lediglich die notwendigen Bemühungen der Gesetzgeber, die Wirtschaft auf breitem Konsens nachhaltig zu gestalten. Die vermutlich effektivste und am wenigsten wettbewerbsverzerrende Förderung klimafreundlicher Finanzierung ist eine angemessene Bepreisung von Treibhausgasemissionen. Schließlich geht es darum, ein Marktversagen zu beheben und externe Kosten den Verursachern zuzuordnen. Die Wirtschafts-akteure sollten sich dabei auf langfristig geplante Preissteigerungen von CO2(-Äquivalenten) einstellen können, die mit den international festgelegten Treibhausgasemissionszielen vereinbar sind. Sofern Planungssicherheit besteht, können die richtigen Anreize Triebfeder für die Finanzierung eines geordneten Übergangs zur klimaneutralen Wirtschaft sein.
Modellierung der Auswirkungen von COVID-19 auf Österreichs Wirtschaft und BankensystemMartin Guth, Christian Lipp, Claus Puhr, Martin Schneider Die COVID-19-Pandemie führte zu einer Ausnahmesituation mit tiefgreifenden Folgen für Gesellschaft und Wirtschaft. Die weltweit ergriffenen Maßnahmen zur Eindämmung des Coronavirus retteten Leben, führten aber gleichzeitig zum größten wirtschaftlichen Schock seit der Großen Depression. Um die Beschränkungen im Wirtschaftsleben für betroffene Unternehmen abzufedern, wurden rund um den Globus verschiedene Hilfsmaßnahmen beschlossen, so auch in Öster-reich. In der vorliegenden Analyse untersuchen wir, wie sich diese auf die Wirtschaft und das Bankensystem in Österreich ausgewirkt haben. Ziel ist es, die coronabedingten Folgen in aussagekräftige Kennzahlen zu übersetzen und weitere Entwicklungen vorherzusagen.
Zu diesem Zweck hat die OeNB ein Unternehmensinsolvenzmodell entwickelt, mit dessen Hilfe Aussagen über die Liquidität und Solvenz österreichischer Kapitalgesellschaften getroffen werden sollen. Also darüber, ob die Unternehmen angesichts massiver Umsatzeinbrüche ihre Verbindlichkeiten wie offene Rechnungen und Gehälter sowohl vorübergehend als auch längerfristig bezahlen können. Gestützt auf gesamtwirtschaftliche Szenarien und simulierte Unternehmens-daten errechnen wir für 17 volkswirtschaftliche Sektoren Insolvenzraten für einen dreijährigen Prognosehorizont von 2020 bis 2022. Diese Daten fließen in der vorliegenden Analyse in das OeNB-Stresstestmodell ein, mit dessen Hilfe die Auswirkungen krisenhafter Entwicklungen auf die österreichischen Banken beurteilt werden. Dank dieser Unter-suchung können wir die Folgen verschiedener Insolvenzszenarien sowohl für einzelne Banken als auch für das gesamte Bankensystem einschätzen.
Unser Modell zeigt eine starke Zunahme durch COVID-19 bedingter potenzieller Insolvenzen im Prognosezeit-raum. Mithilfe staatlicher Hilfsmaßnahmen konnte und kann die drohende Zahlungsunfähigkeit – vor allem in den am stärksten in Bedrängnis geratenen Sektoren „Kunst, Unterhaltung und Erholung“ und „Beherbergung und Gastrono-mie“ – jedoch substanziell reduziert werden. Dies gilt indirekt auch für das österreichische Bankensystem, das von der staatlichen Unterstützung für Unternehmen durch weniger Kreditausfälle profitiert. Im Baseline-Szenario, das ein wahrscheinliches Szenario widerspiegelt, zeigen sich sowohl das österreichische Bankensystem insgesamt als auch die Einzelbanken eindeutig krisenfest. Auch das eine Extremsituation simulierende adverse Szenario übersteht das Banken-system ohne größere Komplikationen, wiewohl es bei vereinzelten kleineren Banken zu Problemen kommen kann. Insgesamt zeigt die Modell-Analyse jedoch, dass das österreichische Bankensystem – nicht zuletzt dank der relativ gut dotierten österreichischen Hilfsmaßnahmen für die Realwirtschaft (d. h. für Produktion, Vertrieb und Konsum) – in der Lage sein sollte, den erwarteten Anstieg der Insolvenzen zu bewältigen. Eine deutliche weitere Verschärfung der Situation aufgrund der COVID-19-Pandemie könnte allerdings aus heutiger Sicht dieses Bild verändern.

Nontechnical summaries in German
FINANCIAL STABILITY REPORT 40 – NOVEMBER 2020 29
Wie weit bis zur nächsten Bank? Die Entwicklung des österreichischen Bankzweigstellen-netzes von 2000 bis 2019Helmut StixWie in vielen anderen Ländern haben auch die Banken in Österreich in den vergangenen Jahrzehnten ihr Zweigstellennetz kontinuierlich verkleinert. In der vorliegenden Studie werden disaggregierte Informationen über die räumliche Verteilung von Bankzweigstellen in Österreich aufbereitet und Benchmark-Schätzungen für die Beurteilung künftiger Veränderungen im Bankstellennetzwerk erstellt. Zur Anwendung kommen dabei georeferenzierte Daten aller österreichischen Bankfilialen von Jänner 2000 bis Dezember 2019. Untersucht werden die folgenden Fragestellungen: (1) In wie vielen und welchen Gemeinden gibt es keine Bankfiliale? Wie haben sich die diesbezüglichen Zahlen im Lauf der Zeit verändert? (2) Welche Distanz müssen die Österreicherinnen und Österreicher zurücklegen, um die nächstgelegene Bank zu erreichen? In welchen Regionen ist die Verfügbarkeit von Bankfilialen eingeschränkt?
Die Studienergebnisse zeigen, dass es in 555 österreichischen Gemeinden (27 % aller 2.096 Gemeinden) Ende 2019 keine Bankfiliale gab; im Jänner 2000 lag diese Zahl noch bei 271. Am stärksten war die Reduktion der Zahl der Gemeinden ohne örtliche Bank ab 2014. In 305 dieser 555 Gemeinden hatte es im Jahr 2000 noch Bankfilialen gegeben, die aber bis 2019 geschlossen wurden. Von der Schließung der letzten lokalen Bankfiliale waren vor allem Gemeinden mit weniger als 2.000 Einwohnern betroffen; insgesamt lebt nur ein relativ kleiner Anteil der Bevölkerung (4,6 % bzw. 410.000 Personen) in Gemeinden, in denen die letzte Bankfiliale geschlossen wurde.
Wie sieht es mit der Erreichbarkeit von Bankfilialen aus? Um dies zu beantworten, wird im Rahmen einer hoch-auflösenden geografischen Analyse die Entfernung ermittelt, die die österreichische Bevölkerung von ihrem Wohnort zur nächstgelegenen Bank zurücklegen muss (Stand Ende 2019). Diese Distanz reicht von 0,7 km in größeren Städten bis 2,7 km in Gemeinden mit weniger als 2.000 Einwohnern. Im Schnitt müssen die Österreicher 1,5 km zu ihrer nächsten Bankzweigstelle zurücklegen. 77 % der Bevölkerung leben 2 km von ihrer nächsten Bank entfernt. Insgesamt lässt sich aus den Studienergebnissen ablesen, dass die Distanz zwischen Wohnort und Bank in Österreich akzeptabel ist. Bei einer stärker aufgeschlüsselten Betrachtung werden allerdings Gemeinden sichtbar, deren Einwohner eine weitere Strecke zurücklegen müssen. Für rund 433.000 Menschen (4,9 % der Gesamtbevölkerung) beträgt die Entfernung zur nächsten Bank mehr als 5 km. Gemeinden mit einem hohen Anteil an Personen, die mehr als 5 km zurücklegen müssen, haben durchschnittlich 1.000 Einwohner und finden sich in allen Bundesländern – mit Ausnahme Wiens.
Umfragen zeigen, dass ein sehr großer Teil der Österreicher mit der Verfügbarkeit von Bankzweigstellen zufrieden ist. Sogar in ländlichen Gebieten, wo die Entfernung vom Wohnort zur nächsten Bank größer ist, zeigt sich eine hohe Zufriedenheit. Daraus lässt sich schließen, dass etwas längere Wege für Bankkunden (im Durchschnitt) nicht als über-mäßig problematisch angesehen werden. Darüber hinaus nutzen 6 von 10 Österreichern über 14 Jahre Online-Banking und suchen nur gelegentlich Bankfilialen auf. Dementsprechend kann davon ausgegangen werden, dass eine weitere Entfernung des Wohnorts zur nächsten Bank vor allem für jene Personen ein Problem darstellt, die keine digitalen Bank- bzw. Zahlungsdienste nutzen (v. a. ältere Menschen).
Die Ergebnisse dieser Studie dienen als Basis, um derartige Fragen genauer zu untersuchen. So könnten die Ergeb-nisse mit Daten aus anderen Quellen kombiniert werden (z. B. Informationen über die sozioökonomische Struktur von Gemeinden, Umfragen über die Akzeptanz von digitalen Bankdiensten), um Gebiete zu identifizieren, in denen die Verfügbarkeit von Bankfilialen aus Kundensicht nicht zufriedenstellend ist, und einen Rahmen für die Festlegung dahingehender Schwellenwerte zu entwickeln.

FINANCIAL STABILITY REPORT 40 – NOVEMBER 2020 31
Austrian banks’ exposure to climate-related transition risk
Stefano Battiston, Martin Guth, Irene Monasterolo, Benjamin Neudorfer, Wolfgang Pointner1
Refereed by: Bas van Ruijven, International Institute for Applied Systems Analysis (IIASA)
Climate change poses several risks to the value of financial assets and to financial stability. In this study, we estimate the exposure of the Austrian banking sector to climate risks that might arise from a disorderly transition to a carbon-neutral economy. To this end, we identify climate policy-relevant sectors (CPRSs), i.e. sectors which are particularly sensitive to these transition risks, and match that information with granular data of outstanding credits and bonds held by Austrian banks. We find that the Austrian banking sector’s direct exposure to CPRSs is comparable with banks’ exposure in other countries and relevant to financial supervision. As some banks are particularly exposed to climate transition risk, both banks and supervisors should take this risk seriously and monitor it closely.
JEL classification: G18, G32, Q54Keywords: climate change, credit risk, risk management
ECB President Christine Lagarde (2020) acknowledged in February this year that climate change constitutes a major challenge to both the economy and the financial sector. She also announced that, in its financial and monetary analyses, the Euro-system will pay greater attention to climate-related risks. In many euro area juris-dictions, central banks are tasked with safeguarding financial stability. Analyzing the implications of climate change on financial markets and macroeconomic stability is a prerequisite for delivering on this mandate.
Like in most continental European countries, in Austria, banks are a major source of funding for the real economy, with bank loans to nonfinancial corporations amounting to more than 40% of GDP. The effects of climate change can significantly diminish the value of financial assets, which would jeopardize the health of financial intermediaries holding these assets. If risks from climate change are not assessed correctly, financing decisions are based on incomplete information and the expected risk-adjusted return on investment will be systematically biased. Banks are legally obliged to adequately assess, measure and manage credit risks and liquidity risks. As we will show, these types of risks can be triggered by climate change; hence, they should be within the perimeter of banks’ risk management. But survey results2 show that many banks in Austria and other European countries have not yet implemented appropriate risk identification and risk management procedures.
Overcoming the negative consequences of climate change by transitioning to a carbon-neutral economy requires substantial investments. To this end, the EU has set ambitious climate targets for 2030: (1) cutting greenhouse gas (GHG) emissions
1 University of Zurich, Department of Banking and Finance, [email protected]; Vienna University of Economics and Business, [email protected]; Oesterreichische Nationalbank, Supervision Policy, Regulation and Strategy Division, [email protected] and [email protected]; Economic Analysis Division, [email protected] (corresponding author). Opinions expressed by the authors do not necessarily reflect the official viewpoint of the Oesterreichische Nationalbank or of the Eurosystem. The authors would like to thank Ralph Spitzer (OeNB) for helpful comments and valuable suggestions.
2 See e.g. Bourtenbourg et al. (2019) and Pointner and Ritzberger-Grünwald (2019).

Austrian banks’ exposure to climate-related transition risk
32 OESTERREICHISCHE NATIONALBANK
(from 1990 levels) by at least 40%, (2) increasing the share of renewable energy to at least 32%, and (3) significantly improving energy efficiency. The European Commission (2020) estimates that it will take additional investments of EUR 260 billion per year to reach these targets by 2030. One way to mobilize additional funds is to adequately price climate-related financial risks. This disincentivizes investments in climate-damaging, or gray, assets and makes climate-friendly investments in green assets more attractive.
The rest of this article is structured as follows: section 1 defines the financial risks induced by climate change and explains which risk exposure we will focus on in our analysis. In section 2, we present the bank exposure data that are used for the analysis. Section 3 describes the methodology we apply to classify the exposure of banks’ loans and bonds to climate policy-relevant sectors. In section 4, we present the results and findings of the analysis and, finally, section 5 concludes.
1 The financial risks of climate changeThe financial and economic effects of climate change are classified as physical and transition risks. Physical risks emanate from climate change directly, while transition risks arise from the response – by policymakers, innovators or consumers – to pre-vent and/or combat climate change. In our analysis, we focus on banks’ exposure to transition risk. Nevertheless, we will briefly explain all risk sources as they are interdependent and transition risks are often triggered by concerns about physical risks.
1.1 Climate physical risks
Physical risks refer to the effects of both rising temperatures and extreme weather events, which are becoming ever more frequent. They can be broken down into acute and chronic risks: acute risks are sudden short and severe events that have a significant negative impact, e.g. heavy rainfall causing a flood. Chronic risks reflect continuously deteriorating ecological conditions, e.g. rising sea levels. Physical risks, which can damage material infrastructure and fixed investments, tend to vary from region to region, affecting, for instance, coastal areas differently than glacier regions.
Climate-related physical risks fall into more traditional categories in financial risk management. Once physical risks materialize, they can destroy assets either immediately or gradually, namely by causing the depreciation rate of capital to accelerate through decay or corrosion. If the affected assets have been pledged as collateral for a loan, the loan originator’s credit risk rises. Many physical risks are spatially correlated: if, for example, severe flooding destroys a significant proportion of real estate collateral in a particular area, lenders in that region might face higher concentration risk3. If priced in accordingly, the rising uncertainty due to climate change might also lead to higher risk premiums on interest rates, which, in turn, increases market risk.
1.2 Climate transition risks
To mitigate the effects of climate change, it is essential to foster the transition from our current modes of production to a climate-friendly economy. The so-called carbon budget is limited, which means that we are only allowed a specific amount of CO2 emissions to ensure compliance with the Paris Agreement objective of
3 For more information on how climate-induced disasters relate to banks’ lending decisions, see Faiella and Natoli (2018).
Austrian banks’ exposure to climate-related transition risk
FINANCIAL STABILITY REPORT 40 – NOVEMBER 2020 33
keeping the temperature increase well below 2°C in comparison with pre-industrial times (IPCC, 2018). Implementing the low-carbon transition will require targeted climate policies (e.g. carbon taxes), changes in laws and regulations as well as technical innovation and changes in consumers’ preferences. However, if the transition is disorderly because climate policies are introduced too late and/or in an uncoordi-nated way across countries and their impact cannot be fully anticipated by investors, new sources of financial risks could manifest themselves. A disorderly transition could give rise to asset price volatility (both negative for high-carbon activities and positive for low-carbon activities) with implications for financial instability if large and correlated asset classes are involved (Monasterolo et al., 2017).
Regulatory changes can alter the relative prices of low-carbon and gray modes of production. Policies that are effectively internalizing negative climate externalities include carbon pricing and emissions trading schemes and impose a price on emitting GHGs. While the EU’s emissions trading system (ETS) covers most power plants and much of the manufacturing sector, emissions from private consumption are subject to national taxation.
The current Austrian government program envisages the drawing-up of an implementation path for measures meant to reflect the true costs of carbon emissions by 2022. This could include the introduction of carbon taxes. With a view to avoiding carbon leakage, the European Commission (2019) also proposed a carbon border adjustment mechanism in its European Green Deal, which would work like a tariff on GHG-intensive imports. Imposing a positive price on GHG emissions reduces the revenues from the underlying economic activities, thereby lowering the emitters’ debt-servicing capacity; shares and bonds of GHG-emitting companies will be discounted accordingly.
Further, the diffusion of climate-neutral technologies can act as a tipping point for markets and transform previously valuable gray investments into stranded assets.4 Technological innovation can reduce the costs of renewable energy sources and make the latter more competitive vis-à-vis fossil fuels, which are a major source of GHG emissions. On the other hand, oil companies accounting for unextracted reserves in their balance sheets face significant downside risks regarding those assets’ future prices in case of technological breakthroughs, as such reserves might turn into stranded assets. The accelerated diffusion of low-cost solar panels or e-mobility devices has disruptive potential, namely by crowding out traditional GHG-emitting machines.
Finally, rising awareness of global warming might change consumer preferences and thus reduce demand for carbon-intensive goods. Such preference shocks can like-wise turn high-yielding assets into stranded assets in a short amount of time. A severe devaluation of carbon-based assets and lower revenues for debtors due to demand shifts mean that banks face a higher probability of default on some of their loans.
A report by the ESRB (2016) recognized that, despite the well-established need for the transition, there is still great uncertainty regarding its pace. Depending on the timing of behavioral changes by governments, companies and consumers, the transition could result in a “soft landing” or a “hard landing.” The latter would yield
4 See van Ginkel et al. (2020) on climate change-induced socio-economic tipping points. Vermeulen et al. (2018) also include a disruptive energy innovation in their climate stress test for the Dutch financial system.

Austrian banks’ exposure to climate-related transition risk
34 OESTERREICHISCHE NATIONALBANK
a “too late, too sudden” scenario: systemic risk would increase because of stranded assets at a time when more and more physical risks are likely to materialize.
Our analysis focuses on transition risks of climate change only. This is due to the data available and should not be read as a prioritization of transition risks over physical risks. For a proper analysis of physical risks, we would need geographical data on where assets are located, and such data would then have to be matched with location-specific vulnerabilities to climate hazards like flooding or storms, as shown in Faiella and Natoli (2018). As we currently have no access to such data, we concentrate on transition risks.
2 Data descriptionTo quantify financial risks stemming from climate-related (physical, transition) risks, it is key to have reliable data on financial firms’ exposure to nonfinancial companies. Obtaining a comprehensive dataset to analyze banks’ assets regarding their transition or physical risk continues to be challenging as banks’ asset types and the structure of their loan portfolios are more diverse. The supervisory reporting framework was designed for assessing banks’ resilience against various financial risks. Risks specifically associated with climate change have not yet been incorpo-rated. This is also true for financial reporting, which likewise lacks detailed re-porting standards geared toward quantifying climate risk.
Here, we combine granular supervisory reporting data of banks with a detailed methodology on identifying climate policy-relevant sectors (CPRSs) to assess banks’ exposure to potentially vulnerable assets. Current financial reporting in Austria allows us to analyze banks’ balance sheet structure on a very granular basis. Since 2019, all banks incorporated in Austria have been reporting loan data at the level of individual instruments. These data reported to the OeNB cover loans above the following thresholds: EUR 25,000 for legal entities and EUR 350,000 for individual persons. Together with individual data on other exposure types, such as securities, equity and off-balance sheet items, the granular credit data contain exposures of Austrian banks worth EUR 946 billion at year-end 2019, which represents about 85% of Austrian banks’ total exposure at the unconsolidated level.5 For our analysis, we use bank exposure data which refer to year-end 2019 and contain information on the originating bank, borrower characteristics, instrument types and exposure volume.6
As the data are collected for Austrian banks at the unconsolidated level, they only include exposures recorded in Austria. They include direct foreign exposures but exclude foreign subsidiaries. Another caveat is the lack of information on the designated use by the borrower of the funds provided. Such information would help assess climate policy relevance and the associated transition risk.
During the process, we added data from other sources to compensate for short-comings in certain aspects. For securities, we included market data7 on “green
5 For better readability, we refer to all aforementioned exposure classes as assets or bank claims, which include certain off-balance sheet positions (e.g. committed credit lines).
6 The following attributes are used in the analysis: “BankID,” “ borrower LEI (i.e. legal entity identifier) code,” “ borrower OeNB ID,” “ borrower description,” “ borrower region,” “NACE 4 digit,” “type of instruments” and “total exposure amount.”
7 Data on green and sustainable bonds in the bond portfolio of Austrian banks were derived from Bloomberg, Wiener Börse, Nasdaq SWE, Börse Frankfurt, Euronext, Borsa Italiana, Luxembourg Green Exchange, ICMA GBP and CBI LGX.
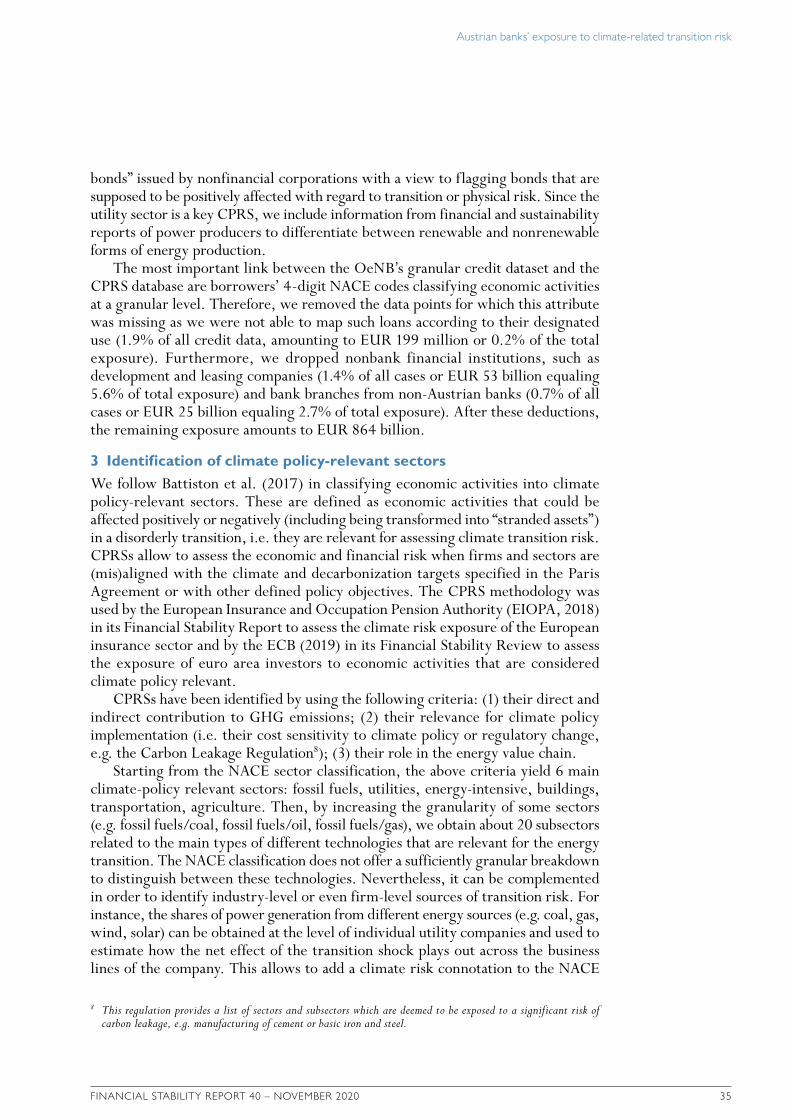
Austrian banks’ exposure to climate-related transition risk
FINANCIAL STABILITY REPORT 40 – NOVEMBER 2020 35
bonds” issued by nonfinancial corporations with a view to flagging bonds that are supposed to be positively affected with regard to transition or physical risk. Since the utility sector is a key CPRS, we include information from financial and sustainability reports of power producers to differentiate between renewable and nonrenewable forms of energy production.
The most important link between the OeNB’s granular credit dataset and the CPRS database are borrowers’ 4-digit NACE codes classifying economic activities at a granular level. Therefore, we removed the data points for which this attribute was missing as we were not able to map such loans according to their designated use (1.9% of all credit data, amounting to EUR 199 million or 0.2% of the total exposure). Furthermore, we dropped nonbank financial institutions, such as development and leasing companies (1.4% of all cases or EUR 53 billion equaling 5.6% of total exposure) and bank branches from non-Austrian banks (0.7% of all cases or EUR 25 billion equaling 2.7% of total exposure). After these deductions, the remaining exposure amounts to EUR 864 billion.
3 Identification of climate policy-relevant sectorsWe follow Battiston et al. (2017) in classifying economic activities into climate policy-relevant sectors. These are defined as economic activities that could be affected positively or negatively (including being transformed into “stranded assets”) in a disorderly transition, i.e. they are relevant for assessing climate transition risk. CPRSs allow to assess the economic and financial risk when firms and sectors are (mis)aligned with the climate and decarbonization targets specified in the Paris Agreement or with other defined policy objectives. The CPRS methodology was used by the European Insurance and Occupation Pension Authority (EIOPA, 2018) in its Financial Stability Report to assess the climate risk exposure of the European insurance sector and by the ECB (2019) in its Financial Stability Review to assess the exposure of euro area investors to economic activities that are considered climate policy relevant.
CPRSs have been identified by using the following criteria: (1) their direct and indirect contribution to GHG emissions; (2) their relevance for climate policy implementation (i.e. their cost sensitivity to climate policy or regulatory change, e.g. the Carbon Leakage Regulation8); (3) their role in the energy value chain.
Starting from the NACE sector classification, the above criteria yield 6 main climate-policy relevant sectors: fossil fuels, utilities, energy-intensive, buildings, transportation, agriculture. Then, by increasing the granularity of some sectors (e.g. fossil fuels/coal, fossil fuels/oil, fossil fuels/gas), we obtain about 20 subsectors related to the main types of different technologies that are relevant for the energy transition. The NACE classification does not offer a sufficiently granular breakdown to distinguish between these technologies. Nevertheless, it can be complemented in order to identify industry-level or even firm-level sources of transition risk. For instance, the shares of power generation from different energy sources (e.g. coal, gas, wind, solar) can be obtained at the level of individual utility companies and used to estimate how the net effect of the transition shock plays out across the business lines of the company. This allows to add a climate risk connotation to the NACE
8 This regulation provides a list of sectors and subsectors which are deemed to be exposed to a significant risk of carbon leakage, e.g. manufacturing of cement or basic iron and steel.
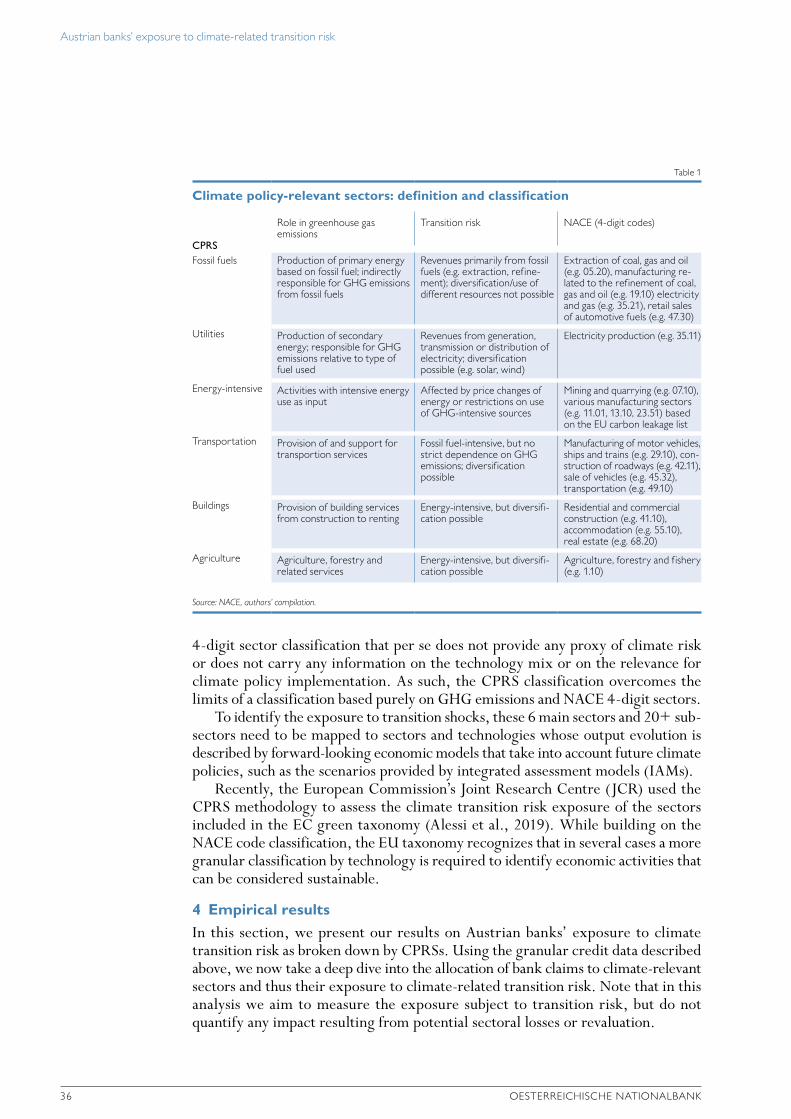
Austrian banks’ exposure to climate-related transition risk
36 OESTERREICHISCHE NATIONALBANK
4-digit sector classification that per se does not provide any proxy of climate risk or does not carry any information on the technology mix or on the relevance for climate policy implementation. As such, the CPRS classification overcomes the limits of a classification based purely on GHG emissions and NACE 4-digit sectors.
To identify the exposure to transition shocks, these 6 main sectors and 20+ sub-sectors need to be mapped to sectors and technologies whose output evolution is described by forward-looking economic models that take into account future climate policies, such as the scenarios provided by integrated assessment models (IAMs).
Recently, the European Commission’s Joint Research Centre (JCR) used the CPRS methodology to assess the climate transition risk exposure of the sectors included in the EC green taxonomy (Alessi et al., 2019). While building on the NACE code classification, the EU taxonomy recognizes that in several cases a more granular classification by technology is required to identify economic activities that can be considered sustainable.
4 Empirical resultsIn this section, we present our results on Austrian banks’ exposure to climate transition risk as broken down by CPRSs. Using the granular credit data described above, we now take a deep dive into the allocation of bank claims to climate-relevant sectors and thus their exposure to climate-related transition risk. Note that in this analysis we aim to measure the exposure subject to transition risk, but do not quantify any impact resulting from potential sectoral losses or revaluation.
Table 1
Climate policy-relevant sectors: definition and classification
CPRS
Role in greenhouse gas emissions
Transition risk NACE (4-digit codes)
Fossil fuels Production of primary energy based on fossil fuel; indirectly responsible for GHG emissions from fossil fuels
Revenues primarily from fossil fuels (e.g. extraction, refine-ment); diversification/use of different resources not possible
Extraction of coal, gas and oil (e.g. 05.20), manufacturing re-lated to the refinement of coal, gas and oil (e.g. 19.10) electricity and gas (e.g. 35.21), retail sales of automotive fuels (e.g. 47.30)
Utilities Production of secondary energy; responsible for GHG emissions relative to type of fuel used
Revenues from generation, transmission or distribution of electricity; diversification possible (e.g. solar, wind)
Electricity production (e.g. 35.11)
Energy-intensive Activities with intensive energy use as input
Affected by price changes of energy or restrictions on use of GHG-intensive sources
Mining and quarrying (e.g. 07.10), various manufacturing sectors (e.g. 11.01, 13.10, 23.51) based on the EU carbon leakage list
Transportation Provision of and support for transportion services
Fossil fuel-intensive, but no strict dependence on GHG emissions; diversification possible
Manufacturing of motor vehicles, ships and trains (e.g. 29.10), con-struction of roadways (e.g. 42.11), sale of vehicles (e.g. 45.32), transportation (e.g. 49.10)
Buildings Provision of building services from construction to renting
Energy-intensive, but diversifi-cation possible
Residential and commercial construction (e.g. 41.10), accommodation (e.g. 55.10), real estate (e.g. 68.20)
Agriculture Agriculture, forestry and related services
Energy-intensive, but diversifi-cation possible
Agriculture, forestry and fishery (e.g. 1.10)
Source: NACE, authors’ compilation.
Assets in EUR billion
200
150
100
50
0
Foss
il fu
els
Util
ities
Ener
gy-in
tens
ive
Build
ings
Tran
spor
tatio
n
Agr
icul
ture
Oth
er
Austrian bank assets aggregated to climate policy-relevant sectors (CPRSs)
Chart 1
Source: OeNB.
Note: Assets from all remaining non-climate-relevant sectors are aggregated in the “other” group. The latter includes assets from, for instance, administrative activities, education, finance and health services. For better visualization, the y axis is truncated at EUR 200 billion.
8 14 30 142 32 3 637
Fossil fuels
Utilities Energy-intensive
Buildings Trans-portation
Agricul-ture
Other
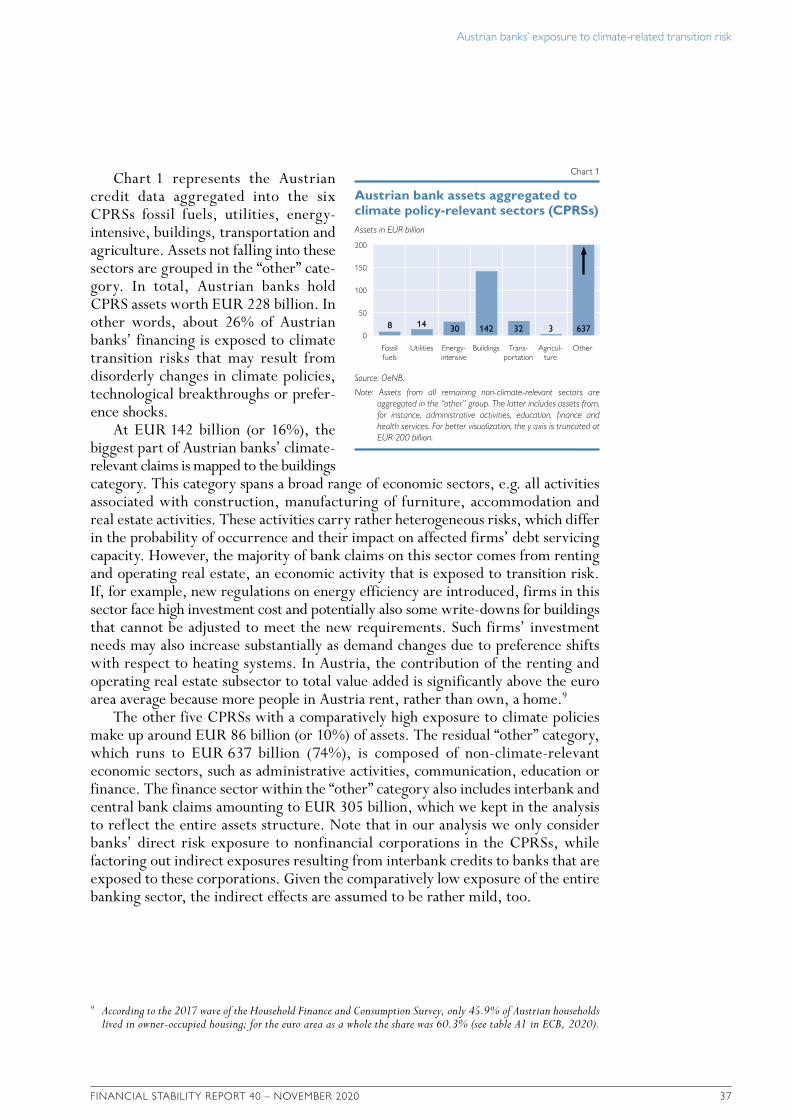
Austrian banks’ exposure to climate-related transition risk
FINANCIAL STABILITY REPORT 40 – NOVEMBER 2020 37
4-digit sector classification that per se does not provide any proxy of climate risk or does not carry any information on the technology mix or on the relevance for climate policy implementation. As such, the CPRS classification overcomes the limits of a classification based purely on GHG emissions and NACE 4-digit sectors.
To identify the exposure to transition shocks, these 6 main sectors and 20+ sub-sectors need to be mapped to sectors and technologies whose output evolution is described by forward-looking economic models that take into account future climate policies, such as the scenarios provided by integrated assessment models (IAMs).
Recently, the European Commission’s Joint Research Centre (JCR) used the CPRS methodology to assess the climate transition risk exposure of the sectors included in the EC green taxonomy (Alessi et al., 2019). While building on the NACE code classification, the EU taxonomy recognizes that in several cases a more granular classification by technology is required to identify economic activities that can be considered sustainable.
4 Empirical resultsIn this section, we present our results on Austrian banks’ exposure to climate transition risk as broken down by CPRSs. Using the granular credit data described above, we now take a deep dive into the allocation of bank claims to climate-relevant sectors and thus their exposure to climate-related transition risk. Note that in this analysis we aim to measure the exposure subject to transition risk, but do not quantify any impact resulting from potential sectoral losses or revaluation.
Table 1
Climate policy-relevant sectors: definition and classification
CPRS
Role in greenhouse gas emissions
Transition risk NACE (4-digit codes)
Fossil fuels Production of primary energy based on fossil fuel; indirectly responsible for GHG emissions from fossil fuels
Revenues primarily from fossil fuels (e.g. extraction, refine-ment); diversification/use of different resources not possible
Extraction of coal, gas and oil (e.g. 05.20), manufacturing re-lated to the refinement of coal, gas and oil (e.g. 19.10) electricity and gas (e.g. 35.21), retail sales of automotive fuels (e.g. 47.30)
Utilities Production of secondary energy; responsible for GHG emissions relative to type of fuel used
Revenues from generation, transmission or distribution of electricity; diversification possible (e.g. solar, wind)
Electricity production (e.g. 35.11)
Energy-intensive Activities with intensive energy use as input
Affected by price changes of energy or restrictions on use of GHG-intensive sources
Mining and quarrying (e.g. 07.10), various manufacturing sectors (e.g. 11.01, 13.10, 23.51) based on the EU carbon leakage list
Transportation Provision of and support for transportion services
Fossil fuel-intensive, but no strict dependence on GHG emissions; diversification possible
Manufacturing of motor vehicles, ships and trains (e.g. 29.10), con-struction of roadways (e.g. 42.11), sale of vehicles (e.g. 45.32), transportation (e.g. 49.10)
Buildings Provision of building services from construction to renting
Energy-intensive, but diversifi-cation possible
Residential and commercial construction (e.g. 41.10), accommodation (e.g. 55.10), real estate (e.g. 68.20)
Agriculture Agriculture, forestry and related services
Energy-intensive, but diversifi-cation possible
Agriculture, forestry and fishery (e.g. 1.10)
Source: NACE, authors’ compilation.
Assets in EUR billion
200
150
100
50
0
Foss
il fu
els
Util
ities
Ener
gy-in
tens
ive
Build
ings
Tran
spor
tatio
n
Agr
icul
ture
Oth
er
Austrian bank assets aggregated to climate policy-relevant sectors (CPRSs)
Chart 1
Source: OeNB.
Note: Assets from all remaining non-climate-relevant sectors are aggregated in the “other” group. The latter includes assets from, for instance, administrative activities, education, finance and health services. For better visualization, the y axis is truncated at EUR 200 billion.
8 14 30 142 32 3 637
Fossil fuels
Utilities Energy-intensive
Buildings Trans-portation
Agricul-ture
Other
Chart 1 represents the Austrian credit data aggregated into the six CPRSs fossil fuels, utilities, energy- intensive, buildings, transportation and agriculture. Assets not falling into these sectors are grouped in the “other” cate-gory. In total, Austrian banks hold CPRS assets worth EUR 228 billion. In other words, about 26% of Austrian banks’ financing is exposed to climate transition risks that may result from disorderly changes in climate policies, technological breakthroughs or prefer-ence shocks.
At EUR 142 billion (or 16%), the biggest part of Austrian banks’ climate- relevant claims is mapped to the buildings category. This category spans a broad range of economic sectors, e.g. all activities associated with construction, manufacturing of furniture, accommodation and real estate activities. These activities carry rather heterogeneous risks, which differ in the probability of occurrence and their impact on affected firms’ debt servicing capacity. However, the majority of bank claims on this sector comes from renting and operating real estate, an economic activity that is exposed to transition risk. If, for example, new regulations on energy efficiency are introduced, firms in this sector face high investment cost and potentially also some write-downs for buildings that cannot be adjusted to meet the new requirements. Such firms’ investment needs may also increase substantially as demand changes due to preference shifts with respect to heating systems. In Austria, the contribution of the renting and operating real estate subsector to total value added is significantly above the euro area average because more people in Austria rent, rather than own, a home.9
The other five CPRSs with a comparatively high exposure to climate policies make up around EUR 86 billion (or 10%) of assets. The residual “other” category, which runs to EUR 637 billion (74%), is composed of non-climate-relevant economic sectors, such as administrative activities, communication, education or finance. The finance sector within the “other” category also includes interbank and central bank claims amounting to EUR 305 billion, which we kept in the analysis to reflect the entire assets structure. Note that in our analysis we only consider banks’ direct risk exposure to nonfinancial corporations in the CPRSs, while factoring out indirect exposures resulting from interbank credits to banks that are exposed to these corporations. Given the comparatively low exposure of the entire banking sector, the indirect effects are assumed to be rather mild, too.
9 According to the 2017 wave of the Household Finance and Consumption Survey, only 45.9% of Austrian households lived in owner-occupied housing; for the euro area as a whole the share was 60.3% (see table A1 in ECB, 2020).

Austrian banks’ exposure to climate-related transition risk
38 OESTERREICHISCHE NATIONALBANK
Box 1
Austrian banks’ exposure to energy production
The utilities sector is of special importance as it includes claims on both energy production and supply companies. We have analyzed publicly available information (e.g. annual and sustainability reports) of about 200 rele-vant energy producers within the utilities CPRS.10 From these additional data, we were able to extract valuable information on Austrian banks’ lending structure in this sector as illustrated in chart 2.
The information we collected corresponds to an exposure volume of EUR 7.6 billion, which represents about 80% of Austrian banks’ exposure to energy production. We used this information to identify which energy sources producers supply, whether they provide renewable energy sources and if they issue a sustainability report with standardized information on climate intensity.
Of the EUR 9.3 billion total claims on energy-producing companies, approximately EUR 5 billion (53.5%) benefit companies that produce nearly 100% renewable energy across different energy types, and EUR 4.3 billion (46.5%) are either claims on nonrenewable energy companies or companies that could not be classified. This result is mostly consistent with the structure of energy production in Austria, where 76.6% of the average Austrian energy mix is based on renewable energy sources (E-Control, 2019). 53.5% of claims on energy-producing companies relate to Austrian companies while 46.5% is invested in foreign companies either via direct loans or bonds. Austrian firms’ exposure is evenly split among small, medium-sized and large banks. In contrast, the foreign part is held predominantly by a few large banks or special purpose banks.
It is interesting to note the distribution of assets across the different energy types when compared to the actual energy mix. 20.1% of Austrian banks’ assets are composed of wind power producers, 18.7% of mixed renewable energy producers and only 9% of hydroelectric producers. This is in stark contrast to the actual energy mix, which consists of 59% hydropower and only 9.16% of wind power. There are two possible explanations for this phenomenon. First, the levelized cost of electricity (LCOE) for constructing new power plants per kilowatt hour is higher for onshore (and offshore) wind parks than for hydropower plants (PowerTech, 2015). This could increase wind energy producers’ f inancing needs that would be reflected in the granular credit data. Second, many hydropower plants in Austria were built decades ago (Hydropower, 2018) and are thus not represented on banks’ balance sheets.
In a next step, we disentangle the distribution of bank claims on CPRSs according to different bank characteristics. We first consider banks’ size in terms of total assets (chart 3, left panel) by dividing banks into three groups: small banks (total assets
10 We individually assessed power producers that are funded by Austrian banks via loans or bonds with a volume of more than EUR 10 million.
% of total energy production in the “utilities” sector
Austrian banks’ exposure vis-à-vis types of energy production
Chart 2
Source: OeNB.
Note: Companies that produce renewable energy and cannot be allocated to one specific energy type were placed in the category “mixed renewable.”
Nonrenewable/not classified WindMixed renewable HydroSolar BiomassBiothermal Other
46.5
20.1
18.7
9.0
4.5
0.50.4
0.2

Austrian banks’ exposure to climate-related transition risk
FINANCIAL STABILITY REPORT 40 – NOVEMBER 2020 39
below EUR 5 billion), medium-sized banks (total assets between EUR 5 billion and EUR 30 billion) and large banks (total assets above EUR 30 billion). Thus, small and medium-sized banks in a way represent the less significant institutions (LSIs), while large banks represent the majority of significant institutions (SIs) under direct supervision of the ECB.11 Small banks account for 94.7% of all banks under consideration and 30.1% of total assets; medium-sized banks account for 4.3% of all banks and 31.5% of total assets and large banks make up 1% of all banks and hold 38.4% of total assets. Medium-sized banks on average have a higher exposure to CPRSs (31.1%) than smaller banks (25.6%) and larger banks (23.3%). Never-theless, the mix of CPRSs differs across the groups. The small and medium-sized banks hold the majority of their assets in the buildings category (roughly 20% each). But there are also differences between the two groups: while small banks’ exposure to the agriculture portfolio is greater (0.8%), medium-sized banks’ energy-intensive portfolio is larger (2.8%). Large banks, by contrast, are most exposed to fossil fuels (1.9%), utilities (1.9%) and the energy-intensive sector (5.6%). The clustering of the fossil fuel exposure with large banks could be explained by the respective corporations’ sizable financing needs. Indeed, at EUR 5.3 million, the average exposure to fossil fuels is the largest across all six CPRSs. Furthermore, 73% of these fossil fuel assets are located outside Austria, which also represents the largest non-Austrian exposure share across the sectors. This implies that many smaller regional banks would not be able to meet the financing demand by the fossil fuel industry.
Breaking down Austrian banks by their business models provides a more detailed insight into banks’ exposure to climate transition risk via CPRSs. We differentiate between banks with a single-tier structure and banks belonging to multi-tier sectors. The former comprise building and loan associations, joint stock banks, state mortgage banks and special purpose banks. In contrast, the two-tier sector banks refer to Volksbank credit cooperatives and savings banks, while Raiffeisen credit cooperatives make up a three-tier sector. Different business models result in very heterogeneous financing portfolios (chart 3, right panel). Overall, the buildings sector is the dominant asset class across all banking sectors. Special purpose banks are an exception, with their total share of CPRS claims amounting to a mere 11.4%, of which 10.1% fall into the transportation category. After all, five out of fifteen special purpose banks exclusively finance motor vehicles. At 40.2%, state mortgage banks record the largest exposure to CPRSs. Although they are set up as regional universal banks with both corporate and retail customers, their core business includes residential property and public-sector lending, which is partly reflected in their 34.7% share of the broadly defined buildings sector. Joint stock banks display the highest exposure to the sectors fossil fuels (1.6%), utilities (2.5%) and energy-intensive (5%). With joint stock banks, the distribution of assets is very similar to that recorded by large banks.
Next, we explore whether there are regional differences in banks’ CPRS exposure based on their geographical location. As the many small, locally operating banks help meet the financing needs of the respective local economy in the municipalities
11 The group of large banks include BAWAG P.S.K., Erste Group Bank AG, Raiffeisen Bank International AG, Raiffeisenlandesbank Oberösterreich Aktiengesellschaft and UniCredit Bank Austria AG. The remaining SIs, Volksbank Wien AG, Sberbank Europe AG and Addiko Bank are subsumed under the medium-sized and small groups, respectively, as the total assets of both unconsolidated entities are below EUR 30 billion each.

Austrian banks’ exposure to climate-related transition risk
40 OESTERREICHISCHE NATIONALBANK
and provinces12, we would expect to see that behavior reflected in the exposure to different CPRSs. In the left panel of chart 4, we observe four clusters. First, the lowest total exposure (22.3%) is recorded by banks in the municipality of Vienna. However, it also contains the highest exposure overall to fossil fuels (1.6%) and utilities (1.9%), which can be explained by the concentration in Vienna of larger, internationally active banks that provide financial services to industrial enterprises on a larger scale. The second cluster, which is composed of banks in the provinces of Carinthia and Vorarlberg, shows an average exposure of 27.5%. The third cluster comprises banks in Burgenland, Styria and Upper Austria registering an exposure of 29.9%. Overall, Upper Austria accounts for the largest exposure (4.8%) to the energy-intensive CPRS. Fourth, the CPRS exposure of banks based in Lower Austria, Salzburg and Tyrol runs to 32.7%.
Finally, we break down the credit data by three categories of lending instru-ments,13 namely loans, bonds and other instruments. Bonds issued by nonfinancial corporations make up roughly EUR 95 billion or 11% of the financing extended by Austrian banks. This category is the least exposed to climate-sensitive sectors (see chart 4, right panel), with the transportation sector reflecting the largest share (at 2.2%) of the CPRS portfolio.
We are interested in analyzing the share of green bonds in the EUR 95 billion total bonds value. Using the bonds’ ISIN codes available from the granular credit data, we compare the bonds with different stock exchanges for green, social and sustainable securities. As a result, a total of EUR 2 billion or 2.15% of all outstanding bonds in Austrian banks’ portfolios can be classified as green based on the criteria of at least one of the stock exchanges mentioned in section 2. This is consistent with the European average; according to the ESRB (2020), the share of private
12 Austria is divided into nine provinces: Burgenland, Carinthia, Lower Austria, Salzburg, Styria, Tyrol, Upper Austria, Vienna, and Vorarlberg.
13 The “other category” consists of residual bank exposures, such as forward deposits (67.5%) and equity shares (31.1%).
% of assets
CPRS assets by bank size
100
80
60
40
20
0
% of assets
CPRS assets by bank sector
100
80
60
40
20
0
Austrian banks’ CPRS assets by bank size and bank sector
Chart 3
Source: OeNB.
Fossil fuelsOther
Utilities Energy-intensive Buildings Transportation Agriculture
Small banks
Building and loan associa-
tions
Volksbank credit
coopera-tives
Joint stock banks
Raiffeisen credit
coopera-tives
Statemortgage
banks
Savings banks
Special purpose
banks
Medium-sizedbanks
Largebanks
Note: Bank size is defined in terms of banks’ total assets: small banks: up to EUR 5 billion; medium-sized banks: from EUR 5 billion to EUR 30 billion; large banks: over EUR 30 billion.
Austrian banks’ exposure to climate-related transition risk
FINANCIAL STABILITY REPORT 40 – NOVEMBER 2020 41
sector green bonds in the corporate EU bond market amounted to 2% in 2019. We do not see any form of significant clustering of green bonds across any bank charac-teristics. The majority of lending facilities for the real economy are loans amounting to EUR 621 billion or 71.8%, 31.8% of which are exposed to CPRSs. The assets in the “other instruments” category amount to EUR 149 billion, of which 18.1% are exposed to CPRSs. This is also the category with the highest relative exposure to fossil fuels (1.5%) and the energy-intensive sector (5.4%).
To sum up, 26% (or EUR 228 billion) of Austrian banks’ assets are exposed to climate transition risk via the CPRSs. The literature on the banking sector’s exposure to climate transition risk is poor due to the difficulties in accessing granular data on the composition of banks’ credit and bond holdings, data which result from granular credit data reporting. Weyzig et al. (2014) analyzed the total value of all outstanding corporate loans extended by the 20 largest European banks to high-carbon companies as at December 31, 2012. The authors found that these banks held a weighted average of 7% of their portfolios vis-à-vis producers of oil, gas and coal. This represents a significantly higher exposure when compared with Austrian banks’ 0.9% exposure to the fossil fuel category. Battiston et al. (2017), who intro-duced the CPRSs, focused on the equity portfolios of different financial actors. Although their findings for European banks’ holdings cannot be compared with our study at face value, the investment pattern across the CPRSs is similar to our results. An analysis of climate transition risk in the Dutch financial system quantified the exposure of the banking sector to carbon-intensive industries at 13% of all assets (Vermeulen et al., 2018, p. 48). It should be noted that our definition of CPRSs comprises more economic activities than just carbon-intensive industries and is not only based on GHG emission criteria. As such, our analysis allows a mapping with the activities covered by the EU taxonomy (Alessi et al., 2019). In a recent study, Roncoroni et al. (2019) apply the CPRS methodology to the Mexican banking sector and also find low asset values and distribution patterns across the CPRSs (fossil fuels: 3.6%, utilities: 1%, energy-intensive: 3.5%).
Interestingly, when we single out the top 10% banks with the highest share of CPRS claims in our sample, the average exposure to climate risk of these banks
% of assets
CPRS assets by bank location
100
80
60
40
20
0
% of assets
CPRS assets by instrument
100
80
60
40
20
0
Austrian banks’ CPRS assets by bank location and instrument
Chart 4
Source: OeNB.
Fossil fuelsOther
Utilities Energy-intensive Buildings Transportation Agriculture
Burgen-land
Bonds Loans OtherCarinthia Lower Austria
Salzburg Styria Tyrol Upper Austria
Vienna Vorarl-berg

Austrian banks’ exposure to climate-related transition risk
42 OESTERREICHISCHE NATIONALBANK
reaches 42%, which is mainly due to a more than twofold increase of the exposure to the buildings sector. Certain banks therefore face heightened risk from a possible change in climate policies, technological breakthroughs or preference shocks. It is thus imperative that banks monitor and assess their climate risks adequately and follow the guidance provided by supervisory authorities (e.g. FMA, 2020).
5 Summary and conclusionsOur analysis combines granular supervisory data on banks’ exposure with a methodology to identify economic sectors that are relevant for climate transition risk, i.e. climate policy-relevant sectors (CPRSs). We descriptively analyzed Austrian banks’ exposure with respect to their climate policy-relevant assets by using detailed credit data reported by banks. In addition, we wanted to highlight the strengths and limitations inherent in the current supervisory reporting framework when it comes to supporting such an analysis.
We considered the CPRS methodology by Battiston et al. (2017) and Battiston and Monasterolo (2019) to make a top-down assessment of the climate policy relevance of the Austrian banking system’s portfolio. Our results show that 26% of the analyzed assets of Austrian banks are held vis-à-vis CPRSs and thus exposed to climate transition risk. Thereof, 16% relate to the buildings sector, which by definition spans a wide array of economic activities that are likely to be heteroge-neously affected by transition risk. Another 10% of assets relate to fossil fuels, utilities, energy-intensive, transportation and agriculture sectors.
A disorderly transition to a low-carbon economy would affect the Austrian banking sector via this exposure. We find that the sector’s direct exposure to most CPRSs is comparable with banks’ exposure in other countries and relevant to financial supervision. Further, the overall shock on individual institutions will also depend on their financial characteristics and risk factors, including leverage (Monasterolo et al., 2018). It should be noted that despite the resilience of the system as a whole, some individual banks exhibit significantly larger exposures and accordingly face a higher risk, which should be appropriately assessed, measured and managed. Guidelines for the proper treatment of such risks can be found in the guide on sustainability risks recently published by the Austrian Financial Market Authority (FMA, 2020).
Analyzing the distribution in certain banking sectors, we notice that larger banks have a higher exposure to fossil fuel and energy-intensive sectors than small or medium-sized banks. Additionally, the regional distribution of bank claims reflects the economic profile of the nine Austrian provinces. At the instrument level, exposure to CPRSs is mainly driven by loans and other instruments, while bonds account for a relatively small share.
Value is added to the analysis by examining individual assets in greater detail. To this end, we used firms’ reporting data, including their sustainability disclosure. The utilities sector in particular is composed of mixed firms, i.e. firms that have both a renewable and fossil fuel-based business. A large share of Austrian utility companies produces electricity by using renewable energy sources, which needs to be reflected in any top-down analysis.
Classifying banks’ balance sheets according to the CPRS methodology helps determine strengths and vulnerabilities of the Austrian banking sector regarding climate transition risk. Our analysis points to persistent data limitations hampering

Austrian banks’ exposure to climate-related transition risk
FINANCIAL STABILITY REPORT 40 – NOVEMBER 2020 43
a detailed analysis. The fractured nature of the loan portfolios consisting of small corporate loans renders an in-depth analysis difficult. Two things would improve transparency and help banks and supervisors alike to assess and price in climate risk exposure in banks’ balance sheets: first, standardized information on climate risks in financial reporting and, second, better disclosure of the energy technologies used and of the emission intensity of projects financed by loans.
ReferencesAlessi, L., E. Ossola and R. Panzica. 2019. The Greenium Matters: Evidence on the Pricing of
Climate Risk. University of Milan Bicocca Department of Economics, Management and Statistics Working Paper 418.
Battiston, S., A. Mandel, I. Monasterolo, F. Schütze and G. Visentin. 2017. A climate stress-test of the EU financial system. In: Nature Climate Change 7. 283–88.
Battiston, S. and I. Monasterolo. 2019. How could the ECB’s monetary policy support the sustainable finance transition? FINEXUS working paper (input to the Positive Money and Veblen’s policy report “Aligning Monetary Policy with the EU’s Climate Targets”). https://www.finexus.uzh.ch/en/news/cspp_sustainable_finance.html
BCBS. 2017. Basel III: Finalising post-crisis reforms. https://www.bis.org/bcbs/publ/d424.pdfBourtenbourg, J., L. Dumont, A. Francart and B. van Tendeloo. 2019. Climate-related
risks and sustainable finance. In: NBB Financial Stability Report. 107–126.E-Control. 2019. Stromkennzeichnungsbericht 2019. https://www.e-control.at/documents/1785851/0/
Stromkennzeichnungsbericht_FINAL.pdfECB. 2019. Climate change and financial stability. In: Financial Stability Review. May. 120–33. ECB. 2020. The Household Finance and Consumption Survey. Wave 2017. Statistical tables. EIOPA. 2018. Financial Stability Report. December.ESRB. 2016. Too late, too sudden: Transition to a low-carbon economy and systemic risk. Report
No 6 of the Advisory Scientific Committee. https://www.esrb.europa.eu/pub/pdf/asc/Reports_ASC_6_1602.pdf
ESRB. 2020. Positively green: Measuring climate change risks to financial stability. Joint report by the ESRB Advisory Technical Committee and Eurosystem Financial Stability Committee. June.
European Commission. 2019. The European Green Deal. COM(2019) 640 final.European Commission. 2020. Sustainable Europe Investment Plan. European Green Deal
Investment Plan. COM(2020) 21 final.Faiella, I. and F. Natoli. 2018. Natural catastrophes and bank lending: the case of flood risk in
Italy. Bank of Italy Questioni di Economia e Finanza (Occasional Papers) 457.FMA. 2020. FMA guide for managing sustainability risks. Hydropower. 2018. 2018 Hydropower Status Report. https://www.hydropower.org/publicat-
tions/2018-hydropower-status-reportIPCC. 2018. Global Warming of 1.5°C. Special Report on the impacts of global warming of 1.5°C
above pre-industrial levels and related global greenhouse gas emission pathways.Lagarde, C. 2020. Climate change and the financial sector. Speech at the launch of the COP 26
Private Finance Agenda. London, February 27. https://www.ecb.europa.eu/press/key/date/2020/html/ecb.sp200227_1~5eac0ce39a.en.html
NGFS. 2019. A call for action: Climate change as a source of financial risk. First comprehensive report. April. https://www.ngfs.net/sites/default/files/medias/documents/ngfs_first_comprehensive_report_-_17042019_0.pdf
Monasterolo, I., S. Battiston, A.C. Janetos and Z. Zheng. 2017. Vulnerable yet relevant: the two dimensions of climate-related financial disclosure. In: Climatic Change 145. 495–507.

Austrian banks’ exposure to climate-related transition risk
44 OESTERREICHISCHE NATIONALBANK
Monasterolo, I., J.I. Zheng and S. Battiston. 2018. Climate Transition Risk and Development Finance: A Carbon Risk Assessment of China’s Overseas Energy Portfolios. In: China & World Economy 26(6). 116–142.
Pointner, W. and D. Ritzberger-Grünwald. 2019. Climate change as a risk to financial stability. In: Financial Stability Report 38. OeNB. 30–45.
PowerTech. 2015. Levelised Cost of Electricity (LCOE 2015).Roncoroni, A., S. Battiston, L.O.L. Escobar Farfàn and S. Martinez Jaramillo.
2019. Climate risk and financial stability in the network of banks and investment funds. https://ssrn.com/abstract=3356459
van Ginkel, K., W. Botzen, M. Haasnoot, G. Bachner, K. Steininger, J. Hinkel, P. Wat-kiss, E. Boere, A. Jeuken, E. Sainz de Murieta and F. Bosello. 2020. Climate change induced socio-economic tipping points: review and stakeholder consultation for policy relevant research. In: Environmental Research Letters 15(2).
Vermeulen, R., E. Schets, M. Lohuis, B. Kölbl, D. Jansen and W. Heeringa. 2018. An energy transition risk stress test for the financial system of the Netherlands. DNB Occasional Studies 16(7).
Weyzig, F., B. Kuepper, J.W. van Gelder and R. van Tilburg. 2014. The price of doing too little too late. The impact of the carbon bubble on the EU financial system. Brussels: Green European Foundation. https://gef.eu/wp-content/uploads/2017/01/The_Price_of_Doing_Too_Little_Too_Late_.pdf

FINANCIAL STABILITY REPORT 40 – NOVEMBER 2020 45
Green finance – opportunities for the Austrian financial sector
Andreas Breitenfellner, Susanne Hasenhüttl, Georg Lehmann, Andreas Tschulik1
Refereed by: Daniela Kletzan-Slamanig, Austrian Institute of Economic Research (WIFO)
Climate change and the internationally agreed decarbonization of the global economy not only pose risks to the financial sector and the economy but also open up opportunities. While focusing on the risks, mandate-driven central banks and financial supervisors also need to understand the dynamics and potential of green or sustainable finance markets. The investment needs at the global, European and national level to fund the transition to a climate-neutral economy are mind-blowing. Earmarked public funds alone will not suffice. In addition, financial markets will have to channel (excess) resources above all into sustainable projects. In other words, breaking out of its niche, green finance will have to scale up. Though dynamic, the development of Austria’s green finance markets is still sobering. At the same time, customer surveys suggest that demand for sustainable finance products will grow. The absence of common definitions of sustainability may give rise to “greenwashing,” i.e. making misleading claims about the environ-mental sustainability of a financial product. To prevent this, regulators and supervisors should help overcome market barriers and dysfunction on the supply and demand side. Noteworthy efforts in this respect are the European Commission’s action plan on sustainable finance, the ECB’s paying greater attention to climate change issues as well as the Austrian government’s green finance agenda. Predefining a credible pathway for linking carbon pricing to greenhouse gas emission targets would be the most effective – and least distorting – way to foster green finance and a smooth transition.
JEL classification: G2, O16, Q54Keywords: climate change, financial market development, sustainable finance
Finance is not an end in itself. It should serve the economy, which is part of the ecosystem. If ecology were just long-term economics, as indicated by the common Greek root of both terms, there would be no reason to get excited about “green” or “sustainable”2 finance. Yet, the effective neglect of environmental aspects in the real economy seems to leave green finance as a last resort. Amid subdued potential growth and an only slowly closing investment gap, green finance opens up oppor-tunities for the economy. It clearly sparks hope for the financial sector in times of low real equilibrium interest rates, excess savings and high global uncertainty (Carney, 2016).
Climate change implies market failure (Stern, 2006) as prices do not reflect the negative externalities of greenhouse gas (GHG) emissions. Since the atmosphere is the biggest public good, the tragedy of the commons (Hardin, 1968) applies especially
1 Oesterreichische Nationalbank, Foreign Research Division, [email protected]; Österreichische Gesell-schaft für Umwelt und Technik (ÖGUT), [email protected]; [email protected]; Federal Ministry for Climate Action, Environment, Energy, Mobility, Innovation and Technology, [email protected]. Opinions expressed by the authors do not necessarily reflect the official viewpoint of the Oesterreichische Nationalbank or the Eurosystem.
2 Aware of the lack of conceptual clarity, we use the terms green, sustainable or climate finance synonymously to refer to financial services that support an eco-friendly and sustainable economy taking also into account social and governance considerations. The reason for highlighting the environmental aspects is that climate change mitigation and adaptation are the most pervasive challenges and there might be important synergies between green, social and governance issues (IPCC, 2018).

Green finance – opportunities for the Austrian financial sector
46 OESTERREICHISCHE NATIONALBANK
to global warming. Moreover, climate change implies a tragedy of the horizon (Carney, 2015): it affects mainly future generations, while contemporaries have little interest in solving this issue. Warning against drawing over-simplistic conclusions from tragic parables, Ostrom (2009) proposed a polycentric approach to cope with the complex collective action problem that climate change poses. Building on strong commitment, various actors at multiple levels would learn from each other and align efforts to cut emissions. Here, the financial sector is certainly one, and probably powerful, actor. Guided by lawmakers’ right signals, financial markets should channel funds into sustainable projects.
Since the global commons require global governance, the 2015 Paris Climate Conference agreed on a common path to decarbonization within the current century.3 The agreement called for “Making finance flows consistent with a pathway toward low greenhouse gas emissions and climate-resilient development” (UNFCCC, 2015). Completely replacing fossil energy in the economy clearly requires gigantic investment volumes. Given that public budgets are strained, much of the funding will have to be raised privately.
Climate change and decarbonization pose risks4 to financial stability, which is why central banks and financial supervisors are getting involved (Pointner and Ritzberger-Grünwald, 2019). Less focus has been put on the opportunities offered by green finance: companies may, for instance, benefit from resource efficiency, energy independence, product innovation, market positioning and increased resilience. Moreover, with adequate risk management and strategic planning, risks can be turned into gainful opportunities. Focusing on this angle, this article reviews green finance market trends in Austria and beyond.
The remainder of this article is structured as follows: section 1 sketches the financing needs worldwide, in Europe and in Austria. Section 2 takes stock, from the supply side, of the development of the green finance market in Austria, as compared to its peers. Section 3 examines the demand potential given limited public awareness of sustainable finance products. Section 4 discusses the role that regulators and central banks may have in scaling up the green finance market, and section 5 summarizes and concludes.
1 How much does the transition to a low-carbon economy cost?Since climate change is a global phenomenon, any meaningful mitigation strategy must incorporate investment needs on a global scale. The figures circulating on various platforms are mind-blowing and hard to compare, as they reflect different scenarios, assumptions and metrics. The numbers represent costs which are not netted against the resulting huge savings in operational energy expenditures. To limit global warming to 1.5°C, the Intergovernmental Panel on Climate Change (IPCC, 2018) projects average annual investment needs in the energy system
3 The Paris Agreement calls for stabilizing global warming at well below 2 °C (ideally 1.5°C) above pre-industrial levels and reducing net anthropogenic greenhouse gas emissions to (net) zero during the second half of this century. With respect to “climate justice,” advanced economies should take the lead by pursuing more ambitious emission reduction targets. The signatory states pledged to step up, and regularly report on, their efforts to reach the above targets.
4 A distinction is made between physical risks, such as extreme weather events, and transition risks, such as climate policies that make fossil fuel-dependent sectors unprofitable. Both types of risks might trigger financial turbulences – a concern of macro- and microprudential policies – and might impact the economy as a whole – a concern of monetary policy.

Green finance – opportunities for the Austrian financial sector
FINANCIAL STABILITY REPORT 40 – NOVEMBER 2020 47
(demand and supply) of USD 2.4 trillion between 2016 and 2035.5 The Inter-national Energy Agency (IEA, 2019) estimates that a sustainable development scenario would require annual investment in the energy sector of about USD 3.2 trillion until 2040. According to the OECD (2017), to comply with a 2°C scenario, global investment in climate-relevant infrastructure – including energy and transport – would require USD 6.3 trillion each year up to 2030. On a positive note, global sustainable finance flows already exceeded the half-trillion U.S. dollar mark in 2017, driven particularly by added renewable energy capacity (CPI, 2019). At close to USD 257 billion6 in 2019, rapidly growing green bond issuance alone accounts for roughly half of that sum (Climate Bond Initiative, 2020).
Whichever way one calculates the remaining investment gap, the bulk of outlays must target emerging and developing economies, which leaves a relatively small share for Europe.7 Still, Europe captures almost half of the global market in sustainably invested assets (USD 14.1 trillion), however vaguely defined (GSIA, 2018). The EU is broadly on track to reach its climate and energy policy goal of reducing its GHG emissions by 40% by 2030 (baseline 1990).8 Furthermore, the European Commission (2020a) intends to raise the 2030 target to 55%, as is evident from its proposed European Green Deal that aims at climate neutrality by 2050. Earlier, the EU Action Plan on Financing Sustainable Growth (European Commission, 2018) set the stage for activities to strengthen sustainable finance. The European Commission (2020a) currently estimates that an additional EUR 350 billion of investment, or 2.5% of the EU’s GDP in 2019, will be necessary each year to reach the current 2030 targets.
Given a regular EU budget of just about 1.1% of the EU’s GDP and national debt sustainability concerns, these targets seem to be achievable only by also mobilizing private capital. Over the next decade, the new EU budget and associated instruments will mobilize at least EUR 1 trillion of private and public sustainable investments (European Commission, 2020b). At least one-quarter of the EU budget
5 This represents about 2.5% of global GDP but just 0.6% of the global stock of financial capital totaling USD 378.9 trillion in 2018 according to the Financial Stability Board (FSB, 2020).
6 This is just 0.25% of the outstanding global bond market (SIFMA, 2020).7 The share of the EU-27 in global GHG emissions is about 8.1% (Crippa et al., 2019).8 Other key EU targets by 2030 are increasing the share of renewable energy to at least 32% and improving energy
efficiency by at least 32.5%.
Table 1
Estimated financing needs for the transition to a low-carbon economy
Region Source Currency Billion p.a. Sector % of GDP Horizon
Global IPCC (2018) USD 2,400 energy 2.5 2016–35IEA (2019) USD 3,200 energy 3.7 by 2040OECD (2017) USD 6,300 infrastructure 7.2 by 2030
Europe European Commission (2020a) EUR 350 infrastructure 2.5 by 2030
Austria BMNT (2019) EUR 17 infrastructure 3.8 by 2030
Source: IPCC, IEA, OECD, European Commission, BMK (Federal Ministry for Climate Action, Environment, Energy, Mobility, Innovation and Technology), authors’ calculations.

Green finance – opportunities for the Austrian financial sector
48 OESTERREICHISCHE NATIONALBANK
is earmarked for climate investment, partly crowding in co-financing by Member States and private funding via guarantees through the InvestEU Programme operated by the European Investment Bank (EIB). Transforming itself into a climate bank, the EIB has also announced to invest EUR 1 trillion; there will, however, be a one-quarter trillion euro overlap with investment under the EU mandate. In response to the COVID-19 health crisis, the European Council (2020) decided to complement the EU budget with a debt-financed recovery fund of EUR 750 billion called Next Generation EU. Until 2024, 37% of the fund are meant to flow into climate investment and 30% should be raised by green bonds (Von der Leyen, 2020). To meet the above EU targets, EU funding will still have to be complemented at the national level.
In its climate and energy strategy #mission2030 (BMNT and BMVIT, 2019), the Austrian government plans to increase the share of renewable energy up to between 45% and 50% until 2030. Complying with EU reporting legislation, the national energy and climate plan (NECP; BMNT, 2019) defines pathways to reach these goals, while only partly underpinned by a policy mix of specific measures (Austrian Fiscal Advisory Council, 2020). According to the NECP, total investment needs for the period until 2030 will come to roughly EUR 170 billion. Annual expenses would represent 4.3% of Austria’s 2019 GDP. Without any explicitly mentioned allocations, these sums will have to be sourced from (sub)national budgets, European funds as well as private finance. Aiming for climate neutrality by 2040, the ambitious work program of Austria’s current federal government (Austrian Federal Chancellery, 2020) refers to the NECP without specifying the composition of funding sources.9
Taken together, all these impressive numbers give an idea of the enormous challenge ahead. However, as it is unclear how big a contribution general govern-ment will make, it is hard to identify the funding gaps to be filled by the private sector. In the longer term, carbon neutrality targets would even imply that virtually all finance must be green by 2050 at the latest – clearly a daunting task.
2 The development of green finance markets in Austria10
In Austria, sustainable finance has its roots in cooperative banks and savings asso-ciations that were founded in the mid-19th century and served social objectives.11 Mortgage-backed covered bonds (or Pfandbriefe in German) were a political instrument to cushion urbanization and, after World War II, to support recon-struction. Ecological investment funds emerged in 1980. Since 2003, staff provision funds (Mitarbeitervorsorgekassen) have been voluntarily following sustainability criteria, driven by employee representatives and having been certified by the Austrian Society for Environment and Technology ÖGUT, an independent nonprofit orga-nization.12 Moreover, almost all Austrian insurers have divested from coal and increasingly avoid environmental risks on both sides of their balance sheets.
9 The program mentions EUR 1 billion per year for renewable energy and EUR 2 billion for rail transport. Later, in response to the COVID-19 crisis, the government added some climate-relevant measures, e.g. an investment premium with an ecological component, budgeted at a total of EUR 1 billion.
10 We would like to thank Finn Strickert, who helped us draft this section.11 The origins of ethical investment date back to Anglo-Saxon Protestantism in the 18th century, excluding slave trade
or “sin stocks.”12 Transformed by law, these former severance payment funds effectively became the small second mandatory pillar in
the Austrian pension system. In contrast, voluntary pension funds are generally less sustainability oriented, despite being required to disclose their investment strategies.

Green finance – opportunities for the Austrian financial sector
FINANCIAL STABILITY REPORT 40 – NOVEMBER 2020 49
Box 1
Definitions of sustainable investment approaches
Various terms are used to describe sustainable investment: e.g. green finance, sustainable and responsible or socially responsible investment (SRI), or ethical investment. The most common market-driven strategies can be grouped into four categories, with somewhat blurring boundaries.
Exclusionary approaches reject investments (e.g. in weapons, fossil fuels) that conflict with investors’ values. Norm-based screening is used to select investments according to their compliance with international standards and norms. Divestment would involve selling securities considered unethical.
ESG integration means that asset managers explicitly include environmental, social and governance, i.e. ESG, factors in their financial analysis and that their investment decisions are based on research by (specialized) rating agencies or consulting firms. The similar best-in-class approach selects top ESG-performing investments within a universe, category or class of assets.
Impact investments are meant to directly generate social and ecological outcomes while seeking a financial return. Examples are microcredit funds or investment in renewable energy. In a similar vein, themed investments promote sustainability with a specific ESG focus.
Engagement strategies pursue active ownership through voting of shares and engaging in a dialogue with corporate management to promote sustainable behavior and/or increase disclosure.
Even though banks play a dominant role in the Austrian financial system, little is known about their sustainability targets. Partly filling the gap, WWF Austria undertook a rating of the ten largest Austrian retail banks, whose consolidated total assets amount to around EUR 600 billion (Leutgeb et al., 2019).13 None of the ten banks met the three top (out of seven) assessment categories; the highest rating scored by two banks was “high average.” Five other banks were rated “low
13 The rating evaluates said retail banks based on 25 weighted criteria that relate to corporate governance and the sustainability impact of a bank’s core business (savings and investments as well as loans and financing). Special emphasis is placed on both the direct and indirect environmental impact. The data are based on a survey and on publicly available information.
Sustainable investment strategies
Figure 1
Source: Authors’ compilation.
Exclusion
• Negative screening• Norm-based
screening• Divestment
ESGintegration
• Positive screening• Best-in-class
Impact investment
• Targeting a specific sustainable outcome
• Thematic strategies
Engagement
• Shareholder action – voting
• Dialogue about business strategy
Avoid Advance Alter

Green finance – opportunities for the Austrian financial sector
50 OESTERREICHISCHE NATIONALBANK
average,” one “below average” and two as “non-disclosing.” Although environmental and sustainability aspects are relatively well anchored in banks’ management, most examined banks focus purely on their environmental policy (e.g. facility management), ignoring the fact that the sustainability of their core business is far more relevant.14 After all, banks decide whether or not funds flow into eco-friendly sectors, activities or projects. A few banks have anchored sustainability in their corporate management (corporate social responsibility) but not yet systematically in their savings and investment strategies. Only one bank offered a “trend-setting” savings product. Leutgeb et al. (2019) conclude that the Austrian retail banking sector does not consistently include environmental aspects in loans and financing, except perhaps for corporate loans.
In terms of financial products, Austria’s green finance markets have grown rapidly after the global financial crisis (see chart 1). Taken together, the (unconsol-idated) volume of sustainably invested assets has grown seventeenfold in a decade to an amount of EUR 33.1 billion in 2019, corresponding to just about 1.4% of all financial assets in Austria. Since 2005, the bulk of the 35% average annual growth (including price effects) has mainly come from sustainable investment funds (total stock of EUR 14.7 billion) and sustainable investment mandates from customers (EUR 14.6 billion). Together, the two subsegments amount to about 15.9% of the entire Austrian investment market as defined by FNG (2020).15 Green bonds issued by banks and corporates represent a mere EUR 3.0 billion (Codagnone et al., 2020), yet this new market segment has grown fast16. The two small banks in Austria with fairly strict ethical und sustainable standards increased their deposits to just over EUR 0.8 billion.
14 Comprehensive reporting includes all three scopes of emissions: Scope 1 refers to direct emissions from owned or controlled sources. Scope 2 covers indirect emissions from purchased energy. Scope 3 includes all other indirect emissions that occur in a company’s value chain.
15 FNG (2020) distinguishes between sustainable investment products and mandates, with both explicitly including ESG criteria. Mandates are tailor-made mutual funds for institutional investors or high-net-worth individuals.
16 See Wiener Börse, the Vienna Stock Exchange, at https://www.wienerborse.at/marktdaten/anleihen/suche/?c7928%5Bi-WBAG__ID_BOND_TYPE%5D=1013.
EUR billion
60
50
40
30
20
10
0
120
100
80
60
40
20
0
EUR billion
Austria’s green finance markets (2005–2019)
Chart 1
Source: Forum Nachhaltige Geldanlagen (FNG), Wiener Börse.
Note: The figures are not consolidated.
Sustainable investment funds Sustainable investment mandates Deposits at sustainable banksGreen and social bonds Responsible investment (right-hand scale)
2005 2006 2007 2008 2009 2010 2011 2012 2013 2014 2015 2016 2017 2018 2019
Green finance – opportunities for the Austrian financial sector
FINANCIAL STABILITY REPORT 40 – NOVEMBER 2020 51
The by far biggest category shown in chart 1 is “responsible investment,” where, in contrast to sustainable investment (which is defined at the product level), sustainability criteria and strategies are defined at the corporate or institutional level (FNG, 2020). When we take this less stringent category into account, the size of the Austrian sustainable finance market would more than double to EUR 106.8 billion. This notwithstanding, Austria’s responsible market is dwarfed by that of Germany with a market volume of EUR 1.6 trillion.17 Even in terms of narrowly defined sustainable investment, the German and Swiss markets are still approximately ten times bigger than the Austrian market. However, in terms of relative market shares as defined by FNG, sustainable investment in Austria (15.9%) is ahead of Germany (5.4%) but behind Switzerland (38%). The three markets differ in various ways. For instance, the share of institutional investors is significantly lower in Switzerland. In Germany, churches and charity organizations are the biggest group of asset owners. Also, the amount of German deposits in sustainable banks is, proportionately speaking, several times larger than the com-parable figure in Austria. Unlike its German and Swiss counterparts, Austrian green bonds have not yet reached a critical mass (FNG, 2020).
Of the 113 Austrian sustainable funds, FNG (2020) reports that 71 have undergone certification and obtained a sustainability label. Codagnone et al. (2020) only look at those 67 funds that had been certified by the Austrian Ecolabel (Umweltzeichen) at end-2019. Their volume amounted to EUR 7.4 billion or 7.3% of all Austrian investment funds (EUR 94 billion). Still, also these narrowly defined investment volumes imply that this segment has seen significant growth, with 43 funds accounting for EUR 4.4 billion last year.
The most widely used sustainable investment strategy in Austria is exclusion (98%; FNG, 2020), with weapons, coal and nuclear power figuring most prominently. Other popular strategies are norm-based screening and best-in-class. Only around one-quarter of the capital comes from individual private investors, the rest from institutional investors. The latter are dominated by staff provision funds (56.4% of all sustainable investment assets held by institutional investors) and insurance companies (23.5%). These investors combine different strategies, such as best-in-class approaches, exclusion and international sustainability standards of uncertain stringency (e.g. UN Principles for Responsible Investments – PRI, or UN Global Compact).
Overall, investment funds dominate the universe of green finance products in Austria even though banks dominate the financial system, while Austria’s pension system and housing markets are more publicly organized than elsewhere.
As to the environmental friendliness of sustainable funds, there are some caveats in qualitative terms. Many of these funds use the rather broadly defined ESG criteria. Investment funds could cherry-pick the most convenient of the three ESG categories, with the climate impact remaining ambiguous. Financial firms committing themselves to the UN Sustainable Development Goals (SDGs) may even choose from 17 target areas. Surly there is a trade-off between comprehensiveness and arbitrariness.
To get an idea of the carbon reduction impact of sustainable funds available in Austria (including those issued abroad), we assessed data from CLEANVEST, an
17 Compared with 11 EU countries, the Austrian sustainable finance market segments are smallest (Eurosif, 2018).

Green finance – opportunities for the Austrian financial sector
52 OESTERREICHISCHE NATIONALBANK
online platform providing sustainability ratings18. According to these data, only 20%, i.e. 269 funds (with a volume of EUR 92.8 billion), of a total of 1,355 listed funds (EUR 585.2 billion) are considered sustainable (rated 7 or above on a scale up to 10). Of those 20%, only 186 funds (or 14% of total funds) exclude coal, oil and gas completely, as do 48 funds of the total rated below the threshold of 7.19 Dörig et al. (2020) analyze a sample of the complete universe of equity and bond funds managed by Austrian asset managers, whose disclosed carbon risks exceed benchmarks in neighboring countries. In comparison, Austrian funds provide the least information on underlying companies’ emissions, whereas both their total emission intensity and their exposure to fossil fuel reserves are highest.
3 The potential for green finance products in AustriaIn Austria, demand for green finance products is driven by institutional investors. The fact that households hold financial assets worth more than EUR 700 billion, however, also implies huge demand potential yet to be unlocked by bringing envi-ronmentally conscious private investors into the equation.
A survey of a representative household sample commissioned by Umweltzeichen (UZ; Austrian Ecolabel) in 2018 revealed a general lack of knowledge about sus-tainable financial products.20 Only 23% of the respondents had heard of sustainable financial products, with the percentages for men and middle-aged persons being somewhat higher (see chart 2). Only 8% found it very important, and another 32% rather important, that social and/or ecological aspects are considered in investments. For 55% (and particularly older respondents), however, this is of no importance. 30% would opt for a sustainable savings book if available, with women and young people more interested in such a product. In terms of actual ownership, however, savings books are more popular with older respondents. Checking accounts are the most common banking product among respondents (90%), followed by savings books (61%), pension insurance policies (26%) and mutual fund shares (15%). Only one-fifth of respondents had already been informed about and offered sustainable investment products by their banks.
Fessler, Jelovsek and Silgoner (2020) observed similar results in a more recent survey that was coordinated by the OECD.21 More than two-thirds of respondents “prefer to use financial companies that have a strong ethical stance” (see chart 3). This preference increases with age, which contradicts the results of the above-mentioned study and other financial research (MSCI, 2020) confirming the cliché of environmentally and socially conscious millennials, i.e. persons born after 1980.22
18 We received the information by e-mail on September 8, 2020, from ESG Plus GmbH, the company which designed www.cleanvest.org.
19 Apart from three different fossil fuels, CLEANVEST allows to check funds for investment in nuclear energy, child labor, weapons, indigenous rights, biodiversity risk, education and health services as well as green technologies. All these factors are given equal weights in the sustainability rating.
20 The multi-topic survey was carried out by Gallup and consisted of interviews of 1,000 households of the Austrian resident population aged 16 and over.
21 The results of the second wave of the Austrian Survey of Financial Literacy fed into the OECD/INFE survey on adults’ financial literacy.
22 Skepticism about such research (of financial firms) seems warranted for various reasons: (1) response biases in survey settings favor predefined options and socially accepted statements; (2) cohort effects tend to create generation myths that disappear in longitudinal studies over time; (3) millennials are still short of spare capital, which suggests discrepancies between declared preferences and actual behavior.
%
Total
Men
Women
14 to 30 years
31 to 50 years
51 years and older
How relevant are sustainable finance products to Austrians?
Chart 2
Source: Gallup, Umweltzeichen.
Have you ever heard of sustainable finance products? (Yes)How important is it, or would it be, for you to be able to use products and vehicles that consider social and/or ecological aspects, such as green savings books, green bonds or eco-label funds? (Very/rather important)
0 35 40 50455 10 15 20 25 30
23 40
26 38
21 42
19 46
26 42
24 35
Yes, I prefer to use financial companies that have a strong ethical stance
50%
55 60 65 70 75 80
Socioeconomic preferences for ethical finance in Austria
Chart 3
Source: OECD, OeNB.
69.2
66.6
71.7
74.7
67.8
70.5
70.4
67.6
75.6
73.5
68.0
60.2
67.7
74.7
77.6
61.0
68.0
68.0
76.0
78.0
Overall
Primary education
Secondary education
Tertiary education
Up to 3,000
3,000 to 5,000
5,000 to 1 million
Over 1 million
No income
0–900
900–1,350
1,350–1,650
1,650–1,950
1,950–3,000
Over 3,000
Young millennials (15–28)
Old millennials (29–38)
Generation X (39–58)
Baby boomers (59–74)
Silent generation (75 and older)
Education
Agglomeration (persons)
Monthly income (EUR)
Age

Green finance – opportunities for the Austrian financial sector
FINANCIAL STABILITY REPORT 40 – NOVEMBER 2020 53
online platform providing sustainability ratings18. According to these data, only 20%, i.e. 269 funds (with a volume of EUR 92.8 billion), of a total of 1,355 listed funds (EUR 585.2 billion) are considered sustainable (rated 7 or above on a scale up to 10). Of those 20%, only 186 funds (or 14% of total funds) exclude coal, oil and gas completely, as do 48 funds of the total rated below the threshold of 7.19 Dörig et al. (2020) analyze a sample of the complete universe of equity and bond funds managed by Austrian asset managers, whose disclosed carbon risks exceed benchmarks in neighboring countries. In comparison, Austrian funds provide the least information on underlying companies’ emissions, whereas both their total emission intensity and their exposure to fossil fuel reserves are highest.
3 The potential for green finance products in AustriaIn Austria, demand for green finance products is driven by institutional investors. The fact that households hold financial assets worth more than EUR 700 billion, however, also implies huge demand potential yet to be unlocked by bringing envi-ronmentally conscious private investors into the equation.
A survey of a representative household sample commissioned by Umweltzeichen (UZ; Austrian Ecolabel) in 2018 revealed a general lack of knowledge about sus-tainable financial products.20 Only 23% of the respondents had heard of sustainable financial products, with the percentages for men and middle-aged persons being somewhat higher (see chart 2). Only 8% found it very important, and another 32% rather important, that social and/or ecological aspects are considered in investments. For 55% (and particularly older respondents), however, this is of no importance. 30% would opt for a sustainable savings book if available, with women and young people more interested in such a product. In terms of actual ownership, however, savings books are more popular with older respondents. Checking accounts are the most common banking product among respondents (90%), followed by savings books (61%), pension insurance policies (26%) and mutual fund shares (15%). Only one-fifth of respondents had already been informed about and offered sustainable investment products by their banks.
Fessler, Jelovsek and Silgoner (2020) observed similar results in a more recent survey that was coordinated by the OECD.21 More than two-thirds of respondents “prefer to use financial companies that have a strong ethical stance” (see chart 3). This preference increases with age, which contradicts the results of the above-mentioned study and other financial research (MSCI, 2020) confirming the cliché of environmentally and socially conscious millennials, i.e. persons born after 1980.22
18 We received the information by e-mail on September 8, 2020, from ESG Plus GmbH, the company which designed www.cleanvest.org.
19 Apart from three different fossil fuels, CLEANVEST allows to check funds for investment in nuclear energy, child labor, weapons, indigenous rights, biodiversity risk, education and health services as well as green technologies. All these factors are given equal weights in the sustainability rating.
20 The multi-topic survey was carried out by Gallup and consisted of interviews of 1,000 households of the Austrian resident population aged 16 and over.
21 The results of the second wave of the Austrian Survey of Financial Literacy fed into the OECD/INFE survey on adults’ financial literacy.
22 Skepticism about such research (of financial firms) seems warranted for various reasons: (1) response biases in survey settings favor predefined options and socially accepted statements; (2) cohort effects tend to create generation myths that disappear in longitudinal studies over time; (3) millennials are still short of spare capital, which suggests discrepancies between declared preferences and actual behavior.
%
Total
Men
Women
14 to 30 years
31 to 50 years
51 years and older
How relevant are sustainable finance products to Austrians?
Chart 2
Source: Gallup, Umweltzeichen.
Have you ever heard of sustainable finance products? (Yes)How important is it, or would it be, for you to be able to use products and vehicles that consider social and/or ecological aspects, such as green savings books, green bonds or eco-label funds? (Very/rather important)
0 35 40 50455 10 15 20 25 30
23 40
26 38
21 42
19 46
26 42
24 35
Yes, I prefer to use financial companies that have a strong ethical stance
50%
55 60 65 70 75 80
Socioeconomic preferences for ethical finance in Austria
Chart 3
Source: OECD, OeNB.
69.2
66.6
71.7
74.7
67.8
70.5
70.4
67.6
75.6
73.5
68.0
60.2
67.7
74.7
77.6
61.0
68.0
68.0
76.0
78.0
Overall
Primary education
Secondary education
Tertiary education
Up to 3,000
3,000 to 5,000
5,000 to 1 million
Over 1 million
No income
0–900
900–1,350
1,350–1,650
1,650–1,950
1,950–3,000
Over 3,000
Young millennials (15–28)
Old millennials (29–38)
Generation X (39–58)
Baby boomers (59–74)
Silent generation (75 and older)
Education
Agglomeration (persons)
Monthly income (EUR)
Age

Green finance – opportunities for the Austrian financial sector
54 OESTERREICHISCHE NATIONALBANK
Women and people with higher education seem to be more interested in the ethical stance of financial companies. Regarding income and agglomeration, the answers follow a U-shaped pattern: both high- and low-income earners, as well as people living in mid-sized urban areas, are more likely to endorse features of sustainable finance.
The outcome of a survey conducted by Germany’s Federal Financial Supervisory Authority (BaFin, 2019) suggests that awareness of green finance in Germany is higher than in Austria. Roughly 65% of the German respondents can imagine making a sustainable investment, although for 60% it is not exactly clear what the term sustainable finance stands for. Considering all (i.e. ecological, social and ethical) aspects of sustainable investments, a majority thinks that promoting climate protection is most important.
The most recent data on consumer awareness about green finance in the Euro-barometer 501 (European Commission, 2020c) paint a less encouraging picture. Only 5% of respondents think that making the banking and insurance systems eco-friendlier is an effective way to tackle environmental problems. In Austria, while still low, this percentage is nearly twice as high (9%). As with the Austrian UZ survey, the data indicate that younger people are more aware of green finance, whereas older generations (aged 50+) have yet to recognize its importance. On a positive note, the high approval for “changing the way we consume” might also include the “consumption” of financial products.
All in all, people’s awareness of sustainability issues seems to be growing, and so is their readiness to make a contribution, even if in terms of saving decisions. This notwithstanding, people tend to underrate the responsibility and significance that banks and other financial institutions have to bring about change in this respect. At present, the awareness/action gap is still substantial.
4 The role of regulation in scaling up green financeGreening the financial system must be seen in context with other levels of environ-mental policies (see figure 2). The most direct approach to preventing emissions is command and control regulation at the level of material production or consumption, i.e. standard-setting and enforcement. Going beyond this, green industrial policy shapes structural change paving the way to a carbon-neutral economy (Altenburg and Rodrik, 2017). Many economists, however, prefer the less distortive fiscal policy approach of carbon pricing, either via a carbon tax (fixed price) or a cap-and-trade scheme (fixed quantity). Alternatively, relative prices can be adjusted by means of subsidies or public investment in green industries. At the highest level of abstraction, regulatory policies are used to incentivize green finance in the financial sector.
Importantly, green finance is not only fostered by financial regulation. Policies that price or ban pollution send also more immediate price signals to financial markets. The interplay between the three policy layers is riddled with political economy issues, since every instrument creates winners and losers. As we are running out of time on climate change, all three levels are indispensable, however, by offering complementarities and synergies.
The Paris Agreement sets the pace in multilevel governance of climate action. It combines top-down provisions, i.e. global emission goals as well as accountability procedures, with bottom-up emission targets recognizing different national circumstances. The sum of all nationally determined contributions does not yet
Levels of policies to address climate change
Figure 2
Source: Authors’ compilation.
Green finance taxonomy, disclosure,
standards, labels, risk buffers, monetary policy, etc.
Carbon pricinggreen fiscal policies:
e.g. carbon tax, ETS or subsidies, investment
Command and control regulationgreen industrial policy and structural reforms
Regulatory initiatives for green finance
Figure 3
Source: Authors’ compilation.
Global2015 Paris AgreementUN 2030 Agenda – SDGs• TCFD –
Disclosure of companies• NGFS – Central banks
and financial supervisors• CAPE – Finance ministers
EuropeEuropean Green Deal• Climate neutral by 2050• Investment plan
EU Action Plan: Financing Sustainable Growth• Taxonomy• Standards and labels• Disclosure• Benchmarks
Austria• Mission#2030• NECP • Government program 2020• Citizen foundations• Green bonds• Withholding tax
exemption• Green supporting factor
(at EU level)• Greening public investment

Green finance – opportunities for the Austrian financial sector
FINANCIAL STABILITY REPORT 40 – NOVEMBER 2020 55
add up to the global goal, however.23 Several efforts are underway to substantiate these commitments. For instance, a Coalition of Finance Ministers for Climate Action (CAPE, over 50 countries, including Austria) has announced to align fiscal policies with the Paris Agreement, in particular, via effective carbon pricing.24 Similarly, more than 70 central banks and financial supervisors (including the OeNB) have to date joined a Network for Greening the Financial System (NGFS, 2019) and intend
23 According to climateactiontracker.org, the current pledges and targets would lead to global temperature increases of 2.8°C (mean value) above pre-industrial levels, and actual policy commitments might lead to an even higher average of +3°C.
24 See https://www.financeministersforclimate.org/sites/cape/files/inline-files/Helsinki%20Principles%20-%20final.pdf
Women and people with higher education seem to be more interested in the ethical stance of financial companies. Regarding income and agglomeration, the answers follow a U-shaped pattern: both high- and low-income earners, as well as people living in mid-sized urban areas, are more likely to endorse features of sustainable finance.
The outcome of a survey conducted by Germany’s Federal Financial Supervisory Authority (BaFin, 2019) suggests that awareness of green finance in Germany is higher than in Austria. Roughly 65% of the German respondents can imagine making a sustainable investment, although for 60% it is not exactly clear what the term sustainable finance stands for. Considering all (i.e. ecological, social and ethical) aspects of sustainable investments, a majority thinks that promoting climate protection is most important.
The most recent data on consumer awareness about green finance in the Euro-barometer 501 (European Commission, 2020c) paint a less encouraging picture. Only 5% of respondents think that making the banking and insurance systems eco-friendlier is an effective way to tackle environmental problems. In Austria, while still low, this percentage is nearly twice as high (9%). As with the Austrian UZ survey, the data indicate that younger people are more aware of green finance, whereas older generations (aged 50+) have yet to recognize its importance. On a positive note, the high approval for “changing the way we consume” might also include the “consumption” of financial products.
All in all, people’s awareness of sustainability issues seems to be growing, and so is their readiness to make a contribution, even if in terms of saving decisions. This notwithstanding, people tend to underrate the responsibility and significance that banks and other financial institutions have to bring about change in this respect. At present, the awareness/action gap is still substantial.
4 The role of regulation in scaling up green financeGreening the financial system must be seen in context with other levels of environ-mental policies (see figure 2). The most direct approach to preventing emissions is command and control regulation at the level of material production or consumption, i.e. standard-setting and enforcement. Going beyond this, green industrial policy shapes structural change paving the way to a carbon-neutral economy (Altenburg and Rodrik, 2017). Many economists, however, prefer the less distortive fiscal policy approach of carbon pricing, either via a carbon tax (fixed price) or a cap-and-trade scheme (fixed quantity). Alternatively, relative prices can be adjusted by means of subsidies or public investment in green industries. At the highest level of abstraction, regulatory policies are used to incentivize green finance in the financial sector.
Importantly, green finance is not only fostered by financial regulation. Policies that price or ban pollution send also more immediate price signals to financial markets. The interplay between the three policy layers is riddled with political economy issues, since every instrument creates winners and losers. As we are running out of time on climate change, all three levels are indispensable, however, by offering complementarities and synergies.
The Paris Agreement sets the pace in multilevel governance of climate action. It combines top-down provisions, i.e. global emission goals as well as accountability procedures, with bottom-up emission targets recognizing different national circumstances. The sum of all nationally determined contributions does not yet
Levels of policies to address climate change
Figure 2
Source: Authors’ compilation.
Green finance taxonomy, disclosure,
standards, labels, risk buffers, monetary policy, etc.
Carbon pricinggreen fiscal policies:
e.g. carbon tax, ETS or subsidies, investment
Command and control regulationgreen industrial policy and structural reforms
Regulatory initiatives for green finance
Figure 3
Source: Authors’ compilation.
Global2015 Paris AgreementUN 2030 Agenda – SDGs• TCFD –
Disclosure of companies• NGFS – Central banks
and financial supervisors• CAPE – Finance ministers
EuropeEuropean Green Deal• Climate neutral by 2050• Investment plan
EU Action Plan: Financing Sustainable Growth• Taxonomy• Standards and labels• Disclosure• Benchmarks
Austria• Mission#2030• NECP • Government program 2020• Citizen foundations• Green bonds• Withholding tax
exemption• Green supporting factor
(at EU level)• Greening public investment

Green finance – opportunities for the Austrian financial sector
56 OESTERREICHISCHE NATIONALBANK
to scale up green finance through supervision, portfolio management, data collection and raising awareness. Another initiative is the Task Force on Climate-related Financial Disclosures (TCFD, 2017) of the global Financial Stability Board that is supported by more than 1,400 firms (and some governments) that have committed themselves to higher transparency standards. No more than six Austrian companies currently support this initiative, two of which are included in the Austrian Traded Index (ATX).25
The EU’s action plan on sustainable finance is meant to help channel capital flows into a low-carbon economy, manage climate-related financial risks and foster transparency in finance (European Commission, 2018). One key project is the so-called taxonomy, an EU system for classifying sustainable activities to combat both market fragmentation and “greenwashing,” i.e. the practice of making unsubstan-tiated or misleading claims about the environmental sustainability of financial products. The European Commission’s delegated acts on the taxonomy for climate action should be fully applied from 2022 onward.
Another aspect of the European Commission’s action plan, the option to relax prudential rules for banks and insurers by a green supporting factor, has sparked criticism (Pointner and Ritzberger-Grünwald, 2019): Lowering capital reserve requirements would undermine the crisis lesson for financial market resilience; capital buffers have only a marginal impact on sustainable investments; and there is no clear evidence that green investment is generally less risky than gray (i.e. carbon- intensive) one. Only energy-efficiency mortgages seem to be safer than benchmark mortgages (Guin and Korhonen, 2020). Based on this hypothesis, the Hungarian central bank has introduced a supporting factor for green housing loans (MNB, 2020). In contrast, a penalty factor on high-carbon investments would have a larger effect due to the much bigger universe of gray assets. However, a gray penalizing factor may propel destabilizing divestment reactions while a green supporting factor could boost longer-term scaling-up of green finance. Moreover, the lack of a “gray taxonomy” impedes meaningful differentiation between various shades of gray, which would be a prerequisite for a penalty factor.26
As for the ECB, a consensus seems to be emerging that dealing with climate issues is compatible with its mandate, which reflects a hierarchy of objectives: price stability, financial stability and other policy goals including sustainable development (Article 3 of the EU Treaty). While the ECB’s consideration of climate-related financial and monetary risks is undisputed, its providing active support for the transition to low-carbon economies is still under debate (Breitenfellner et al., 2019). Here, the ECB can use its current strategy review to determine to what extent carbon neutrality of its monetary policy operations could be limited by required but hard-to-define market neutrality (Dafermos et al., 2020). Given that green finance does not yet face a level playing field for lack of a transparent market infrastructure and information, there may well be room for central banks to support green finance in a non-distortive manner.
Apparently, EU fiscal policy has hampered the well-established system of covered bonds by interrupting the underlying financing chain because the Maastricht criteria
25 Research (Dörig et al., 2020) suggests that the ATX was geared toward a 6°C scenario, mostly due to the high exposure to emission-intensive sectors.
26 Complementing the green taxonomy by a gray one would help shift the burden of proof away from those parts of the economy one wishes to promote.

Green finance – opportunities for the Austrian financial sector
FINANCIAL STABILITY REPORT 40 – NOVEMBER 2020 57
disincentivize public guarantees for infrastructure financing. As a result, we have seen only little issuance of public-sector covered bonds in recent years, even though their demand potential is buoyed by low risk and higher yields (compared with sovereign bonds). Covered bonds would be ideal for financing the low-carbon transition as governments can define investment guidelines requiring compliance with eco-friendly principles, e.g. renewable energy sources for municipalities. It may therefore be worth considering exempting climate-related investments from the Stability and Growth Pact (in line with a “green golden investment rule”).
Climate-related risk awareness is also the starting point for opportunity strategies. The Austrian Financial Market Authority (FMA, 2020) has addressed this by issuing guidelines. This first step of soft regulation will certainly be complemented by various Europe-wide coordinated supervisory measures, which will eventually lead to climate stress tests, something the Dutch and the Romanian authorities have already experimented with.
Addressing opportunities rather than risks is probably more popular and edu-cative, as reflected in the green finance agenda Austria’s federal government has incorporated in its current work program (Austrian Federal Chancellery, 2020). The main goals are (1) promoting citizen foundations for climate action, (2) issuing sovereign green bonds, (3) making sustainable investments exempt from capital gains tax and (4) promoting a green supporting factor in capital requirements at the European level. Apart from various dirigiste policies, the program, more importantly, announces an eco-social tax reform, albeit in vague terms. While ambitious, the program could have advanced further elements, such as ecofinancial education27 to raise awareness.
Since 2004, investment funds in Austria may be awarded an Austrian ecolabel for sustainable financial products (abbreviated as UZ 49; Österreichisches Umwelt-zeichen, 2020). The eligibility criteria have been tightened in 2020, and the product range has been extended. To date, 140 mutual funds, 2 savings books, 2 checking accounts, 6 insurance products and 2 green bonds have been certified. While awareness of the UZ 49 ecolabel is still low (one in ten), its impact should not be underestimated given synergies with similar ecolabels for the real economy.
Austrian authorities could also endorse independent information platforms, such as cleanvest.org or gruenesgeld.at, which provide reliable, systematic and easily accessible information about green finance products. Similarly, supporting inde-pendent and publicly available sustainability ratings, such as those of the WWF for banks, may help improve relevant intelligence about all financial firms. Finally, in view of future regulation at the European and international level, efforts should be stepped up to fill existing data gaps. Only if the environmental impact of all direct and indirect GHG emissions (scope 1 to 3) is adequately measured and the addi-tionality28 of investment is disclosed, will we be able to assess the contribution green finance is truly making to the transition to a low-carbon economy.
27 This could, inter alia, help expose the widespread assumption of a trade-off between investment-related performance and sustainability (Friede et al., 2015). Cañón-de-Francia and Garcés-Ayerbe (2019), however, put the “ it pays to be green hypothesis” into perspective. Political volatility regarding framework conditions reduces investment security and increases risks, while environmentally harmful subsidies distort markets.
28 This means providing evidence that shows that a given investment leads to GHG reductions in addition to those which would have occurred at any rate.
Green finance – opportunities for the Austrian financial sector
58 OESTERREICHISCHE NATIONALBANK
5 Summary and concluding remarks
Against the backdrop of topical climate change debates, green finance is gaining traction, with people increasingly seeking to align their savings and investments with environmental, social and governance (ESG) factors. While dynamic, the Austrian green finance market is still underdeveloped; it is dominated by mutual funds and driven by institutional investors. It has huge potential for growth, given private investors’ as yet low awareness of sustainable financial products. Transparency should go hand in hand with this because even if it is getting easier to find supposedly green investment products, it is almost impossible for a layperson to discern how green they really are. Work is underway to address this deficit: as a case in point, the EU action plan on sustainable finance is set to spur growth of sustainable investments in the coming years. Meanwhile, independent ecolabels and platforms, such as Umweltzeichen, Grünes Geld or CLEANVEST, help alleviate the information gap.
Finance can act as a catalyst for greening the economy, but it can never be greener than the economy, except in the presence of a “green bubble.” Eventually, green finance must and will be measured by its contribution to decoupling green-house gas (GHG) emissions from economic growth. Finance will, however, have to be supported by legislation that reflects a broad consensus among all stakeholders as well as guidance and disclosure to help investors make informed decisions and thus contribute to decarbonization. If incentives are misdirected, investment restraint is only rational. Investors are aware of the political dilemma arising from the shrinking window of opportunity to act and the time needed to balance different interests. In addition, the financial sector continues to pay little attention to climate risks in its balance sheets. All the encouraging signs of takeoff notwithstanding, green finance markets therefore still have a long way to go from niche to mainstream.
As a rule, central banks and financial supervisors focus on the risks of the climate-finance nexus. They, too, can contribute to scaling up sustainable finance markets, however. First, by urging for proper risk disclosure and management, they help the sector seize new profitable opportunities. Second, by providing transparency, visibility and a level playing field, they help develop the green finance industry, which is still in its infancy. Third, they may lead by example by adopting sustainability policies and by greening their own portfolios and monetary policy, while putting market neutrality aspects into perspective. Constrained by their mandates, central banks and financial supervisors can only contribute to tasks that are a prerogative of elected governments, namely setting objectives, taking initiative and following through on commitments made.
The green finance aspects of the Austrian government program are ambitious by international standards. This is positive from a financial stability perspective provided implementation of these aspects is based on evidence. There is one key driver for green finance that is comparatively risk-free: a predictable carbon price path that meets the targets set in the Paris Agreement. Just like most countries, Austria must live up to its commitments and come through with adequate policy measures. Greater certainty about policy direction and resolute action will unlock the potential of sustainable and productive investment.

Green finance – opportunities for the Austrian financial sector
FINANCIAL STABILITY REPORT 40 – NOVEMBER 2020 59
References
Altenburg, T. and D. Rodrik. 2017. Green industrial policy: Accelerating structural change towards wealthy green economies. In: Altenburg, T. and C. Assmann (eds.). Green Industrial Policy. Concept, Policies, Country Experiences. Geneva, Bonn: UN Environment; German Devel-opment Institute / Deutsches Institut für Entwicklungspolitik.
Austrian Federal Chancellery. 2020. Aus Verantwortung für Österreich. Regierungsprogramm 2020–2024. https://www.bundeskanzleramt.gv.at/bundeskanzleramt/die-bundesregierung/ regierungsdokumente.html
Austrian Fiscal Advisory Council. 2020. Fiskalpolitische Dimension der CO2-Ziele und Handlungs-optionen für Österreich. Information by the Office of the Austrian Fiscal Advisory Council dated August 27. https://www.fiskalrat.at/Publikationen/Sonstige/sonstige-ausarbeitungen-des-bueros.html
BaFin. 2019. How safe are sustainable investments. https://www.bafin.de/SharedDocs/Veroeffent-tlichungen/EN/Fachartikel/2019/fa_bj_1906_nachhaltige_Geldanlage_en.html.
Breitenfellner, A., W. Pointner and H. Schuberth. 2019. The potential contribution of central banks to green finance. In: Vierteljahrshefte zur Wirtschaftsforschung. 88(2). 55–71.
BMNT. 2019. Integrierter nationaler Energie- und Klimaplan für Österreich, 2021–2030. https://www.bmk.gv.at/themen/klima_umwelt/klimaschutz/nat_klimapolitik/energie_klimaplan.html
BMNT and BMVIT. 2019. #mission2030: Die österreichische Klima- und Energiestrategie.Brundtland, G. H. 1987. Report of the World Commission on Environment and Development:
Our Common Future. United Nations General Assembly document. https://sustainabledevelopment.un.org/content/documents/5987our-common-future.pdf
Cañón-de-Francia, J. and C. Garcés-Ayerbe. 2019. Factors and Contingencies for the “It Pays to Be Green Hypothesis”. The European Union’s Emissions Trading System (EU ETS) and Financial Crisis as Contexts. In: International Journal of Environmental Research and Public Health 16(16). August. 2988.
Carney, M. 2015. Breaking the Tragedy of the Horizon – climate change and financial stability. Speech at Lloyd’s of London. September 29.
Carney, M. 2016. Resolving the climate paradox. Speech at Arthur Burns Memorial Lecture in Berlin. September 22.
Climate Bond Initiative. 2020. 2019 Green Bond Market Summary. https://www.climatebonds.net/resources/reports
Codagnone, R., J. Wagner and J.C. Zhan. 2020. Nachhaltige Investmentzertifikate und Anleihen in Österreich. In: Statistiken – Daten und Analysen Q2/20. OeNB. 47–55.
CPI. 2019. Global Landscape of Climate Finance 2019. https://www.climatepolicyinitiative.org/publication/global-landscape-of-climate-finance-2019/.
Crippa, M., G. Oreggioni, D. Guizzardi, M. Muntean, E. Schaaf, E. Lo Vullo, E. Solazzo, F. Monforti-Ferrario, J.G.J. Olivier and E. Vignati. 2019. Fossil CO2 and GHG emissions of all world countries. Luxembourg: Publications Office of the European Union.
Dafermos, Y., D. Gabor, M. Nikolaidi, A. Pawloff and F. van Lerven. 2020. Decarbonising is easy – beyond market neutrality in the ECB’s corporate QE. The New Economics Foundation.
Deml, M. and H. Blisse. 2017. Grünes Geld. Handbuch für nachhaltige Geldanlage. 8. aktualisierte Auflage. Vienna: Medianet Verlag.
Dörig, P., V. Lutz, W. Rattay, M. Stadelmann, D. Jorisch, S. Kunesch and N. Glas. 2020. Kohlenstoffrisiken für den österreichischen Kapitalmarkt (Carbon exposure. The Austrian state of the market). RiskFinPorto – Working Paper 4. https://docs.umweltbundesamt.at/s/NBrHDDP7SXAATnY.
European Commission. 2018. Action Plan: Financing Sustainable Growth COM(2018) 97.European Commission. 2020a. Stepping up Europe’s 2030 climate ambition. COM(2020) 562 final.

Green finance – opportunities for the Austrian financial sector
60 OESTERREICHISCHE NATIONALBANK
European Commission. 2020b. Sustainable Europe Investment Plan. European Green Deal Investment Plan. COM(2020) 21.
European Commission. 2020c. Special Eurobarometer 501 survey on Attitudes of European citizens towards the Environment. March.
European Council. 2020. Special meeting of the European Council (17, 18, 19, 20 and 21 July 2020) – Conclusions. EUCO 10/20.
Eurosif. 2018. European SRI study. http://www.eurosif.org/wp-content/uploads/2018/11/Europep-an-SRI-2018-Study.pdf.
Fessler, P., M. Jelovsek and M. Silgoner. 2020. Financial literacy in Austria – focus on millennials. In: Monetary Policy & the Economy Q3/20. OeNB. Forthcoming.
FMA. 2020. Leitfaden Nachhaltigkeitsrisiken. Konsultationspapier. FNG. 2020. Marktbericht Nachhaltige Geldanlagen 2020 – Deutschland, Österreich und die Schweiz. Friede, G., T. Busch and A. Bassen. 2015. ESG and financial performance: aggregated evidence
from more than 2000 empirical studies. In: Journal of Sustainable Finance & Investment 5(4). 210–233.
FSB. 2020. Global Monitoring Report on Non-Bank Financial Intermediation 2019.GSIA. 2018. Global Sustainable Investment Review. http://www.gsi-alliance.org/wp-content/
uploads/2019/03/GSIR_Review2018.3.28.pdf Günsberg, G. and J. Fucik. 2019. Faktencheck Green Finance. Vienna: Klima und Energiefonds. Guin, B. and P. Korhonen. 2020. Does energy efficiency predict mortgage performance? Bank
of England Staff Working Paper 852.Hardin, G. 1968. The Tragedy of the Commons. In: Science 162. 1243–48.IEA. 2019. World Energy Outlook 2019.IPCC. 2018. Global warming of 1.5°C: An IPCC special report on the impacts of global warming
of 1.5°C above pre-industrial levels and related global greenhouse gas emission pathways, in the context of strengthening the global response to the threat of climate change, sustainable devel-opment, and efforts to eradicate poverty. SR 15. Geneva: Intergovernmental Panel on Climate Change.
Leutgeb, N., A. Colard, M. Ambacher, G. Klaushofer, C. Amstutz and R. Schwegler. 2019. Nachhaltigkeit im österreichischen Retailbanking: WWF-Rating des österreichischen Retailbankings 2018/2019. WWF Österreich und ESG Plus GmbH.
MNB. 2020. Energy-efficient mortgage initiative: the MNB welcomes the first Hungarian bank. https://www.mnb.hu/en/pressroom/press-releases/press-releases-2020/energy-efficient-mort-gage-initiative-the-mnb-welcomes-the-first-hungarian-bank.
MSCI. 2020. Swipe to invest: The story behind millennials and ESG investing. January. https://www.msci.com/documents/10199/07e7a7d3-59c3-4d0b-b0b5-029e8fd3974b
NGFS. 2019. Comprehensive Report. https://www.ngfs.net/en/liste-chronologique/ngfs-publications OECD. 2017. Investing in Climate, Investing in Growth. Österreichisches Umweltzeichen. 2020. Richtlinie UZ 49 – Nachhaltige Finanzprodukte.
Version 5.0. January 1.Ostrom, E. 2009. A Polycentric Approach for Coping with Climate Change. World Bank Policy
Research Working Paper 5095.Pöchel, T., A. Schober-Rhomberg, A. Trachta and M. Wicho. 2019. Nonbank financial
intermediation in Austria – developments since 2008. In: Financial Stability Report 38. OeNB. 74–86. Pointner, W. and D. Ritzberger-Grünwald. 2019. Climate change as a risk to financial stability.
In: Financial Stability Report 38. OeNB. 30–45.SIFMA. 2020. Capital Markets Fact Book 2019. https://www.sifma.org/resources/research/fact-book/

Green finance – opportunities for the Austrian financial sector
FINANCIAL STABILITY REPORT 40 – NOVEMBER 2020 61
Stern, N. 2006. Stern Review on The Economics of Climate Change (pre-publication edition). Executive Summary. London: HM Treasury.
TCFD. 2017. Implementing the Recommendations of the Task Force on Climate-related Financial Disclosures. June.
UNFCCC. 2015. Paris Agreement. United Nations Framework Convention on Climate Change, Bonn. https://unfccc.int/files/essential_background/convention/application/pdf/english_paris_agreement.pdf
Von der Leyen, Ursula. 2020. State of the Union Address 2020.Wiener Börse. 2020. Green und Social Bonds. www.wienerborse.at/marktdaten/anleihen/
suche/?c7928%5BWBAG__ID_BOND_TYPE%5D=1013World Bank. 2019. The Coalition of Finance Ministers for Climate Action. World Bank-IMF
Spring Meetings 2019. April 13. http://pubdocs.worldbank.org/en/646831555088732759/FM-Co.-alition-Brochure-final-v3.pdf

FINANCIAL STABILITY REPORT 40 – NOVEMBER 2020 63
Modeling the COVID-19 effects on the Austrian economy and banking system
Martin Guth, Christian Lipp, Claus Puhr, Martin Schneider1
Refereed by: Leopold Sögner, Institute for Advanced Studies (IHS)
In response to the COVID-19 pandemic, many governments around the globe have imposed strict containment measures to prevent the further spreading of the virus. While saving lives, such lockdowns have also led to the largest peacetime economic shock since the Great Depression of the 1930s. To lessen the blow, governments have been complementing containment measures with mitigating measures. The latter serve to cushion both companies’ and households’ loss of revenue and income suffered during lockdowns, when nonessential economic activity has been suspended or cut to a minimum. In this paper, we only consider mitigating measures addressed to incorporated firms and banks.
To assess the vulnerabilities of the Austrian economy and banking system, we follow a two-step approach. First, we have developed a novel model to assess the impact of both containment and mitigating measures on the real economy. This approach combines firm-level micro data from two different databases. To close remaining data gaps, we employ a Monte Carlo simulation to assess the effects of two scenarios based on the current OeNB economic forecast for Austria. We combine these scenarios capturing various policy reactions, i.e. mitigating measures, with firms’ solvency and liquidity positions and ultimately derive sectoral insolvency rates.
Second, we use the OeNB’s top-down stress testing framework ARNIE to assess the COVID-19 impact on the banking system. Rather than employing large-scale regression models to derive risk parameters for credit risk, we infer default probabilities of banks’ credit exposure from the Austrian insolvency rates described above. Then, we extrapolate insolvency rates for domestic retail exposures and nondomestic exposures of the Austrian banking system. Here, we assume that individual industry sectors face similar challenges across countries and that country-specific GDP forecasts reflect the overall severity with which individual countries are affected by the pandemic. To this end, we draw on GDP forecasts by the ECB for countries other than Austria as well as country aggregates to calculate scaling factors based on the relative GDP-level deviation.
We find that the mitigating measures up to end-August 2020, while effective, only partly offset the COVID-19-induced shock to Austrian firms and banks. They do, however, play an important role in lowering insolvency rates both on aggregate and in the hardest-hit sectors. As a side effect, the mitigating measures taken by the Austrian government and other institutions help improve the outlook for the Austrian banking system, which may benefit indirectly. Moreover, the top-down solvency stress test results show that the Austrian banking system – not only on an aggregate, but also on a disaggregate level – remains well capitalized despite the expected increase in insolvencies. At the time of publication, both COVID-19 containment and mitigating measures will have been extended, which calls into question some of the results of the paper. However, the main conclusion will nevertheless hold: only a substantial further deterioration of the COVID-19 pandemic could put the banking system in a difficult position.
JEL classification: C54, G21, G33Keywords: COVID-19, corporate insolvency, bank stress testing, quantitative policy modeling
1 Oesterreichische Nationalbank, Supervision Policy, Regulation and Strategy Division, [email protected], [email protected], [email protected]; Economic Analysis Division, [email protected]. Opinions expressed by the authors of studies do not necessarily reflect the official viewpoint of the OeNB or the Eurosystem. The authors would like to thank Gerhard Fenz, Dieter Huber, Michael Kaden, Doris Oswald, Doris Prammer, Christoph Prenner, Christian Ragacs, Ralph Spitzer, Alfred Stiglbauer, Klaus Vondra and Elisabeth Woschnagg (all OeNB) for helpful comments and valuable support.

Modeling the COVID-19 effects on the Austrian economy and banking system
64 OESTERREICHISCHE NATIONALBANK
2020 has shown us that it takes new approaches to gauge the impact of COVID-19 on both the real economy and the banking sector as well as to evaluate the effectiveness of measures taken by governments to cushion the blow of this unique situation. With the OeNB’s Economic Analysis and Research Department joining forces with the Supervision Policy, Regulation and Strategy Division, we have developed a new corporate insolvency model based on simulated firm-level balance sheet, profit and loss as well as cash flow data to determine sectoral insolvency rates for Austrian firms (Puhr and Schneider, 2021). Judging from the comparable literature, we are among the first to develop such a model. Based on firm-level data, some recent studies look at firms’ liquidity position amid the COVID-19 pandemic (see Blanco et al., 2020; Guerini et al., 2020; OECD, 2020; De Vito and Gomez, 2020). Compared with these studies, our approach to firm-level data is significantly more parsimonious, but we still model mitigating measures at a very granular level.
The output of our insolvency model, which we calibrated based on current eco-nomic forecasts, feeds into ARNIE, the OeNB’s top-down stress testing model (Feldkircher et al., 2013). We investigate the effect of both the containment and the mitigating measures on banks’ balance sheets and ultimately on their capitalization as a measure of their risk-bearing capacity. With the ultimate COVID-19 outcome still fraught with uncertainty, we do not rely on a single scenario to investigate the impact. Instead, we implement escalating scenarios, based on differing assumptions about the duration of the containment measures and on whether mitigating measures are in place. This way, we arrive at four scenarios that help us identify possible tipping points in both the Austrian economy and banking system.
While many other central banks2 have conducted exercises with a similar aim, to our knowledge, the OeNB is the first central bank to link its stress testing
2 A case in point is the ECB’s vulnerability assessment, which replaced the postponed EU-wide 2020 stress testing exercise (ECB, 2020b).
Stylized overview of model interaction
Figure 1
Source: Authors’ compilation.
Note: IR stands for insolvency rate, and PD for probability of default.
AQM(Austrian Quarterly Model)
input / output model
macro scenarios
sectoraldemandshocks
Monte Carlo simulation
corporate insolvency model
firm-leveldata
sectoralinsolvency
rates
linking equations(∆ AT IRs ∆ global PDs)
ARNIE(stress testing model)
(micro)risk factorscenarios
bank-specificcapitalimpact
externalforecast(ECB)
firmreporting
data
bankreporting
data
mitigatingmeasures
Modeling the COVID-19 effects on the Austrian economy and banking system
FINANCIAL STABILITY REPORT 40 – NOVEMBER 2020 65
model to a structural model of corporate default risks triggered by COVID-19. This puts us in the unique position to assess the impact measures mainly aimed at the real economy have on the banking system.
For orientation, figure 1 provides a stylized overview of the various data sources, forecasts and OeNB models we employ in this analysis. We provide details on each of these inputs in this paper.
The remainder of the paper is structured as follows. In section 1, we elaborate on the underlying macroeconomic scenarios in light of Austria’s COVID-19 containment measures. In section 2, we discuss the mitigating measures considered in our analysis. Sections 3 and 4 cover the corporate insolvency model. Sections 5 and 6 describe the OeNB’s bank stress testing model ARNIE. We present the respective model results in sections 4 (corporate insolvency model) and 6 (stress testing model). Finally, in section 7, we draw policy-relevant conclusions from the quantitative model results we derived.
1 The macroeconomic scenariosWe use two macroeconomic scenarios (“baseline” and “adverse”) as main drivers of stress for firms and banks, drawing on the two corresponding scenarios from the OeNB’s June 2020 forecast (Fenz et al., 2020), as this is the most recently available forecast at the time of writing. What distinguishes our scenarios from the latter is the degree of sectoral disaggregation. The OeNB forecast only contains aggregated projections, whereas we now forecast output for 17 NACE 1 sectors.3 To this end, we use an input-output model to calculate the effects of the COVID-19-induced demand shock on the output of all 17 sectors given intermediate goods linkages. The output losses projected for the industries relate to the mean output effects over all firms of each sector. We assumed a normal distribution of the shock to the individual firms within each sector. This distribution enables us to model individual mitigating measures more properly. The mean of the distribution equals the shock size per sector for each period. We calibrated the variances based on the heterogeneity of the sector and the shock magnitude (for details, refer to Puhr and Schneider, 2021).
1.1 The aggregate impact on the Austrian economy
Our expectations about future economic developments depend crucially on the spread of the virus, the containment measures to be implemented by the government as well as the measures taken to mitigate the economic impact and their effectiveness. Since there is a substantial amount of uncertainty, we rely on two different scenarios (see chart 1).
In the baseline scenario, we assume that the spread of the virus will be contained, but that local infection clusters which call for specific – albeit limited – containment measures will nevertheless occur. Such measures will be recalibrated until a medical solution (drugs or vaccines) are available by mid-2021. Under this scenario, we expect real GDP to decline by 7.2% in 2020, and to increase by 4.9% in 2021 and by 2.7% in 2022.
In the adverse scenario, we assume a second wave of infections and a second lock-down in the fall of 2020. The spread of the virus will be contained more swiftly as
3 Focusing on nonfinancial corporations, we omit NACE K ( financial and insurance activities), O (public adminis-tration and defence; compulsory social security) and T (households).
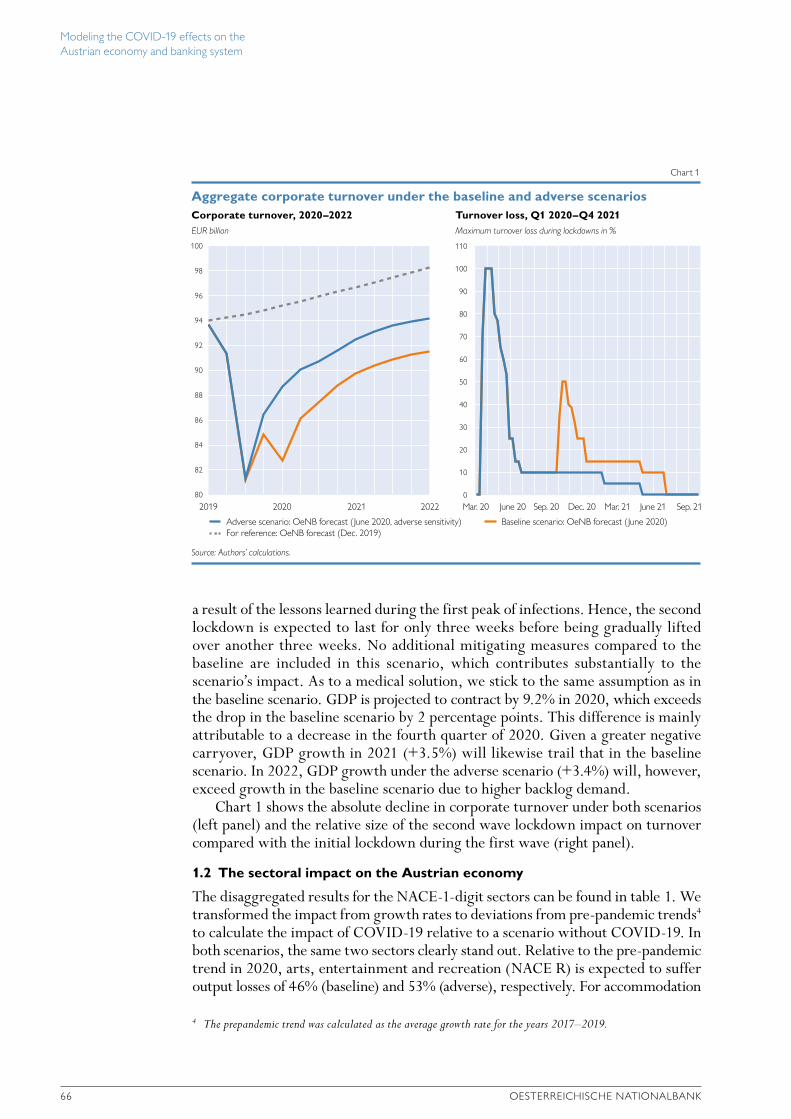
Modeling the COVID-19 effects on the Austrian economy and banking system
66 OESTERREICHISCHE NATIONALBANK
a result of the lessons learned during the first peak of infections. Hence, the second lockdown is expected to last for only three weeks before being gradually lifted over another three weeks. No additional mitigating measures compared to the baseline are included in this scenario, which contributes substantially to the scenario’s impact. As to a medical solution, we stick to the same assumption as in the baseline scenario. GDP is projected to contract by 9.2% in 2020, which exceeds the drop in the baseline scenario by 2 percentage points. This difference is mainly attributable to a decrease in the fourth quarter of 2020. Given a greater negative carryover, GDP growth in 2021 (+3.5%) will likewise trail that in the baseline scenario. In 2022, GDP growth under the adverse scenario (+3.4%) will, however, exceed growth in the baseline scenario due to higher backlog demand.
Chart 1 shows the absolute decline in corporate turnover under both scenarios (left panel) and the relative size of the second wave lockdown impact on turnover compared with the initial lockdown during the first wave (right panel).
1.2 The sectoral impact on the Austrian economy
The disaggregated results for the NACE-1-digit sectors can be found in table 1. We transformed the impact from growth rates to deviations from pre-pandemic trends4 to calculate the impact of COVID-19 relative to a scenario without COVID-19. In both scenarios, the same two sectors clearly stand out. Relative to the pre-pandemic trend in 2020, arts, entertainment and recreation (NACE R) is expected to suffer output losses of 46% (baseline) and 53% (adverse), respectively. For accommodation
4 The prepandemic trend was calculated as the average growth rate for the years 2017–2019.
EUR billion
Corporate turnover, 2020–2022
100
98
96
94
92
90
88
86
84
82
80
Maximum turnover loss during lockdowns in %
Turnover loss, Q1 2020–Q4 2021
110
100
90
80
70
60
50
40
30
20
10
0
Aggregate corporate turnover under the baseline and adverse scenarios
Chart 1
Source: Authors’ calculations.
For reference: OeNB forecast (Dec. 2019)Baseline scenario: OeNB forecast ( June 2020)Adverse scenario: OeNB forecast ( June 2020, adverse sensitivity)
2019 2020 2021 2022 Mar. 20 June 20 Sep. 20 Dec. 20 Mar. 21 June 21 Sep. 21

Modeling the COVID-19 effects on the Austrian economy and banking system
FINANCIAL STABILITY REPORT 40 – NOVEMBER 2020 67
and food service activities (NACE I), these figures are expected to amount to 43% (baseline) and 50% (adverse), respectively.
1.3 Assumptions for economies other than Austria
To calculate credit risk for the banking system assessment (see subsection 5.3), we require not only baseline and adverse macroeconomic scenarios for Austria, but also scenarios for all countries (or groups of countries) where Austrian banks provide credit to customers. To this end, we use the Eurosystem staff macroeconomic projections (ECB, 2020a), which are consistent with both the OeNB’s forecast for Austria and the scenarios of the ECB’s vulnerability analysis (ECB, 2020b).
2 Mitigating measuresMitigating measures serve to cushion the loss of revenue and income suffered by companies and households in the wake of COVID-19 containment measures. They are meant to minimize the damage resulting from the temporary reduction in economic activity. In our analysis, we only investigate measures targeting companies and banks. Such mitigating measures include fiscal measures adopted by the Austrian government and other legislative measures as well as nonlegislative initiatives, such as private bank moratoria. In addition, we account for mitigating measures implemented for banks by euro area supervisors and EU regulators. We use August 31, 2020, as the cutoff date for all mitigating measures. In this section, we cluster the measures by their mechanics and briefly describe each measure.5
5 For a more detailed description of individual measures and how they feed into the corporate insolvency model, see Puhr and Schneider (2021).
Table 1
Sectoral output losses in the baseline and adverse scenarios
Baseline scenario Adverse scenario
2020 2021 2022 2020 2021 2022
Deviation from pre-crisis trend in %
Total –9.7 –7.2 –5.6 –11.7 –10.2 –7.3 Agriculture, forestry and fishing (A) –3.3 –4.5 –2.9 –4.0 –6.3 –3.8 Mining and quarrying (B) –7.0 –7.3 –6.6 –8.8 –10.1 –8.6 Manufacturing (C) –12.0 –10.5 –8.9 –14.6 –14.6 –11.6 Electricity, gas, steam and air conditioning supply (D) –9.2 –8.3 –7.0 –11.4 –11.7 –9.1 Water supply and sewerage (E) –6.7 –6.2 –5.3 –8.3 –8.7 –6.9 Construction (F) –7.4 –8.3 –7.2 –9.6 –11.5 –9.3 Trade (G) –11.7 –8.2 –6.3 –14.0 –11.6 –8.2 Transportation and storage (H) –8.8 –6.2 –5.3 –10.5 –8.7 –6.9 Accommodation and food services (I) –43.1 –14.9 –7.1 –49.9 –21.5 –9.2 Information and communication (J) –7.5 –4.8 –3.7 –9.0 –6.8 –4.8 Real estate (L) –4.9 –6.3 –5.4 –6.4 –8.8 –7.0 Professional, scientific and technical services (M) –9.2 –7.1 –6.0 –11.2 –10.0 –7.8 Administrative and support services (N) –7.5 –5.5 –4.1 –9.2 –7.7 –5.4 Education (P) –0.2 –2.6 –2.4 –0.7 –3.7 –3.1 Human health and social work activities (Q) –1.6 –3.6 –3.0 –2.4 –5.1 –3.9 Arts, entertainment and recreation (R) –45.6 –16.8 –8.3 –53.0 –24.2 –10.9 Other service activities (S) –10.6 –10.2 –7.0 –13.7 –14.3 –9.1
Source: Authors’ calculations.

Modeling the COVID-19 effects on the Austrian economy and banking system
68 OESTERREICHISCHE NATIONALBANK
2.1 Capital injections via grants and subsidiesFinancing of fixed costs for particularly hard-hit industries6
With the initial funding guidelines for grants for fixed costs (Fixkostenzuschuss- Richtlinie – FKZ) and their extension (FKZ II), the Austrian government introduced a grant to cover operating costs. Such grants are awarded to companies having suffered a loss in sales of at least 40% (FKZ) or 30% (FKZ II). The overall volume of this measure amounts to EUR 12 billion. In our insolvency model, all eligible firms apply for this grant, which yields a total payout of EUR 11 billion.
COVID-19 short-time work7
The COVID-19 short-time work allowance is a modification of an instrument that was already used during the financial crisis. It was initially designed for a duration of three months and an option to extend it by another three months. In July, the Austrian government extended the short-time work scheme by six months until the end of March 2021. Under this scheme, employees receive income support amounting to between 80% and 90% of their previous net wage or salary. The amount depends on their original net wage or salary and is capped at the maximum contribution basis for social security. In our insolvency model, the number of firms applying for short-time work is calibrated in line with publicly available reporting data, which again yields a total payout of EUR 11 billion.
Sector-specific measures8
The support package for hospitality venues such as restaurants (“Wirtshauspaket”), which amounts to EUR 500 million, combines tax relief with measures aimed at stimulating demand. The emergency aid for the tourism sector includes bridge financing of up to EUR 100 million for domestic tourism. The overall volume of support measures comes to EUR 600 million. In our insolvency model, support is distributed equally across all firms of the sector (NACE I).
2.2 Long-term payment deferralCredit guarantees9
The Austrian government introduced several measures to provide support by guaranteeing new loans. Note that the new framework was put on top of existing structures and their guarantee products. The overall volume of earmarked guarantees
6 Fixed cost support is based on Article 3b para 3 of the Act establishing a government-owned holding company for wind-down purposes (Bundesgesetz über die Einrichtung einer Abbaubeteiligungsaktiengesellschaft des Bundes – ABBAG; Federal Law Gazette I No. 12/2020), and two guidelines, namely guidelines for grants for fixed costs (phase 1) (Fixkostenzuschuss-Richtlinie, Federal Law Gazette II No. 225/2020) and guidelines for grants for fixed costs (phase 2) (pending approval by the European Commission).
7 Short-time work is based on Article 37b Public Employment Service Act (Arbeitsmarktservicegesetzt – AMSG; Federal Law Gazette I No. 71/2020).
8 The measures supporting restaurants are mainly based on a temporary tax relief granted pursuant to Article 28 para 52 VAT Act 1994 (Federal Law Gazette I No. 60/2020).
9 Credit guarantees are based on three different laws and extended by COFAG, the Austrian COVID-19 financing agency, pursuant to Article 6a para 2 of the Act establishing a government-owned holding company for wind-down purposes (Bundesgesetz über die Einrichtung einer Abbaubeteiligungsaktiengesellschaft des Bundes – ABBAG; Federal Law Gazette I No. 12/2020); austria wirtschaftsservice (aws), a state-owned bank providing funding for Austrian companies, pursuant to Article 1 para 2a Guarantee Act 1977 (Federal Law Gazette I No. 23/2020); the Austrian Hotel and Tourism Bank ÖHT and aws, pursuant to Article 7 para 2a SME Promotion Act (Federal Law Gazette I No. 16/2020).

Modeling the COVID-19 effects on the Austrian economy and banking system
FINANCIAL STABILITY REPORT 40 – NOVEMBER 2020 69
amounts to EUR 15 billion. By end-August 2020, Austrian companies had drawn roughly EUR 6 billion of this amount according to data reported to the OeNB (EBA, 2020b).
Debt moratoria10
While the Austrian government also introduced a public, i.e. legislative, moratorium on bank debt, eligibility restrictions mostly exclude incorporated firms. However, a private, i.e. nonlegislative, sector-wide debt moratorium (EBA, 2020a) peaked at EUR 14 billion (of affected credit volume) in June 2020, according to data reported to the OeNB (EBA, 2020b).
2.3 Short-term payment deferral
The Austrian government agreed on a tax relief package that contains various measures, including a reduction of 2020 corporate tax advance payments to zero, and a deferral of social security contributions. Since we focus on firms that suffer losses and hence face bankruptcy risk, we do not consider the former measure in our model. The deferral of social security contributions, by contrast, has a significant short-term impact, as all eligible firms apply for the maximum deferral period, i.e. until the third quarter of 2021. In conjuncture with subsection 2.4, this measure enters the model as “filing moratorium.”11
2.4 Changes to the insolvency regime
The Austrian government also introduced a temporary change to the Austrian insolvency law. From April to October 2020, overindebtedness was suspended as a basis to open insolvency procedures.12 In addition, tax authorities and public health providers agreed to suspend bankruptcy filings from March to May 2020.
2.5 Changes to banks’ accounting and supervisory rules
The EU put in place amendments to the Capital Requirements Regulation (CRR) and the revised Capital Requirements Regulation (CRR2) or CRR “quick fix.”13 Its intention to mitigate the impact of the COVID-19 pandemic is rooted in the argument that this helps provide incentives for banks to continue lending to both businesses and consumers. The amendments became effective ahead of banks’ mid-2020 reporting date (end-June).
3 The corporate insolvency modelFigure 2 shows a stylized version of the corporate insolvency model. For each firm, the model considers that firm’s profit and loss statement, its cash flow statement, and its balance sheet. We evaluate on a monthly basis whether firms meet a specific threshold for both solvency and liquidity. A firm becomes insolvent if it falls below either one of these thresholds. This section explains the model in more detail.14
10 The legislative debt moratorium is based on Article 2 2nd COVID-19 Act (Federal Law Gazette I No. 58/2020), the nonlegislative sector-wide debt moratorium is based on EBA (2020a).
11 Refer to Puhr and Schneider (2021) for the detailed mechanics of the implementation.12 The insolvency moratorium is based on Article 9 2nd COVID-19 Act (Federal Law Gazette I No. 58/2020).13 The CRR “quick fix” is based on EU Regulation 2020/873 (OJ L 204/4).14 For an in-depth description of the model, see Puhr and Schneider (2021).

Modeling the COVID-19 effects on the Austrian economy and banking system
70 OESTERREICHISCHE NATIONALBANK
3.1 StructureProfit and loss statementA turnover shock in period t derived from a macroeconomic scenario stresses firms’ income, which can only be partly offset by the firms’ reducing their expenses. Income and expense positions at time t are calculated as changes versus the starting value t0. This yields a new pre-tax profit, which is booked against equity (from t–1).
Cash flow statement
We derive the operating cash flow of each firm based on the indirect method, which uses pre-tax profit as a starting point, and adjust it for all noncash transactions. We exclude any structural changes of the balance sheet. These simple accounting identities yield the net cash flow from operating activities. For the cash flow impact of financing activities, we solely focus on refinancing bank debt. Any given firm with an equity ratio above zero will be able to refinance its current bank debt, i.e. maturing bank debt and installments. Firms with an equity ratio of zero or less, however, will not be able to do so. Finally, we assume that the debt profile of firms is stable over time, i.e. current bank debt as reported for the first year is the same in the second and third year. For the cash flow impact of investment activities, we take an even more restrictive approach. In line with the static balance sheet assumption, we assume that firms do not invest. There is one important exception: firms with a negative cash flow can divest. Additional cash flows from divestment leave us with the cash flow after investments, which is used to update the cash and bank position in each firm’s balance sheet.
Balance sheet
Broadly speaking, we model three categories of assets and liabilities: first, the buffers against insolvency, i.e. an aggregate liquidity position (cash and bank) on the asset side and an equity position on the liability side (equity). Second, we include current assets and liabilities, broken down into three subcategories to model firms’ cash
Stylized overview of the insolvency model without mitigating measures
Figure 2
Source: Authors’ compilation.
Note: CF stands for cash flow, and o.w. for of which.
Income(t0)
Cash & bank(t–1)+CF(t)
Profit and loss statement (t)
Current assets(t–1) – X Current liabilities(t–1)+α Y
Other assets(t0)
Balance sheet (t)
Shock toturnover
Check forinsolvency
.
indirect method:profit / loss after tax– capitalized production + depreciation + tax
– ∆ Income(t)
Expenses(t0)
– ∆ Expenses(t)
Other liabilities(t0)+(1–α) Y
if cash & bank(t) < –10%
ORif equity(t) < –30%
o.w. bank debt(t–1)+α Yo.w. financial assets(t–1)– X
Equity(t–1) + profit(t)
cash flowinvestment
(t)
firesales(X)
debtfinance
(Y)
cash flowoperations
(t)
CF viaindirectmethod
after-taxprofit/ loss
(t)
profittax(t)
pre-taxprofit/ loss
(t)
cash flowfinancing
(t)

Modeling the COVID-19 effects on the Austrian economy and banking system
FINANCIAL STABILITY REPORT 40 – NOVEMBER 2020 71
flows. However, at this juncture, only current other financial assets (available for divestment) and current bank debt (that needs to be refinanced) are considered in our model. Third, we combine all other assets and liabilities, respectively, as they do not yet play a role in our model.
Insolvency thresholds
Both in general and according to Austrian insolvency law, corporate insolvencies can be triggered either by overindebtedness or illiquidity. To reflect these two dimensions in our model, we consider the equity and the aggregate cash and bank positions relative to total assets as best measure. We introduce two separate thresholds to flag insolvency, namely –30% for the equity ratio and –10% for the liquidity ratio. A firm becomes insolvent if it falls below one of these thresholds. While the threshold for overindebtedness is well justified by empirical evidence15, the foun-dation for the illiquidity threshold is weaker. We use a negative liquidity threshold (instead of zero) since the firms can rely on undrawn credit lines from banks.
3.2 Data
The model builds on a firm-level dataset for nonfinancial Austrian corporations with 18 firm-specific variables for 17 NACE-1 sectors. We use data from the BACH16 and SABINA17 databases to construct this dataset. Since only two variables at the firm level (the equity ratio and the cash and bank positions) are available to a sufficient extent in the SABINA database, we generate a hypothetical firm-level dataset. To this effect, we proceed in two steps. First, we simulate a firm-level dataset for six core variables (equity ratio, cash and bank, current assets, current liabilities, total income, total expenses) by means of a Monte Carlo simulation.18 Second, we calculate all other variables as shares of the simulated variables on a sectoral basis.19
3.3 Simulation
For our Monte Carlo simulation, we need the distribution of each variable in each sector and a covariance matrix per sector that describes the joint distribution of all variables. We use a copula approach20, since it provides a flexible way to separately model the dependence structure between the variables and the marginal distributions.
15 We set the overindebtedness threshold at –30% for two reasons: (1) based on this threshold, we replicated recent insolvency rates per sector at the starting point, and (2) cross-country empirical studies show that the equity ratio commonly associated with insolvency ranges from –30% to –35% (see Davydenko, 2007).
16 BACH is a database of aggregated accounting data of nonfinancial corporations based in 13 European countries. It contains over 100 variables for 17 NACE sectors (www.bach.banque-france.fr/?lang=en). Besides the weighted mean, data for the quartiles of the distribution for each variable are available (ECCBSO, 2020).
17 The SABINA database contains firm-level accounting data compiled by Bureau van Dijk for more than 130,000 Austrian firms.
18 Monte Carlo simulation is a mathematical technique that generates random variables for modeling risk or uncertainty of a certain system. The random variables or inputs are modeled based on probability distributions such as normal or gamma distributions.
19 The following 18 variables are included in the model: cash and bank ratio, equity ratio, current assets, current liabilities, current financial assets, current bank debt, turnover, financial income, total income, cost of goods sold, materials and consumables, external supplies and services, staff costs, operating taxes and other operating charges, financial expenses, depreciation, interest expenses, total expenses.
20 A copula is a multivariate cumulative density distribution for which the marginal distribution for each variable is uniform (see McNeil et al., 2015).

Modeling the COVID-19 effects on the Austrian economy and banking system
72 OESTERREICHISCHE NATIONALBANK
For the marginal distributions of the equity ratio and cash and bank, we draw on firm-level data that are available in the SABINA database for more than 110,000 firms. The marginal distributions of the other four core variables (current assets, current liabilities, total income, total expenses) are taken from the BACH database, which contains aggregated data for the weighted mean and for the quartiles. We use the weighted mean and the first quartile to estimate the distribution for these variables. We assume a normal distribution for total income and total expenses and a gamma distribution for current assets and current liabilities. Unfortunately, we have no micro data to estimate the correlation matrix that describes the dependencies between the variables of each sector. We therefore use correlations over time between the means of pairs of variables as a proxy.
For each sector, we generate 100,000 draws from the multivariate normal distribution. Four points are worth mentioning. First, our simulation approach effectively reproduces the empirical marginal distributions. Second, the distribu-tion for the equity ratio is far from normal, which highlights the importance of the availability of firm-level data for this variable21. Third, a considerable share of firms has negative equity in 2018 (17% across all sectors).22 Fourth, we removed firms with equity of less than –30% from our dataset since such firms are insolvent according to our definition.
3.4 Mitigating measures
Figure 3, which adds mitigating measures to figure 2, shows how the above-mentioned measures are implemented in the model. Note that the current calibration is based on the actual use of individual measures where available and assumes maximum
21 It would be possible to construct the firm-level dataset with variables from the BACH database only. However, for most sectors, the distribution of the equity ratio deviates considerably from a normal distribution.
22 The negative equity ratio is at least partially driven by hidden reserves due to the lower of cost or market principle of the Austrian accounting regime (nGAAP).
Stylized overview of the insolvency model with mitigating measures
Figure 3
Source: Authors’ compilation.
Note: CF stands for cash flow, and o.w. for of which.
Income(t0)
Cash & bank(t–1)+CF(t)
Profit and loss statement (t)
Current assets(t–1) – X Current liabilities(t–1)+α Y
Other assets(t0)
Balance sheet (t)
Shock toturnover
Check forinsolvency
.
– ∆ Income(t)
Expenses(t0)
– ∆ Expenses(t)
Other liabilities(t0)+(1–α) Y
if cash & bank(t) < –10%
ORif equity(t) < –30%
o.w. bank debt(t–1)+α Yo.w. financial assets(t–1)– X
Equity(t–1) + profit(t)
cash flowinvestment
(t)
firesales(X)
debtfinance
(Y)
cash flowoperations
(t)
CF viaindirectmethod
profittax(t)
pre-taxprofit/ loss
(t)
cash flowfinancing
(t)
[email protected]@oenb.at
after-taxprofit/ loss
(t)
Relaxed insolvency definitiontemporarily suspends equity trigger
Filing moratoriumtemporarily suspends liquidity trigger
Short-time workreduces staff costs
Debt moratorium (1/2)reduces interest expenses
Sector-specific measuresall lead to increased equity
Credit guaranteesincrease CF via new loans
Debt moratorium (2/2)reduces debt repayments
Fixed cost grantsincrease equity and CF
Deferment of social security contributions
improves cash flow
Deferment of taxesreduces profit tax

Modeling the COVID-19 effects on the Austrian economy and banking system
FINANCIAL STABILITY REPORT 40 – NOVEMBER 2020 73
efficiency by all stakeholders: firms know when they are eligible for a measure and apply right away and the institutions charged with executing the measures pay out immediately.
4 Results of the corporate insolvency modelIn this section, we present the insolvency rates as projected by our insolvency model based on our two macroeconomic scenarios – for each scenario with and without mitigating measures.
4.1 The aggregate impact on the Austrian corporate sector
In the baseline scenario without mitigating measures, the insolvency rate would rise to 5.8% at the end of 2020, more than quintupling its recently observed level (from 2014 to 2019, the insolvency rate averaged 1.1% according to KSV1870 data and 1.0% for the last three years). In 2021 and 2022, annual insolvency rates would decline to 2.4% and 1.7%, respectively. When we consider mitigating measures, the 2020 insolvency rate is significantly lower at 2.1%. However, this decrease is to a large extent due to measures that relate to a short-term payment deferral, namely a deferral of social security contributions and insolvency filing moratorium. Consequently, 2021 insolvency rates will increase to 3.1%. In 2022, mitigating measures have no effect on insolvencies. Over all three years, mitigating measures help lower annual insolvency rates by 1.3 percentage points in the baseline scenario. In the adverse scenario, a second wave of infections in the fourth quarter of 2020 would have
Table 2
Cumulated annual insolvency rates in the baseline and adverse scenarios
KSV Baseline scenario Adverse scenario
Aver-age
Without mitigating measures
With mitigating measures
Without mitigating measures
With mitigating measures
2017–2019
2020 2021 2022 2020 2021 2022 2020 2021 2022 2020 2021 2022
Insolvency rates in %
Total 1.0 5.8 8.2 9.9 2.1 5.2 6.9 7.6 12.2 14.4 2.9 7.3 9.7 Agriculture, forestry and fishing (A) 0.2 0.9 2.5 3.7 0.0 1.9 3.0 1.1 4.2 6.1 0.0 3.1 5.0 Mining and quarrying (B) 0.5 0.5 1.1 1.7 0.5 1.1 1.7 0.6 1.6 2.5 0.6 1.5 2.3 Manufacturing (C) 0.7 4.0 7.2 9.0 1.6 5.4 7.2 6.2 13.4 16.0 2.2 7.7 10.8 Electricity, gas, steam and air conditioning supply (D) 0.3 0.7 1.3 2.1 0.7 1.3 2.0 0.7 1.4 2.2 0.7 1.3 2.1 Water supply and sewerage (E) 0.7 1.5 3.7 6.6 1.4 3.5 6.3 1.7 5.0 9.2 1.6 4.6 8.5 Construction (F) 2.0 2.4 7.3 12.9 2.3 6.5 11.8 2.5 11.2 18.6 2.4 7.8 15.3 Trade (G) 1.0 6.8 9.6 11.0 2.1 7.5 9.2 10.2 16.5 18.3 3.0 10.8 13.3 Transportation and storage (H) 2.6 2.7 5.4 8.1 2.6 5.2 7.9 2.9 6.3 9.7 2.8 5.7 8.8 Accommodation and food services (I) 2.0 35.5 38.3 39.5 12.3 17.4 19.6 44.4 50.9 51.8 17.0 27.0 29.2 Information and communication (J) 0.6 1.4 2.4 3.2 1.3 2.3 3.1 1.6 3.1 4.0 1.4 2.6 3.6 Real estate (L) 0.3 0.7 1.5 2.3 0.0 1.5 2.3 0.8 1.9 2.9 0.0 1.8 2.7 Professional, scientific and technical services (M) 0.5 0.6 1.3 2.1 0.4 1.0 1.7 0.6 1.4 2.4 0.4 1.0 1.8 Administrative and support services (N) 1.6 2.8 5.2 7.2 1.6 4.8 6.9 3.1 6.1 8.5 1.8 5.3 7.7 Education (P) 0.4 0.4 1.0 1.6 0.3 0.8 1.2 0.5 1.1 1.7 0.3 0.6 1.0 Human health and social work activities (Q) 0.4 0.5 1.9 3.1 0.0 0.0 0.3 0.6 2.5 3.9 0.0 0.1 1.0 Arts, entertainment and recreation (R) 0.6 36.7 42.1 42.5 12.4 16.7 18.0 50.9 60.5 60.7 18.5 30.0 31.3 Other service activities (S) 0.7 2.5 5.8 7.6 1.2 4.7 6.5 3.8 10.8 13.6 1.7 6.4 9.3
Source: KSV1870, authors’ calculations.

Modeling the COVID-19 effects on the Austrian economy and banking system
74 OESTERREICHISCHE NATIONALBANK
insolvencies peak in our model in October 2020, driving up the 2020 insolvency rate by 1.8 percentage points (without mitigating measures) and 0.8 percentage points (with mitigating measures) relative to the baseline scenario. In 2021, the increase is even more pronounced (4.0 percentage points and 2.1 percentage points, respectively).
4.2 The impact on the Austrian corporate sector by sectors
Table 2 shows the results of the COVID-19 shock on both the 17 NACE sectors included in our analysis and the total economy – with and without mitigating measures.
%
Baseline scenario (monthly rates)
1.50
1.25
1.00
0.75
0.50
0.25
0.00
–0.25
–0.50
–0.75
–1.00
%
Baseline scenario (cumulated)
15.0
12.5
10.0
7.5
5.0
2.5
0.0
–2.5
–5.0
–7.5
–10.0
Monthly insolvency rates in the baseline and adverse scenarios
Chart 2
Source: Authors’ calculations.
With mitigating measures Without mitigating measures Impact of all mitigating measures
%
Adverse scenario (monthly rates)
1.50
1.25
1.00
0.75
0.50
0.25
0.00
–0.25
–0.50
–0.75
–1.00
%
Adverse scenario (cumulated)
15.0
12.5
10.0
7.5
5.0
2.5
0.0
–2.5
–5.0
–7.5
–10.0
With mitigating measures Without mitigating measures Impact of all mitigating measures
Jan. 20 July 20 Jan. 21 July 21 Jan. 22 July 22 Jan. 20 July 20 Jan. 21 July 21 Jan. 22 July 22
Jan. 20 July 20 Jan. 21 July 21 Jan. 22 July 22 Jan. 20 July 20 Jan. 21 July 21 Jan. 22 July 22

Modeling the COVID-19 effects on the Austrian economy and banking system
FINANCIAL STABILITY REPORT 40 – NOVEMBER 2020 75
4.3 The main drivers of corporate insolvency rates
Looking at monthly insolvency rates (chart 2), we see that many insolvencies warded off in 2020 by means of mitigating measures are postponed to the beginning of 2021.
In either scenario, more than 90% of the insolvency rates across sectors are driven by liquidity constraints.23 However, the two equity and cash and bank positions are linked in our model, as a company’s ability of refinancing critically depends on its equity position. Measures can only partially mitigate the COVID-19-induced shock, with credit guarantees, fixed cost support and short-time work appearing to be the most effective government measures across sectors.
5 Bank stress testing modelFigure 4 shows a stylized version of the stress testing model ARNIE24 (Feldkircher et al., 2013), a MATLAB-based stress testing model which the OeNB implemented and which built on earlier tools such as the Systemic Risk Monitor (Boss et al., 2006). The model consists of a network model with detailed balance sheet and profit and loss statements of individual banks as nodes and interbank stakes and exposures as links. We calculate banks’ operating results and risk provisions on a quarterly basis. ARNIE does not have an insolvency threshold as is implemented in the corporate insolvency model. We do, however, assess the impact of stress scenarios
23 Tracking each simulated firm’s equity and cash and bank positions facilitates disentangling insolvency due to capital or liquidity constraints.
24 ARNIE stands for Applied Risk, Network and Impact assessment Engine, the OeNB’s software tool for micro- and macroprudential bank stress testing and other quantitative banking system analyses.
Stylized overview of the ARNIE stress testing model
Figure 4
Source: Authors’ compilation.
macroscenarios
interbank network
Individual results
sectoralinsolvency
rates
mitigatingmeasures
otherrisk factors
Bank Y
Bank Z
Bank Xcapital impact
net interest income model
credit risk model
participation income model
other income / expense models and assumptions

Modeling the COVID-19 effects on the Austrian economy and banking system
76 OESTERREICHISCHE NATIONALBANK
on both individual banks and the banking system as a whole based on their ensuing capitalization. We may therefore use this model to address macro- and micropru-dential questions regarding the Austrian banking system’s solvency.
5.1 Structure
On the one hand, the structure of ARNIE reflects the stress test methodology developed for the EU-wide stress test by the European Banking Authority (EBA, 2018). On the other hand, it considers the specificities of the Austrian banking sector, such as the inverse consolidation of the cooperative banking sector allowed under the adverse scenario, albeit to a lesser extent than under the baseline scenario. In addition, we quantify credit risk losses arising from foreign currency loans and repayment vehicles attached to bullet loans.
The shock to the risk exposure amount focuses on credit risk-weighted assets. Internal ratings-based (IRB) portfolios are subject to the stressed credit risk parameters following the Basel formulas (BCBS, 2005), while portfolios under the standardized approach are subject to the floor from the EBA methodology, which corresponds to their initial value. Regarding securitization positions, the calculations in ARNIE stress risk weights in line with the EBA methodology. All other positions of the total risk exposure amount remain constant in the OeNB stress test.
ARNIE’s net interest income projections draw on data of banks’ individual balance sheet structures. Interest-bearing assets and liabilities are broken down into different categories. Again, in line with the EBA methodology, albeit at different granularity, an average effective interest rate is calculated for each category to capture the main drivers of interest income and expenses. Maturing instruments are replaced by instruments with identical characteristics but at current rates. An important driver of interest expenses included is the development of banks’ credit spreads along with the pass-through of credit spread increases to the margins of assets and liabilities. This is calibrated more harshly under the adverse than under the baseline scenario.
ARNIE’s participation risk module was designed to reflect gains and losses from participations, mainly in other banks, but also nonbank firms. Profits and losses made by a bank in the sample are proportionally passed on to the respective share-holders if they are also modeled in ARNIE, namely in line with their participation share. In case of a loss, this approach assumes that participations are revalued, with losses capped at book values.
Other income and expense positions are also broadly based on the EBA 2018 method-ology. Net trading income (NTI) and net fee and commission income (NFCI) are shocked by using half of EBA’s adverse haircut approach under both scenarios, i.e. via instant shocks of 12.5% and 10%, respectively. In addition, both NTI and NFCI are adjusted proportionally for the change in the performing exposure to reflect the reduced income generation capacity. Expenses, such as staff or other adminis-trative expenses, are assumed to remain flat over the stress horizon even under the adverse scenario.
Finally, taxes and dividends are treated by following EBA constraints (30% each, in case banks are profitable). Minority interests are considered in accordance with the actual ownership structure.

Modeling the COVID-19 effects on the Austrian economy and banking system
FINANCIAL STABILITY REPORT 40 – NOVEMBER 2020 77
5.2 Data
ARNIE includes all Austrian CRR credit institutions on a consolidated and an unconsolidated level. As from end-2019, 395 banks are included at the consolidated level, which are also reflected in our paper: 6 Austrian significant institutions (SIs), 1 material foreign SI subsidiary and 388 less significant institutions (LSIs). For their analysis, ARNIE draws on multiple proprietary, nonpublic data sources available at the OeNB. Capital-related, balance sheet as well as profit and loss positions are based on EBA’s EU-wide supervisory reporting standards (for IFRS-reporting banks)25 or national reports (for nGAAP banks).26 Additional data for NII modeling are based on the OeNB’s micro data reporting regime. Credit risk exposures are based on the ECB’s AnaCredit27 and national (for sub-AnaCredit exposures) and international banking supervision statistics (for foreign subsidiaries), with addi-tional data derived from nonstandard reporting for financial stability purposes. Data related to consolidation and participation risk are based on dedicated OeNB master data reports, with nonbank participations also informed by data from supervisory questionnaires.
5.3 Calibration
The calibration of ARNIE broadly follows the standards set used in the annual OeNB top-down stress testing exercises, which in turn are based on the current methodology of the EU-wide stress testing exercises (see EBA, 2018, for the most recent method). However, there is one major exception: contrary to generating credit risk factors from large-scale regression models, we link ARNIE’s credit risk modules to the output of the corporate insolvency model (see section 4). To this end, we take the relative shift of the insolvency rate per sector and form a simple average across two quarters (to account for a minor delay in default recognition). This relative shift marks the increase in reported (and estimated) default probabilities of banks’ portfolios. We apply similar shifts as those based on incorporated firms also to the retail exposure of banks, yet with greater delay (to account for automatic stabilizers and mitigating measures aimed at unincorporated firms and households).
In light of larger Austrian banks’ significant cross-border exposure, we need to integrate further assumptions, however. For lack of similar micro data for non-Austrian economies (and also due to resource constraints), we cannot simulate insolvency rates for foreign firms. Consequently, we lack relative increases of the default probabilities for foreign customers of Austrian banks that are affected either directly due to cross-border loans or indirectly due to local exposure to customers of foreign subsidiaries. To close this gap, we extrapolate the PD shifts for Austrian corporations based on two scaling factors: first, we consider the strength of each country’s mitigating measures by its share of local GDP.28 Second, we scale the PD shifts based on the GDP forecasts discussed in subsection 1.3. The following chart explains the specificities of the approach.
Chart 3 provides an example of our approach based on the baseline scenario and the aggregate Italian corporate sector. The starting point for the extrapolation
25 For details on EU-wide supervisory reporting, see EBA (2020c).26 For details on national supervisory reporting, see OeNB (2020a).27 For details on euro area credit data reporting, see ECB (2020c).28 For this analysis, we use the IMF’s “Policy Response Tracker,” which is available for 182 countries.

Modeling the COVID-19 effects on the Austrian economy and banking system
78 OESTERREICHISCHE NATIONALBANK
of each country and sector are the Austrian PD shifts with and without mitigating measures, as provided in panel (a). At 13% of GDP, Austria’s mitigating measures are at the more generous end. Yet, some countries spent even more in relative terms.
Hence, in panel (b), we set the lower bound of the possible PD shifts based on the country with the highest relative expenses, which in our case is Japan with 21.1% of GDP. Thus, the area between the blue and the dashed gray line represent the possible space a country can be placed in based on the respective fiscal spending. We can now calculate the percentile distribution of the PD shifts (“PD space”) between the upper and the lower bound (i.e. Austria without and Japan with measures) for all sectors and all quarters.
To link each country to a point between the bounds, we calculate the percentile distribution of fiscal spending as a share of GDP (“Fiscal space”) between the least (Oman) and the most generous country (Japan). The boundaries in both distributions make sure that the scaling yields no implausible outliers. Italy spends 5.86% of GDP on mitigating measures and would thus be fitted to the 59th percentile in the “Fiscal space” distribution. The same percentile is now used to determine Italy’s location in the “PD space” – plotted as the dashed dark red line in panel (c).
The distance between the dashed dark red (Italy) and blue line (Austria) yields the first scaling factor. Now we can employ the second scaling factor and alter the PD shifts solely based on the relative economic impact between the respective
%
(a) Corporate PD shifts for Austria
500
400
300
200
100
0
%
(b) Adding the lower bound PD curve
500
400
300
200
100
0
Extrapolation of Austrian credit risk parameter shifts to the rest of the world
Chart 3
Source: Authors’ calculations.
%
(c) Scaling Italy based on fiscal measures
500
400
300
200
100
0
%
(d) Scaling Italy based on GDP
500
400
300
200
100
0
AT – without measuresIT – with measures and GDP
AT – with measures Lower bound IT – with measures
Q1 Q2 Q3 Q4 Q1 Q2 Q3 Q4 Q1 Q2 Q3 Q42020 2021 2022
Q1 Q2 Q3 Q4 Q1 Q2 Q3 Q4 Q1 Q2 Q3 Q42020 2021 2022
Q1 Q2 Q3 Q4 Q1 Q2 Q3 Q4 Q1 Q2 Q3 Q42020 2021 2022
Q1 Q2 Q3 Q4 Q1 Q2 Q3 Q4 Q1 Q2 Q3 Q42020 2021 2022

Modeling the COVID-19 effects on the Austrian economy and banking system
FINANCIAL STABILITY REPORT 40 – NOVEMBER 2020 79
countries and Austria. In our example, in the baseline scenario, Italy is hit slightly harder in 2020, but less so in 2021 and 2022. Thus, panel (d) shows a scaled-up dark red line for the first four quarters and a scaled-down line for the remaining periods.29
In order not to misjudge credit risk (or any other income or expense position for this matter), the OeNB stress testing exercise relies on an extensive process of vetting model-implied starting values as well as model-derived stress testing results with line supervisors of both large and small banks.
5.4 Mitigating measures
Of the EU-wide mitigating measures dedicated to the banking system (see subsec-tion 2.5), we quantified the impact of the CRR “quick fix” for the six Austrian SIs and the material foreign SI subsidiary; for the LSIs, no data were available. We also had to ignore other measures having an impact on banks: (a) the extension of credit following public guarantees due to the static balance sheet assumption of the EBA methodology and (b) the loss of income due to the bank moratorium as there is no bank-level link between the corporate insolvency model and ARNIE. However, the conservative assumptions of ARNIE’s NII module should more than cover the income loss of (b).
6 Results of the bank stress testing modelIn this section, we present the results of the OeNB’s 2020 top-down solvency stress test for the baseline and adverse scenarios. Chart 4 shows the results for the aggregate consolidated Austrian banking system, each scenario with and without mitigating measures.
29 In the baseline scenario, Austria starts with GDP growth of 1.55% in 2019 and follows a path of –7.18%, 4.91% and 2.74% in the subsequent three years. We measure economic impact as the level deviation (i.e. difference) between the scenario path and the starting value. This allows to jointly consider the level of economic growth both before and after the crisis. For Austria, the differences are as follows: –8.74 percentage points, 3.35 percentage points and 1.18 percentage points. The starting value in the baseline scenario for Italy is 0.17% in 2019, followed by –9.25%, 4.75% and 2.53%. Thus, the level deviation is –9.42 percentage points, 4.58 percentage points and 2.35 percentage points. As a final step, we calculate the relative share between the economic impact of each year and get 108%, 73% and 50%. Even though the path for Italy looks worse compared with Austria, the lower starting point leads to a better performance overall.
CET1 ratio in %
Baseline scenario
16
14
12
10
8
CET1 ratio in %
Adverse scenario
16
14
12
10
8
CET1 ratio of the Austrian banking system in the OeNB’s 2020 stress test
Chart 4
Source: Authors’ calculations.
Baseline scenario Adverse scenario Without measuresWithout measures
15.614.4
13.3
15.6
11.2
9.2Q4 16 Q4 17 Q4 18 Q4 19 Q4 20 Q4 21 Q4 22 Q4 16 Q4 17 Q4 18 Q4 19 Q4 20 Q4 21 Q4 22

Modeling the COVID-19 effects on the Austrian economy and banking system
80 OESTERREICHISCHE NATIONALBANK
6.1 The aggregate impact on the Austrian banking systemIn the baseline scenario with mitigating measures (left panel of chart 4, solid blue line), the aggregate CET1 ratio for the Austrian banking sector declines from 15.6% to 14.4% between end-2019 and end-2022, or by 120 basis points.30 Compared with our initial assessment in a similar exercise in the OeNB’s Financial Stability Report 39, the impact declined from 200 basis points by 40% (OeNB, 2020b). Despite other changes, we mainly attribute the improvement to the fact that the set of mitigating measures for the real economy has been substantially expanded and/or prolonged since our initial assessment. After all, a counterfactual analysis of the COVID-19 impact on the Austrian banking system without mitigating measures – ceteris paribus – would have almost doubled the decline of the aggregate CET1 ratio to 236 basis points (left panel, dashed blue line).
In the adverse scenario with mitigating measures (right panel of chart 4, solid orange line), the aggregate CET1 ratio for the Austrian banking sector declines from 15.6% to 11.2% from end-2019 to end-2022, or by 444 basis points. No such scenario was calculated earlier this year, but to provide some context, the figure almost exactly matches last year’s adverse scenario of the OeNB’s 2019 top-down solvency stress test conducted jointly with the IMF as part of the Financial Sector Assessment Program (OeNB, 2019). The counterfactual analysis for the adverse scenario without mitigating measures shows that the decline of the aggregate CET1 ratio would – ceteris paribus – increase by almost 200 basis points (right panel of chart 4, dashed orange line).
While the adverse scenario may already appear closer to realization than the original baseline scenario, we would caution against this interpretation. After all, the adverse scenario presented in this paper features (1) no reaction by banks given our static balance sheet assumption, (2) conservative calibrations of non-credit risk-related risk factors, and (3) does not yet include the most recent round of mitigating measures announced in early November 2020. In our view, the COVID-19 pandemic would have to escalate significantly before results like this would materialize. And even if it did, the aggregate Austrian banking system would still be in a fairly comfortable position, not least because of the impact of the mitigating measures.
6.2 The disaggregate impact on the Austrian banking system
Charts 5.1 and 5.2 illustrate the frequency distribution of the CET1 ratio of the 395 individual banks included in the exercise for the baseline and the adverse scenario, respectively. In both charts, we show the scenario with measures on the left and the counterfactual without measures on the right. The upper row reflects the unweighted frequency distribution, i.e. each bank counts one. The lower row presents the total asset weighted frequency distribution, i.e. a bank that is ten times the size of another contributes ten times more to the respective surface of the frequency distribution.
In chart 5.1, we see a steady expansion of the yellow surfaces for the baseline scenario, which indicates a deterioration of the capitalization of a significant number of banks. The upper row also indicates a turnaround in the third year of
30 The CET1 ratio cited in the “Recent developments” section in this issue differs from this CET1 ratio. This is due to the fact that the stress test sample only includes CRR credit institutions, while the other, larger sample covers credit institutions as defined in the Austrian Banking Act.

Modeling the COVID-19 effects on the Austrian economy and banking system
FINANCIAL STABILITY REPORT 40 – NOVEMBER 2020 81
%
With measures, unweighted
100
75
50
25
0
100
75
50
25
0
%
Without measures, unweighted
Baseline scenario: frequency distributions of Austrian banks’ CET1 ratio in the OeNB’s 2020 stress test
Chart 5.1
Source: Authors’ calculations.
≥ 20.0%≥ 7.5% < 10.0%
≥ 17.5% < 20.0% ≥ 15.0% < 17.5%< 5.0%
≥ 12.5% < 15.0%≥ 5.0% < 7.5%
≥ 10.0% < 12.5%
Dec. 19 Dec. 20 Dec. 21 Dec. 22 Dec. 19 Dec. 20 Dec. 21 Dec. 22
%
With measures, total assets weighted
100
75
50
25
0
100
75
50
25
0
%
Without measures, total assets weighted
Dec. 19 Dec. 20 Dec. 21 Dec. 22 Dec. 19 Dec. 20 Dec. 21 Dec. 22
Adverse scenario: frequency distributions of Austrian banks’ CET1 ratio in the OeNB’s 2020 stress test
Chart 5.2
Source: Authors’ calculations.
%
With measures, total assets weighted
%
Without measures, total assets weighted
≥ 20.0%≥ 7.5% < 10.0%
≥ 17.5% < 20.0% ≥ 15.0% < 17.5%< 5.0%
≥ 12.5% < 15.0%≥ 5.0% < 7.5%
≥ 10.0% < 12.5%
100
75
50
25
0
100
75
50
25
0
Dec. 19 Dec. 20 Dec. 21 Dec. 22 Dec. 19 Dec. 20 Dec. 21 Dec. 22
%
With measures, unweighted%
Without measures, unweighted
100
75
50
25
0
100
75
50
25
0
Dec. 19 Dec. 20 Dec. 21 Dec. 22 Dec. 19 Dec. 20 Dec. 21 Dec. 22
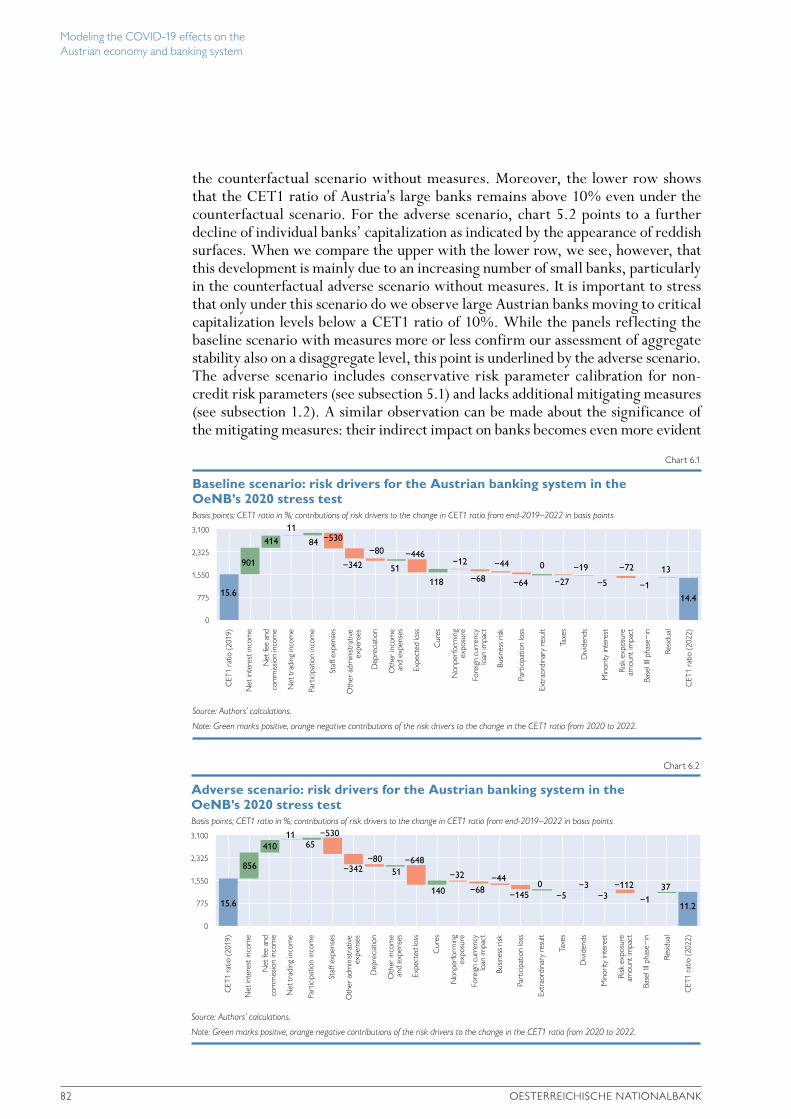
Modeling the COVID-19 effects on the Austrian economy and banking system
82 OESTERREICHISCHE NATIONALBANK
the counterfactual scenario without measures. Moreover, the lower row shows that the CET1 ratio of Austria’s large banks remains above 10% even under the counterfactual scenario. For the adverse scenario, chart 5.2 points to a further decline of individual banks’ capitalization as indicated by the appearance of reddish surfaces. When we compare the upper with the lower row, we see, however, that this development is mainly due to an increasing number of small banks, particularly in the counterfactual adverse scenario without measures. It is important to stress that only under this scenario do we observe large Austrian banks moving to critical capitalization levels below a CET1 ratio of 10%. While the panels reflecting the baseline scenario with measures more or less confirm our assessment of aggregate stability also on a disaggregate level, this point is underlined by the adverse scenario. The adverse scenario includes conservative risk parameter calibration for non-credit risk parameters (see subsection 5.1) and lacks additional mitigating measures (see subsection 1.2). A similar observation can be made about the significance of the mitigating measures: their indirect impact on banks becomes even more evident
Basis points; CET1 ratio in %; contributions of risk drivers to the change in CET1 ratio from end-2019–2022 in basis points
3,100
2,325
1,550
775
0
Baseline scenario: risk drivers for the Austrian banking system in the OeNB’s 2020 stress test
Chart 6.1
Source: Authors’ calculations.
Note: Green marks positive, orange negative contributions of the risk drivers to the change in the CET1 ratio from 2020 to 2022.
15.614.4
901
41411
84 −530
−342
−80
51
−446
118
−12
−68
−44
−64
0
−27
−19
−5
−72
−1
13
CET
1 ra
tio (2
019)
Net
inte
rest
inco
me
Net
fee
and
com
miss
ion
inco
me
Net
trad
ing
inco
me
Part
icip
atio
n in
com
e
Staff
exp
ense
s
Oth
er a
dmin
istra
tive
exp
ense
s
Dep
reci
atio
n
Oth
er in
com
e a
nd e
xpen
ses
Expe
cted
loss
Cur
es
Non
perf
orm
ing
exp
osur
e
Fore
ign
curr
ency
loan
impa
ct
Busin
ess
risk
Part
icip
atio
n lo
ss
Extr
aord
inar
y re
sult
Taxe
s
Div
iden
ds
Min
ority
inte
rest
Risk
exp
osur
e a
mou
nt im
pact
Base
l III
phas
e−in
Resid
ual
CET
1 ra
tio (2
022)
Basis points; CET1 ratio in %; contributions of risk drivers to the change in CET1 ratio from end-2019–2022 in basis points
3,100
2,325
1,550
775
0
Adverse scenario: risk drivers for the Austrian banking system in the OeNB’s 2020 stress test
Chart 6.2
Source: Authors’ calculations.
Note: Green marks positive, orange negative contributions of the risk drivers to the change in the CET1 ratio from 2020 to 2022.
15.6 11.2
856
41011
65−530
−342−80
51−648
140
−32
−68−44
−1450
−5−3
−3−112
−137
CET
1 ra
tio (2
019)
Net
inte
rest
inco
me
Net
fee
and
com
miss
ion
inco
me
Net
trad
ing
inco
me
Part
icip
atio
n in
com
e
Staff
exp
ense
s
Oth
er a
dmin
istra
tive
exp
ense
s
Dep
reci
atio
n
Oth
er in
com
e a
nd e
xpen
ses
Expe
cted
loss
Cur
es
Non
perf
orm
ing
exp
osur
e
Fore
ign
curr
ency
loan
impa
ct
Busin
ess
risk
Part
icip
atio
n lo
ss
Extr
aord
inar
y re
sult
Taxe
s
Div
iden
ds
Min
ority
inte
rest
Risk
exp
osur
e a
mou
nt im
pact
Base
l III
phas
e−in
Resid
ual
CET
1 ra
tio (2
022)

Modeling the COVID-19 effects on the Austrian economy and banking system
FINANCIAL STABILITY REPORT 40 – NOVEMBER 2020 83
at a disaggregate than at an aggregate level in both scenarios. Just as for the corporate sector, the hardest-hit banks appear to benefit disproportionately.
6.3 The main drivers of the stress testing results
Charts 6.1 and 6.2 provide a breakdown of the main contributions to the change in the CET1 ratio across the two scenarios. Credit risk clearly remains the largest driver of risk in either scenario. Under the baseline scenario, the consolidated aggregate Austrian banking system remains profitable in its core operations (operating result after risk). In contrast, the revaluation of participations and the increase in credit risk exposure amounts (REAs) cause the CET1 ratio to drop. Under the adverse scenario, the former is no longer the case: the marginal impact of further insolvencies is by far the biggest difference (CET1 ratio –278 basis points vis-à-vis the baseline scenario). But the difference is not only related to credit risk, with participation losses (–99 basis points) the second most important marginal contributor. We interpret this as an acute risk of balance sheet contagion due to the inverse consolidation of the cooperative banking sector (by far the most important driver of this item), a defining feature of the Austrian banking system and unfortunately one that amplifies crises. Finally, a drop in NII (–49 basis points; not least due to the aforementioned credit spread increases under the adverse scenario) and a further increase of the credit quality-related REA (–45 basis points) also have a nonnegligible impact.
Looking at the risk drivers in general and the credit risk resulting from COVID-19- related insolvencies in particular at a disaggregate level, we find, however, that a bank’s disproportionate exposure to the hardest-hit economic sectors (arts, enter-tainment and recreation or NACE R and accommodation and food services or NACE I) does not automatically lead to higher CET1 ratio drawdowns in either of the scenarios. We also have to look at the initial credit quality of the portfolios in question and the overall profitability of the bank. While not related to the drawdown, initial capitalization obviously makes a difference.
7 Summary and conclusionsIn the final section of our paper, we try to do justice to the complex modeling setup of our analysis. On the one hand, we introduce a novel approach for modeling corporate insolvencies in Austria, which we use as an alternative input to assess COVID-19-related credit risk in our stress testing model ARNIE. After describing the two models, we present the results and draw policy conclusions. To interpret our findings, note the following important disclaimers regarding the assumptions underlying our conclusions.
7.1 Important disclaimers
Given the numerous models involved and the complex modeling setup, there are obviously many drawbacks to our assessment. The macroeconomic forecast is subject to a high degree of uncertainty. There are substantial downside risks and, as of writing, COVID-19 infections are on the increase again.
The corporate insolvency model is highly stylized and relies on several heroic assumptions. We nevertheless believe that the calibration of the model is likely to err on the conservative side. As for modeling the mitigating measures, their effects are also subject to considerable uncertainty. On the one hand, they could be over-estimated, since we assume a quick payout of funds based on the eligibility criteria. On the other hand, the measures could reduce insolvencies to a greater extent than

Modeling the COVID-19 effects on the Austrian economy and banking system
84 OESTERREICHISCHE NATIONALBANK
assumed due to possible secondary effects on GDP growth and a subsequent lesser decline in corporate turnover.
The OeNB’s stress testing framework ARNIE is built around the EBA stress testing methodology, focusing on the comparability of results across banks rather than on accurate forecasting. Most importantly, the static balance sheet assumption disallows banks’ individual reaction to the COVID-19 pandemic. The second important set of assumptions concerns the translation of elevated corporate insolvency rates resulting from our corporate insolvency model into the materialization of credit risk in banks’ individual exposures. While we are confident about our assessment of the credit risk of Austrian corporate exposures, we rely on heroic assumptions for Austrian retail exposures, and a rather mechanistic extrapolation of Austrian dynamics to cross-border exposures.
7.2 Main takeaways
In light of these important qualifiers, it is prudent to take the absolute results with a grain of salt. This mainly concerns the projected insolvency rates for Austrian corporations and the impact on the CET1 ratio of Austrian banks. But this should by no means lessen the value of the structural insights we are able to provide with our modeling setup.
While mitigating measures can only partly offset the COVID-19-induced shock to Austrian firms, they play an important role in lowering insolvency rates both on aggregate and in the hardest-hit sectors. It is important to note, however, that their impact is more pronounced in 2020, with some measures temporarily delaying payment obligations. Consequently, insolvency rates will be higher in 2021 than without mitigating measures, even though they will never reach their cumulated level.
A rather similar picture emerges for Austrian banks. With mitigating measures reducing corporate insolvency rates, banks face significantly lower COVID-19-related credit losses, which clearly has a positive impact on their capitalization ratios. Hence, Austrian banks benefit indirectly from the mitigating measures taken by the Austrian government and other institutions.
COVID-19 will nevertheless take its toll on Austrian banks, but today they appear to be in a much stronger position than at the onset of the great financial crisis of 2008/09. Capitalization levels are up across the board, providing ample cushion for the expected increase in corporate insolvencies, also on a disaggregate level. Our results suggest that only a substantial further deterioration of the COVID-19 pandemic could put the Austrian banking system in a critical position.
7.3 Next steps
Within the current framework, i.e. without addressing the above weaknesses, the most important refinement relates to the recalibration of the mitigating measures included in the model as more empirical data become available. Thanks to the way our framework is integrated at present, it allows for a quick impact assessment also if (a) existing measures are extended, (b) endowments change or (c) further measures are put into effect. Similarly, the model allows for a simple assessment of counter-factuals. Examples are the integration of frictions with regard to the payout of existing mitigating measures, the recalibration of existing measures, and the intro-duction of additional measures that are not (yet) on the table. Since its first iteration in June 2020, the model has been re-run multiple times to inform internal policy
Modeling the COVID-19 effects on the Austrian economy and banking system
FINANCIAL STABILITY REPORT 40 – NOVEMBER 2020 85
debates and will certainly be re-run in light of the most recent developments mentioned in the paper.
Beyond the current framework, i.e. when we address the above weaknesses, we see multiple avenues to improve the underlying models. Most importantly, the static balance sheet assumption currently limits the conclusions that can be drawn from our work, both for the corporate and banking sector. Extending the model in this regard is not a straightforward procedure, however. We would need to change firm and bank behavior: while we currently assume passive reactions to outside circumstances, firms and banks would have to be transformed into active agents with objective functions.
In the meantime, we can turn to low-hanging fruit to improve both the insolvency and stress testing models. Many of the empirical calibrations mentioned throughout the paper merit revisiting. Whenever we chose to rely on economy-wide parameters for corporates, we can move to sectoral calibrations. Whenever we calibrate ARNIE based on banking system aggregates, we can endogenize bank-level calibration. Any improvements in these areas will certainly help make our modeling output more realistic and therefore more valuable for the policy discussions it was initially designed to enlighten.
ReferencesBCBS. 2005. An Explanatory Note on the Basel II IRB Risk Weight Functions.Blanco, R., S. Mayordomo, A. Menéndez and M. Mulino. 2020. Spanish non-financial
corporations’ liquidity needs and solvency after the COVID-19 shock. Banco de España Documentos Ocasionales (Occasional Paper Series) 2020. https://www.bde.es/f/webbde/SES/Secciones/Publicaciones/PublicacionesSeriadas/DocumentosOcasionales/20/Files/do2020e.pdf
Boss, M., G. Krenn, C. Puhr and M. Summer. 2006. Systemic Risk Monitor: A Model for Systemic Risk Analysis and Stress Testing for Austria. In: Financial Stability Report 11. OeNB. 83–95.
Davydenko, S. A. 2007. When do firms default? A study of the default boundary. Mimeo.De Vito, A. and J.P. Gomez. 2020. Estimating the COVID-19 cash crunch: global evidence and
policy. In: Journal of Accounting and Public Policy. Forthcoming.EBA. 2018. 2018 EU-Wide Stress Test – Methodological Note.EBA. 2020a. Guidelines on legislative and non-legislative moratoria on loan repayments applied in
the light of the COVID-19 crisis. GL 02/2020.EBA. 2020b. Guidelines on reporting and disclosure of exposures subject to measures applied in
response to the COVID-19 crisis. GL 07/2020.EBA. 2020c. Supervisory reporting. eba.europa.eu/regulation-and-policy/supervisory-reportingECB. 2020a. Eurosystem staff macroeconomic projections for the euro area. June. https://www.
ecb.europa.eu/pub/projections/html/ecb.projections202006_eurosystemstaff~7628a8cf43.en.htmlECB. 2020b. COVID-19 Vulnerability Analysis – Results overview. https://www.bankingsupervision.
europa.eu/press/pr/date/2020/html/ssm.pr200728_annex~d36d893ca2.en.pdfECB. 2020c. AnaCredit. www.ecb.europa.eu/stats/money_credit_banking/anacredit/html/index.en.htmlECCBSO. 2020. BACH User Guide. www.bach.banque-france.fr/index.php?page=telechargementa-
File&file=Summary_Userguide.pdfFeldkircher, M., G. Fenz, R. Ferstl, G. Krenn, B. Neudorfer, C. Puhr, T. Reininger, S.W.
Schmitz, M. Schneider, C. Siebenbrunner, M. Sigmund and R. Spitzer. 2013. ARNIE in Action: The 2013 FSAP Stress Tests for the Austrian Banking System. In: Financial Stability Report 26. OeNB. 100–118.

Modeling the COVID-19 effects on the Austrian economy and banking system
86 OESTERREICHISCHE NATIONALBANK
Fenz, G., C. Ragacs, M. Schneider and K. Vondra. 2020. COVID-19-induced recession: biggest economic policy challenge for Austria in the “Second Republic.” Economic outlook for Austria from 2020 to 2022 (June 2020). In: Monetary Policy & the Economy Q1–Q2/20. OeNB. 213–250.
Guerini, M., L. Nesta, X. Ragot and S. Schiavo. 2020. Dynamique des défaillances d’entreprises en France et crise de la Covid-19. OFCE Policy Brief 73. June 19.
McNeil, A. J., R. Frey and P. Embrechts. 2015. Quantitative Risk Management: Concepts, Techniques and Tools. Princeton Series in Finance. Princeton: Princeton University Press.
OECD. 2020. Corporate sector vulnerabilities during the Covd-19 outbreak. Assessment and policy responses. Tackling Coronavirus Series. May 5.
OeNB. 2019. ARNIE Still in Action – Results of the 2019 OeNB system stress tests. In: Financial Stability Report 38. OeNB. 14–22.
OeNB. 2020a. Reporting to the OeNB. www.oenb.at/en/reporting.htmlOeNB. 2020b. A scenario analysis to assess the impact of COVID-19 on the Austrian banking
system. In: Financial Stability Report 39. OeNB. 55–58.Puhr, C. and M. Schneider. 2021. Have government measures helped prevent COVID-19-induced
insolvencies? In: Monetary Policy & the Economy Q4/20–Q1/21. OeNB. Forthcoming.
FINANCIAL STABILITY REPORT 40 – NOVEMBER 2020 87
The Austrian bank branch network from 2000 to 2019 from a spatial perspective
Helmut Stix1
Refereed by: Matthias Uhl, Deutsche Bundesbank
This paper presents results of an analysis of the spatial distribution of bank branches in Austria over the period from January 2000 to December 2019 from two perspectives: First, we analyze the temporal development of bank branch availability at the municipality level. Second, we present estimates of travel distances to the nearest bank branch. At the end of 2019, 555 municipalities (27% of 2,096 Austrian municipalities) did not have a bank branch, which compares with 271 municipalities in January 2000. We show that the bulk of the increase in “branchless” municipalities occurred after 2014. The closure of the last branch in a municipality occurred predominantly in municipalities with fewer than 2,000 inhabitants, and, overall, only a relatively small share of the Austrian population live in municipalities that became branchless (4.6% or 410,000 inhabitants). Given this trend, which we also see at the international level, we study travel distances to bank branches (as of 2019). On average, Austrian residents have to travel 1.5 km from their homes to the nearest bank. This distance varies from 2.7 km in municipalities with fewer than 2,000 inhabitants to 0.7 km in larger cities. A total of 77% of the population resides within a 2 km travel distance to the nearest bank. Although our results suggest that, on average, Austrians have reasonable access to bank branches, a more disaggregated analysis allows us to identify municipalities where travel distances are longer. For example, about 433,000 residents (4.9% of the population) have to travel more than 5 km. Municipalities with a high share of residents who have to travel farther than 5 km have 1,000 inhabitants on average and are located in all provinces except Vienna.
JEL classification: G21, R12, O18, E40Keywords: retail banking, bank branch, spatial analysis, Austria
Throughout the past decades retail banks have downsized their branch networks. First, this has occurred for economic reasons, i.e. increased competition and/or banks’ aim to reduce costs. A second, and closely connected, reason is digitalization. Survey data from 2019 show that about 58% of Austrians (aged 14 or older) use online banking, and close to 50% more frequently bank online than at a bank branch or at a bank’s self-service counter. In 2018, one-third of Austrians visited a bank desk once a year at most (see Ritzberger-Grünwald and Stix, 2018).
In Austria, as in many other countries, the reduction of the number of bank branches has triggered a debate about the supply of firms and consumers with local banking services, in particular in rural areas. This debate is closely linked with the question of how to secure people’s access to cash.2 Longer travel distances to the
1 Oesterreichische Nationalbank, Economic Studies Division, [email protected]. The author would like to thank the reviewer as well as the members of the editorial board for helpful comments and suggestions; Esther Segalla (OeNB), in cooperation with whom the panel dataset of bank branches has been developed; Magdalena Bannholzer, Andreas Hiller, Siegrun Gansch, Philipp Koch and Anna Stelzer, who provided excellent assistance in compiling the data; the OeNB’s Statistical Information Systems and Data Management Division for providing the bank addresses. The method of computing routes has been developed in cooperation with colleagues from the OeNB’s Cashier’s Division. Opinions expressed by the author of this study do not necessarily reflect the official viewpoint of the Oesterreichische Nationalbank or the Eurosystem.
2 Although the bulk of withdrawals occurs at ATMs, local bank branches often operate ATMs and provide for the possibility of depositing or withdrawing higher amounts. See Stix (2020) for more details.

The Austrian bank branch network from 2000 to 2019 from a spatial perspective
88 OESTERREICHISCHE NATIONALBANK
closest bank branch could affect those segments of the population that have not adopted online banking or cashless payment products: typically older persons in rural areas. An international perspective shows that there are countries which are already further down the road with regard to the reduction of the branch network. In Sweden, for example, concerns that some segments of the population are under-supplied have led to proposals that certain banks should be required to “provide cash withdrawals and process daily receipts to the extent that reasonable access to these is provided” throughout the country (SOU, 2018, p. 24). In its Retail Payments Strategy, the European Commission (2020, p. 14) states that it “[e]xpects Member States to ensure the acceptance and accessibility of cash as a public good”.
There are many different views and aspects to be considered in the debate about whether a bank branch network is too large, too small or just right, and, clearly, any answer will depend on the perspective from which this question is analyzed. This notwithstanding, it is evident that the debate should best be based on information about the regional availability of bank branches. The aim of this paper is to provide regionally disaggregated information and to present estimates about the physical distances Austrian residents need to travel from their homes to reach the nearest bank branch. These estimates can be used for comparing the availability of bank branches in urban and rural areas and for conducting international comparisons, and they also provide a benchmark for monitoring future developments.
Specifically, we utilize a newly constructed geolocation dataset of Austrian bank branches over the past 20 years to study two questions: • How many and which municipalities have no bank branch? How has this number
changed over time?• What is the average distance Austrians need to travel to their closest bank
branch? In which areas are these distances longer?Analyzing the number of bank branches per municipality allows us to assess the changes over time from January 2000 to December 2019. For example, we identify the municipalities which became branchless (i.e. the last branch closed) in this period and provide a basic analysis of their characteristics (i.e. their location and size). This analysis is based on the level of municipalities.
While this analysis is informative, it also has its downsides. Municipality borders change over time, and the sizes of municipalities differ widely across provinces due to political decisions, topology, population density, etc., which inhibits meaningful comparisons. Furthermore, it is not clear a priori that residents of a municipality without a bank branch must travel large distances to the next bank, e.g. if a nearby municipality has a bank branch. Therefore, we discuss a second metric for assessing access which is more robust to such differences: travel distances to the nearest bank branch. We compute these distances for each 100 m by 100 m grid cell in Austria that was populated on January 1, 2019, thereby covering the entire Austrian population. Moreover, the distances reflect “true” travel distances based on the Austrian road system. We consider this important, given that applying straight-line (“as the crow flies”) distances, as is typically done in other studies, might be problematic in less populated regions. These travel distance estimates provide information about the average degree of reachability of the Austrian bank branch network and allow us to identify those areas where it is lower. We note that these distances refer to the branch network at end-2019.3
3 Travel distances for earlier years could not be computed as both the street network and the structure of settlements have changed since 2000.

The Austrian bank branch network from 2000 to 2019 from a spatial perspective
FINANCIAL STABILITY REPORT 40 – NOVEMBER 2020 89
When interpreting the findings of this paper, the following should be taken into account. First, this article provides only a descriptive account and therefore seeks to avoid, as much as possible, normative judgments, which would require a more elaborate analysis (and a theoretical framework which allows normative statements, e.g. “access is good”). Second, we use the term “access” in a way that only refers to travel distances, neglecting online access, for example, or other dimensions of access to banking services (e.g. exclusion from loans). It must be borne in mind that the same physical distance can have very different implications for different people, depending on mobility, the use of online or mobile banking, health, availability of means of transport, etc., all of which are not taken into account in this analysis. Third, a change in the number of branches does not necessarily imply deteriorating access or a deterioration in the quality of service, since, for instance, branches may have been relocated to provide better services. Moreover, the increased use of online banking has certainly decreased the demand for physical bank branches. Finally, the process of georeferencing bank branch addresses is prone to errors. Although intensive data checks were conducted, some errors will remain, at least regarding the exact location of branches. For the earlier years of our sample period, there may also be a margin of error regarding the assignment of branches to municipalities. Nevertheless, we are confident that the results regarding averages are not overly biased by remaining errors, qualitatively.4
The paper proceeds as follows. Section 1 describes the bank branch dataset. Section 2 presents results from a spatial analysis of municipalities, section 3 discusses travel distances to bank branches, and section 4 summarizes and concludes.
1 Data descriptionWe use a registry of addresses of all Austrian bank headquarters and branches provided by the OeNB to build up a panel dataset of Austrian bank branch locations. From January 2000 to December 2019, there are 9,699 unique addresses, which we georeferenced.
Subsequently, the following definitions and restrictions will apply:• As the focus of this paper is on the availability of banks to consumers, we will
henceforth focus on retail banks and neglect other banks (e.g. leasing banks, building and loan associations, bureaux de change). In Austria, there are the following types of retail banks: joint stock banks, savings banks, state mortgage banks, Raiffeisen credit cooperatives and Volksbank credit cooperatives.
• The registry distinguishes between headquarters and branches. It is a matter of convention whether headquarters are counted as entities providing banking services. While the headquarters of many smaller banks with only a few bank branches (e.g. local Raiffeisen banks) are likely to provide retail banking services, this is likely not the case for larger banks. In the following we will count all addresses, regardless of whether it is the location of headquarters or an associated branch and refer to all locations as “bank branches” or “banks.”
• The registry only contains staffed branches; therefore, our analysis does not include self-service branches.
4 Results for individual municipalities, however, could be affected more strongly by remaining errors. Therefore, the corresponding results should be taken as indicative only.
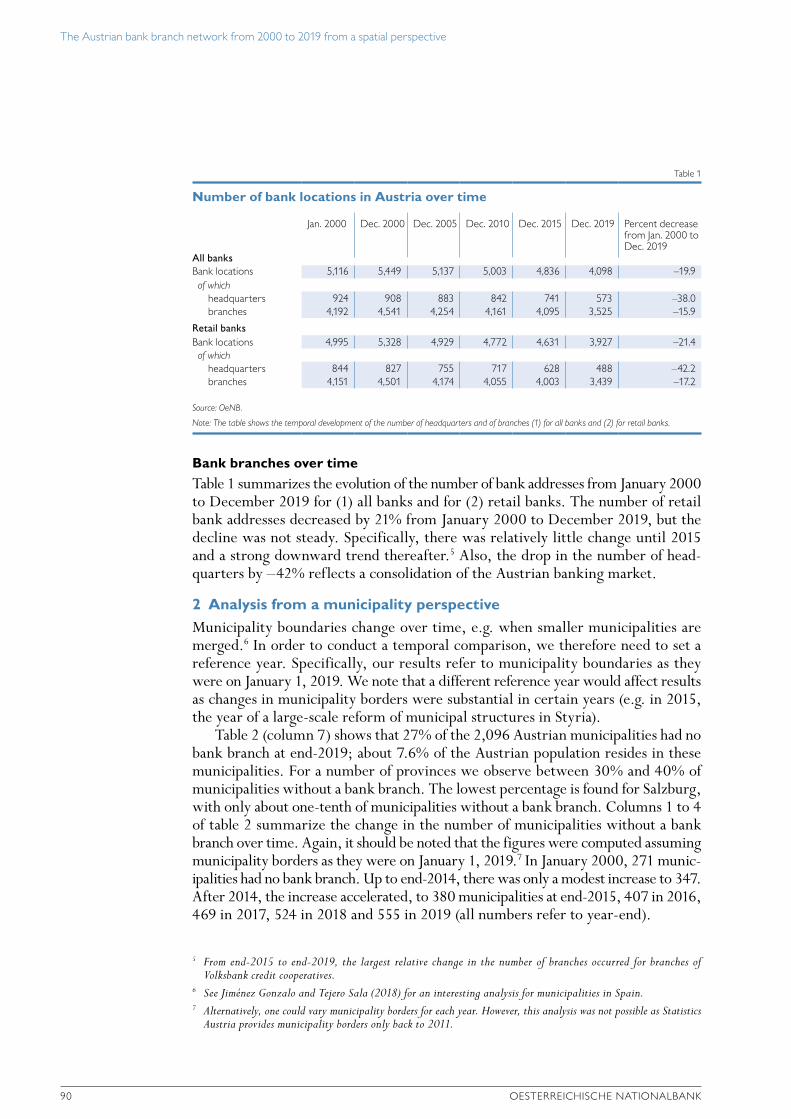
The Austrian bank branch network from 2000 to 2019 from a spatial perspective
90 OESTERREICHISCHE NATIONALBANK
Bank branches over timeTable 1 summarizes the evolution of the number of bank addresses from January 2000 to December 2019 for (1) all banks and for (2) retail banks. The number of retail bank addresses decreased by 21% from January 2000 to December 2019, but the decline was not steady. Specifically, there was relatively little change until 2015 and a strong downward trend thereafter.5 Also, the drop in the number of head-quarters by –42% reflects a consolidation of the Austrian banking market.
2 Analysis from a municipality perspectiveMunicipality boundaries change over time, e.g. when smaller municipalities are merged.6 In order to conduct a temporal comparison, we therefore need to set a reference year. Specifically, our results refer to municipality boundaries as they were on January 1, 2019. We note that a different reference year would affect results as changes in municipality borders were substantial in certain years (e.g. in 2015, the year of a large-scale reform of municipal structures in Styria).
Table 2 (column 7) shows that 27% of the 2,096 Austrian municipalities had no bank branch at end-2019; about 7.6% of the Austrian population resides in these municipalities. For a number of provinces we observe between 30% and 40% of municipalities without a bank branch. The lowest percentage is found for Salzburg, with only about one-tenth of municipalities without a bank branch. Columns 1 to 4 of table 2 summarize the change in the number of municipalities without a bank branch over time. Again, it should be noted that the figures were computed assuming municipality borders as they were on January 1, 2019.7 In January 2000, 271 munic-ipalities had no bank branch. Up to end-2014, there was only a modest increase to 347. After 2014, the increase accelerated, to 380 municipalities at end-2015, 407 in 2016, 469 in 2017, 524 in 2018 and 555 in 2019 (all numbers refer to year-end).
5 From end-2015 to end-2019, the largest relative change in the number of branches occurred for branches of Volksbank credit cooperatives.
6 See Jiménez Gonzalo and Tejero Sala (2018) for an interesting analysis for municipalities in Spain.7 Alternatively, one could vary municipality borders for each year. However, this analysis was not possible as Statistics
Austria provides municipality borders only back to 2011.
Table 1
Number of bank locations in Austria over time
All banks
Jan. 2000 Dec. 2000 Dec. 2005 Dec. 2010 Dec. 2015 Dec. 2019 Percent decrease from Jan. 2000 to Dec. 2019
Bank locations 5,116 5,449 5,137 5,003 4,836 4,098 –19.9 of which
headquarters 924 908 883 842 741 573 –38.0 branches 4,192 4,541 4,254 4,161 4,095 3,525 –15.9
Retail banksBank locations 4,995 5,328 4,929 4,772 4,631 3,927 –21.4
of whichheadquarters 844 827 755 717 628 488 –42.2 branches 4,151 4,501 4,174 4,055 4,003 3,439 –17.2
Source: OeNB.
Note: The table shows the temporal development of the number of headquarters and of branches (1) for all banks and (2) for retail banks.
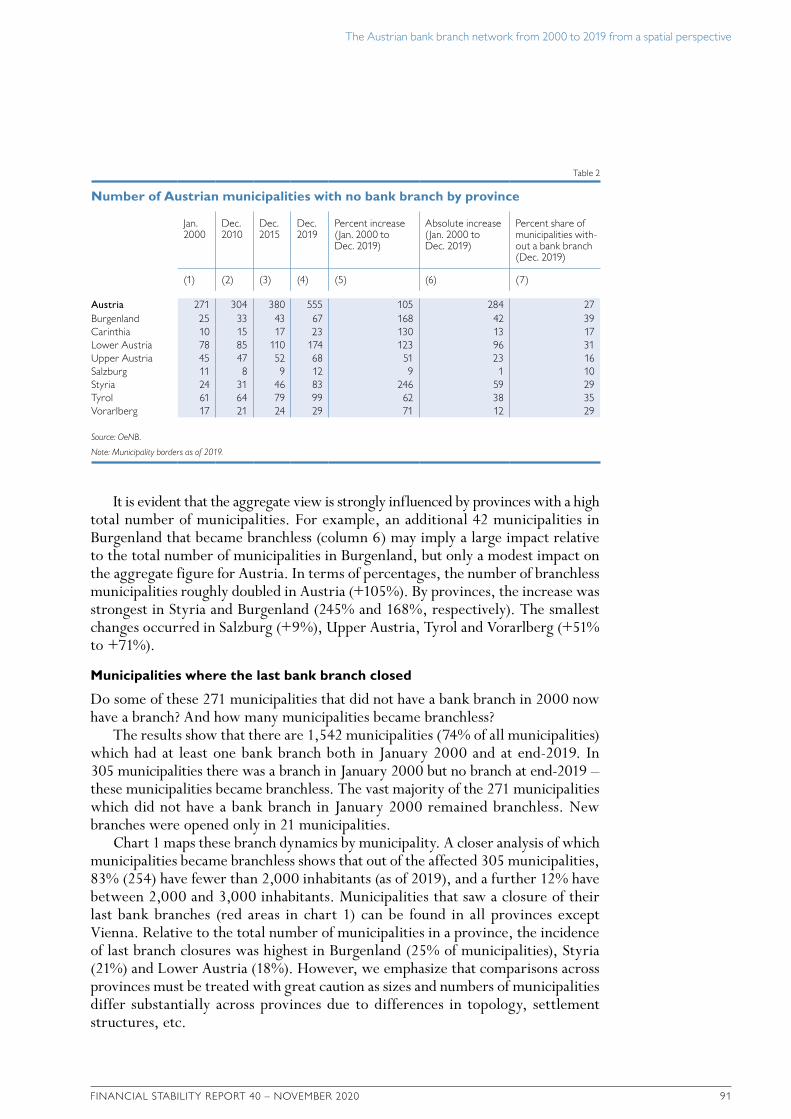
The Austrian bank branch network from 2000 to 2019 from a spatial perspective
FINANCIAL STABILITY REPORT 40 – NOVEMBER 2020 91
It is evident that the aggregate view is strongly influenced by provinces with a high total number of municipalities. For example, an additional 42 municipalities in Burgenland that became branchless (column 6) may imply a large impact relative to the total number of municipalities in Burgenland, but only a modest impact on the aggregate figure for Austria. In terms of percentages, the number of branchless municipalities roughly doubled in Austria (+105%). By provinces, the increase was strongest in Styria and Burgenland (245% and 168%, respectively). The smallest changes occurred in Salzburg (+9%), Upper Austria, Tyrol and Vorarlberg (+51% to +71%).
Municipalities where the last bank branch closed
Do some of these 271 municipalities that did not have a bank branch in 2000 now have a branch? And how many municipalities became branchless?
The results show that there are 1,542 municipalities (74% of all municipalities) which had at least one bank branch both in January 2000 and at end-2019. In 305 municipalities there was a branch in January 2000 but no branch at end-2019 – these municipalities became branchless. The vast majority of the 271 municipalities which did not have a bank branch in January 2000 remained branchless. New branches were opened only in 21 municipalities.
Chart 1 maps these branch dynamics by municipality. A closer analysis of which municipalities became branchless shows that out of the affected 305 municipalities, 83% (254) have fewer than 2,000 inhabitants (as of 2019), and a further 12% have between 2,000 and 3,000 inhabitants. Municipalities that saw a closure of their last bank branches (red areas in chart 1) can be found in all provinces except Vienna. Relative to the total number of municipalities in a province, the incidence of last branch closures was highest in Burgenland (25% of municipalities), Styria (21%) and Lower Austria (18%). However, we emphasize that comparisons across provinces must be treated with great caution as sizes and numbers of municipalities differ substantially across provinces due to differences in topology, settlement structures, etc.
Table 2
Number of Austrian municipalities with no bank branch by province
Jan. 2000
Dec. 2010
Dec. 2015
Dec. 2019
Percent increase (Jan. 2000 to Dec. 2019)
Absolute increase (Jan. 2000 to Dec. 2019)
Percent share of municipalities with-out a bank branch (Dec. 2019)
(1) (2) (3) (4) (5) (6) (7)
Austria 271 304 380 555 105 284 27 Burgenland 25 33 43 67 168 42 39 Carinthia 10 15 17 23 130 13 17 Lower Austria 78 85 110 174 123 96 31 Upper Austria 45 47 52 68 51 23 16 Salzburg 11 8 9 12 9 1 10 Styria 24 31 46 83 246 59 29 Tyrol 61 64 79 99 62 38 35 Vorarlberg 17 21 24 29 71 12 29
Source: OeNB.
Note: Municipality borders as of 2019.

The Austrian bank branch network from 2000 to 2019 from a spatial perspective
92 OESTERREICHISCHE NATIONALBANK
3 Spatial analysis: distances to nearest bankWhile the analysis by municipalities is informative, it only provides an incomplete view of the density of the branch network. First, our results are affected by the reference year as municipality borders vary over time. Second, such an analysis may reveal inaccurate information on the actual distances households need to travel to their next bank branch. As a case in point, travel distances could be reasonable in a branchless village if a neighboring village has a bank branch. Therefore, we discuss an alternative metric which is robust to definitions of administrative boundaries. Specifically, we analyze geographical distances, i.e. we assess travel distances on streets and identify the route to the closest bank branch for all Austrian addresses.
The analysis is based on a 100 m by 100 m geographical grid of Austria. As starting points, we do not use exact addresses but the center points of 580,995 grid cells of 100 m by 100 m which were populated on January 1, 2019. The computations of routes and the identification of the closest bank branch were carried out by an external company which used TomTom (©, road network as of June 2020). The annex provides a brief exposition of how routes were calculated. A more detailed description, also discussing the limitations of this approach, can be found in Stix (2020). The distances reported below refer to the shortest distance to the nearest bank branch, either by walking or by driving, whichever is the shorter route.
Changes in bank branch availability from January 2000 to December 2019
Chart 1
Municipalities that continue to have branches Municipalities that gained branches while having none before Municipalities that continue to have no branches Municipalities that lost any branches they had
0 50 100 km
Source: Statistik Austria – data.statistik.gv.at, OeNB.
Note: The analysis of changes in the availability is based on the basis of municipality boundaries as of January 1, 2019. Using municipality boundaries of other years will affect results. Results for individual municipalities could be affected by errors in the assignment of branches to municipalities. Results should thus be treated as indicative only.
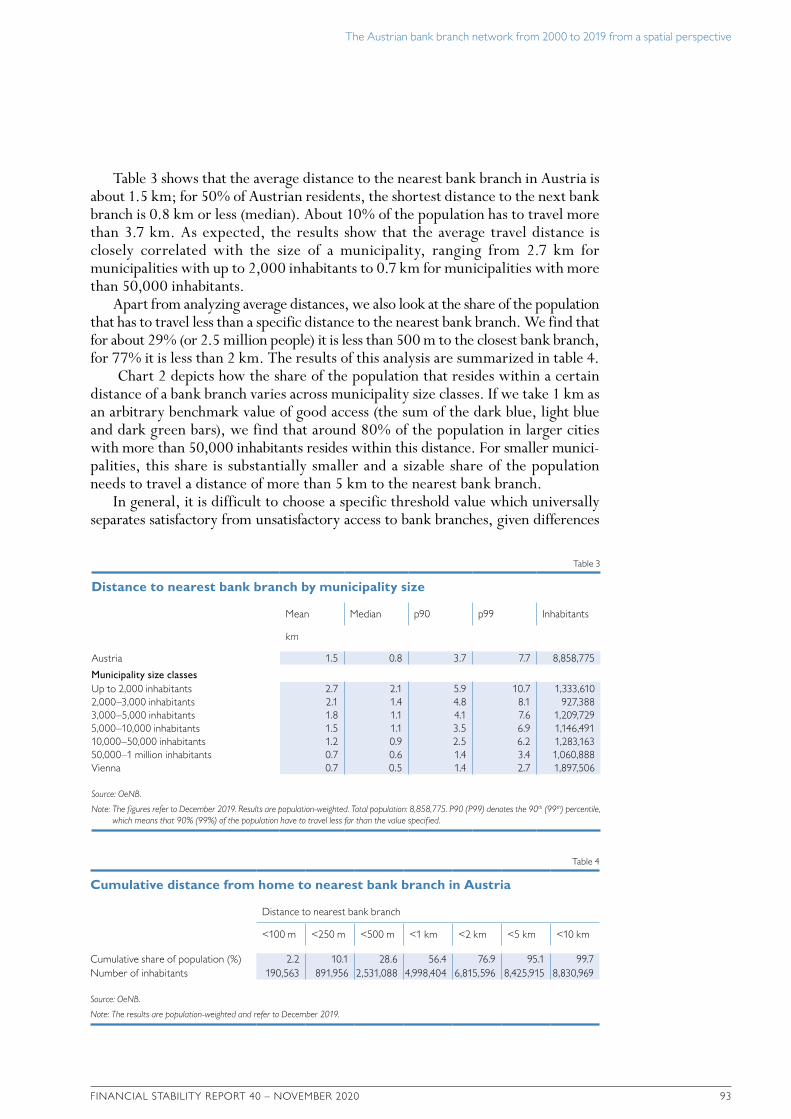
The Austrian bank branch network from 2000 to 2019 from a spatial perspective
FINANCIAL STABILITY REPORT 40 – NOVEMBER 2020 93
Table 3 shows that the average distance to the nearest bank branch in Austria is about 1.5 km; for 50% of Austrian residents, the shortest distance to the next bank branch is 0.8 km or less (median). About 10% of the population has to travel more than 3.7 km. As expected, the results show that the average travel distance is closely correlated with the size of a municipality, ranging from 2.7 km for municipalities with up to 2,000 inhabitants to 0.7 km for municipalities with more than 50,000 inhabitants.
Apart from analyzing average distances, we also look at the share of the population that has to travel less than a specific distance to the nearest bank branch. We find that for about 29% (or 2.5 million people) it is less than 500 m to the closest bank branch, for 77% it is less than 2 km. The results of this analysis are summarized in table 4.
Chart 2 depicts how the share of the population that resides within a certain distance of a bank branch varies across municipality size classes. If we take 1 km as an arbitrary benchmark value of good access (the sum of the dark blue, light blue and dark green bars), we find that around 80% of the population in larger cities with more than 50,000 inhabitants resides within this distance. For smaller munici-palities, this share is substantially smaller and a sizable share of the population needs to travel a distance of more than 5 km to the nearest bank branch.
In general, it is difficult to choose a specific threshold value which universally separates satisfactory from unsatisfactory access to bank branches, given differences
Table 3
Distance to nearest bank branch by municipality size
Mean Median p90 p99 Inhabitants
km
Austria 1.5 0.8 3.7 7.7 8,858,775
Municipality size classesUp to 2,000 inhabitants 2.7 2.1 5.9 10.7 1,333,610 2,000–3,000 inhabitants 2.1 1.4 4.8 8.1 927,388 3,000–5,000 inhabitants 1.8 1.1 4.1 7.6 1,209,729 5,000–10,000 inhabitants 1.5 1.1 3.5 6.9 1,146,491 10,000–50,000 inhabitants 1.2 0.9 2.5 6.2 1,283,163 50,000–1 million inhabitants 0.7 0.6 1.4 3.4 1,060,888 Vienna 0.7 0.5 1.4 2.7 1,897,506
Source: OeNB.
Note: The figures refer to December 2019. Results are population-weighted. Total population: 8,858,775. P90 (P99) denotes the 90th (99th) percentile, which means that 90% (99%) of the population have to travel less far than the value specif ied.
Table 4
Cumulative distance from home to nearest bank branch in Austria
Distance to nearest bank branch
<100 m <250 m <500 m <1 km <2 km <5 km <10 km
Cumulative share of population (%) 2.2 10.1 28.6 56.4 76.9 95.1 99.7 Number of inhabitants 190,563 891,956 2,531,088 4,998,404 6,815,596 8,425,915 8,830,969
Source: OeNB.
Note: The results are population-weighted and refer to December 2019.
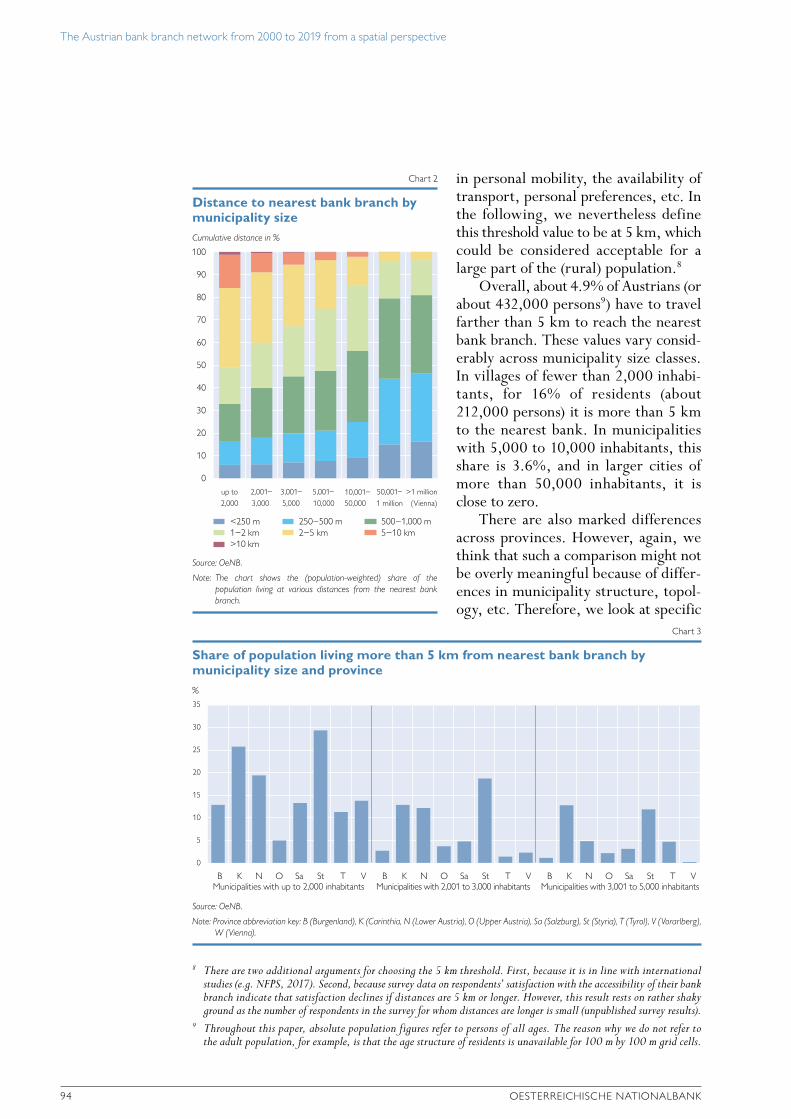
The Austrian bank branch network from 2000 to 2019 from a spatial perspective
94 OESTERREICHISCHE NATIONALBANK
in personal mobility, the availability of transport, personal preferences, etc. In the following, we nevertheless define this threshold value to be at 5 km, which could be considered acceptable for a large part of the (rural) population.8
Overall, about 4.9% of Austrians (or about 432,000 persons9) have to travel farther than 5 km to reach the nearest bank branch. These values vary consid-erably across municipality size classes. In villages of fewer than 2,000 inhabi-tants, for 16% of residents (about 212,000 persons) it is more than 5 km to the nearest bank. In municipalities with 5,000 to 10,000 inhabitants, this share is 3.6%, and in larger cities of more than 50,000 inhabitants, it is close to zero.
There are also marked differences across provinces. However, again, we think that such a comparison might not be overly meaningful because of differ-ences in municipality structure, topol-ogy, etc. Therefore, we look at specific
8 There are two additional arguments for choosing the 5 km threshold. First, because it is in line with international studies (e.g. NFPS, 2017). Second, because survey data on respondents’ satisfaction with the accessibility of their bank branch indicate that satisfaction declines if distances are 5 km or longer. However, this result rests on rather shaky ground as the number of respondents in the survey for whom distances are longer is small (unpublished survey results).
9 Throughout this paper, absolute population figures refer to persons of all ages. The reason why we do not refer to the adult population, for example, is that the age structure of residents is unavailable for 100 m by 100 m grid cells.
35
30
25
20
15
10
5
0
Share of population living more than 5 km from nearest bank branch by municipality size and province
Chart 3
Source: OeNB.
Note: Province abbreviation key: B (Burgenland), K (Carinthia, N (Lower Austria), O (Upper Austria), Sa (Salzburg), St (Styria), T (Tyrol), V (Vorarlberg), W (Vienna).
%
B K N O Sa St T V B K N O Sa St T V B K N O Sa St T VMunicipalities with up to 2,000 inhabitants Municipalities with 2,001 to 3,000 inhabitants Municipalities with 3,001 to 5,000 inhabitants
Cumulative distance in %
100
90
80
70
60
50
40
30
20
10
0
Distance to nearest bank branch by municipality size
Chart 2
Source: OeNB.
Note: The chart shows the (population-weighted) share of the population living at various distances from the nearest bank branch.
<250 m 250−500 m 500−1,000 m1−2 km 2−5 km 5−10 km>10 km
up to2,000
2,001−3,000
3,001−5,000
5,001−10,000
10,001−50,000
50,001−1 million
>1 million(Vienna)

The Austrian bank branch network from 2000 to 2019 from a spatial perspective
FINANCIAL STABILITY REPORT 40 – NOVEMBER 2020 95
municipality size classes, which controls for one but not all of these salient differences. Specifically, chart 3 depicts the share of the population for whom the distance to the nearest bank is more than 5 km. In municipalities of fewer than 2,000 inhabitants, this share is higher than 25% in Carinthia and Styria and 19% in Lower Austria. For municipalities between 2,000 and 3,000 inhabitants, the share is above 10% in Carinthia, Lower Austria and Styria.
This analysis can be further disaggregated geographically. Chart 4 provides a map of all Austrian municipalities and shows the shares of the population that travel more than 5 km to the nearest bank by municipality.10 This analysis indicates that there are some municipalities with a more limited availability of branches. Specifically, in 178 municipalities more than 60% of the population has to travel farther than 5 km to the nearest bank branch. In another 59 municipalities, this share is between 40% and 60% of inhabitants.11
The vast majority of these municipalities is small; on average, municipalities with a share higher than 40% have about 1,000 inhabitants. 25% of such municipalities have fewer than 500 inhabitants. This implies that the actual number of inhabitants that travel more than 5 km to the nearest bank is low (e.g. 50% of 1,000 persons). While we have not further scrutinized the reasons behind the relatively long distances, we conjecture that some municipalities consist of several clusters of smaller but fairly scattered agglomerations. It would also be worthwhile to study this further,
10 Again, we note that results for individual municipalities could be affected by errors in the assignment of branches to municipalities. These results should thus be seen as indicative only.
11 We note that these results do not necessarily imply that the respective municipalities are undersupplied with bank-ing and/or cash services, as our analysis does not include postal offices, self-service branches or ATMs.
Share of municipality population living more than 5 km from nearest bank branch
Chart 4
Source: Statistik Austria – data.statistik.gv.at, OeNB.
Share of population in %
0−5% 5−10% 10−20% 20−40% 40−60% >60%
0 50 100 km

The Austrian bank branch network from 2000 to 2019 from a spatial perspective
96 OESTERREICHISCHE NATIONALBANK
as well as the socioeconomic characteristics of these municipalities (e.g. average income, age structure).
How do our results compare to studies in other countries?
We are unaware of recent studies which report road travel distances to the closest bank branches in a similar way. However, several recent studies are based on straight-line (“as the crow flies”) distances.
Delaney et al. (2019) compute travel distances to cash access points in Australia. They do not specifically focus on bank branches, but nevertheless report some results for cash deposit facilities. The results suggest that close to 90% of the Australian population resides within 5 km to the nearest cash deposit facilities of a bank branch. For the U.K., Sonea et al. (2019) present results regarding distances from the centroids of small statistical areas to the closest banks, post offices or ATMs and define several indicators of spatial access. There are also interesting studies for France (Banque de France, 2019) and Spain (Jiménez Gonzalo and Tejero Sala, 2018), which mainly focus on the availability of bank branches or ATMs across municipalities and thus apply a somewhat coarser geographical perspective.
For the Netherlands, NFPS (2017) reports that 97.77% of residents are found to have resided within 5 km of cash deposit facilities in 2017.12 The metric used in NFPS (2017) expresses the degree of bank branch coverage. A circle is drawn around each branch and then the number of residents that reside in these circles is counted. This metric is computationally less demanding than route distances but has the disadvantage that it relies on straight-line distances, which might provide a biased picture in comparison to actual route distances, in particular for longer distances (compare Stix, 2020).
In order to compare the situation in Austria with that in the Netherlands, we applied the approach used in NFPS (2017) to compute comparable statistics. The results show that 66.5% of the Austrian population resides within a radius of 1 km, 91.5% within a radius of 3 km and 98.4% within a radius of 5 km of a bank branch.13
These findings suggest that the coverage of consumers by the branch network is of roughly similar magnitude in the two countries. We consider this finding interesting as there are about 2.8 times more bank branches in Austria than in the Netherlands. This could imply that a cross-country comparison of an unadjusted metric like the number of bank branches per capita, which is often used for such comparisons, could be misleading (at least with respect to assessing spatial access). This suggests that adjusted metrics that account for differences in population density and topology would be preferable.14
12 There are differences which affect comparability with the Austrian result. First and foremost, NFPS (2017) analyzes bank-operated cash facilities where consumers and businesses can deposit cash, while we analyze bank branches. We conjecture that the overwhelming share of cash deposit facilities is located at bank branches, but some might in fact be off-bank branches, so that compared to our results, the results for the Netherlands are likely to reflect an upper bound. Another difference is that the study for the Netherlands, as explained in NFPS (2017), does not focus on grid cells but on 6-digit postcode areas.
13 A comparison with table 4 reveals the bias that arises between travel distances and linear distances. The linear distances suggest that 66.5% of the population lives within 1 km. The routing result shows that this share is just 56.4%.
14 Data about bank branches refer to 2018: AT: 3,631 branches, NL: 1,489 branches. Source: EU structural financial indicators, https://www.ecb.europa.eu/pub/pdf/annex/ecb~10913d25c1.pr190604_ssi_table.pdf. In per capita terms, the difference would be even larger.

The Austrian bank branch network from 2000 to 2019 from a spatial perspective
FINANCIAL STABILITY REPORT 40 – NOVEMBER 2020 97
Are travel distances larger in municipalities without a bank branch?
Table 5 summarizes average and median travel distances for four groups of munici-palities by change in bank branch availability.
First and foremost, the table shows that the mean distance is roughly similar for municipalities that had a bank branch in December 2019 (lines 1 and 2 of table 5), irrespective of whether this municipality had a bank branch in the year 2000. A considerably higher average travel distance (3.9 km) is found for those munici-palities that neither had a bank branch in 2000 nor in 2019. The highest average distance of 5 km is found for those municipalities which became branchless. These differences are rather robust to outliers, as a similar pattern can be observed for the median distance and for the share of the population for whom the travel distance to the nearest bank is more than 5 km.
Do these results imply that the closure of the last bank branch in a municipality causes an increase in the travel distance? Unfortunately, this comparison does not allow making such a causal statement as for such a conclusion we would need to know the travel distances in the respective villages before the last branch closed; the travel distance could have been high already before the last bank branch closed. As such comparisons are only possible with the availability of further data vintages, the results just allow to establish that travel distances are relatively high in municipalities that became branchless.
4 Summary and conclusionsThis paper presents a first attempt to assess the spatial distribution of bank branches in Austria and how it has developed over the past 20 years.
We document the scope of bank branch consolidation, which accelerated after 2014, and show that closures of the last bank branches in municipalities occurred mainly in smaller municipalities with fewer than 2,000 inhabitants. Given that the analysis of the development of the number of bank branches per municipality is only of limited use for assessing the spatial access to bank branches, we present estimates of road travel distances (as of end-2019) to the closest bank branch, which is a more robust metric for changes in administrative boundaries.
Although the aim of this paper was to provide a descriptive account of the change in travel distances, we think that results allow us to conclude that – at least
Table 5
Estimated distance from home to nearest bank branch by change in availability
Change from Jan. 2000 to Dec. 2019
Mean distance to nearest branch
Median distance to nearest branch
Share of population for whom travel distance is more than 5 km
km %
Municipalities that continue to have branches 1.7 1.1 3.5 Municipalities that gained branches while having none before 1.6 1.1 1.9 Municipalities that continue to have no branches 3.9 3.6 21.3 Municipalities that lost any branches they had 5.0 4.6 42.9
Source: OeNB.
Note: The results are population-weighted and refer to December 2019. For comparability, the analysis was conducted only for municipalities with fewer than 3,000 inhabitants.

The Austrian bank branch network from 2000 to 2019 from a spatial perspective
98 OESTERREICHISCHE NATIONALBANK
on average – Austrians appear to have relatively satisfactory access to bank branches. 77% of the Austrian population resides within 2 km and 95% within 5 km of the nearest bank branch. As expected, travel distances are larger in rural areas, but even there a high share of the population resides within 5 km of the nearest bank branch. The geographically disaggregated analysis allows us to identify municipalities with a lower availability of bank branches. For example, in 178 municipalities (out of 2,096 Austrian municipalities), more than 60% of the population has to travel farther than 5 km to the nearest bank branch.
As one of the aims of this paper was to establish benchmark estimates for assessing future changes in the branch network, we would like to put our results into a broader context and to highlight some directions for future research.
First, with the increased use of online and mobile banking, the physical distance to a bank branch has clearly lost importance. Over the past two decades, the share of the population that uses online banking has increased from 7% to close to 60%.15 Nevertheless, in some segments of the population the use of digital banking and payment products is still limited – mainly among older persons (Ritzberger-Grünwald and Stix, 2018). For example, the share of online banking users is 83% among Austrians aged between 14 and 35 years, 49% among persons aged between 51 and 65 years and 14% among persons aged 66 years or older. To better understand and assess the demand for physical banking services, it would be interesting to complement the detailed geographical information presented in this study with further information on the use of digital banking and payment products in rural areas and across socio-demographic groups, which could be obtained, e.g., from population surveys. Moreover, it would be interesting to study the factors affecting banks’ location decisions and how socioeconomic characteristics of municipalities (e.g. the age structure and economic profile of a municipality) affect the decision to close branches (see Beckmann et al., 2018).
Second, results from OeNB surveys of spring 2018 and fall 2019 show that a very high share of Austrians is satisfied with access to their bank branch (48% of Austrians aged 14 years or older are very satisfied and a further 41% are satisfied). Interestingly, satisfaction is higher among residents of rural areas, who, on average, face considerably larger physical distances than among residents of urban areas. These survey results indicate that, on average, and if distances are not too long, the physical distance to a bank branch might not be of prime importance to bank clients. For example, a distance between 2 km and 5 km might be inconsequential if a trip to a bank branch is combined with another purpose. This notwithstanding, we find some evidence that (increases in) distances matter for bank clients’ satisfaction, which is 14 percentage points lower in municipalities where the last branch closed in the years since 2015 than in municipalities that still have a branch.16 We find higher travel distances for the 3% of Austrians who are very unsatisfied with the reachability of their bank branch.
In this context, it would be interesting to develop a framework that allows us to define threshold distances for “good” access and incorporates information on the
15 OeNB survey results. For a description, see Ritzberger-Grünwald and Stix (2018). The most recent results refer to a survey conducted in summer 2020 (unpublished).
16 These results are based on a regression controlling for age, employment status, household income, provinces and the use of online banking.

The Austrian bank branch network from 2000 to 2019 from a spatial perspective
FINANCIAL STABILITY REPORT 40 – NOVEMBER 2020 99
demand for physical banking services. Information about the age structure of the population, the availability of public transport, the use of digital banking channels, the availability of high-speed internet, etc. could provide some evidence in this direction. Furthermore, it would be interesting to study whether a change in the travel distance, i.e. the closure of the last bank branch, affects the behavior of bank clients, e.g. whether demand for bank products is affected.
Third, given the important role of cash for society, many central banks aim for an efficient and dense supply of cash withdrawal facilities. Assessing the quality of access to cash withdrawal facilities thus requires a view beyond bank branches that also includes ATMs. This issue has been analyzed in a separate paper (Stix, 2020), whose results show that travel distances to ATMs are lower than for bank branches, which is not surprising given that there were 9,058 ATMs in operation as of end 2019, as opposed to 3,927 retail bank branch addresses. 82% of the Austrian population have an ATM within 2 km and 97% have an ATM within 5 km of their homes. The average distance to ATMs is 1.2 km and the median distance is 0.6 km (50% of the Austrian population have to travel less far).
Finally, we note that while this paper provides only a descriptive account of the spatial distribution of the bank branch network, the results could be used for more elaborate analyses, for example to determine the location choices of banks and the degree of local bank competition (compare, e.g., Basten and Ongena, 2019; Chen and Strathearn, 2020), the effect of local banking conditions on firms (e.g. Baumgartner et al., 2020) or their consequences for payment choice and cash demand (Huynh et al., 2014).
ReferencesBanque de France. 2019. État des lieux de l’accès du public aux espèces en France métropolit-
aine, https://www.banque-france.fr/sites/default/files/media/2019/07/23/rapport_-_acces_au_public_aux_especes_en_france_metropolitaine_-_23072019.pdf
Basten, C. and S. Ongena. 2019. The Geography of Mortgage Lending in Times of FinTech. Swiss Finance Institute Research Paper No. 19-39.
Baumgartner, S., A. Stomper, T. Schober and R. Winter-Ebmer. 2020. Bank Equity, Risk, and Small-Firm Employment: Evidence from Firms Affected by Climate Change. Paper presented at the Annual Meeting of the Austrian Economic Association. January.
Beckmann, E., S. Reiter and H. Stix. 2018. A geographic perspective on banking in Central, Eastern and Southeastern Europe. In: Focus on European Economic Integration Q1/18. OeNB. 7–28.
BEV – Bundesamt für Eich- und Vermessungswesen. 2019. Address Register – Relational Table – Reference Date Data (© Österreichisches Adressregister, data of the record date April 1, 2019). http://www.bev.gv.at/portal/page?_pageid=713,2601271&_dad=portal&_schema=-PORTAL
Chen, H. and M. Strathearn. 2020. A Spatial Model of Bank Branches in Canada. In: Bank of Canada Staff Working Paper 2020-4.
Delaney, L., A. O’Hara and R. Finlay. 2019. Cash Withdrawal Symptoms. In: Reserve Bank of Australia Bulletin June. https://www.rba.gov.au/publications/bulletin/2019/jun/cash-withdrawn-al-symptoms.html
Deutsche Bundesbank. 2020. Cash withdrawals and payments in urban and rural areas. In: Monthly Report June. 33–44.
European Commission. 2020. Retail Payments Strategy. https://ec.europa.eu/finance/docs/law/200924-retail-payments-strategy_en.pdf

The Austrian bank branch network from 2000 to 2019 from a spatial perspective
100 OESTERREICHISCHE NATIONALBANK
Huynh, K., P. Schmidt-Dengler and H. Stix. 2014. The Role of Card Acceptance in the Transaction Demand for Money. Working Paper No. 196. OeNB.
Jiménez Gonzalo, C. and H. Tejero Sala. 2018. Bank branch closure and cash access in Spain. In: Banco de España Financial Stability Review. Issue 34. https://www.bde.es/f/webbde/GAP/Secl-ciones/Publicaciones/InformesBoletinesRevistas/RevistaEstabilidadFinanciera/18/MAYO/Articulo_Jimenez_Tejero_en.pdf
NFPS (National Forum on the Payment System). 2017. Interim report for 2017 on accessibility of ATMs and cash deposit facilities in the Netherlands. https://www.dnb.nl/en/binaries/Interim%20report%20for%202017%20on%20accessibility%20of%20ATMs%20and%20cash%20deposit%20fa-cilities%20in%20the%20Netherlands_tcm47-369712.pdf
Ritzberger-Grünwald, D. and H. Stix. 2018. How Austrians bank and pay in an increasingly digitalized world – results from an OeNB survey. In: Monetary Policy & the Economy, Q3/18. OeNB. 52–89.
Sonea, A., W. Guo and S. Jarvis. 2019. An exploratory spatial analysis of access to physical and digital retail banking channels in the UK. Technical report (https://www.thinkforwardinitiative.com/research/exploratory-spatial-analysis-of-access-to-physical-and-digital-retail-banking-chan-nels-in-the-uk).
Sokol, M. 2017. Financialisation, financial chains and uneven geographical development in Europe: Towards a research agenda. In: Research in International Business and Finance (RIBAF) 39(B). 678–685.
SOU. 2018. Tryggad tillgång till kontanter (Interim report on cash – Secure access to cash), SOU 2018:42 (https://www.regeringen.se/49cf6d/contentassets/79026c9e608946bdbfa60067ddae0c0d/tryggad-tillgang-till-kontanter-sou-201842.pdf).
Stix, H. 2020. A spatial analysis of access to ATMs in Austria. In: Monetary Policy & the Economy Q3/20. OeNB. Forthcoming.
Annex Data sources
We have made use of the following data sources: • Bank addresses: Oesterreichische Natio nalbank (https://www.oenb.at/Statistik/
Klassifikationen/Bankstellenverzeichnis.html)• Municipality boundaries: Classification of Austria by municipalities, historicized
since 2011 (“Gliederung Österreichs in Gemeinden, historisiert seit 2011”) by Statistics Austria (http://data.statistik.gv.at/web/meta.jsp?dataset=OGDEXT_GEM_1). These data are provided under CC BY 4.0 (https://creativecommons.org/licenses/by/4.0/).
• Population by grid cells: Statistics Austria.
Computation of routes
In the following, we provide a very brief description of the computation of routes. A more detailed account is provided in the paper analyzing access to ATMs (Stix, 2020).
The computation of routes is based on a network analysis of a geographical information system which allows to compute travel distances with varying modes of transport. To account for the differences in how people move in cities and in rural areas, travel times and distances were calculated both for walking and driving. For each transport mode, the network analysis was conducted on the basis of the fastest route. It should be noted that the fastest route is not always the shortest

The Austrian bank branch network from 2000 to 2019 from a spatial perspective
FINANCIAL STABILITY REPORT 40 – NOVEMBER 2020 101
route, in particular when driving by car. For each starting address, the route to the nearest bank branch has been computed.
The distances that are reported in this paper always refer to the shortest driving or walking distance.
The starting points for route calculations are taken from a 100 m by 100 m geographical grid of Austria. Specifically, we used the midpoints of those 580,995 grid cells of 100 m by 100 m which were populated on January 1, 2019 (main residence). The network analysis was carried out by an external GIS company, which used the street graph from TomTom (©).
For each grid cell we observe the number of persons who had their main residence in this cell on January 1, 2019 (in total 8,858,775 inhabitants). This allows us to compute population-weighted summary statistics for different levels of agglomerations (like municipalities or Austrian provinces).

Annex: Key financial indicators

104 OESTERREICHISCHE NATIONALBANK
International financial markets Table
Short-term interest rates A1
Long-term interest rates A2
Stock indices A3
Corporate bond spreads A4
Austrian corporate and household sectors
Financial investment of households A5
Household income and savings A6
Financing of nonfinancial corporations A7
Insolvency indicators A8
Housing market indicators A9
Austrian financial intermediaries
Structural indicators A10
Total assets A11
Sectoral distribution of loans to domestic nonbanks A12
Loan quality A13
Exposure to CESEE A14
Profitability on a consolidated basis A15
Profitability of Austrian banks’ CESEE subsidiaries A16
Solvency on a consolidated basis A17
Market indicators of selected Austrian financial institutions A18
Key indicators of Austrian insurance companies A19
Assets held by Austrian mutual funds A20
Structure and profitability of Austrian fund management companies A21
Assets held by Austrian pension funds A22
Assets held by Austrian severance funds A23
Transactions and system disturbances in payment and securities settlement systems A24
Cutoff date for data: November 5, 2020
Conventions used:
x = no data can be indicated for technical reasons.
.. = data not available at the reporting date.
Revisions of data published in earlier volumes are not indicated.
Discrepancies may arise from rounding.
Annex: Key financial indicators

Annex: Key financial indicators
FINANCIAL STABILITY REPORT 40 – NOVEMBER 2020 105
International financial markets
Table A1
Short-term interest rates1
2014 2015 2016 2017 2018 2019 H1 19 H1 20
Three-month rate, period average, %
Euro area 0.21 –0.02 –0.26 –0.33 –0.32 –0.36 –0.31 –0.35U.S.A. 0.23 0.32 0.74 1.26 2.31 2.33 2.60 1.07Japan 0.21 0.17 0.08 0.06 0.07 0.07 0.07 0.07United Kingdom 0.54 0.57 0.50 0.36 0.72 0.81 0.84 0.53Switzerland 0.01 –0.75 –0.75 –0.73 –0.73 –0.74 –0.71 –0.67Czech Republic 0.36 0.31 0.29 0.41 1.27 2.12 2.07 1.38Hungary 2.41 1.61 0.99 0.14 0.12 0.19 0.16 0.69Poland 2.52 1.75 1.70 1.73 1.71 1.72 1.72 1.11
Source: Bloomberg, Eurostat, Macrobond.1 Average rate at which prime banks are willing to lend funds to other prime banks for three months.
Table A2
Long-term interest rates1
2014 2015 2016 2017 2018 2019 H1 19 H1 20
Ten-year rates, period average, %
Euro area 2.28 1.27 0.93 1.17 1.27 0.59 0.95 0.37U.S.A. 2.63 2.14 1.83 2.32 2.81 2.33 2.49 1.03Japan 0.58 0.37 –0.01 0.04 0.06 –0.08 –0.06 –0.02United Kingdom 2.14 1.79 1.22 1.18 1.41 0.88 1.11 0.40Switzerland 0.85 0.05 –0.36 –0.09 0.03 –0.43 –0.29 –0.52Austria 1.49 0.75 0.38 0.58 0.69 0.06 0.31 –0.10Czech Republic 1.58 0.58 0.43 0.98 1.98 1.55 1.78 1.24Hungary 4.81 3.43 3.14 2.96 3.06 2.47 2.94 2.22Poland 3.52 2.70 3.04 3.42 3.20 2.35 2.68 1.70
Source: ECB, Eurostat, Macrobond.1 Yields of long-term government bonds.
Table A3
Stock indices
2014 2015 2016 2017 2018 2019 H1 19 H1 20
Annual change in %, period average
Euro area: EURO STOXX 13.07 11.76 –9.67 17.16 –0.48 –0.37 –5.87 –3.23U.S.A.: S&P 500 17.49 6.71 1.63 16.92 12.13 6.09 3.13 6.79Japan: Nikkei 225 13.84 24.21 –11.90 19.41 10.44 –2.77 –5.03 0.39United Kingdom: FTSE100 3.23 –1.38 –1.74 13.96 –0.21 –1.17 –3.25 –10.77Switzerland: SMI 9.28 4.23 –10.12 10.91 –0.16 9.56 5.50 6.25Austria: ATX –2.36 1.28 –5.42 34.83 7.56 –8.95 –12.44 –16.95Czech Republic: PX 50 1.62 0.81 –11.49 14.29 7.88 –2.91 –4.56 –10.28Hungary: BUX –3.89 17.28 28.94 31.55 5.55 10.10 8.24 –6.90Poland: WIG 8.07 –0.31 –9.83 30.01 –2.67 –1.25 –2.28 –16.49
Source: Macrobond.
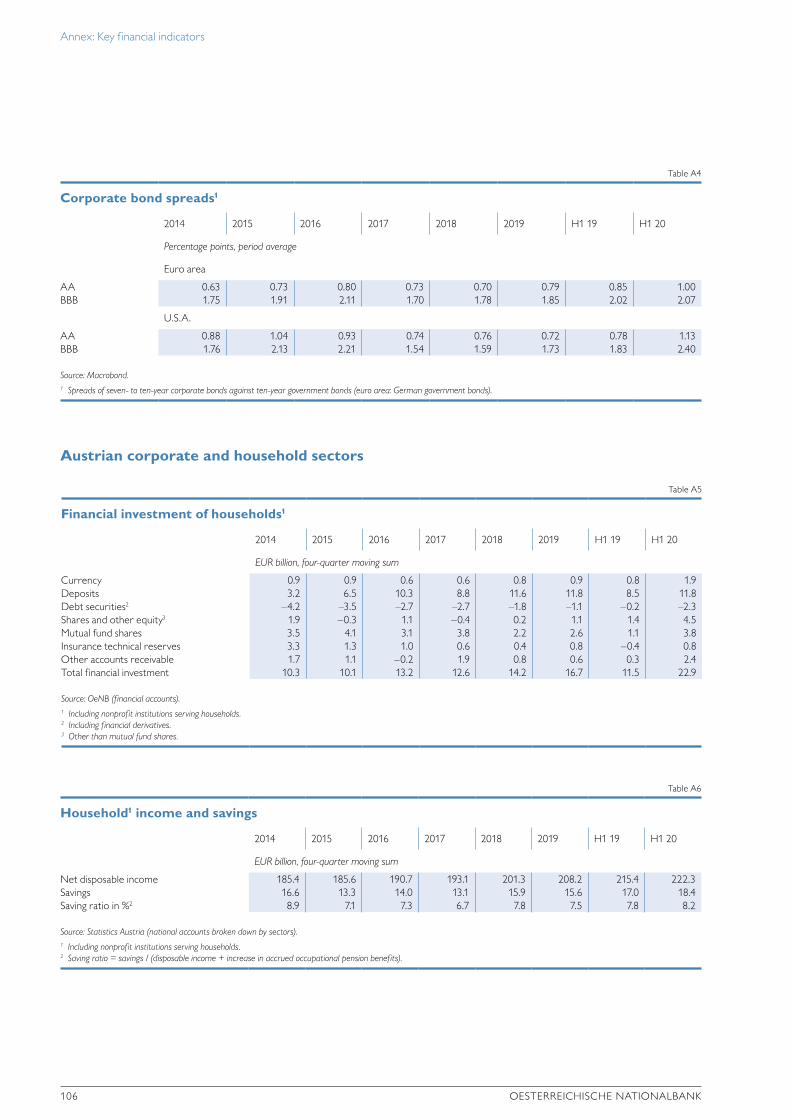
Annex: Key financial indicators
106 OESTERREICHISCHE NATIONALBANK
Austrian corporate and household sectors
Table A4
Corporate bond spreads1
2014 2015 2016 2017 2018 2019 H1 19 H1 20
Percentage points, period average
Euro area
AA 0.63 0.73 0.80 0.73 0.70 0.79 0.85 1.00BBB 1.75 1.91 2.11 1.70 1.78 1.85 2.02 2.07
U.S.A.
AA 0.88 1.04 0.93 0.74 0.76 0.72 0.78 1.13BBB 1.76 2.13 2.21 1.54 1.59 1.73 1.83 2.40
Source: Macrobond.1 Spreads of seven- to ten-year corporate bonds against ten-year government bonds (euro area: German government bonds).
Table A5
Financial investment of households1
2014 2015 2016 2017 2018 2019 H1 19 H1 20
EUR billion, four-quarter moving sum
Currency 0.9 0.9 0.6 0.6 0.8 0.9 0.8 1.9Deposits 3.2 6.5 10.3 8.8 11.6 11.8 8.5 11.8Debt securities2 –4.2 –3.5 –2.7 –2.7 –1.8 –1.1 –0.2 –2.3Shares and other equity3 1.9 –0.3 1.1 –0.4 0.2 1.1 1.4 4.5Mutual fund shares 3.5 4.1 3.1 3.8 2.2 2.6 1.1 3.8Insurance technical reserves 3.3 1.3 1.0 0.6 0.4 0.8 –0.4 0.8Other accounts receivable 1.7 1.1 –0.2 1.9 0.8 0.6 0.3 2.4Total financial investment 10.3 10.1 13.2 12.6 14.2 16.7 11.5 22.9
Source: OeNB (financial accounts).1 Including nonprofit institutions serving households.2 Including financial derivatives.3 Other than mutual fund shares.
Table A6
Household1 income and savings
2014 2015 2016 2017 2018 2019 H1 19 H1 20
EUR billion, four-quarter moving sum
Net disposable income 185.4 185.6 190.7 193.1 201.3 208.2 215.4 222.3Savings 16.6 13.3 14.0 13.1 15.9 15.6 17.0 18.4Saving ratio in %2 8.9 7.1 7.3 6.7 7.8 7.5 7.8 8.2
Source: Statistics Austria (national accounts broken down by sectors).1 Including nonprofit institutions serving households.2 Saving ratio = savings / (disposable income + increase in accrued occupational pension benefits).

Annex: Key financial indicators
FINANCIAL STABILITY REPORT 40 – NOVEMBER 2020 107
Table A7
Financing of nonfinancial corporations
2014 2015 2016 2017 2018 2019 H1 19 H1 20
EUR billion, four-quarter moving sum
Debt securities1 –0.7 0.0 0.7 –1.9 –1.5 –1.2 1.3 –0.3Loans 3.3 5.7 14.1 15.6 16.1 15.5 15.9 18.2Shares and other equity 4.1 2.5 2.8 12.5 –0.7 2.0 1.4 –1.0Other accounts payable 2.9 4.5 5.6 0.7 7.3 1.7 7.1 1.7Total external financing 9.6 12.7 23.2 26.9 21.2 18.0 25.7 18.6
Source: OeNB (financial accounts).1 Including financial derivatives.
Table A8
Insolvency indicators
2014 2015 2016 2017 2018 2019 H1 19 H1 20
Estimated default liabilities (opened insolvency proceedings, EUR million) 2,899 2,430 2,867 1,863 2,071 1,697 864 1,605Opened insolvency proceedings (number) 3,275 3,115 3,163 3,025 2,985 3,044 1,529 1,097Dismissed applications for insolvency proceedings (number) 2,148 2,035 2,063 2,054 1,995 1,974 1,032 831Total insolvencies (number) 5,423 5,150 5,226 5,079 4,980 5,018 2,561 1,928
Source: Kreditschutzverband von 1870.
Table A9
Housing market indicators
2012 2013 2014 2015 2016 2017 2018 2019
Residential property price index (2000=100)
Vienna 180.7 196.3 204.6 209.2 217.2 220.4 232.0 243.2Austria 149.1 156.0 161.4 168.1 180.4 187.2 200.1 208.0Austria excluding Vienna 137.4 141.1 145.4 152.9 166.7 174.9 189.8 194.8
Rent prices1 (2015=100)
Rents of apartments, excluding utilities (as measured in the CPI) 89.4 92.2 95.8 100.0 103.1 107.4 111.4 114.7
OeNB fundamentals indicator for residential property prices2
Vienna 10.0 13.9 14.5 14.6 15.5 17.2 19.5 20.8Austria –1.0 –2.1 –2.2 –0.3 3.9 8.1 11.5 11.8
Source: OeNB, Vienna University of Technology (TU Wien).1 Free and regulated rents.2 Deviation from fundamental price in %.

Annex: Key financial indicators
108 OESTERREICHISCHE NATIONALBANK
Austrian financial intermediaries1
1 The OeNB’s financial indicators relate to all banks operating in Austria. For this reason, some of the figures presented here may deviate from the Financial Soundness Indicators published by the IMF.
Table A10
Structual indicators
2014 2015 2016 2017 2018 2019 H1 19 H1 20
End of period
Number of banks in Austria 764 738 672 628 597 573 592 572Number of bank branches 4,255 4,096 3,926 3,775 3,639 3,521 3,561 3,182Number of foreign subsidiaries 85 83 60 58 55 53 42 53Number of branches abroad 200 207 209 215 219 229 225 231Number of employees1 75,714 75,034 74,543 73,712 73,508 73,203 73,469 73,122
Source: OeNB.1 Number of persons, including part-time employees, employees on leave or military service, excluding blue-collar workers.
Table A11
Total assets
2014 2015 2016 2017 2018 2019 H1 19 H1 20
End of period, EUR million
Total assets on an unconsolidated basis 896,424 859,165 832,267 815,275 854,582 884,964 875,052 952,707Total assets on a consolidated basis 1,078,155 1,056,705 946,342 948,861 985,981 1,032,285 1,018,964 1,107,021Total assets of CESEE subsidiaries1 285,675 295,557 184,966 205,532 206,582 222,947 216,931 231,468
Source: OeNB.1 The transfer in ownership of UniCredit Bank Austria AG’s CESEE subsidiaries to the Italian UniCredit Group limits the comparability of f igures as from end-2016.
Table A12
Sectoral distribution of domestic loans to nonbanks
All currencies combined
2014 2015 2016 2017 2018 2019 H1 19 H1 20
End of period, EUR million
Nonbanks 328,230 333,743 335,644 341,149 355,869 371,790 363,507 380,376of which: nonfinancial corporations 136,600 137,151 135,569 143,758 153,028 162,905 159,019 168,551
households1 140,944 146,444 152,516 156,386 161,947 168,824 164,626 170,777general government 28,108 28,034 27,681 24,443 24,562 23,576 23,835 24,571other financial intermediaries 22,578 22,114 19,878 16,562 16,332 16,485 16,027 16,477
Foreign currencyNonbanks 36,289 33,948 30,088 22,182 20,564 19,618 20,189 18,722of which: nonfinancial corporations 6,379 5,291 4,296 3,397 3,538 3,321 3,504 3,143
households1 25,374 24,423 21,224 16,486 14,993 13,590 14,272 12,816general government 2,777 2,861 2,623 943 517 471 493 459other financial intermediaries 1,759 1,373 1,945 1,356 1,516 2,236 1,920 2,304
Source: OeNB.1 Including nonprofit institutions serving households.
Note: Figures are based on monetary statistics.
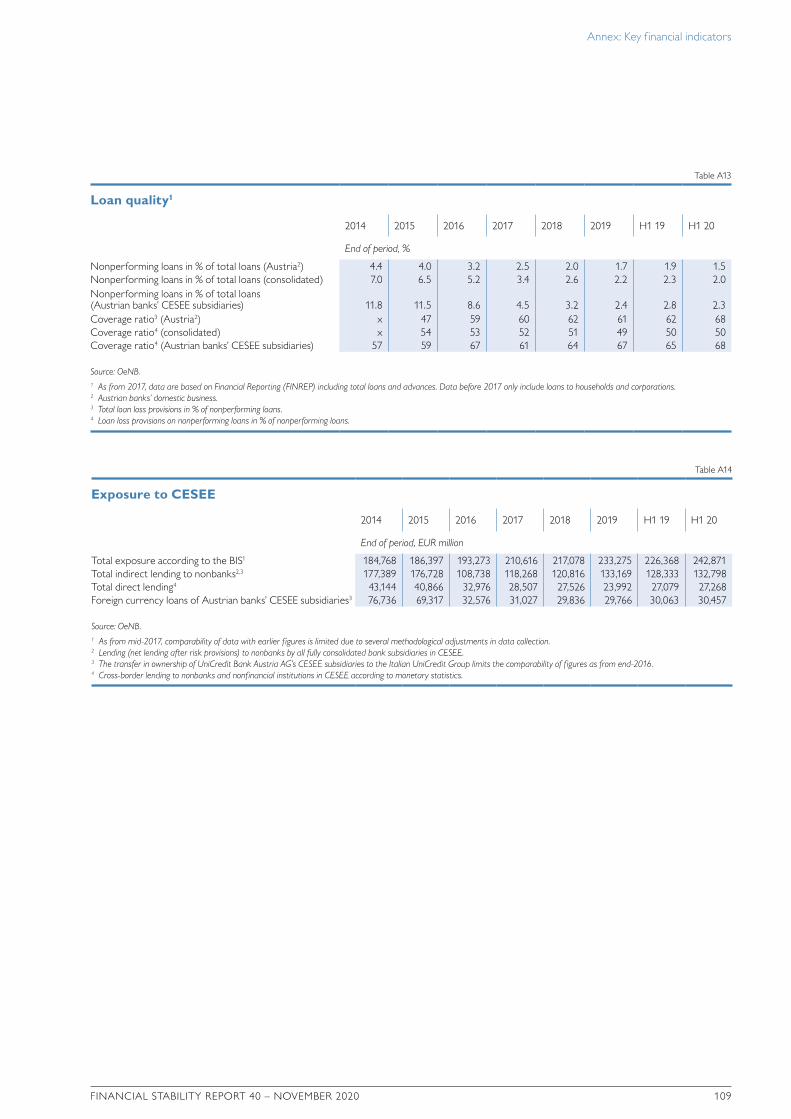
Annex: Key financial indicators
FINANCIAL STABILITY REPORT 40 – NOVEMBER 2020 109
Table A13
Loan quality1
2014 2015 2016 2017 2018 2019 H1 19 H1 20
End of period, %
Nonperforming loans in % of total loans (Austria2) 4.4 4.0 3.2 2.5 2.0 1.7 1.9 1.5Nonperforming loans in % of total loans (consolidated) 7.0 6.5 5.2 3.4 2.6 2.2 2.3 2.0Nonperforming loans in % of total loans (Austrian banks’ CESEE subsidiaries) 11.8 11.5 8.6 4.5 3.2 2.4 2.8 2.3Coverage ratio3 (Austria2) x 47 59 60 62 61 62 68Coverage ratio4 (consolidated) x 54 53 52 51 49 50 50Coverage ratio4 (Austrian banks’ CESEE subsidiaries) 57 59 67 61 64 67 65 68
Source: OeNB.1 As from 2017, data are based on Financial Reporting (FINREP) including total loans and advances. Data before 2017 only include loans to households and corporations.2 Austrian banks’ domestic business.3 Total loan loss provisions in % of nonperforming loans.4 Loan loss provisions on nonperforming loans in % of nonperforming loans.
Table A14
Exposure to CESEE
2014 2015 2016 2017 2018 2019 H1 19 H1 20
End of period, EUR million
Total exposure according to the BIS1 184,768 186,397 193,273 210,616 217,078 233,275 226,368 242,871Total indirect lending to nonbanks2,3 177,389 176,728 108,738 118,268 120,816 133,169 128,333 132,798Total direct lending4 43,144 40,866 32,976 28,507 27,526 23,992 27,079 27,268Foreign currency loans of Austrian banks’ CESEE subsidiaries3 76,736 69,317 32,576 31,027 29,836 29,766 30,063 30,457
Source: OeNB.1 As from mid-2017, comparability of data with earlier f igures is limited due to several methodological adjustments in data collection.2 Lending (net lending after risk provisions) to nonbanks by all fully consolidated bank subsidiaries in CESEE.3 The transfer in ownership of UniCredit Bank Austria AG’s CESEE subsidiaries to the Italian UniCredit Group limits the comparability of f igures as from end-2016.4 Cross-border lending to nonbanks and nonfinancial institutions in CESEE according to monetary statistics.

Annex: Key financial indicators
110 OESTERREICHISCHE NATIONALBANK
Table A15
Profitability on a consolidated basis1
2014 2015 2016 2017 2018 2019 H1 19 H1 20
End of period, EUR million
Operating income 28,717 28,064 22,408 22,837 24,023 24,997 12,097 11,815of which: net interest income 19,345 18,336 14,604 14,536 15,210 15,589 7,681 7,824
fee and commission income 7,741 7,730 6,562 6,885 7,097 7,226 3,494 3,487trading income 426 –50 110 95 –628 –292 –239 276
Operating expenses 19,833 17,612 16,687 14,752 15,661 16,732 7,902 8,541of which: staff costs 9,543 8,959 8,774 8,415 8,602 8,740 4,224 4,246
other administrative expenses 6,569 6,830 5,820 5,571 5,630 5,673 2,859 2,501
Operating profit/loss 8,884 10,452 5,723 8,087 8,361 8,264 4,194 3,273Risk provisioning 6,807 4,655 1,192 1,049 438 960 93 1,768Net profit after taxes 685 5,244 4,979 6,577 6,916 6,713 3,521 887
%
Return on average (total) assets2 0.0 0.5 0.6 0.8 0.8 0.7 0.8 0.2Return on average equity (tier 1 capital)2 0.7 8.5 8.3 10.5 10.3 9.4 10.2 2.5Net interest income to operating income 67 65 65 64 63 62 63 66Cost-to-income ratio 69 63 74 65 65 67 65 72Risk provisioning to operating profit 77 45 21 13 5 12 2 54
Source: OeNB.1 The transfer in ownership of UniCredit Bank Austria AG’s CESEE subsidiaries to the Italian UniCredit Group limits the comparability of f igures as from end-2016.2 Based on profits after tax, but before minority interests.
Table A16
Profitability of Austrian banks’ CESEE subsidiaries1
2014 2015 2016 2017 2018 2019 H1 19 H1 20
End of period, EUR million
Operating income 12,159 12,261 7,753 7,914 7,926 8,442 4,060 4,029of which: net interest income 9,068 8,431 5,135 5,304 5,467 5,827 2,844 2,898
fee and commission income 3,477 3,358 2,184 2,315 2,241 2,393 1,135 1,064trading income –251 642 681 381 145 –37 –131 201
Operating expenses 6,413 6,264 4,084 4,216 4,081 4,390 2,118 2,182of which: staff costs 2,978 2,896 1,956 2,052 2,004 2,126 1,034 1,049
other administrative expenses 2,762 2,752 1,726 1,753 1,672 1,652 795 672
Operating profit/loss 5,746 5,998 3,668 3,698 3,845 4,053 1,942 1,847Risk provisioning 4,037 3,025 720 340 221 472 278 665Net profit after taxes 672 2,050 2,354 2,627 2,913 2,837 1,349 920
%
Return on average (total) assets2 0.2 0.7 1.0 1.3 1.4 1.3 1.3 0.8Net interest income to operating income 75 69 66 67 69 69 70 72Cost-to-income ratio 53 51 53 53 51 52 52 54Risk provisioning to operating profit 70 50 20 9 6 12 14 36
Source: OeNB.1 The transfer in ownership of UniCredit Bank Austria AG’s CESEE subsidiaries to the Italian UniCredit Group limits the comparability of f igures as from end-2016.2 Based on profits after tax.
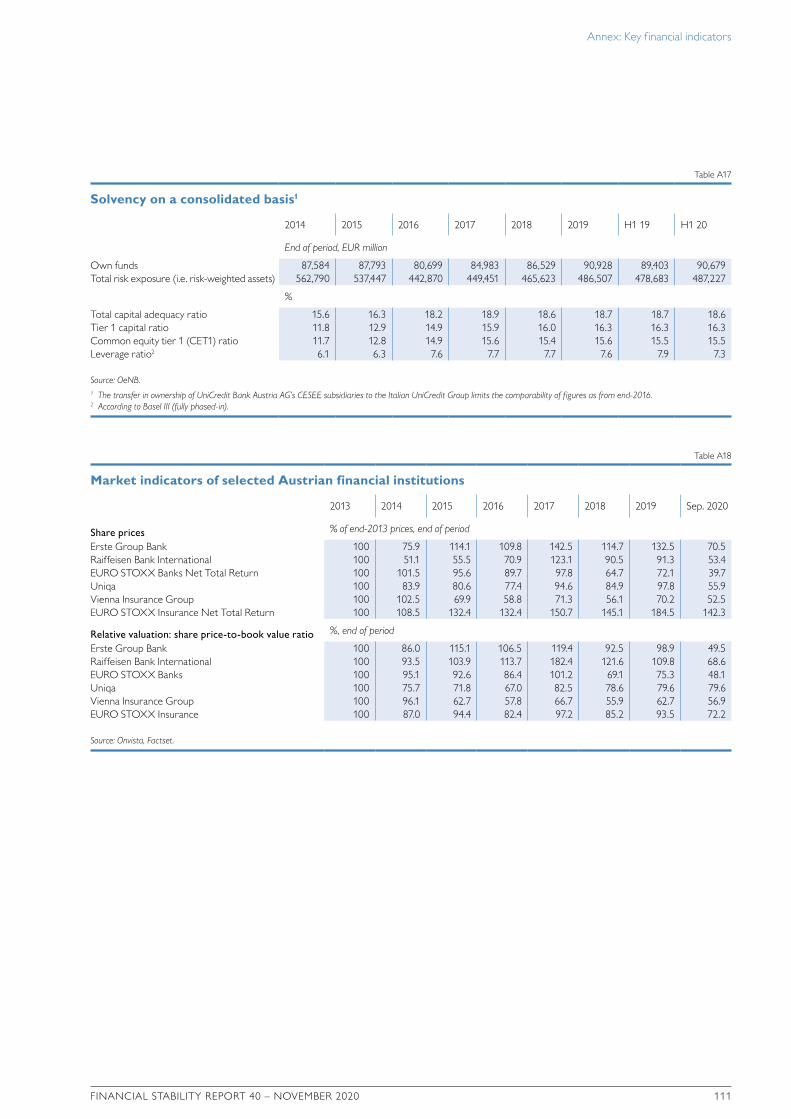
Annex: Key financial indicators
FINANCIAL STABILITY REPORT 40 – NOVEMBER 2020 111
Table A17
Solvency on a consolidated basis1
2014 2015 2016 2017 2018 2019 H1 19 H1 20
End of period, EUR million
Own funds 87,584 87,793 80,699 84,983 86,529 90,928 89,403 90,679Total risk exposure (i.e. risk-weighted assets) 562,790 537,447 442,870 449,451 465,623 486,507 478,683 487,227
%
Total capital adequacy ratio 15.6 16.3 18.2 18.9 18.6 18.7 18.7 18.6Tier 1 capital ratio 11.8 12.9 14.9 15.9 16.0 16.3 16.3 16.3Common equity tier 1 (CET1) ratio 11.7 12.8 14.9 15.6 15.4 15.6 15.5 15.5Leverage ratio2 6.1 6.3 7.6 7.7 7.7 7.6 7.9 7.3
Source: OeNB.1 The transfer in ownership of UniCredit Bank Austria AG’s CESEE subsidiaries to the Italian UniCredit Group limits the comparability of f igures as from end-2016.2 According to Basel III (fully phased-in).
Table A18
Market indicators of selected Austrian financial institutions
2013 2014 2015 2016 2017 2018 2019 Sep. 2020
Share prices % of end-2013 prices, end of period
Erste Group Bank 100 75.9 114.1 109.8 142.5 114.7 132.5 70.5Raiffeisen Bank International 100 51.1 55.5 70.9 123.1 90.5 91.3 53.4EURO STOXX Banks Net Total Return 100 101.5 95.6 89.7 97.8 64.7 72.1 39.7Uniqa 100 83.9 80.6 77.4 94.6 84.9 97.8 55.9Vienna Insurance Group 100 102.5 69.9 58.8 71.3 56.1 70.2 52.5EURO STOXX Insurance Net Total Return 100 108.5 132.4 132.4 150.7 145.1 184.5 142.3
Relative valuation: share price-to-book value ratio %, end of period
Erste Group Bank 100 86.0 115.1 106.5 119.4 92.5 98.9 49.5Raiffeisen Bank International 100 93.5 103.9 113.7 182.4 121.6 109.8 68.6EURO STOXX Banks 100 95.1 92.6 86.4 101.2 69.1 75.3 48.1Uniqa 100 75.7 71.8 67.0 82.5 78.6 79.6 79.6Vienna Insurance Group 100 96.1 62.7 57.8 66.7 55.9 62.7 56.9EURO STOXX Insurance 100 87.0 94.4 82.4 97.2 85.2 93.5 72.2
Source: Onvista, Factset.
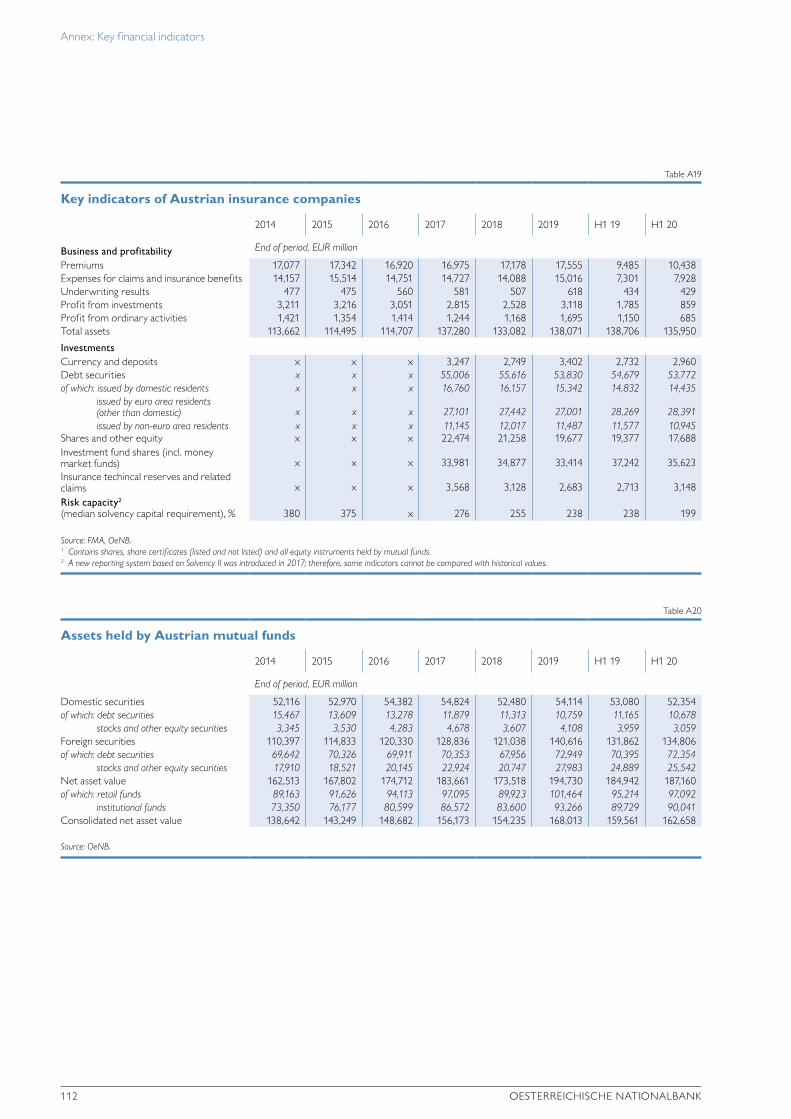
Annex: Key financial indicators
112 OESTERREICHISCHE NATIONALBANK
Table A19
Key indicators of Austrian insurance companies
2014 2015 2016 2017 2018 2019 H1 19 H1 20
Business and profitability End of period, EUR million
Premiums 17,077 17,342 16,920 16,975 17,178 17,555 9,485 10,438Expenses for claims and insurance benefits 14,157 15,514 14,751 14,727 14,088 15,016 7,301 7,928Underwriting results 477 475 560 581 507 618 434 429Profit from investments 3,211 3,216 3,051 2,815 2,528 3,118 1,785 859Profit from ordinary activities 1,421 1,354 1,414 1,244 1,168 1,695 1,150 685Total assets 113,662 114,495 114,707 137,280 133,082 138,071 138,706 135,950
InvestmentsCurrency and deposits x x x 3,247 2,749 3,402 2,732 2,960Debt securities x x x 55,006 55,616 53,830 54,679 53,772of which: issued by domestic residents x x x 16,760 16,157 15,342 14,832 14,435
issued by euro area residents (other than domestic) x x x 27,101 27,442 27,001 28,269 28,391issued by non-euro area residents x x x 11,145 12,017 11,487 11,577 10,945
Shares and other equity x x x 22,474 21,258 19,677 19,377 17,688Investment fund shares (incl. money market funds) x x x 33,981 34,877 33,414 37,242 35,623Insurance techincal reserves and related claims x x x 3,568 3,128 2,683 2,713 3,148Risk capacity2 (median solvency capital requirement), % 380 375 x 276 255 238 238 199
Source: FMA, OeNB.1 Contains shares, share certif icates (listed and not listed) and all equity instruments held by mutual funds.2 A new reporting system based on Solvency II was introduced in 2017; therefore, some indicators cannot be compared with historical values.
Table A20
Assets held by Austrian mutual funds
2014 2015 2016 2017 2018 2019 H1 19 H1 20
End of period, EUR million
Domestic securities 52,116 52,970 54,382 54,824 52,480 54,114 53,080 52,354of which: debt securities 15,467 13,609 13,278 11,879 11,313 10,759 11,165 10,678
stocks and other equity securities 3,345 3,530 4,283 4,678 3,607 4,108 3,959 3,059Foreign securities 110,397 114,833 120,330 128,836 121,038 140,616 131,862 134,806of which: debt securities 69,642 70,326 69,911 70,353 67,956 72,949 70,395 72,354
stocks and other equity securities 17,910 18,521 20,145 22,924 20,747 27,983 24,889 25,542Net asset value 162,513 167,802 174,712 183,661 173,518 194,730 184,942 187,160of which: retail funds 89,163 91,626 94,113 97,095 89,923 101,464 95,214 97,092
institutional funds 73,350 76,177 80,599 86,572 83,600 93,266 89,729 90,041Consolidated net asset value 138,642 143,249 148,682 156,173 154,235 168,013 159,561 162,658
Source: OeNB.

Annex: Key financial indicators
FINANCIAL STABILITY REPORT 40 – NOVEMBER 2020 113
Table A21
Structure and profitability of Austrian fund management companies
2014 2015 2016 2017 2018 2019 H1 19 H1 20
End of period, EUR million
Total assets 725 745 691 674 655 716 633 663Operating profit 158 184 157 177 177 192 87 95Net commissions and fees earned 368 411 402 407 407 433 205 223Administrative expenses1 246 266 284 267 251 260 125 127Number of fund management companies 29 29 29 30 24 21 22 21Number of reported funds 2,118 2,077 2,029 2,020 2,017 1,935 1,988 1,955
Source: OeNB.1 Administrative expenses are calculated as the sum of staff and material expenses.
Table A22
Assets held by Austrian pension funds
2014 2015 2016 2017 2018 2019 H1 19 H1 20
End of period, EUR million
Total assets 19,011 19,646 20,839 22,323 21,494 24,341 23,125 23,213of which: direct investment 1,065 990 835 848 863 769 874 648
mutual funds 17,946 18,656 20,004 21,475 20,631 23,572 22,251 22,565foreign currency (without derivatives) 7,578 7,279 9,169 x 9,149 7,694 11,667 6,906stocks 6,250 6,200 6,972 7,867 7,034 8,317 7,489 7,841debt 9,163 9,552 9,521 9,054 9,724 10,540 10,776 9,617real estate 576 690 754 1,165 978 1,142 1,033 1,209cash and deposits 1,598 1,850 1,863 2,192 1,632 1,711 1,494 1,834
Source: OeNB, FMA.
Table A23
Assets held by Austrian severance funds
2014 2015 2016 2017 2018 2019 H1 19 H1 20
End of period, EUR million
Total direct investment 1,415 1,565 1,682 1,893 2,416 2,621 2,393 2,791of which: euro-denominated 1,299 1,502 1,647 1,847 2,348 2,549 2,322 2,648
foreign currency-denominated x 63 35 46 68 72 71 143accrued income claims from direct investment 15 14 15 13 12 9 14 8
Total indirect investment 5,912 6,741 7,745 8,720 9,674 10,686 10,083 10,722of which: total of euro-denominated investment
in mutual fund shares 5,190 5,790 6,743 7,429 7,989 8,724 8,459 9,046total of foreign currency-denominated investment in mutual fund shares 722 951 1,002 1,291 1,685 1,962 1,624 1,676
Total assets assigned to investment groups 7,306 8,294 9,412 10,597 12,052 13,288 12,432 13,488
Source: OeNB.
Note: Due to special balance sheet operations, total assets assigned to investment groups deviate from the sum of total indirect investments.

Annex: Key financial indicators
114 OESTERREICHISCHE NATIONALBANK
Table A24
Transactions and system disturbances in payment and securities settlement systems
Large-value payment system (domestic, operated by the OeNB)
2014 2015 2016 2017 2018 2019 H1 19 H1 20
Number of transactions in million, value of transactions in EUR billion
Number 1 1 1 1 1 1 1 1 Value 7,438 6,381 4,316 3,690 1,5361 1,412 695 623 System disturbances 0 1 4 0 3 0 0 0
Securities settlement systemsNumber 2 2 2 2 2 2 1 1 Value 377 315 335 7012 658 639 336 400 System disturbances 2 3 3 0 3 1 0 0
Card payment systemsNumber 856 901 963 1,061 1,178 1,299 623 641 Value 91 97 101 108 116 125 58 60 System disturbances 0 2 4 1 2 1 0 1
Participation in international payment systemsNumber 113 144 166 191 217 242 118 135 Value 2,463 2,420 3,029 3,242 3,831 3,304 1,931 1,138 System disturbances 0 0 0 0 0 0 0 0
Source: OeNB.1 Liquidity transfers from participants’ domestic accounts to their own TARGET2 accounts are no longer included under domestic transactions.2 Free-of-payment (FOP) transactions were first included in the value in 2017.