the oenb property market monitor of october 2015 ...c0cfc984-4e40-4b8a-b183-f4055289390a...the oenb...
TRANSCRIPT
The OeNB property market monitor of October 2015: Moderation of residential property prices continued in the second quarter of 2015
Martin Schneider, Karin Wagner, Walter Waschiczek1
In the second quarter of 2015, residential property price growth continued to moderate considerably, coming down to 1.4% year on year in Austria as a whole (Q1 15: 3.5%). At 0.6%, the pace of growth also slowed further in Vienna (Q1 15: 1.1%). According to the OeNB fundamentals indicator for residential property prices, residential property in Vienna was overvalued by 19%. For Austria as a whole, the indicator shows that prices are justified by fundamentals (minor undervaluation by 1% relative to fundamentals). The growth of housing loans to households accelerated slightly over the course of 2015, as the conditions for taking out housing loans remained favorable. The share of foreign currency-denominated loans in total outstanding housing loans stayed high. The outstanding volume of foreign currency loans increased markedly following the decision of the Swiss National Bank in January 2015 to discontinue the minimum exchange rate of CHF 1.20 per euro and the ensuing appreciation of the Swiss franc. While the – by international standards – very high percentage of variable rate loans has recently contracted considerably, the inherent interest rate risk is still substantial.
Residential property price growth continues to moderate The slowdown in the price growth of residential property evident since the
middle of 2014 continued in the first half of 2015. In the second half of 2014, prices in Austria had increased by 2.4% year on
year. The pace of growth picked up slightly to 3.5% in the first quarter of 2015 year on year just to drop to 1.4% in the second quarter of 2015, which translates into quarter-on-quarter growth of 0.3%. In Vienna, property price growth had continually subsided since the fourth quarter of 2013, coming to 0.6% year on year in the second quarter of 2015 (after 1.1% in the first quarter of 2015 year on year). This reflects a further moderation of residential property price growth in Vienna. Quarter on quarter, prices edged up by 0.9% from April to June 2015, following a 1.2% rise in the previous three months.
1 Oesterreichische Nationalbank, Economic Analysis Division, [email protected], [email protected] and [email protected]. The
results presented here do not relate to the appraisal of individual properties, and they should not be interpreted as recommendations for either property purchase or sale.
Price growth continues to slow
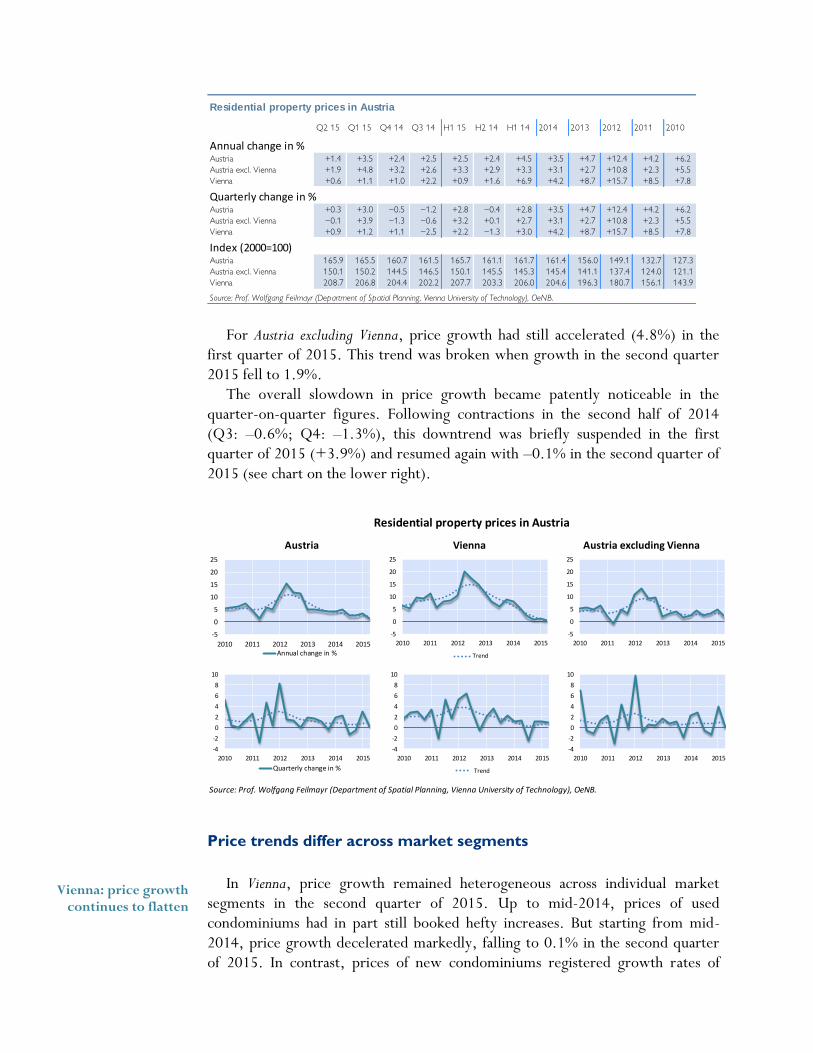
For Austria excluding Vienna, price growth had still accelerated (4.8%) in the
first quarter of 2015. This trend was broken when growth in the second quarter 2015 fell to 1.9%.
The overall slowdown in price growth became patently noticeable in the quarter-on-quarter figures. Following contractions in the second half of 2014 (Q3: –0.6%; Q4: –1.3%), this downtrend was briefly suspended in the first quarter of 2015 (+3.9%) and resumed again with –0.1% in the second quarter of 2015 (see chart on the lower right).
Price trends differ across market segments
In Vienna, price growth remained heterogeneous across individual market segments in the second quarter of 2015. Up to mid-2014, prices of used condominiums had in part still booked hefty increases. But starting from mid-2014, price growth decelerated markedly, falling to 0.1% in the second quarter of 2015. In contrast, prices of new condominiums registered growth rates of
Q2 15 Q1 15 Q4 14 Q3 14 H1 15 H2 14 H1 14 2014 2013 2012 2011 2010
Annual change in %Austria +1.4 +3.5 +2.4 +2.5 +2.5 +2.4 +4.5 +3.5 +4.7 +12.4 +4.2 +6.2 Austria excl. Vienna +1.9 +4.8 +3.2 +2.6 +3.3 +2.9 +3.3 +3.1 +2.7 +10.8 +2.3 +5.5 Vienna +0.6 +1.1 +1.0 +2.2 +0.9 +1.6 +6.9 +4.2 +8.7 +15.7 +8.5 +7.8
Quarterly change in %Austria +0.3 +3.0 –0.5 –1.2 +2.8 –0.4 +2.8 +3.5 +4.7 +12.4 +4.2 +6.2 Austria excl. Vienna –0.1 +3.9 –1.3 –0.6 +3.2 +0.1 +2.7 +3.1 +2.7 +10.8 +2.3 +5.5 Vienna +0.9 +1.2 +1.1 –2.5 +2.2 –1.3 +3.0 +4.2 +8.7 +15.7 +8.5 +7.8
Index (2000=100)Austria 165.9 165.5 160.7 161.5 165.7 161.1 161.7 161.4 156.0 149.1 132.7 127.3Austria excl. Vienna 150.1 150.2 144.5 146.5 150.1 145.5 145.3 145.4 141.1 137.4 124.0 121.1Vienna 208.7 206.8 204.4 202.2 207.7 203.3 206.0 204.6 196.3 180.7 156.1 143.9
Residential property prices in Austria
Source: Prof. Wolfgang Feilmayr (Department of Spatial Planning, Vienna University of Technology), OeNB.
Austria Vienna Austria excluding Vienna
Source: Prof. Wolfgang Feilmayr (Department of Spatial Planning, Vienna University of Technology), OeNB.
Residential property prices in Austria
-5
0
5
10
15
20
25
2010 2011 2012 2013 2014 2015Annual change in %
-5
0
5
10
15
20
25
2010 2011 2012 2013 2014 2015
Trend
-5
0
5
10
15
20
25
2010 2011 2012 2013 2014 2015
-4
-2
0
2
4
6
8
10
2010 2011 2012 2013 2014 2015
Quarterly change in %
-4
-2
0
2
4
6
8
10
2010 2011 2012 2013 2014 2015
Trend
-4
-2
0
2
4
6
8
10
2010 2011 2012 2013 2014 2015
Vienna: price growth continues to flatten
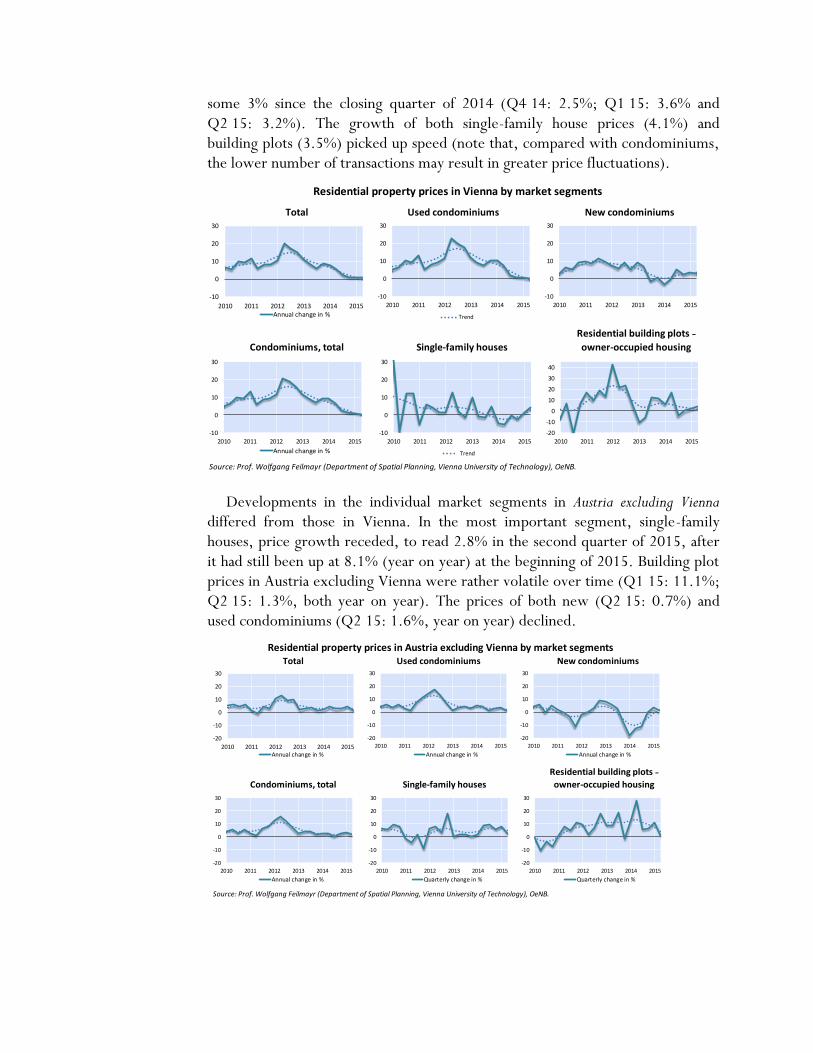
some 3% since the closing quarter of 2014 (Q4 14: 2.5%; Q1 15: 3.6% and Q2 15: 3.2%). The growth of both single-family house prices (4.1%) and building plots (3.5%) picked up speed (note that, compared with condominiums, the lower number of transactions may result in greater price fluctuations).
Developments in the individual market segments in Austria excluding Vienna differed from those in Vienna. In the most important segment, single-family houses, price growth receded, to read 2.8% in the second quarter of 2015, after it had still been up at 8.1% (year on year) at the beginning of 2015. Building plot prices in Austria excluding Vienna were rather volatile over time (Q1 15: 11.1%; Q2 15: 1.3%, both year on year). The prices of both new (Q2 15: 0.7%) and used condominiums (Q2 15: 1.6%, year on year) declined.
Total Used condominiums New condominiums
Condominiums, total Single-family houses
Source: Prof. Wolfgang Feilmayr (Department of Spatial Planning, Vienna University of Technology), OeNB.
Residential property prices in Vienna by market segments
Residential building plots ˗
owner-occupied housing
-10
0
10
20
30
2010 2011 2012 2013 2014 2015Annual change in %
-10
0
10
20
30
2010 2011 2012 2013 2014 2015
Trend
-10
-5
0
5
10
15
20
25
30
Jan-10 Jan-11 Jan-12 Jan-13 Jan-14 Jan-15
Annual change in %
-10
0
10
20
30
2010 2011 2012 2013 2014 2015
Annual change in %
-10
0
10
20
30
2010 2011 2012 2013 2014 2015
Trend
-20
-10
0
10
20
30
40
2010 2011 2012 2013 2014 2015
-10
0
10
20
30
2010 2011 2012 2013 2014 2015
Total Used condominiums New condominiums
Condominiums, total Single-family houses
Source: Prof. Wolfgang Feilmayr (Department of Spatial Planning, Vienna University of Technology), OeNB.
Residential property prices in Austria excluding Vienna by market segments
Residential building plots ˗
owner-occupied housing
-20
-10
0
10
20
30
2010 2011 2012 2013 2014 2015Annual change in %
-20
-10
0
10
20
30
2010 2011 2012 2013 2014 2015
Annual change in %
-10
-5
0
5
10
15
20
25
30
Jan-10 Jan-11 Jan-12 Jan-13 Jan-14 Jan-15
Annual change in %
-20
-10
0
10
20
30
2010 2011 2012 2013 2014 2015
Annual change in %
-20
-10
0
10
20
30
2010 2011 2012 2013 2014 2015
Quarterly change in %
-20
-10
0
10
20
30
2010 2011 2012 2013 2014 2015
Quarterly change in %
-20
-10
0
10
20
30
2010 2011 2012 2013 2014 2015
Annual change in %
Rental yield decreases further

Residential construction continues to go down
Residential construction in Austria continued its tepid growth. With real housing investment having started to contract in the third quarter of 2014, its year-on-year growth rates ran to –3.4% in the first quarter, and to –3.2% in the second quarter of 2015. Weakness in investment dented not only construction, but also economic growth in Austria in general. Output and the number of annual hours worked in construction also point to weak developments in this segment. For the third quarter of 2015, survey results released by the European Commission (“Home improvements over the next 12 months”) signal a further contraction.
The number of real estate transactions is expected to be higher in 2015 (frontloading of home purchases) as property tax increases are due to take effect in 2016. Up to end-June 2015, some 54,000 real estate transactions were registered, which is tantamount to an increase of almost one-third (31%) year on year. Over the same period, 21,500 condominiums were sold. According to data published by RE/MAX and compiled from the land register by IMMOunited, the number of transactions related to condominiums went up by 36%, and the volume of transactions increased by 30.5% in the first half of 2015.
Property prices in Vienna continue to be overvalued by almost 20%
The OeNB’s fundamentals indicator for residential property prices points to a 19% overvaluation for Vienna in the second quarter of 2015. Hence, this indicator lies just below 20% for the fourth quarter in a row. In the second quarter of 2014, the overvaluation had amounted to no less than 22%.
-12
-8
-4
0
4
8
12
2006 2008 2010 2012 2014
Housing investment, real (left-hand scale)
Production index, building construction (left-hand scale)
Annual hours worked, building construction (left-hand scale)
Annual change in % (smoothed)
Residential construction in Austria
Source: Statistics Austria, WIFO, authors' calculations.
-50
-40
-30
-20
-8
-6
-4
-2
0
2
4
1995 2000 2005 2010 2015Housing investment, real (left-hand scale)
Home improvements over the next 12 months (right-handscale)
Balance of positive and negativeresponses
Housing investment
Source: WIFO, European Commission.
Annual change in %
Overvaluation in Vienna declining for the first
time; prices in Austria as a whole in line with
fundamentals
Ongoing decline in residential construction
Number of real estate transactions rises
markedly

-20
-15
-10
-5
0
5
10
15
20
25
1990 1995 2000 2005 2010 2015
Austria including Vienna Vienna
Deviation from fundamentals in %
OeNB fundamentals indicator for residential property prices
Source: OeNB.
For Austria as a whole, the indicator shows that residential property prices are largely in line with fundamentals; in the second quarter of 2015, they were undervalued by a mere 1% relative to fundamentals. The likelihood that a real estate bubble will emerge in Austria is therefore deemed to be rather small.
Housing loans grew at a slightly faster pace
Housing loans to households have expanded somewhat since the beginning of 2015. In August 2015, the annual growth rate of housing loans extended by Austrian monetary financial institutions (adjusted for reclassifications, valuation changes and exchange rate effects) came to 3.6%, up from 3.2% in February 2015. This slight increase was again above all due to long-term loans (i.e. loans with a maturity of more than five years). The growth of housing loans with a medium-term maturity (one to five years), by contrast, contracted.
Source: OeNB, WIFO.
0
2
4
6
8
10
12
2007 2009 2011 2013 2015
Housing loans
To households To domestic nonbanks
Annual change in %
40
60
80
100
0
5
10
15
20
Risk factorsShare of total loans in %
3537735391354063542035434354483546235476354903550435518355333554735561355753558935603356173563135645356603567435688357023571635730357443575835772357873580135815358293584335857358713588535899359143592835942359563597035984359983601236026360413605536069360833609736111361253613936153361683618236196362103622436238362523626636280362953630936323363373635136365363793639336407364223643636450364643647836492365063652036534365493656336577365913660536619366333664736661366763669036704367183673236746367603677436788368033681736831368453685936873368873690136915369303694436958369723698637000370143702837042370573707137085370993711337127371413715537169371843719837212372263724037254372683728237296373113732537339373533736737381373953740937423374383745237466374803749437508375223753637550375653757937593376073762137635376493766337677376923770637720377343774837762377763779037804378193783337847378613787537889379033791737931379463796037974379883800238016380303804438059380733808738101381153812938143381573817138186382003821438228382423825638270382843829838313383273834138355383693838338397384113842538440384543846838482384963851038524385383855238567385813859538609386233863738651386653867938694387083872238736387503876438778387923880638821388353884938863388773889138905389193893338948389623897638990390043901839032390463906039075390893910339117391313914539159391733918739202392163923039244392583927239286393003931439329393433935739371393853939939413394273944139456394703948439498395123952639540395543956839583395973961139625396393965339667396813969539710397243973839752397663978039794398083982239837398513986539879398933990739921399353994939964399783999240006400204003440048400624007640091401054011940133401474016140175401894020340218402324024640260402744028840302403164033040345403594037340387404014041540429404434045740472404864050040514405284054240556405704058440599406134062740641406554066940683406974071140726407404075440768407824079640810408244083840853408674088140895409094092340937409514096540980409944100841022410364105041064410784109241107411214113541149411634117741191412054121941234412484126241276412904130441318413324134641361413754138941403414174143141445414594147341488415024151641530415444155841572415864160041615416294164341657416714168541699417134172741742417564177041784417984181241826418404185441869418834189741911419254193941953419674198141996420104202442038420524206642080420944210842123421374215142165421794219342207422214223542250422644227842292423064232042334423484236242377423914240542419
0
0
0
1
1
1
1
Debt burden of households% of disposable household income
37.000
38.000
39.000
40.000
41.000
42.000
43.000
Mortgage lending rates%
-5
0
5
10
15
2007 2009 2011 2013 2015
Housing loans
To households
To domestic nonbanks
To households (real)
To domestic nonbanks (real)
Annual change in %
40
60
80
100
15
20
25
30
35
40
45
2007 2009 2011 2013 2015
Risk factors
Foreign currency loans (left-hand scale)
New variable-rate loans (right-hand scale)
Share of total loans in %
0
2
4
6
0
10
20
30
40
50
2007 2009 2011 2013 2015
Housing loans (left-hand scale)
Interest expense (right-hand scale)
Debt burden of households% of disposable household income
01234567
2007 2009 2011 2013 2015
Mortgage lending rates
Interest lock-in period of up to 1 year
Interest lock-in period of > 10 years
%
Expansion of housing loans to households driven by long-term
loans
90
100
110
120
130
140
150
160
170
2000 2001 2002 2003 2004 2005 2006 2007 2008 2009 2010 2011 2012 2013 2014
Source: OeNB, Statistics Austria.
Adjusted affordability ratio in Austria
* Driving factor of affordability in the respective period.
falling mortgageinterest rates*
rising mortgageinterest rates*
plunge in mortgageinterest rates*
2000 = 100
rising property prices*
The conditions for taking out housing loans remained favorable. According to the euro area bank lending survey (BLS), banks’ credit standards for housing loans to households were eased somewhat in the second quarter of 2015, after having remained unchanged in the previous quarter.
Credit terms also remained favorable. At 2.03%, the interest on euro-denominated housing loans to households had fallen by 25 basis points in August 2015 year on year. For variable rate loans (i.e. loans with a lock-in period of up to one year), which in the previous 12 months accounted for more than 71% of all newly granted housing loans, the interest rate declined by 27 basis points to 1.98%. The effective annual rate of interest for housing loans, which reflects total borrowing costs (interest rate component and other related charges), had also sunk by 27 basis points to reach 2.47% in August 2015.
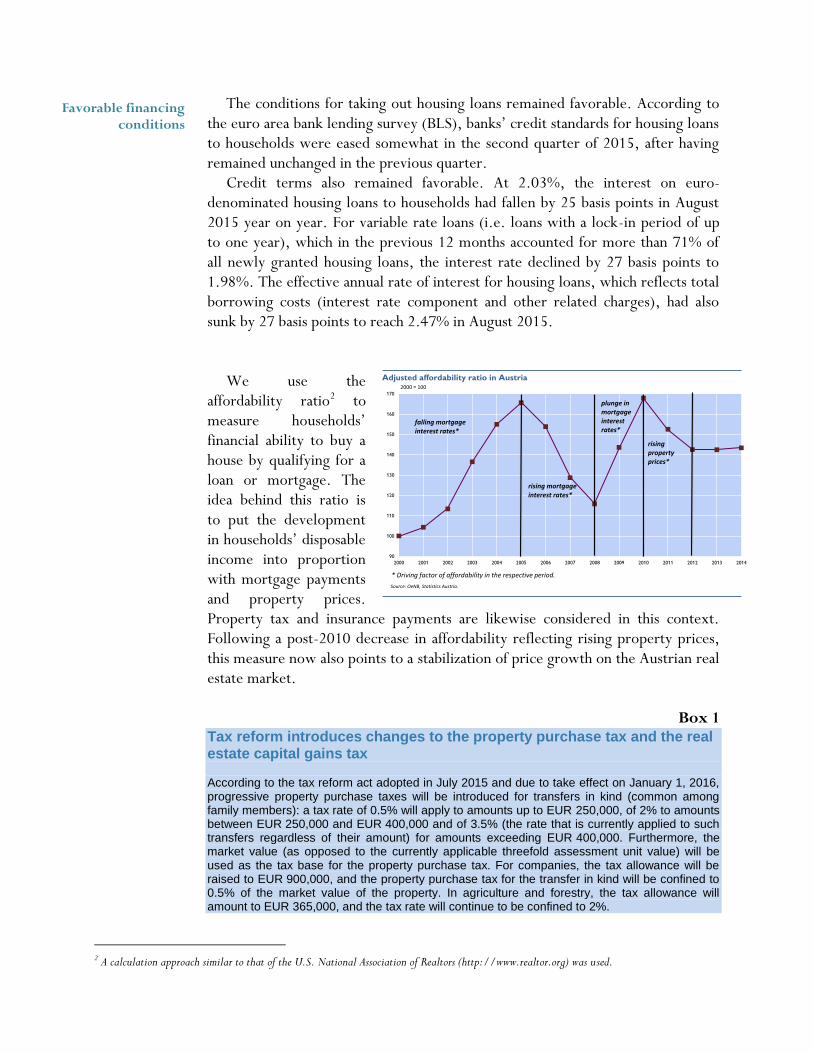
We use the
affordability ratio2 to measure households’ financial ability to buy a house by qualifying for a loan or mortgage. The idea behind this ratio is to put the development in households’ disposable income into proportion with mortgage payments and property prices. Property tax and insurance payments are likewise considered in this context. Following a post-2010 decrease in affordability reflecting rising property prices, this measure now also points to a stabilization of price growth on the Austrian real estate market.
Box 1
Tax reform introduces changes to the property purchase tax and the real estate capital gains tax According to the tax reform act adopted in July 2015 and due to take effect on January 1, 2016, progressive property purchase taxes will be introduced for transfers in kind (common among family members): a tax rate of 0.5% will apply to amounts up to EUR 250,000, of 2% to amounts between EUR 250,000 and EUR 400,000 and of 3.5% (the rate that is currently applied to such transfers regardless of their amount) for amounts exceeding EUR 400,000. Furthermore, the market value (as opposed to the currently applicable threefold assessment unit value) will be used as the tax base for the property purchase tax. For companies, the tax allowance will be raised to EUR 900,000, and the property purchase tax for the transfer in kind will be confined to 0.5% of the market value of the property. In agriculture and forestry, the tax allowance will amount to EUR 365,000, and the tax rate will continue to be confined to 2%.
2 A calculation approach similar to that of the U.S. National Association of Realtors (http://www.realtor.org) was used.
Favorable financing conditions

Further changes relate to the real estate capital gains tax. In line with today’s tax rules, a
special tax rate of 25% applies to income from the sale of property as from April 1, 2012; such income has no effect on the taxation of other income, i.e. it does not result in a change of the tax bracket. This fixed tax rate is as high as the rate applied under the capital gains tax, which means that the tax burden related to asset management is broadly uniform. Property refers to land, buildings and equivalent rights (e.g. building permits) as well as condominiums. For “old property,” i.e. most property purchased before March 31, 2002, only a moderate income tax of 3.5% is applied to the sale proceeds; this corresponds to the property purchase tax charged to the buyer. The real estate capital gains tax is only levied on purchase and sale transactions against payment. Property transfers in kind are exempt from this tax, because such transactions do not involve sale proceeds in return for the property and, hence, do not result in any sales profit. For this reason, gifts and inheritances are exempt from the real estate capital gains tax. The following applies to the sale of private and commercial property (excluding commercial buildings): After ten years following the purchase, “new property,” i.e. property purchased after March 31, 2002, may be marked down by 2% of the sales profit per year (inflation adjustment). This inflation adjustment must not exceed 50% of the sales profit. According to the new tax rules, this special tax rate will be raised from 25% to 30%. This raise will also relate to commercial property sales, and the inflation adjustment will be abolished. (This box is based on information as provided on the websites of www.help.gv.at and the Federal Ministry of Finance).
Household demand for housing loans increased somewhat in the first and
second quarter of 2015 according to banks’ reports in the BLS survey. This was, above all, attributable to the general interest rate level as well as the prospects on the real estate market and the expected residential property prices.
The currency risk inherent in housing loans granted to households continues to be high. The share of foreign currency-denominated housing loans jumped in January 2015 – from 22.1% to 23.9% – on account of the sharp appreciation of the Swiss franc after the Swiss National Bank had decided to discontinue the minimum exchange rate of CHF 1.20 per euro on January 15, 2015. Since then, this share went down again, reaching 21.4% in August. Almost all foreign currency-denominated housing loans outstanding are denominated in Swiss francs (more than 97%).3
At the same time, interest rate risk diminished over the past few months. The share of variable rate loans (with a lock-in period of up to one year) in new loans stood at a 70.6% in the 12 months leading to August 2015 year on year (preceding 12 months: 85.0% year on year). Although housing loans had not been expanding fast in absolute terms until recently, the ratio of housing loans to disposable income went up by 0.6 percentage points year on year in the second quarter of 2015 on the back of very moderate income growth.
Loans for home purchase and improvement granted by Austrian banks to domestic nonbanks increased by 6.5% in the second quarter of 2015 year on year. This relatively marked expansion primarily reflected the strong appreciation of
3 For more details on households’ foreign currency loans, see the following recent OeNB publications: Nicolás Albacete and Peter Lindner, “Foreign currency borrowers in Austria – evidence from the Household Finance and Consumption Survey,” in OeNB Financial Stability Report 29, June 2015, pp. 93–109; as well as the box on “Microsimulation: How exchange rate shocks would affect FX borrowers in Austria” in the same issue, pp. 30–32; and Nicolás Albacete, Doris Ritzberger-Grünwald and Walter Waschiczek, “FX household loans in Austria – a micro view on a macro issue,” to be published in: Bank of Slovenia and CEPR, Conference proceedings of the 1 st Policy Research Conference of the European Central Banking Network, Ljubljana, 1–2 October 2015.
Volume of foreign currency loans (not
adjusted for exchange rate movements)
increased once the Swiss franc had been unpegged
Growth in housing loans to nonbanks remains
unchanged
Loan demand edges up
the Swiss franc. As a result, the volume of foreign currency loans was 2.1% higher than the analogous figure of a year earlier, even though foreign currency loans continued to shrink when adjusted for exchange rate effects. Euro-denominated loans continued to augment markedly (7.6%). Subsidized housing loans edged down by 0.9% from mid-2014 to mid-2015.
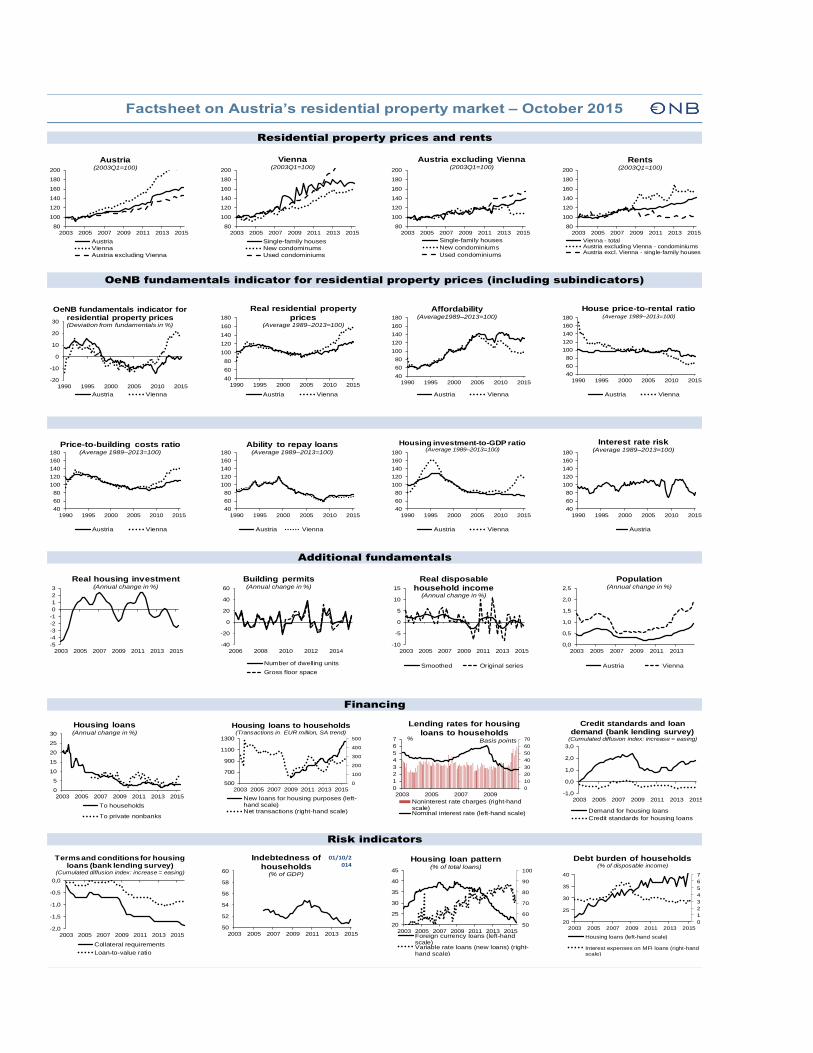
Risk indicators
Factsheet on Austria’s residential property market – October 2015
Residential property prices and rents
OeNB fundamentals indicator for residential property prices (including subindicators)
Additional fundamentals
Financing
-1,0
0,0
1,0
2,0
3,0
2003 2005 2007 2009 2011 2013 2015
Demand for housing loans
Credit standards for housing loans
Credit standards and loan demand (bank lending survey)
(Cumulated diffusion index: increase = easing)
0
5
10
15
20
25
30
2003 2005 2007 2009 2011 2013 2015
Housing loans(Annual change in %)
To households
To private nonbanks
50
60
70
80
90
100
20
25
30
35
40
45
2003 2005 2007 2009 2011 2013 2015
Housing loan pattern(% of total loans)
Foreign currency loans (left-handscale)Variable rate loans (new loans) (right-hand scale)
80
100
120
140
160
180
200
2003 2005 2007 2009 2011 2013 2015
Rents(2003Q1=100)
Vienna - totalAustria excluding Vienna - condominiumsAustria excl. Vienna - single-family houses
0
100
200
300
400
500
500
700
900
1100
1300
2003 2005 2007 2009 2011 2013 2015
New loans for housing purposes (left-hand scale)Net transactions (right-hand scale)
Housing loans to households(Transactions in EUR million, SA trend)
50
52
54
56
58
60
2003 2005 2007 2009 2011 2013 2015
Indebtedness of
households(% of GDP)
01/10/2014
-2,0
-1,5
-1,0
-0,5
0,0
2003 2005 2007 2009 2011 2013 2015
Collateral requirements
Loan-to-value ratio
Termsand conditions for housing loans (bank lending survey)
(Cumulated diffusion index: increase = easing)
-5
-4
-3
-2
-1
0
1
2
3
2003 2005 2007 2009 2011 2013 2015
Real housing investment(Annual change in %)
80
100
120
140
160
180
200
2003 2005 2007 2009 2011 2013 2015
Vienna(2003Q1=100)
Single-family houses
New condominums
Used condominiums
80
100
120
140
160
180
200
2003 2005 2007 2009 2011 2013 2015
Austria excluding Vienna(2003Q1=100)
Single-family houses
New condominiums
Used condominiums
0
1
2
3
4
5
6
7
20
25
30
35
40
2003 2005 2007 2009 2011 2013 2015
Housing loans (left-hand scale)
Interest expenses on MFI loans (right-handscale)
Debt burden of households(% of disposable income)
0
10
20
30
40
50
60
70
0
1
2
3
4
5
6
7
2003 2005 2007 2009
Noninterest rate charges (right-handscale)Nominal interest rate (left-hand scale)
Lending rates for housing
loans to households% Basis points
40
60
80
100
120
140
160
180
1990 1995 2000 2005 2010 2015
Austria Vienna
Price-to-building costs ratio(Average 1989–2013=100)
40
60
80
100
120
140
160
180
1990 1995 2000 2005 2010 2015
Austria Vienna
Housing investment-to-GDP ratio(Average 1989–2013=100)
40
60
80
100
120
140
160
180
1990 1995 2000 2005 2010 2015
Interest rate risk(Average 1989–2013=100)
Austria
-20
-10
0
10
20
30
1990 1995 2000 2005 2010 2015
Austria Vienna
OeNB fundamentals indicator for residential property prices(Deviation from fundamentals in %)
40
60
80
100
120
140
160
180
1990 1995 2000 2005 2010 2015
Real residential property
prices(Average 1989–2013=100)
Austria Vienna
40
60
80
100
120
140
160
180
1990 1995 2000 2005 2010 2015
Austria Vienna
House price-to-rental ratio(Average 1989–2013=100)
40
60
80
100
120
140
160
180
1990 1995 2000 2005 2010 2015
Austria Vienna
Ability to repay loans(Average 1989–2013=100)
40
60
80
100
120
140
160
180
1990 1995 2000 2005 2010 2015
Affordability(Average1989–2013=100)
Austria Vienna
-10
-5
0
5
10
15
2003 2005 2007 2009 2011 2013 2015
Real disposable
household income(Annual change in %)
Smoothed Original series
-40
-20
0
20
40
60
2006 2008 2010 2012 2014
Building permits(Annual change in %)
Number of dwelling units
Gross floor space
0,0
0,5
1,0
1,5
2,0
2,5
2003 2005 2007 2009 2011 2013
Population(Annual change in %)
Austria Vienna
80
100
120
140
160
180
200
2003 2005 2007 2009 2011 2013 2015
Austria(2003Q1=100)
Austria
Vienna
Austria excluding Vienna

2014 2013 July15 June15 May15 2Q15 1Q15 4Q14 3Q14 2014 2013 2012 2011 2010 2009
A Residential property market1 Residential property prices Source Unit Level Annual change in %
1 .1 Sing le- family houses and condominiumsAustria (e) 2000=100 161.4 156.0 . . . 1.4 3.5 2.4 2.5 3.5 4.7 12.4 4.2 6.2 3.9Vienna (e) 2000=100 204.6 196.3 . . . 0.6 1.1 1.0 2.2 4.2 8.7 15.7 8.5 7.8 6.4Austria excluding Vienna (e) 2000=100 145.4 141.1 . . . 1.9 4.8 3.2 2.6 3.1 2.7 10.8 2.3 5.5 2.9
1 .2 CondominiumsVienna – total (e) 2000=100 207.2 197.8 . . . 0.4 1.1 1.2 2.4 4.7 9.1 16.7 9.1 7.6 6.6Vienna – used condominiums (e) 2000=100 214.9 204.2 . . . 0.1 0.8 1.1 2.0 5.2 9.8 18.2 9.0 7.8 7.7Vienna – new condominiums (e) 2000=100 161.9 160.3 . . . 3.2 3.6 2.5 5.1 1.0 3.7 7.0 9.8 5.9 -0.3Austria excluding Vienna – total (e) 2000=100 151.4 148.6 . . . 1.5 3.6 2.2 0.3 1.9 3.3 11.6 4.6 4.7 3.4Austria excluding Vienna – used condominiums (e) 2000=100 157.1 151.8 . . . 1.6 3.6 2.6 1.7 3.5 3.4 12.9 5.9 4.9 3.8Austria excluding Vienna – new condominiums (e) 2000=100 112.4 126.6 . . . 0.7 3.4 -0.8 -11.3 -11.2 2.2 2.2 -3.5 3.8 0.6
1 .3 Sing le- familiy housesVienna (e) 2000=100 170.5 176.3 . . . 4.1 1.2 -2.4 -0.2 -3.3 2.9 3.5 1.4 10.5 3.9Austria excluding Vienna (e) 2000=100 131.4 123.5 . . . 2.8 8.1 5.8 9.2 6.4 1.1 8.7 -3.4 7.5 1.6
1 .4 Res ident ial building p lot sVienna (e) 2000=100 207.1 198.8 . . . 3.5 2.0 0.0 -4.6 4.2 1.3 22.5 14.4 -4.3 9.8Austria excluding Vienna (e) 2000=100 161.0 142.8 . . . 1.3 11.1 6.5 5.7 12.8 8.4 9.3 6.2 -5.4 6.5
1 .5 House Pr ice I ndex (HPI ) of Stat is t ics Aus t r iaNew dwelling (d) 2010=100 123.1 117.4 . . . 5.2 -0.2 3.6 5.1 4.9 4.2 6.3 6.0 . .Existing dwelling (d) 2010=100 124.3 120.4 . . . 4.1 -0.4 4.8 -0.2 3.2 5.4 7.5 6.3 . .Existing houses (d) 2010=100 114.4 113.2 . . . 7.3 3.2 4.0 -3.1 1.1 4.0 4.4 4.3 . .Existing condominiums (d) 2010=100 129.2 124.1 . . . 2.6 -2.1 5.2 0.9 4.1 6.1 9.0 7.3 . .
2 RentsVienna – total (e) 2000=100 134.9 129.5 . . . 6.0 6.9 5.1 5.0 4.2 2.5 4.4 2.8 1.1 -0.4Austria excluding Vienna – condominiums (e) 2000=100 158.9 162.5 . . . -1.6 0.2 -1.6 2.4 -2.2 12.8 -2.8 1.6 0.8 17.9Austria excluding Vienna – single-family houses (e) 2000=100 97.4 95.5 . . . -7.6 1.1 5.5 7.4 2.0 0.9 -2.5 -4.6 0.3 -10.1Rents excluding operating costs (as measured in the CPI) (d) 2000=100 154.3 148.4 +4.0 +4.5 +4.9 4.9 5.0 4.9 4.2 4.0 3.1 4.4 3.3 3.4 4.7
3 Residential and commercial property market transactionsVolume of transactions (b) EUR billion 19.5 16.0 . . . . . . . 21.6 -8.3 6.4 -4.8 5.8 .Number of transactions (b) 1000 96.2 81.4 . . . . . . . 18.1 -12.5 2.4 -3.2 12.7 .
B Fundamentals4 OeNB fundamentals indicator for residential property prices Deviation of residential property prices from fundamentals in %
4 .1 Aus t r ia (g) % -0.9 -0.9 . . . -0.6 -1.1 -2.4 -1.1 -0.9 -0.9 0.2 -5.1 -8.6 -12.2Contributions of subindicators Contribution to total deviation in percentage points
Real residential property prices (g) % points 2.7 2.3 . . . 3.0 3.2 2.5 2.7 2.7 2.3 1.8 0.0 -0.1 -0.9Affordability (g) % points -4.1 -4.2 . . . -4.4 -4.3 -4.6 -4.2 -4.1 -4.2 -4.4 -5.1 -5.4 -5.0House price-to-rental value ratio (g) % points 1.2 0.9 . . . 1.3 1.3 1.1 1.1 1.2 0.9 1.3 -0.1 -0.4 -0.6Price-to-building costs ratio (g) % points 0.8 0.4 . . . 1.0 1.2 0.6 0.8 0.8 0.4 -0.1 -1.9 -2.2 -2.7Ability to repay loans (g) % points 0.0 -0.2 . . . -0.1 -0.1 -0.2 0.0 0.0 -0.2 -0.3 -0.2 -0.7 0.2Housing investment-to-GDP ratio (g) % points 0.7 0.5 . . . 0.6 0.6 0.6 0.6 0.7 0.5 0.2 0.1 -0.1 -0.2Interest rate risk (g) % points -2.1 -0.5 . . . -2.1 -3.0 -2.4 -2.2 -2.1 -0.5 1.8 2.0 0.3 -3.0
Deviation of residential property prices from fundamentals in %4 .2 Vienna (g) % 19.9 18.6 . . . 18.5 18.1 18.1 18.1 19.9 18.6 14.2 5.2 -1.1 -5.1
Contributions of subindicators Contribution to total deviation in percentage pointsReal residential property prices (g) % points 5.7 5.2 . . . 5.9 5.9 5.5 5.5 5.7 5.2 4.0 1.9 1.1 0.2Affordability (g) % points -0.5 -0.7 . . . -0.9 -0.9 -1.0 -0.8 -0.5 -0.7 -1.6 -3.0 -4.0 -3.8House price-to-rental value ratio (g) % points 9.4 9.3 . . . 8.5 8.5 8.8 8.5 9.4 9.3 7.7 5.0 3.7 2.2Price-to-building costs ratio (g) % points 5.6 4.8 . . . 5.6 5.6 5.4 5.2 5.6 4.8 3.2 0.5 -0.7 -1.5Ability to repay loans (g) % points 0.0 -0.3 . . . -0.2 -0.1 -0.2 0.0 0.0 -0.3 -0.4 -0.2 -0.9 0.1Housing investment-to-GDP ratio (g) % points 1.1 0.7 . . . 1.1 1.1 1.1 1.2 1.1 0.7 0.1 -0.3 -0.5 -0.4Interest rate risk (g) % points -1.4 -0.3 . . . -1.3 -2.0 -1.5 -1.4 -1.4 -0.3 1.2 1.3 0.2 -1.9
5 Additional fundamentals5 .1 Supp ly- s ide factor s Annual change in %
Real housing investment (f) EUR billion 12.8 13.0 . . . -2.7 -3.7 -3.6 -2.5 -1.2 -0.1 -1.3 2.9 0.7 -1.6Building permits – dwelling units in new residential buildings (d) 1000 47.8 45.9 . . . 12.0 -13.4 18.7 -1.3 4.1 13.0 -10.5 18.6 1.3 -1.5Building permits – gross floor space of new residential buildings(d) Million m 2 9.3 9.2 . . . 10.4 -6.8 14.0 6.9 1.6 9.0 -10.9 17.3 8.8 -1.3Building prices – residential buildings (d) 2000=100 141.8 138.7 . . . 1.6 1.7 2.2 2.3 2.3 2.4 2.6 2.8 1.8 2.3Building costs – residential buildings (d) 2000=100 146.8 145.1 1.4 1.6 2.0 2.0 1.7 1.5 1.3 1.2 1.9 2.1 2.3 3.2 0.6
5 .2 Demand- s ide factor s Annual change in 1,000 personsPopulation – Austria (d) 1000 66.8 49.4 . . . . . 79.1 69.4 66.8 49.4 36.4 26.3 18.7 21.2Population – Vienna (d) 1000 28.7 26.1 . . . . . 33.8 28.8 28.7 26.1 17.5 12.9 10.9 9.2
Annual change in %Real disposable household income (d) EUR billion 173.3 172.4 . . . -1.6 -2.3 3.0 -2.7 0.5 -2.0 2.0 -0.2 -1.2 -0.3
C Financing and indebtedness of households6 Financing
6 .1 Hous ing loans to households Annual change in %Loan volume (c) 1999M01=100 324.1 314.4 . 3.6 3.5 3.2 3.1 3.1 3.1 3.1 2.4 2.8 3.9 2.6 2.3New loans to households for housing purposes (c) EUR billion 12.3 10.8 . . 27.1 18.5 21.0 17.6 5.5 13.7 1.6 8.1 13.8 11.6 .
6 .2 Hous ing loans to p r ivate nonbanks Annual change in % or share in %Loan volume (c) EUR billion 110.6 106.7 . . . 6.5 6.6 3.6 3.6 3.6 2.2 5.8 4.6 9.4 2.1Share of subsidized loans (c) % 29.4 30.4 . . . 28.0 28.4 29.4 29.9 29.4 30.4 30.9 31.1 31.7 33.9Share of housing loans in banks' total assets (c) % 12.3 11.5 . . . 12.8 12.5 12.3 11.8 12.3 11.5 10.6 9.7 9.6 8.4
6 .3 Lending rates for hous ing loans to households %Total (c) % 2.29 2.39 . 2.03 1.95 2.01 2.05 2.12 2.29 2.29 2.39 2.71 2.86 2.71 3.71Variable rate loans (lock-in period of up to 1 year) (c) % 2.27 2.36 . 1.98 1.90 1.97 2.00 2.09 2.26 2.27 2.36 2.70 2.92 2.69 3.75Effective annual rate of interest (c) % 2.73 2.84 . 2.47 2.43 2.45 2.45 2.53 2.75 2.73 2.84 3.21 3.40 3.14 4.03
6 .4 Hous ing - r e lated aspects of bank funding Annual change in %Housing bonds (c) EUR billion 11.1 11.4 . . . -5.6 -4.3 -2.5 -3.6 -2.5 -11.7 -3.8 -0.7 0.4 -0.7
7 Risk indicators (for households) Share in %Indebtedness (% of GDP) (d) % 50.6 51.2 . . . . 51.4 50.6 50.8 50.6 51.2 52.2 53.5 54.8 53.9Housing loans (% of disposable income) (c, f) % 11.6 11.5 . . . 49.9 51.3 41.6 47.4 11.6 11.5 11.3 11.5 11.2 10.4Interest expenses on MFI loans (% of disposable income) (c, f) % 3.0 3.0 . . . 2.9 3.2 2.7 3.1 3.0 3.0 3.3 3.5 3.4 4.2Variable rate loans (% of total new loans) (c) % 86.7 82.6 . 70.6 77.5 70.6 80.3 86.7 86.7 86.7 82.6 80.9 78.9 77.9 75.1Foreign currency loans (% of total loans) (c) % 23.7 26.8 21.0 21.4 22.1 22.9 23.6 22.5 23.4 23.7 26.8 31.7 35.4 36.6 37.8
Sources: (a) Eurostat, (b) IMMOunited data for RE/MAX, (c) OeNB, (d) Statistics Austria, (e) Prof. Wolfgang Feilmayr (Department of Spatial Planning , Vienna University of Technology) and OeNB, (f) WIFO, (g) authors' calculations.
Factsheet on Austria’s residential property market – October 2015