how are payments made in austria? - oenb
TRANSCRIPT

Monetary Policy & the Economy Q2/06 ◊ 111
How Are Payments Made in Austria?Results of a Survey on the Structure of Austrian Households’ Use
of Payment Means in the Context of Monetary Policy Analysis
1 IntroductionThe scale of cashless payments has grown considerably in Austria in re-cent years. In particular, debit card payments have expanded vigorously. However, it is not clear how cash use has developed recently, in particular against the background of the launch of euro cash. Does cash still have the preeminence it enjoyed in the days of the Austrian schilling, or do Austri-ans now prefer to make cashless pay-ments? This study attempts to provide an in-depth analysis of the overall pic-ture of developments in Austrian households’ payment behavior and, on this basis, to assess future trends. In particular, it examines the possible impact of the growing popularity of cashless payment media on both cash in circulation and monetary policy – a key issue from a central banking
perspective as regards the design and effectiveness of monetary policy.
However, available sources of in-formation for the analysis of house-holds’ payment behavior still look un-satisfactory. An important source of data for analyzing cash use is most certainly aggregate statistics on the growth of currency in circulation. The euro area has seen a sharp rise in the cash in circulation since 2002; this development, however, has been dominated by exceptional factors associated with the cash changeover. In particular, high, albeit slowing, levels of growth in banknotes and coins in circulation may be related to the (renewed) increase in cash hoard-ings in Austria and abroad. For this reason, trends in total cash in circula-tion hardly provide any indication of the development of demand for the
Refereed by:
Malte Krüger, Institute
for Economic Policy and
Economic Research,
University of Karlsruhe.
Research assistance:
Thorsten Odernek.
Refereed by:
Malte Krüger, Institute
for Economic Policy and
Economic Research,
University of Karlsruhe.
Research assistance:
Thorsten Odernek.
This study presents the results of a survey conducted in fall 2005 on the payment habits of Austrian households, comparing its findings with those of similar surveys carried out in 1996 and 2000. The focus is to analyze changes in the use of payment means over time and, on this basis, to assess future trends.
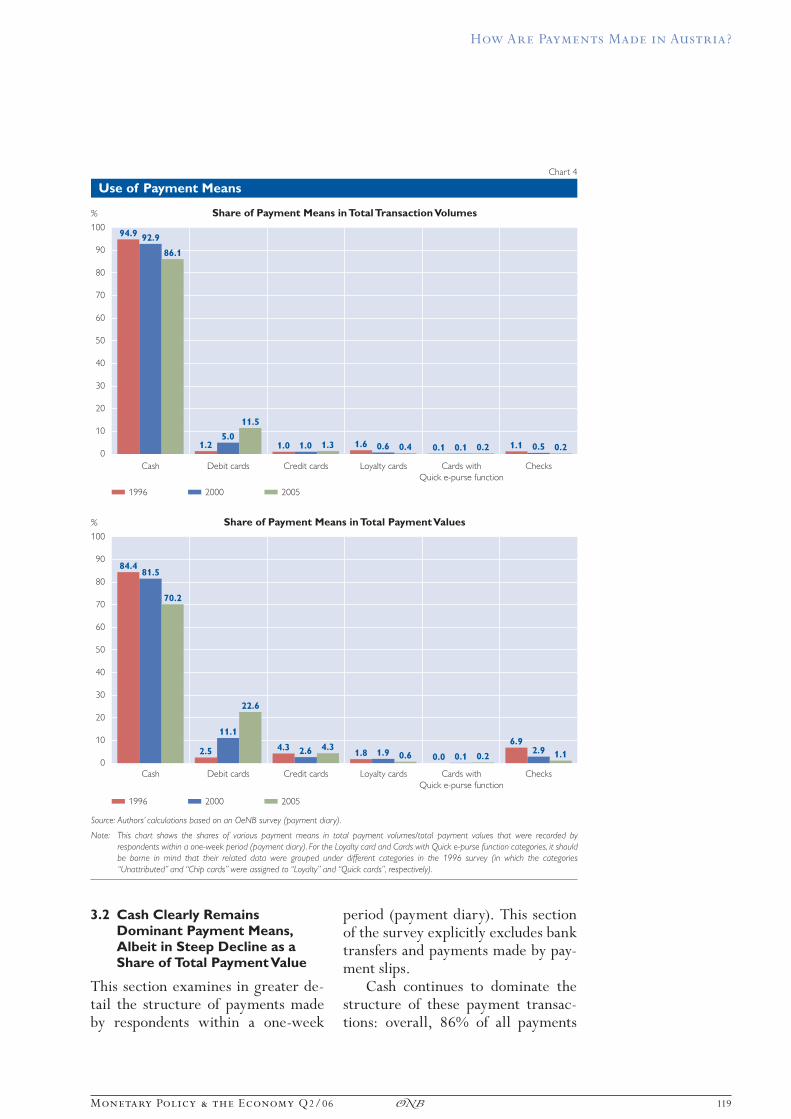
As the analysis in the 2005 survey shows, cash continues to dominate the structure of payment transactions, remaining by far the most important means of payment. Cash payments account for 86% of all direct payment transactions by Austrian households and for 70% of the total payment value. Compared with the previous surveys, however, the share of cash has contracted noticeably whereas the share of payments at point-of-sale (POS) terminals (via debit card payments) has more than doubled in the last five years to 11.5%. Although credit card payments have posted a slight increase, their share in the total volume still remains very low (1.3%). Overall, the results indicate the continuation of cash-card substitution.
From a central banking perspective, assessing future trends in cash demand is a key monetary policy issue. The findings of this study suggest that Austrian households’ payment habits will not change abruptly, therefore, any impact on monetary policy can be expected to remain very limited.
Peter Mooslechner,
Helmut Stix,
Karin Wagner1
Peter Mooslechner,
Helmut Stix,
Karin Wagner1
JEL classification: E41, E58, D12Keywords: usage of payment means, demand for money, monetary policy.
1 The authors would like to thank the participants of an OeNB seminar and the referee for their valuable com-ments.

How Are Payments Made in Austria?
112 ◊ Monetary Policy & the Economy Q2/06
amount of cash that is actually or potentially used for transaction pur-poses.2
As the actual amount of currency in circulation in the individual coun-tries of the euro area has been impos-sible to observe since the introduc-tion of the euro, one has to rely on what is termed the logistical currency in circulation.3 This measure indicates a decline in Austria. At this juncture, two questions should be examined: In what way can this decline be traced to changes in payment habits, and to what extent is it induced by other aspects (structural factors)?
Other sources of data on Austrian households’ payment habits are statis-tics on payments made with various payment cards (debit cards, credit cards, cards with the Quick e-purse function), as well as data on the tech-nological infrastructure of these forms of payment.4 However, only in-direct information about cash in cir-culation and cash use are inferable from these data, and nothing can be said about the overall picture describ-ing the use of payment media.
To obtain in-depth information on Austrian households’ payment be-havior, there consequently remains only one approach: that of statistical surveys. On the basis of such results, it is possible to also draw conclusions on foreign demand and the hoarding of cash.
For central banks, the analysis of both current trends and possible
changes in payment habits is crucial in terms of the impact on money de-mand. Moreover, the economic costs of payment systems are also of direct relevance. Humphrey et al. (2000) put the total costs of all payment ac-tivities in the U.S.A. at around 3% of GDP. Gresvik and Owre (2003) as-sess the costs incurred by Norwegian banks in 2001 at 0.4% of GDP. Finnish studies estimate cash costs alone at 0.1% of GDP (Bank of Fin-land, 2006).
Against this background, this study presents the results of a survey on Austrian payment habits, which was conducted in fall 2005. In addi-tion to the analysis of the develop-ment in the use and dissemination of various payment cards – particularly, debit and Quick e-purse transactions (both in Austria and abroad) in sec-tion 2, section 3 presents the survey’s key findings relating to the overall picture of Austrian households’ pay-ment transactions.5 Section 4 then takes a closer look at sector-specific differences and sociodemographic characteristics. Finally, section 5 dis-cusses the implications for monetary policy.
2 More Cards –More Payment Terminals – More Cashless Payments
In recent years, cashless payments have burgeoned in Austria. Payment and economic policy debate is largely focused on this specific detail in the
2 The amount of cash hoardings is likely to be much higher than the amount of cash held by people for payment transactions (e.g. Stix, 2004a).
3 Logistical cash in circulation is defined as the difference between the value of bank notes issued in Austria and the bank notes removed from circulation in Austria. However, owing to the free circulation of bank notes between EU Member States, many institutional factors such as the sectoral structure of an economy (e.g. tourism) influence this measure of currency in circulation.
4 The terms “debit card” and “Maestro card” are used synonymously below.5 Quick is the brand name of the most widely used electronic purse in Austria. This electronic purse is enabled on
Maestro debit cards. Furthermore, there are Quick-only cards.

How Are Payments Made in Austria?
Monetary Policy & the Economy Q2/06 ◊ 113
overall picture of private payment transactions. The present section examines this aspect and places it in an international context.
2.1 Robust Growth in Debit Card
Payments
The dissemination of payment cards has accelerated rapidly in recent years. However, these rates of growth lack significant informative value not least because many persons own several cards with a payment func-tion. What is more, some cardholders are not aware that their card has a specific payment application (e.g. the Quick e-purse function). For this reason, in particular, it seems useful to analyze the dissemination of pay-ment cards not only on the basis of cards issued but also on the basis of survey data. The OeNB has therefore been commissioning regular surveys on the ownership and use of payment cards since 1997.
In the fourth quarter of 2005, 78% of Austrians aged 14 and over claimed to own a payment card.77% said they possessed a debit card
(Maestro), 28% owned a credit card and 22% Quick-enabled cards. Only 9% of the population claimed to own a retailer loyalty card with a payment function.
Starting from an initial rate of dis-semination of 40% in 1997, debit cards (Maestro) have posted robust growth. Credit card ownership rose almost until 2002 and has since re-mained largely constant. Retailer loy-alty cards with a payment function, however, suffered a decline. Although the diffusion of Quick-enabled cards increased notably at the time of the launch of euro cash, it has since slowed a tad.
Quick-enabled cards most clearly reveal the difference between dis-semination based on the number of cards issued and (subjective) dissemi-nation based on survey data. As the Quick e-purse function is an integral feature of almost all debit cards, Quick cards should be as widespread as debit cards. However, the availabil-ity of the Quick application is actually known to only a comparatively small part of the population.
Chart 1
The Diffusion of Payment Cards (Survey Results)
90
80
70
60
50
40
30
20
10
0
% of population above the age of 14
Q1 97 Q1 02 Q1 03 Q1 04
Debit cards
Source: OeNB (Survey on Payment Cards).
Q1 01 Q1 05
Cards with Quick e-purse function
Credit cards
Loyalty cards with payment application
Q1 00Q1 99Q1 98

How Are Payments Made in Austria?
114 ◊ Monetary Policy & the Economy Q2/06
The number of debit card termi-nals in Austria has surged over the last few years, climbing from 229 in 1989 to more than 82,000 by end-2005. The trend in debit card pay-ment values was similarly impressive. These expanded from EUR 63 mil-lion in 1990 to EUR 11.2 billion in 2005 (chart 2).
As regards this payment segment’s future development, annual growth in debit card payment values has slowed notably, yet still came to around 16% at last count, clearly out-stripping the expansion in total pay-ment transactions, e.g. in terms of retail sales or household spending.
Therefore it can be assumed that the market share of this payment in-strument will continue to expand in future.
2.2 Quick E-Purse System
From a monetary perspective, the use of electronic money is of particular interest. Although Austria already has several e-purse systems, only the Quick scheme is currently of quanti-tative importance.
At end-2005, a total of almost 91,500 Quick payment terminals and some 6,000 value load terminals were available to consumers throughout Austria. This wide dissemination is
Chart 2
Trend in Maestro Payment Values
12
10
8
6
4
2
0
EUR billion
1990 2000 2002 2004
Value of debit card payments in EUR billion (left-hand scale)
Source: Europay Austria.
1998
Change on previous year in % (right-hand scale)
199619941992
%
120
100
80
60
40
20
0
Table 1
Some Key Quick System Figures
Year-end Number ofQuick payment terminals
Number of Quick value load terminals
Payments
Value Change on previous year
Average
EUR million % EUR
1997 12,756 3,495 5.7 x 13
1998 19,118 4,954 9.2 63 8
1999 29,564 5,225 11.7 27 5
2000 41,585 5,162 15.2 30 5
2001 60,848 5,419 28.5 87 6
2002 74,657 5,775 132.5 365 8
2003 79,806 5,879 116.8 –12 7
2004 86,690 6,452 121.3 4 6
2005 91,495 6,070 133.8 10 6
Source: Europay Austria, authors‘ calculations.

How Are Payments Made in Austria?
Monetary Policy & the Economy Q2/06 ◊ 115
above all attributable to Austria’s comprehensive infrastructure of debit card payment terminals (frequently also suited for Quick payments) and ATM terminals (for Quick value loads). At end-2005, some 7.1 million cards were issued with a Quick- enabled payment application. From a low level, total Quick payments grew very strongly from EUR 5.7 million in 1997 to EUR 134 million in 2005. What is striking are the high growth rates posted in 2001 and 2002 – the period when euro cash was intro-duced.
In both 2004 and 2005, the aver-age amounts paid with Quick were around EUR 6. Quick is thus pri-marily used as a payment system for small and very small amounts.
2.3 Frequency of Card Payments
In addition to the ownership of pay-ment cards, the frequency of card
payments is also pertinent to their role in payment transactions. Survey data from the fourth quarter of 2005 present the following picture. Over-all, debit cards are used by 87% of their holders, credit cards by 95% and retailer loyalty cards with a pay-ment application (henceforth to be called loyalty cards) by 90%. The Quick scheme lags way behind: only 42% of owners of debit cards with Quick use this function. Compared with the year 2000 survey, almost no change is recorded for either debit card or credit card usage whereas the share of those actually using the Quick function and retailer loyalty cards was down.
At end-2005, some 44% of Aus-trians paid by debit card at least once a week, 6.5% by credit card and 3.5% by Quick and 2.3% by a loyalty card (chart 3). Debit card usage shows a dynamic upward trend over time. By
Chart 3
Frequency of Payment Card Usage:
Payments Made at Least Once a Week
50
45
40
35
30
25
20
15
10
5
0
% of population over the age of 14
Q1 97 Q1 02 Q1 03 Q1 04
Debit cards
Source: OeNB (Survey on Payment Cards).
Note: This chart shows the share of the Austrian population paying with the relevant card at least once a week. For loyalty cards, data on the
frequency of usage were not surveyed before the third quarter of 2000.
Q1 01 Q1 05
Cards with Quick e-purse function
Credit cards
Loyalty cards with payment application
Q1 00Q1 99Q1 98
How Are Payments Made in Austria?
116 ◊ Monetary Policy & the Economy Q2/06
contrast, the share of Austrians regu-larly using loyalty cards has con-tracted slightly in recent years, with credit card usage remaining con-stant.6 As for the Quick scheme, its frequency of usage accelerated prior to the introduction of euro banknotes and coins. Since then, its usage by Austrians has dipped slightly.
2.4 Relatively Few Card Payments
in Austria Compared with
Other Countries
Despite this partly dynamic trend in card payments, the provision of POS terminals and total value of card pay-ments are still relatively low in Aus-tria, compared with other countries (ECB, 2006).7
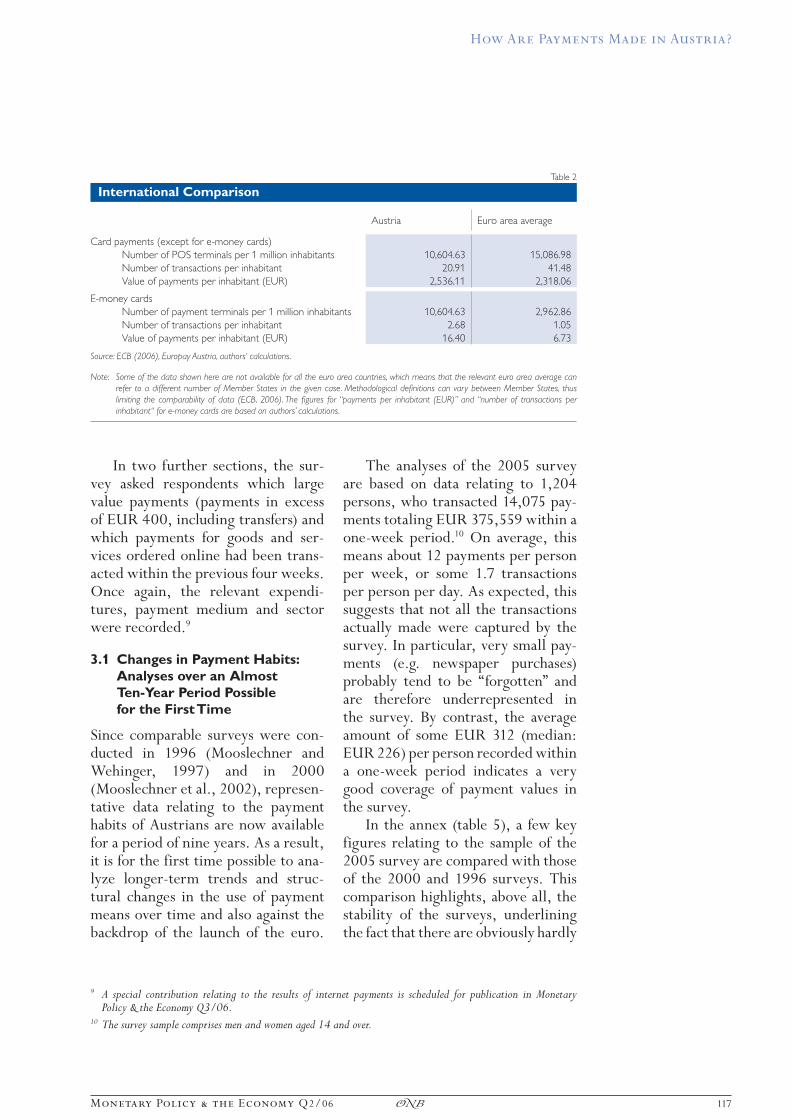
In terms of the number of POS terminals per inhabitant and the num-ber of payment transactions per in-habitant per year, Austria fell well short of the euro area average for all types of card payments (excludingso-called e-money cards) in 2004.By contrast, the value of payments per inhabitant was slightly above the average (table 2). A country com-parison – with, admittedly, some-what limited informative value due to, in part, different definitions in national statistics – reveals that Austria ranks only tenth among the 12 euro area countries in terms ofthe number of transactions per inhab-itant. By contrast, in Finland, for instance, six times as many card pay-ments are transacted per inhabitant than in Austria. In Ireland, Belgium, Luxembourg, France, Portugal and the Netherlands, card payments are
some three to four times more fre-quent.
By international standards, how-ever, electronic purses seem to be relatively widespread in Austria, out-performing the euro area average for all three indicators reported. In terms of the number of transactions per in-habitant, posting more than twice as many electronic purse transactions than the average number of e-money card transactions in the entire euro area, Austria ranked fourth in 2004 behind Belgium, Luxembourg and the Netherlands among the ten EU Member States for which data were available (ECB, 2006).
3 Survey Results Relating to Austrian Households’ Payment Transactions
In light of the robust growth in card payments, the question arises as to the share cashless payments in total payments and to what extent cash-less/card payments have substituted cash payments.
The OeNB therefore commis-sioned a survey on the specific pay-ment habits of Austrian households in the period from September to No-vember 2005.8 Survey respondents documented in a payment diary over a one-week period all personally transacted expenditures, the relevant payment amount, the means of pay-ment used and the relevant sector in which this payment was transacted. In this part of the survey (payment diary), bank transfers and payment slips were explicitly excluded as forms of payment.
6 Credit cards are used by most credit cardholders mainly on a monthly basis or more rarely (based on figures for the fourth quarter of 2005, 72% of credit cardholders, or some 16% of Austrians).
7 Data currently available relate to 2004 and only permit a distinction to be made between e-money cards and other payment cards.
8 The survey was conducted by IFES (Institut für Empirische Sozialforschung).
How Are Payments Made in Austria?
Monetary Policy & the Economy Q2/06 ◊ 117
In two further sections, the sur-vey asked respondents which large value payments (payments in excess of EUR 400, including transfers) and which payments for goods and ser-vices ordered online had been trans-acted within the previous four weeks. Once again, the relevant expendi-tures, payment medium and sector were recorded.9
3.1 Changes in Payment Habits:
Analyses over an Almost
Ten-Year Period Possible
for the First Time
Since comparable surveys were con-duc ted in 1996 (Mooslechner and Wehinger, 1997) and in 2000 (Mooslechner et al., 2002), represen-tative data relating to the payment habits of Austrians are now available for a period of nine years. As a result, it is for the first time possible to ana-lyze longer-term trends and struc-tural changes in the use of payment means over time and also against the backdrop of the launch of the euro.
The analyses of the 2005 survey are based on data relating to 1,204 persons, who transacted 14,075 pay-ments totaling EUR 375,559 within a one-week period.10 On average, this means about 12 payments per person per week, or some 1.7 transactions per person per day. As expected, this suggests that not all the transactions actually made were captured by the survey. In particular, very small pay-ments (e.g. newspaper purchases) probably tend to be “forgotten” and are therefore underrepresented inthe survey. By contrast, the average amount of some EUR 312 (median: EUR 226) per person recorded within a one-week period indicates a very good coverage of payment values in the survey.
In the annex (table 5), a few key figures relating to the sample of the 2005 survey are compared with those of the 2000 and 1996 surveys. This comparison highlights, above all, the stability of the surveys, underlining the fact that there are obviously hardly
Table 2
International Comparison
Austria Euro area average
Card payments (except for e-money cards)
Number of POS terminals per 1 million inhabitants 10,604.63 15,086.98
Number of transactions per inhabitant 20.91 41.48
Value of payments per inhabitant (EUR) 2,536.11 2,318.06
E-money cards
Number of payment terminals per 1 million inhabitants 10,604.63 2,962.86
Number of transactions per inhabitant 2.68 1.05
Value of payments per inhabitant (EUR) 16.40 6.73
Source: ECB (2006), Europay Austria, authors‘ calculations.
Note: Some of the data shown here are not available for all the euro area countries, which means that the relevant euro area average can
refer to a different number of Member States in the given case. Methodological definitions can vary between Member States, thus
limiting the comparability of data (ECB, 2006). The figures for “payments per inhabitant (EUR)” and “number of transactions per
inhabitant“ for e-money cards are based on authors’ calculations.
9 A special contribution relating to the results of internet payments is scheduled for publication in MonetaryPolicy & the Economy Q3/06.
10 The survey sample comprises men and women aged 14 and over.

How Are Payments Made in Austria?
118 ◊ Monetary Policy & the Economy Q2/06
any major differences between the surveys between the era of the Aus-trian schilling and that of the euro despite a period of almost a decade.
The analysis of the distribution of payments recorded by the respon-dents over time provides a similar picture (table 3). The two previous surveys conducted in the era of the Austrian schilling delivered results closely resembling those of the cur-rent survey; only the euro-denomi-nated amounts recorded by respon-dents are slightly higher than the cor-responding schilling amounts.11 Over-all, the distribution of payments appears to be very similar for about 75% of the payments. Larger differ-ences emerge only for the (small) share of the highest payment amounts, with the euro amounts particularly for these payments being significantly higher than the corresponding schil-ling amounts.
For payment methods for which population data relating to the num-ber of transactions and payment val-
ues are available (debit cards, Quick), the average payment amounts can be compared with the sample values from the survey as a countercheck. For instance, the average POS ter-minal payment which has been deter-mined from the survey data isEUR 49, while the value calculated from actual debit card payment data in 2005 comes to EUR 50. For Quick payments, an average amount ofEUR 21 is calculated from the survey data whereas the actual average value for Quick payments is around EUR 6. If, however, only Quick payments made at POS terminals were analyzed for comparative purposes, the result is an actual average payment amount of EUR 19. This suggests that the sample tends not to capture all smaller Quick payments (e.g. at Quick-only terminals like coffee dispensers). In this regard, the findings for Quick re-ported below are therefore likely to be biased.12 Given this evidence, it is also likely that small cash payment amounts are also underrepresented.
Table 3
Distribution of Recorded Payments
1996 2000 2005
Minimum 0.3 0.3 0.5
p5 1.3 1.5 2.0
p25 (1st quartile) 5.0 5.3 6.0
Median 11.7 11.8 13.0
p75 (3rd quartile) 25.2 26.3 28.0
p90 (9th decile) 44.9 45.7 50.0
p95 67.1 68.5 72.0
Maximum 3,560.5 1,904.1 3,500.0
Source: Authors‘ calculations based on an OeNB survey (payment diary).
Note: The table shows the distribution of payments recorded by respondents in 1996, 2000 and 2005. Payments recorded in 1996 and 2000
were adjusted for inflation in line with the HICP to September 2005. “p25”, for instance, designates the amount below which 25% of
all payments are (e.g. in 2005, 25% of all payments were less than EUR 6).
11 The payments of the 1996 and 2000 surveys were adjusted for inflation in line with the HICP to September 2005. This applies to all the calculations and comparisons below.
12 An approximate extrapolation of the sample’s Quick transactions onto the population also reveals that the sample has not captured all the Quick transactions. By contrast, debit card payments may tend to be overrepresented. It is possible that debit card payments and Quick payments that were made with the same card were subject to amix-up.
How Are Payments Made in Austria?
Monetary Policy & the Economy Q2/06 ◊ 119
3.2 Cash Clearly Remains
Dominant Payment Means,
Albeit in Steep Decline as a
Share of Total Payment Value
This section examines in greater de-tail the structure of payments made by respondents within a one-week
period (payment diary). This section of the survey explicitly excludes bank transfers and payments made by pay-ment slips.
Cash continues to dominate the structure of these payment transac-tions: overall, 86% of all payments
Chart 4
Use of Payment Means
100
90
80
70
60
50
40
30
20
10
0
%
1996 2000 2005
84.4
2.5 4.31.8 0.0
6.9
81.5
11.1
2.6 1.9 0.12.9
70.2
22.6
4.30.6 0.2 1.1
94.9
1.2 1.0 1.6 0.1 1.1
92.9
5.01.0 0.6 0.1 0.5
86.1
11.5
1.3 0.4 0.2 0.2
Cash Debit cards Credit cards Loyalty cards Cards with
Quick e-purse function
Checks
Source: Authors’ calculations based on an OeNB survey (payment diary).
Note: This chart shows the shares of various payment means in total payment volumes/total payment values that were recorded by
respondents within a one-week period (payment diary). For the Loyalty card and Cards with Quick e-purse function categories, it should
be borne in mind that their related data were grouped under different categories in the 1996 survey (in which the categories
“Unattributed” and “Chip cards” were assigned to “Loyalty” and “Quick cards”, respectively).
Share of Payment Means in Total Transaction Volumes
100
90
80
70
60
50
40
30
20
10
0
%
1996 2000 2005
Share of Payment Means in Total Payment Values
Cash Debit cards Credit cards Loyalty cards Cards with
Quick e-purse function
Checks

How Are Payments Made in Austria?
120 ◊ Monetary Policy & the Economy Q2/06
were settled by cash. Whereas the cash share of total transactions is slightly down (albeit from a high level), debit card transactions grewto 12%, i.e. more than double their share compared with 2000. As for credit cards, their share of around 1.3% remains steady in the period under observation (nine years). It is also notable that check payments are still significant, albeit to a very small extent.
In terms of the total value of pay-ment transactions recorded, the cash share has since 1996 substantially de-clined by some 15 percentage points to a current level of 70%. It is strik-ing that the cash share has particu-larly strongly contracted by 11 per-centage points since 2000. It is also worth highlighting that within the space of five years the debit card share soared (in terms of payment amounts) by 20 percentage points to 23% in 2005. Since 2000, credit cards have
also posted a modest advance, dou-bling their share to 4.3%. In addition, this survey shows that although the share of Quick payments has ex-panded (doubling since 2000 in terms of number of payments and amount), it is likely that not all such transac-tions were captured by the sample, as previously mentioned. Owing to their small number of transactions, all other payment means are of minor importance.
Chart 4 illustrates this develop-ment over time: a contraction in the share of cash payments contrasts with robust growth in the share of debit card payments and by modest growth in the credit card share since 2000.
What amounts are settled by which payment means? Is there a cor-relation between the amount of pay-ment and the means of payment used? This is only a small selection of ques-tions that can be examined and answered in greater detail on the ba-
Chart 5
Distribution of Payment Amounts in 2005
100
90
80
70
60
50
40
30
20
10
0
Cumulated share of payments in %
Cash payments
Source: Authors’ calculations based on an OeNB survey (payment diary).
Note: The chart shows the cumulated distribution of total payment transactions that were recorded by respondents within a one-week period(payment diary). For instance, 90% of all payments are below EUR 40. Payments starting from EUR 200 are excluded for the purposesof better graphical display. Figures for 1996 and 2000 were adjusted for inflation.
Debit card payments
0 20 40 60 80 100 120 140 160 180 200
Payment amount in EUR
Credit card payments

How Are Payments Made in Austria?
Monetary Policy & the Economy Q2/06 ◊ 121
sis of the survey data. Chart 5 shows that cash is largely used for small-value payments – 50% of all cash pay-ments are below EUR 11; 90% of all cash payments are less than EUR 40. The flatter curve for debit card trans-actions signifies that the amounts of debit card payments tend to be higher than their cash payment counter-parts. Only 67% of these payments are less than EUR 40. The value of credit card payments, on the other hand, is on average higher than that of debit card payments, with only 40% being below EUR 40. The varying “flatness” of the cumulated distribu-tions highlights the fact that, for low-value payments, cash is still largely used whereas credit cards are used only for higher amounts – 50% of all credit card transactions were made for payment amounts starting from EUR 48.
The survey also questioned house-holds about large-value payments made in the previous four weeks. Even if comparability with previous surveys is somewhat limited (in 2000, large-value payments were defined as amounts in excess of ATS 5,000 (EUR 363.36), whereas in 2005 they were categorized as starting from EUR 400) and assuming that the sur-vey did not capture all such transac-tions (in particular, regular transfers for housing costs, energy and the like), a similar development is also evident for large-value payment data (chart 6): a contraction in the share of both cash and check payments, and increases in the share of debit card, credit card and transfer payments. Whereas credit cards and transfers made the strongest advances in ex-panding their share in this segment, debit card payments for large amounts did not grow as fast as payments recorded in the payment diary.
Chart 6
Breakdown of Total Payment Value by Payment Medium
60
50
40
30
20
10
0
%
2000 2005
Source: Authors’ calculations based on an OeNB survey (large-value payments).
Note: This chart shows the share of various payment means in total large-value payment transactions (2005 survey: in excess of EUR 400).
Cash Debit cards Credit cards Loyalty cards Quick
e-purse function
Transfers,
standing orders
Checks

How Are Payments Made in Austria?
122 ◊ Monetary Policy & the Economy Q2/06
4 A Closer Look at Payments: Structural Characteristics and Trends
4.1 Distinct Sectoral Differences in
the Usage of Payment Means
Respondents’ payment diaries also in-clude the type of shop or sector in which the payment was made. Of the total number of transactions, 50% are accounted for by just two sectors (food: 32.7%; hotels and restaurants: 16.8%). A further three sectors en-joy significant shares: newspaper and tobacco shops (8.8%), pharmacies/drugstores (7.4%) and gas stations (5.7%). All other sectors had shares of less than 5%.
The data reveal distinct sector- related differences as regards the form of payment. At more than 98%, the share of cash transactions is particu-larly high at restaurants/hotels and at newspaper and tobacco shops, as it is at florists, where the share of cash transactions is 95%. Cash sharesare the lowest (less than 60%) atfurniture stores and when settling housing-related costs. At any rate, about a third of payments for furni-ture and/or home fabrics as well as electrical equipment as recorded in the payment diaries are made by debit cards. Credit card payments account for 25% of vacation travel, 8% offurniture purchases and 6.2% of clothing and fabric purchases.13
How has this picture changed since 2000? Across all sectors, the decline in cash payments is pro-nounced for transaction amounts re-corded in the payment diaries over time (chart 7), primarily due to the rise in debit card payments. In food stores, cash payments are down sig-nificantly whereas debit card pay-ments have jumped from 1% in 1996 to 20% in 2005. In the last five years, furthermore, debit card payments have posted robust growth in electri-cal equipment retailing (more than doubling its share to 34%), clothing and fabric stores (from 24% to 39%) and gas stations (from 17% to 29%).14 In general, the expansion of POS ter-minals in these sectors is likely to have significantly contributed to the declining cash share.
4.2 Analysis by Sociodemographic
Characteristics Highlights
Decline in Cash Use
The analysis of payment media usage by various sociodemographic charac-teristics also clearly reveals the afore-mentioned decline in cash use over time. Chart 8 illustrates some inter-esting trends in this respect:15
The higher people’s income, the more inclined they are to pay other than by cash (i.e. the lower the share of cash payments as a percentage of total expenditures).16 The decline in
13 For further details, see table 6 in the annex. It presents the share of the payment media used as a percentage of the total payment value in the relevant sector.
14 A sector-related analysis of payment diary data does not make sense for the following forms of payment: loyalty cards, Quick cards and checks due to their small number of transactions (see annex, table 6).
15 The figures shown are based on persons who are debit cardholders. This ensures that the results are comparable, as debit card ownership itself is also related to sociodemographic factors.
16 As regards the cash shares calculated here, the average of the individual cash shares of respondents belonging to the same group is used (i.e. for every respondent, the individual cash share was determined and then the average calculated across his entire group). These shares are not comparable with those from charts 4 and 5, for which the shares were calculated in an aggregated manner (sum of cash payments of all respondents, divided by total expen-ditures).

How Are Payments Made in Austria?
Monetary Policy & the Economy Q2/06 ◊ 123
Chart 7
Change in Payment Structure in Selected Sectors
Source: Authors’ calculations based on an OeNB survey (payment diary).
Note: This chart shows the share of both cash payments and debit card payments in total payments of the relevant sector. The data are based
on payments recorded by respondents within a one-week period (payment diary). A few sectors were recategorized in the 1996 and
2000 surveys.
Cash Payments
1996 2000 2005
0 10 20 30 40 50 60 70 80 90 100
Share in the volume of the relevant sector in %
1996 2000 2005
0 5 10 15 20 25 30 35 40 45 50
Share in the volume of the relevant sector in %
Debit Card Payments
Restaurants, hotels
Food stores, supermarkets
Department stores, DIY stores
Newspaper and tobacco shops
Clothing and fabrics
Cars and accessories
Gas stations, fuel shops
CDs, DVDs
Electrical equipment
Jewelry
Books and office supplies
Travel agencies, airline tickets
Restaurants, hotels
Food stores, supermarkets
Department stores, DIY stores
Newspaper and tobacco shops
Clothing and fabrics
Cars and accessories
Gas stations, fuel shops
CDs, DVDs
Electrical equipment
Jewelry
Books and office supplies
Travel agencies, airline tickets

How Are Payments Made in Austria?
124 ◊ Monetary Policy & the Economy Q2/06
the cash share is even more dramatic depending on respondents’ level of education: while it is 87% for respon-dents with compulsory school leaving certificates, it is only 65% for high school and university graduates. Moreover, there are also pronounced differences in this contraction de-pending on the level of education. Compared with 1996, the decline is 11 percentage points for high school and university graduates, yet amounts to just 8 percentage points for those with compulsory school leaving cer-tificates.
A life cycle analysis reveals that the share of cash payments is at its highest among younger people and older people. People up to the age of 25 settle 76% of their payments in cash. This share then falls to less than 70% for people up to the age of 45.
As people grow older, their payments are apparently again increasingly settled in cash: over 65-year olds transact 81% of their expenditures in cash. Even here, however, the decline in cash use and the growing impor-tance of cashless payment media – across all age groups – is plain to see.
Are there any gender-related dif-ferences in the payment habits of men and women? If so, how have these de-veloped? In 1996, men processed 82% and women 86% of their pay-ments in cash; in 2002, however, the cash share of both sexes was identical (82%). Interestingly, in 2005 women “overtook” men in reducing their share of cash payments. While men settled 75% of their expenditures in cash, women only settled 72% thereof by this means.
Chart 8
Cash Use by Sociodemographic Characteristics
1.0
0.9
0.8
0.7
0.6
Income
2005
Source: Authors’ calculations based on an OeNB survey (payment diary).
Note: These charts show the share of cash in total payments. For reasons of comparability, these charts refer to debit cardholders only.
2000
Up to
EUR 599
EUR 600
to
EUR 1,199
EUR 1,200
to
EUR 1,499
EUR 1,500
to
EUR 1,799
EUR 1,800
to
EUR 2,249
1996
Share of cash payment in %
Over
EUR 2,250
Level of Education
1.0
0.9
0.8
0.7
0.6
Share of cash payment in %
Compulsory
schooling
Apprenticeship Technical or
vocational schooling
High school
completion
(or equivalent),
University2005 2000 1996
1.0
0.9
0.8
0.7
0.6
Age
2005 2000
15 to
24 years
25 to
34 years
35 to
44 years
45 to
54 years
55 to
64 years
1996
Share of cash payment in %
Over
65 years
Gender
1.0
0.9
0.8
0.7
0.6
Share of cash payment in %
1996 2000 2005
Male Female
How Are Payments Made in Austria?
Monetary Policy & the Economy Q2/06 ◊ 125
4.3 Contraction of Cash Share
Benefits Debit Card Payments
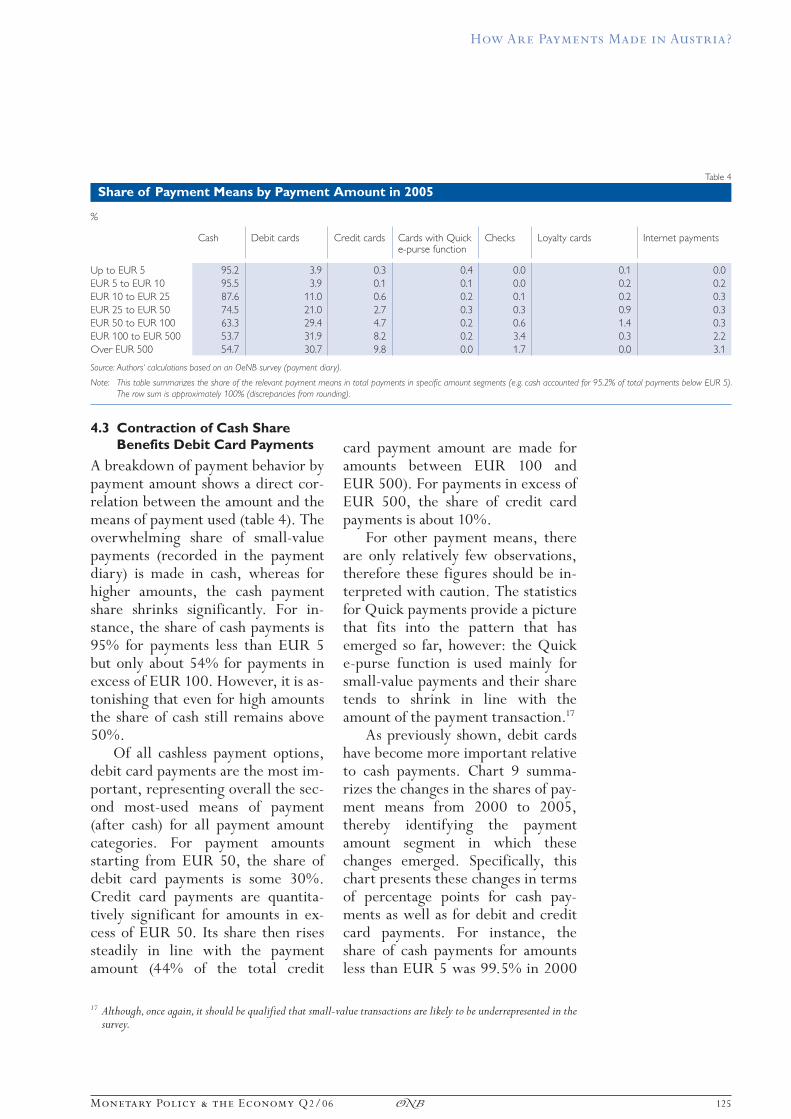
A breakdown of payment behavior by payment amount shows a direct cor-relation between the amount and the means of payment used (table 4). The overwhelming share of small-value payments (recorded in the payment diary) is made in cash, whereas for higher amounts, the cash payment share shrinks significantly. For in-stance, the share of cash payments is 95% for payments less than EUR 5 but only about 54% for payments in excess of EUR 100. However, it is as-tonishing that even for high amounts the share of cash still remains above 50%.
Of all cashless payment options, debit card payments are the most im-portant, representing overall the sec-ond most-used means of payment (after cash) for all payment amount categories. For payment amounts starting from EUR 50, the share of debit card payments is some 30%. Credit card payments are quantita-tively significant for amounts in ex-cess of EUR 50. Its share then rises steadily in line with the payment amount (44% of the total credit
card payment amount are made for amounts between EUR 100 andEUR 500). For payments in excess of EUR 500, the share of credit card payments is about 10%.
For other payment means, there are only relatively few observations, therefore these figures should be in-terpreted with caution. The statistics for Quick payments provide a picture that fits into the pattern that has emerged so far, however: the Quick e-purse function is used mainly for small-value payments and their share tends to shrink in line with the amount of the payment transaction.17
As previously shown, debit cards have become more important relative to cash payments. Chart 9 summa-rizes the changes in the shares of pay-ment means from 2000 to 2005, thereby identifying the payment amount segment in which these changes emerged. Specifically, this chart presents these changes in terms of percentage points for cash pay-ments as well as for debit and credit card payments. For instance, the share of cash payments for amounts less than EUR 5 was 99.5% in 2000
Table 4
Share of Payment Means by Payment Amount in 2005
%
Cash Debit cards Credit cards Cards with Quick e-purse function
Checks Loyalty cards Internet payments
Up to EUR 5 95.2 3.9 0.3 0.4 0.0 0.1 0.0
EUR 5 to EUR 10 95.5 3.9 0.1 0.1 0.0 0.2 0.2
EUR 10 to EUR 25 87.6 11.0 0.6 0.2 0.1 0.2 0.3
EUR 25 to EUR 50 74.5 21.0 2.7 0.3 0.3 0.9 0.3
EUR 50 to EUR 100 63.3 29.4 4.7 0.2 0.6 1.4 0.3
EUR 100 to EUR 500 53.7 31.9 8.2 0.2 3.4 0.3 2.2
Over EUR 500 54.7 30.7 9.8 0.0 1.7 0.0 3.1
Source: Authors‘ calculations based on an OeNB survey (payment diary).
Note: This table summarizes the share of the relevant payment means in total payments in specific amount segments (e.g. cash accounted for 95.2% of total payments below EUR 5).
The row sum is approximately 100% (discrepancies from rounding).
17 Although, once again, it should be qualified that small-value transactions are likely to be underrepresented in the survey.

How Are Payments Made in Austria?
126 ◊ Monetary Policy & the Economy Q2/06
and 95.2% in 2005. The change in percentage points is therefore –4.3. At the same time, the share of debit card payments rose by almost the same extent whereas the share of credit card payments for amounts less than EUR 5 did not change signifi-cantly. For amounts up to EUR 100, two things hold true in general. The share of cash decreases as payment amounts rise and, second, this de-cline almost exactly mirrors in re-verse increases in the share of debit card payments. The share of credit card payments expands notably only for amounts in excess of EUR 100, mostly at the expense of check pay-ments (not shown in chart 9).
In addition, the cumulated distri-butions of both cash and debit card payments for 1996, 2000 and 2005 (chart 10) reflect which share of the respective payments lies below a cer-tain amount. Unlike table 4 and chart 9, this chart illustrates to what extent the payment amounts for specific pay-
ment means have changed over time. The chart on the left represents the distribution of cash payments, show-ing that about 50% of cash payments in 2005 were below EUR 13, and 90% of cash payments were below EUR 40. It is surprising that the dis-tribution has not changed much over time. For instance, cash payments did not change in terms of their amount structure: in 2005, cash payments of EUR 5 or EUR 100 were made as fre-quently as in 1996.
The graph on the right contains the same data relating to debit card payments, for which the curve shifts strongly to the left from 1996 to 2005. This signifies that the amounts of debit card payments have tended to shrink since 1996, and that currently the amounts which consumers are paid by debit card are becoming smaller and smaller. In 1996, for ex-ample, the share of debit card pay-ments less than EUR 25 was only 24%, by 2005 this share had risen to
Chart 9
Change in Usage of Payment Means by Payment Amount
20
15
10
5
0
-5
-10
-15
-20
Change in percentage points
Cash Debit cards
Source: Authors’ calculations based on an OeNB survey (payment diary).
Note: This chart shows the change in the share of the relevant payment means in percentage points for different payment amounts from
2000 to 2005. In 2000, for instance, cash for amounts of up to EUR 5 accounted for a share of 99.48%. In 2005, however, this share
contracted by 4.32 percentage points to 95.15% (this value is represented in the chart). Payments recorded in the 2000 survey were
adjusted for inflation in line with the HICP to September 2005.
Up to EUR 5 EUR 5 to 10 EUR 10 to 25 EUR 25 to 50 EUR 50 to 100 EUR 100 to 500 Over EUR 500
2000 to 2005
Credit cards

How Are Payments Made in Austria?
Monetary Policy & the Economy Q2/06 ◊ 127
42%. As Austrians are gradually using debit card payments for smaller amounts, they are in general appar-ently more willing to make debit card payments at POS terminals. As previ-ously shown, this substitution effect in the small-value payment segment took place primarily at the expense of cash. Furthermore, the steady shift in the distribution over time suggests that this trend reflects a structural change in habits and will therefore continue over the next few years.
5 Only a Moderate Impact on Cash Demand
A relatively pronounced shift from cash to cashless payments will have
an impact on cash demand. Specifi-cally, estimates about the develop-ment of the amount of cash which is actually used for transactions made in Austria are inferable from the survey data.18
Demand for this cash is strongly influenced by three factors.19 First, by the amount of total payments (value) – the higher the payment value, the higher cash demand. Sec-ond, by the share of payments that is settled in cash and, third, by the transaction elasticity of money de-mand. The latter determines the per-centage increase of cash demand if payment amounts rise by 1%. Stix (2004a) presents estimates for Aus-
Chart 10
Distribution of Cash and Debit Card Payment Amounts over Time
100
90
80
70
60
50
40
30
20
10
0
Source: Authors’ calculations based on an OeNB survey (payment diary).
Note: This chart shows the trend in cumulated distributions in 1996, 2000 and 2005, as well as the trend in cash and debit card payment transactions. The data are based on payments
recorded by respondents within a one-week period (payment diary). For instance, 90% of all cash payments are less than EUR 40. Payments from EUR 100 are excluded for the
purposes of better representativeness. The figures in the 1996 and 2000 surveys were adjusted for inflation.
Cash payments
1996 2000
0 70 80 90 100
2005
Cumulated share of payments in %
Debit card payments
Cumulated share of payments in %
6050302010 40
Payment amount in EUR
0 70 80 90 1006050302010 40
Payment amount in EUR
100
90
80
70
60
50
40
30
20
10
0
1996 2000 2005
18 This is of interest given that, since the launch of the euro, it has not been feasible to measure currency in circula-tion at national level. If the trend in the demand for transaction cash can be estimated, then the trend in the total cash in circulation can be roughly extrapolated on the basis of the estimated share of cash circulating abroad, hoarded in Austria and/or used in the informal sector.
19 For the sake of simplicity, the following assumes constant interest rates. Any changes in cash demand will therefore not depend on interest rates.

How Are Payments Made in Austria?
128 ◊ Monetary Policy & the Economy Q2/06
tria and finds that the transaction elasticity of money demand is inthe range of 0.5. This means that a 1% increase in payment values will generate roughly half as high an in-crease in the demand for cash. Simi-lar values were estimated for other countries; moreover, this parameter is likely to remain relatively constant over time (Knell and Stix, 2006). The following will therefore assume that this value did not change from 1996 to 2005.
It follows from this that any changes in money demand can be at-tributed to changes in the first two factors. The demand for cash de-creases if, with the cash share remain-ing constant, transaction amounts contract or, with constant transaction amounts, the share of cash payments declines. This implies that the de-mand for cash can also decrease as transaction sums increase, especially if payment habits change and if more transactions are settled by cashless payments. Whether, in short, the change in cash demand is positive or negative depends on the change in both payment values and the share of cash payments.20 The trend in retail sales and consumer spending can be used to approximate the change in the relevant aggregate transaction amounts. Survey data are used to cal-culate the change in the share of cash payments.21 It should be underlined that the change in cash holding thus calculated is attributable purely to changes in payment habits. Any changes in cash demand triggered by cash withdrawal habits (e.g. by mak-ing greater use of ATMs) are not
included.22 Furthermore, the demand for cash refers to only that of house-holds and not to the cash demand of enterprises.
The decline in optimal cash hold-ing levels is not difficult to determine if payment volumes remain constant. This amounts to 50% of the change in the share of cash payments. Since the share of cash payments shrank by some 16% from 1996 to 2005, an average household held 8% less cash in 2005 than in 1996 (assuming that its payment volumes have not changed since 1996).
A further question concerns the development of cash holdings, allow-ing for the fact that both prices and the real value of transactions have in-creased since 1996. This question is relevant for analyzing both the nomi-nal and real currency in circulation.
From 1996 to 2005, nominal re-tail sales advanced by 15.7%. By con-trast, nominal household consump-tion expenditures grew by 29.4%. Since these values diverge signifi-cantly and it is not clear a priori which value better represents the actual trend in payment amounts, the fol-lowing calculations are carried out for both variables.
The calculations show that, de-pending on the assumed growth in total payments, nominal cash demand fell by some 2% (based on assumed retail sales growth) or rose by 3% (based on assumed growth in con-sumption expenditures) from 1996 to 2005. Interestingly, nominal cash de-mand grew in both scenarios from 1996 to 2000 although the share of cash payments was already on the
20 See Markose and Loke (2003) for the influence of card payments on optimal levels of cash holdings.21 It is also assumed that the share of transfers and payments made by payment slips remained more or less con-
stant.22 The consequences of cash withdrawal habits are discussed in Stix (2004a).
How Are Payments Made in Austria?
Monetary Policy & the Economy Q2/06 ◊ 129
wane (sales growth was stronger than the contraction, which was triggered by the declining share of cash pay-ments). From 2000 to 2005, how-ever, nominal cash demand weakened in both scenarios. This decline comes in a period in which cash in circula-tion contracted considerably in the course of the introduction of euro cash.
These calculations can also be carried out using real variables, i.e. by including actual changes in the price level. In this instance, real cash demand decreased by between 3% and 8% from 1996 to 2005 (depend-ing on the assumed trend in payment volumes).
As an alternative to a pure year-on-year comparison, one could ask the question as to how high cash de-mand would have been in 2005 if pay-ment habits had not changed since 1996. In this case, the calculations show that both real and nominal cash demand would have been 10% higher in 2005.
Despite these fairly significant ef-fects, it should be qualified that the cash that is used by households for transaction purposes only comprises a relatively small part of total cash in circulation (Stix, 2004b). In purely quantitative terms, most cash is hoarded, used in the shadow econ-omy or held abroad.23 Accordingly, changes in the amount of cash in cir-culation is dominated by changes in these components. Since these de-mand components are, moreover, not particularly influenced by payment cards, the impact of the use of pay-ment cards on total cash demand
is currently not likely to be excessi vely significant in quantitative terms. However, the trend toward cashless payments is likely to have accelerated the decline in cash demand observed in the course of the launch of euro banknotes and coins.24
In addition to the impact on cash demand, the increased use of cashless payment means can generate a num-ber of other effects.25 For instance, it could boost the interest rate elasticity of money demand – if interest rates rise, the demand for cash is reduced and more payment means that may generate interest income (e.g. debit cards, credit cards) are used. How-ever, this effect is not likely to bevery significant either, especially as cash is not only used primarily due to interest rates considerations but also due to other criteria.
The OeNB survey also asked debit card holders for their views on the reasons to prefer cash to cashless pay-ment: 46% of debit card holders claimed that cash allowed them to keep better track of their finances, 44% claimed that they used cash from force of habit, 32% expect to spend less money by making cash payments and a quite remarkable 29% of debit card holders said that cash payments were a more practical and swifter form of transaction. In short, the mo-tives “controlling one’s own finances” and “habit” appear to play an impor-tant role in opting to make cash pay-ments. These findings tally closely with those presented by Penz et al. (2004), who highlight people’s feared loss of control when making card payments as an important reason for
23 See also Drehmann et al. (2002).24 In addition, it should be borne in mind that cash as a share of the monetary aggregates M3 and M1 – that are
crucial from a monetary perspective – accounts for only around 7% and 15% thereof, respectively. 25 See, for instance, Stix (2002), as well as Schmitz and Wood (2006).

How Are Payments Made in Austria?
130 ◊ Monetary Policy & the Economy Q2/06
choosing between either cash or cash-less payment media. This, in turn, clearly limits the importance of con-siderations about growing interest rate elasticity.26
6 Summary and Conclusions
This paper provides an overview of a survey on Austrian households’ pay-ment habits, which was commissioned by the OeNB in fall 2005. The analy-sis of these data, especially compari-sons with similar surveys conducted in 1996 and 2000, reveal interesting changes in payment habits since the mid-1990s.
The share of cash payments con-tinues to dominate the structure of direct payment transactions. In 2005, a remarkable 86% of all direct pay-ment transactions (excluding trans-fers and payment slips) were still pro-cessed in cash. Whereas the cash share is down only slightly (albeit still from a high level), debit card transac-tions posted robust growth to 12%, or doubled its share compared with 2000. At 1.3%, the share of credit card payments has remained almost constant in the last nine years. In terms of the total value of payment transactions recorded, the contrac-tion of the cash share to 70% proved somewhat more substantial. In this regard, it is particularly worth high-lighting the comparatively sharp de-cline by 11 percentage points since 2000. What is striking is the robust growth in debit cards’ payment amounts to a share of 23%. Credit cards grew in importance, doubling their share since 2000, although their share of total payments still remains
small. In addition, the decline in cash use was also evident for large-value payments (in excess of EUR 400). Credit cards and transfers made the strongest advances in expanding their share in this segment.
A closer analysis of the survey data should answer questions as re-gards how payments are made, by whom they are made and what the purpose of payment is. It shows that there are sector-related differences for the payment means used and also confirms that there is a decline in cash across all sectors. In food stores, the sharp contraction in the cash share benefits debit card payments. Furthermore, debit cards have grown in importance as a payment optionin electrical equipment retailing, clothing and fabric stores and at gas stations. Credit cards are used to pay 25% of vacation trips. Moreover, they are increasingly used to pay for furni-ture, clothes and fabrics.
In addition, sociodemographic char acteristics are shown to be cru-cial determinants for the choice between cash or cashless payment. For instance, the cash share (share of cash payments as a percentage of total expenditures) declines as income grows. The differences in education have an even more marked impact on Austrians’ payment habits. For Aus-trian high school and university grad-uates, the cash payment share is not only the lowest but has also shrunk the most. Furthermore, a life cycle analysis reveals that, above all, younger and older people process a high percentage of their payments in cash. In general, the growing use of
26 Penz et al. (2004) examine, above all, people’s association with the Quick e-purse function. However, their findings also show that “even established non-cash payment options such as credit and ATM cards were perceived as more abstract than handling cash” (p. 785).
How Are Payments Made in Austria?
Monetary Policy & the Economy Q2/06 ◊ 131
cashless payment means is observable for all the aforementioned character-istics in all categories over time.
What does the shift from cash to cashless payment means signify for cash demand? First, a greater propen-sity to make cashless payments has led to a marked decline in cash de-mand for transaction balances. Had payment habits not changed since 1996, cash demand would have been some 10% higher in 2005. However, as cash holdings used for direct trans-actions only make up a relatively small part of total cash in circulation, the impact of the change in payment habits on total cash in circulation is not very significant. The effect of the change in cash withdrawal habits (e.g. more frequent ATM withdrawals) on cash demand, on the other hand, is likely to have a stronger impact than the change in payment habits.
Second, the findings relating to changes in shares between various payment means show that cash shares have declined in all amount segments. This was almost exactly mirrored in reverse by growth in the share of debit card payments, in particular in the payment amount segment start-ing from EUR 25. At the same time, in terms of amount, debit card pay-ments have been tending to get smaller since 1996. If this trend con-tinues, cash will probably be further squeezed in the small-value segment. Likewise, the finding that younger people account for a far smaller cash share than older people suggests that the share of cash payments will con-tinue to shrink over the next few years.
However, it is not easy to estimate the extent to which the share of cash as a percentage of total payments will contract. This will depend not least on how rapidly the range of cashless payment options will grow and how actively consumers will make use thereof. In terms of actual user be-havior, the findings suggest that pay-ment habits only change very slowly in reality. When asked why they would prefer cash to card payments, 44% of debit card holders claim to use cash from force of habit. Also, re-spondents attach great importance to the fact that cash allows them to con-trol their spending better: 46% say that cash payments enable them to keep better track of their spending, 32% cite as a reason their belief that they spend less when making cash payments.
In conclusion, we can therefore observe that cash, as expected, has become less important as a means of payment and will continue to do so in future. However, it is currently still by far the most important payment means, irrespective of sociodemo-graphic characteristics or payment amounts. As a result, the anticipated future contraction in the cash share of total payments will not signifi-cantly erode the dominant position of cash as a means of payment. As in the past, moreover, changes in payment habits will not emerge overnight. From a monetary policy perspective, therefore, the impact of structural changes on Austrian households’ pay-ment habits can be expected to re-main minor in the medium term.

How Are Payments Made in Austria?
132 ◊ Monetary Policy & the Economy Q2/06
ReferencesDrehmann, M., C. Goodhart and M. Krüger. 2002. The Challenges Facing Currency
Usage: Will the Traditional Transaction Medium Be Able to Resist Competition from the
New Technologies? In: Economic Policy 34. April. 193–218.
ECB. 2006. Blue Book – Security Settlement Systems in the European Union and in the
Acceding Countries.
http://www.ecb.int/pub/pdf/other/bluebook2006addenden.pdf (as of March 9, 2006).
Gresvik, O. and G. Owre. 2003. Costs and Income in the Norwegian Payment System
2001. An Application of the Activity Based Costing Framework. Norges Bank. Working
Paper 2003/8.
Handler, H. and P. Mooslechner. 1991. Zahlungsverkehrssysteme und Zahlungsverkehr
in Österreich. WIFO report. Vienna.
Humphrey, D. B., L. B. Pulley and J. M. Vesala. 2000. The Check’s in the Mail: Why
the United States Lags in the Adoption of Cost-Saving Electronic Payments. In: Journal of
Financial Services Research 17(1). 17–39.
Knell, M. and H. Stix. 2006. Three Decades of Money Demand Studies. Differences and
Similarities. In: Applied Economics. Mimeo.
Markose, S. M. and Y. J. Loke. 2003. Network Effects on Cash-Card Substitution in
Transactions and Low Interest Rate Regimes. In: The Economic Journal 113. April.
456–476.
Mooslechner, P. and G. Wehinger. 1997. The Payment Habits of Austrian Private
Households. In: Focus on Austria 4. OeNB. 26–45.
Mooslechner, P., H. Stix and K. Wagner. 2002. The Payment Habits of Austrian House-
holds – Results of a Study on the Use of Payment Cards and the Structure of Payment
Transactions in 2000. In: Focus on Austria 1. OeNB. 89–117.
Penz, E., K. Meier-Pesti and E. Kirchler. 2004. It’s practical, but no more controllable:
Social Representations of the Electronic Purse in Austria. In: Journal of Economic
Psychology 25. 771–787.
Schmitz, S. W. and G. E. Wood (eds.). 2006. Institutional Change in the Payment
System and Monetary Policy. Routledge. Mimeo.
Stix, H. 2002. Die Auswirkungen von elektronischem Geld auf die Geldpolitik. In:
Wirtschaftspolitische Blätter 2. 110–119.
Stix, H. 2004a. The Impact of ATM Transactions and Cashless Payments on Cash Demand
in Austria. In: Monetary Policy & the Economy Q1/04. OeNB. 90–105.
Stix, H. 2004b. How Do Debit Cards Affect Cash Demand? Survey Data Evidence. In:
Empirica 31(2–3). 93–115.
Stix, H. 2006. Zahlungsverhalten und Bargeldverwendung in Österreich. In: Lammer, T.
(ed.). Handbuch eMoney, ePayment & mPayment. Physica-Verlag: Heidelberg. 43–55.
Suomen Pankki – Finlands Bank. 2006. Costs of Cash. (Study scheduled for publication
in 2006).

How Are Payments Made in Austria?
Monetary Policy & the Economy Q2/06 ◊ 133
AnnexTable 5
Some Key Figures For Sample Comparability
1996 2000 2005
Number of transactions 14,247 14,805 14,075
Transactions per person per week 11.1 12.3 11.7
= Transactions per day 1.6 1.8 1.7
Median of the number of transactions 12 12 11
= Median of transactions per day 1.7 1.7 1.6
Mode of number of transactions 13 10 9
EUR
Payment amount 319,760 341,562 375,559
(a) Total volume per person per week 240.2 283.7 311.9
(b) Median of the payment amount per week 203.5 222.7 226.0
= Median of the payment amount per day 29.1 31.8 32.3
%
Growth rate of (a) x 18.1 10.0
Growth rate of (b) x 9.4 1.5
Retail sales growth rate, nominal x x 3.3
Consumption expenditures growth rate, nominal x 14.0 16.0
Source: Authors‘ calculations based on an OeNB survey (payment diary), Statistics Austria.
Note: This table presents an overview of some statistical key figures obtained from the surveys. The data are based on payments recorded
by respondents (payment diary) in the 1996, 2000 and 2005 surveys. The mode of the number of transactions in 1996 is bigger, as up
to 15 individual transactions per day were recorded in 1996, compared with a maximum of ten payment transactions per day re-
corded in 2000 and 2005.

How Are Payments Made in Austria?
134 ◊ Monetary Policy & the Economy Q2/06
Table 6
Payment Structure by Sector in 2005
%
Share of sector
Cash Debit cards Credit cards
Loyalty cards
Quick e-purse function
Checks Internet payments
Shares of payment means in total payment value
Restaurants, hotels 9.4 94.7 2.0 3.3 0.0 0.0 0.0 0.0
Food stores, supermarkets 25.0 78.8 20.4 0.4 0.1 0.3 0.0 0.0
Department stores and DIY stores 4.9 62.5 31.2 3.4 0.5 0.2 1.6 0.5
Household appliances, glass and metal goods 1.9 85.1 14.6 0.0 0.0 0.0 0.3 0.0
Newspaper and tobacco shops 3.8 95.1 4.9 0.0 0.0 0.0 0.0 0.0
Clothing and fabrics 6.9 44.7 38.7 15.6 0.0 0.8 0.1 0.0
Shoes and leather goods 2.8 67.7 26.6 5.7 0.0 0.0 0.0 0.0
Pharmacies, drugstores, cosmetics stores 5.5 81.9 14.5 2.9 0.0 0.7 0.0 0.0
Furniture and home fabrics 3.0 22.6 62.8 14.6 0.0 0.0 0.0 0.0
Cars and accessories 4.3 67.5 24.1 1.4 0.0 0.0 7.0 0.0
Gas stations and fuel shops 7.9 57.0 28.8 8.5 5.3 0.2 0.0 0.2
Transport (public transport tickets, toll etc.) andcommunications 1.6 62.2 26.1 7.7 0.1 0.4 3.2 0.4
CDs, DVDs and sound storage media 1.0 61.4 25.3 2.7 0.0 0.0 0.0 10.6
Electrical equipment, computer (incl. software and
accessories) 2.7 58.1 33.8 6.3 0.3 0.2 1.0 0.4
Opticians, photo shops 1.4 62.4 35.8 1.6 0.0 0.0 0.0 0.2
Watches and jewelry 0.3 47.4 47.5 0.0 0.8 0.0 4.4 0.0
Books, paper, office supplies 2.2 66.9 27.9 3.3 0.0 0.0 0.0 1.9
Toys, sporting goods and musical instruments 1.0 47.0 38.3 5.1 3.8 0.0 0.0 5.8
Florists 1.2 93.1 5.6 0.4 0.0 0.0 0.0 0.9
Art, entertainment, sport 3.3 84.8 9.8 3.3 0.0 0.0 0.6 1.6
Housing costs (rent, running costs, repairs) 5.4 45.5 33.1 0.4 1.3 0.0 10.1 9.6
Vacations, travel agencies, airline tickets 1.6 42.5 20.1 35.1 0.0 0.0 2.3 0.0
Other 2.2 86.6 5.5 0.7 0.0 0.0 1.7 5.5
No response 0.6 87.7 11.5 0.8 0.0 0.0 0.0 0.0
Total x 70.2 22.6 4.3 0.6 0.2 1.1 1.0
Number of transactions x 11,663 1,558 176 51 32 30 37
Source: Authors’ calculations based on an OeNB survey (payment diary).
Note: This table shows the share of the payment means used in the total payment value in the relevant sector. The data are based on the payments (payment diary) recorded by
respondents within a one-week period. Many sectors were recategorized in 1996 and 2000. The share of the sector corresponds to the value of the transactions made in the
relevant sector as a share in the total payment value.