financial statement analysis assoc.prof. oktay taş dr. kaya tokmakçıoğlu
TRANSCRIPT

Financial Statement Analysis
Assoc.Prof. Oktay TaşDr. Kaya Tokmakçıoğlu
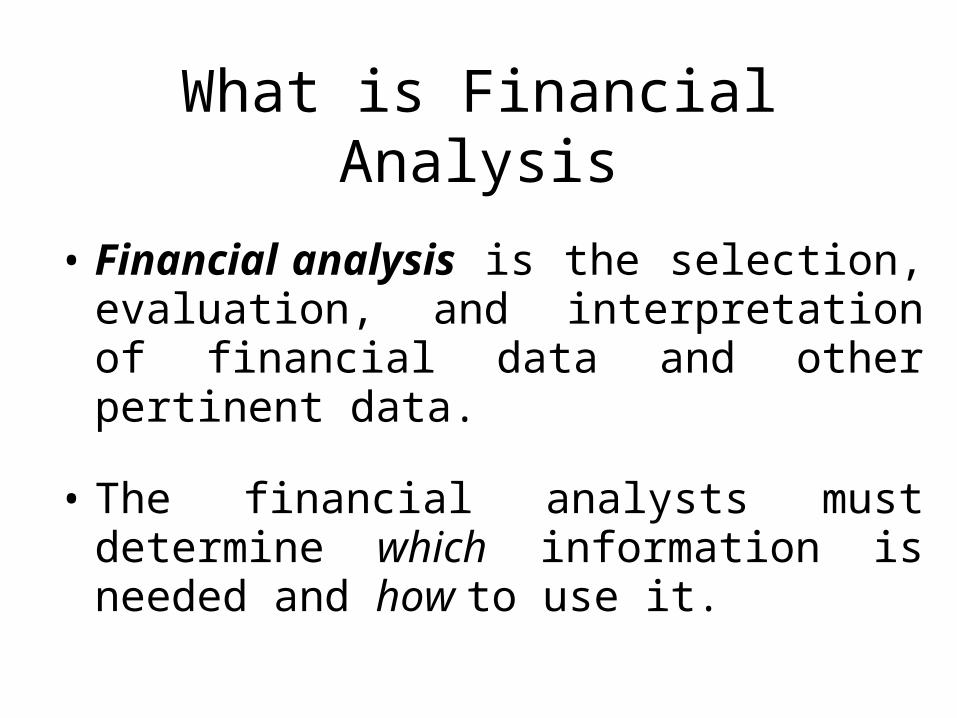
What is Financial Analysis
• Financial analysis is the selection, evaluation, and interpretation of financial data and other pertinent data.
• The financial analysts must determine which information is needed and how to use it.

Financial Analysis-Information
• Aside from financial data, other information is necessary in the prediction of future financial condition or operating performance of a firm.
• Examples: gross domestic product, the consumer price index, purchasing price index, rate of inflation, and corporate specific events (e.g., mergers, patents, industry of buss.)

Internal Users External Users
Financial statement analysis helps users make better decisions.
Financial statement analysis helps users make better decisions.
ManagersOfficers
Internal Auditors
ShareholdersLenders
Customers
Purpose of Analysis

Grow thin sales
Return tostockholders
Profitm argins
Return onequity
Determ ined byanalyzing the
financialstatem ents.
F in anc ia l m easu res a re o ften u sedto ran k co rp ora te perfo rm an ce.
E xam p le m easu res in c lu d e:
Purpose of Analysis

What do we need for the Financial Statement Analysis?
– Financial statements– Notes to Financial Statements.– The definition of accounting methods– Auditing reports– 5-10 years financial information

Resultsin standardized,
m eaningfulsubtotals.
Item s w ith certaincharacteristics aregrouped together.
C lass ifiedF in an c ial
S ta tem en ts
Helps identifysignificant
changes andtrends.
Am ounts fromseveral years
appear side by side.
C o m p ara tiveF in an c ial
S ta tem en ts
Presented as ifthe tw o com panies
are a singlebusiness unit.
Inform ation for theparent and subsidiary
are presented.
C o nso lida tedF in an c ial
S ta tem en ts
Financial Statements Are Designed for Analysis

Dollar & Percentage
Changes
Trend Percentages
Component Percentages
Ratios
Tools of Analysis

Horizontal Analysis
Increase/(Decrease) 2002 2001 Amount Percent
Sales 41,500 37,850 3,650 9.6%Expense 40,000 36,900 3,100 8.4%Net Income 1,500 950 550 57.9%
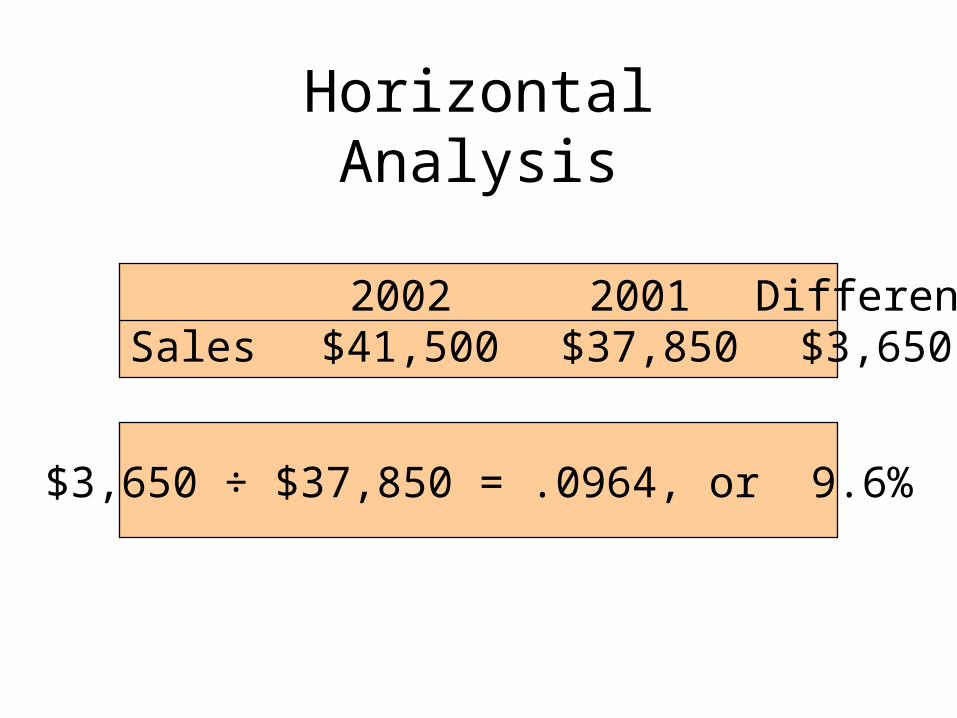
2002 2001 DifferenceSales $41,500 $37,850 $3,650
$3,650 ÷ $37,850 = .0964, or 9.6%
Horizontal Analysis

Dollar Change:
Analysis Period Amount
Base PeriodAmount
DollarChange = –
Percentage Change:
Dollar Change Base PeriodAmount
PercentChange = ÷%%%%
Dollar and Percentage Changes

Sales and earningsshould increase atm ore that the rate
of inflation.
In m easuring quarterlychanges, compare tothe sam e quarter inthe previous year.
Percentages m ay bem isleading when the
base am ount is sm all.
E va lu atin g Percen tag e C han g esin S a les an d Earn in gs
Dollar and Percentage Changes

Let’s look at the asset section of Clover, Inc. comparative balance sheet and
income statement for 2005 and 2004.Compute the dollar change and the percentage
change for cash.
Let’s look at the asset section of Clover, Inc. comparative balance sheet and
income statement for 2005 and 2004.Compute the dollar change and the percentage
change for cash.
Dollar and Percentage Changes
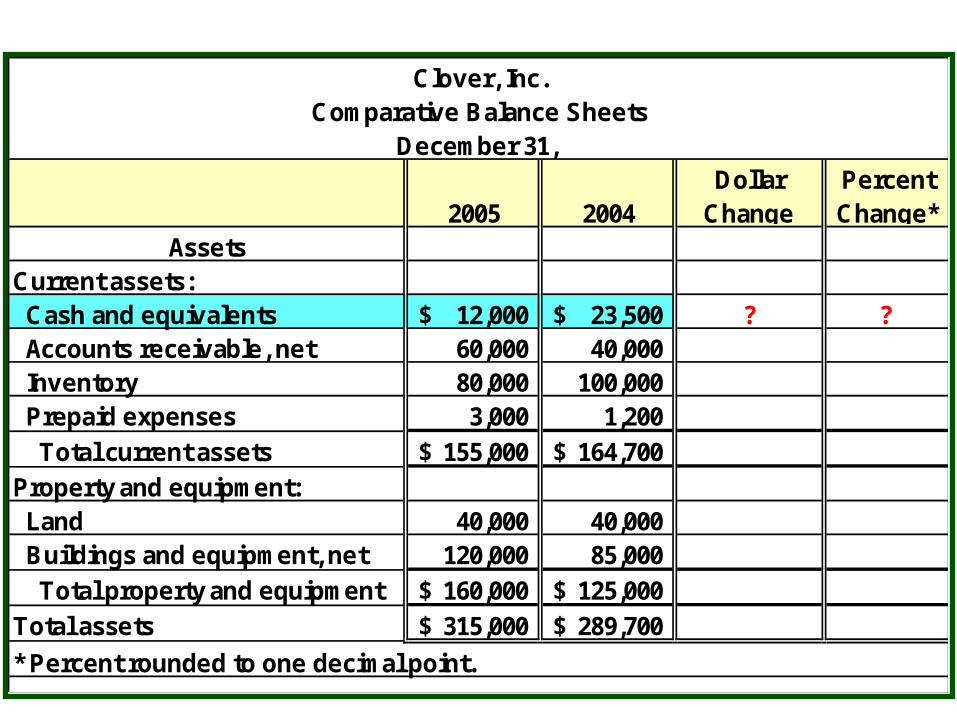
Clover, Inc.Comparative Balance Sheets
December 31,
2005 2004Dollar
ChangePercent Change*
AssetsCurrent assets: Cash and equivalents 12,000$ 23,500$ ? ? Accounts receivable, net 60,000 40,000 Inventory 80,000 100,000 Prepaid expenses 3,000 1,200
Total current assets 155,000$ 164,700$
Property and equipment: Land 40,000 40,000 Buildings and equipment, net 120,000 85,000
Total property and equipment 160,000$ 125,000$
Total assets 315,000$ 289,700$
* Percent rounded to one decimal point.
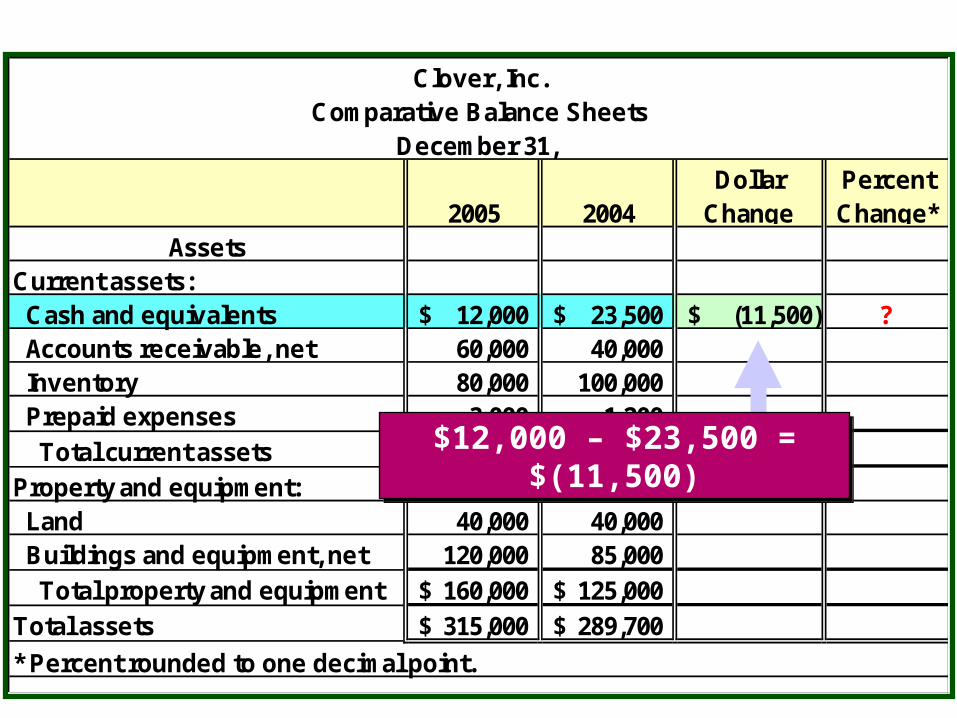
Clover, Inc.Comparative Balance Sheets
December 31,
2005 2004Dollar
ChangePercent Change*
AssetsCurrent assets: Cash and equivalents 12,000$ 23,500$ (11,500)$ ? Accounts receivable, net 60,000 40,000 Inventory 80,000 100,000 Prepaid expenses 3,000 1,200
Total current assets 155,000$ 164,700$
Property and equipment: Land 40,000 40,000 Buildings and equipment, net 120,000 85,000
Total property and equipment 160,000$ 125,000$
Total assets 315,000$ 289,700$
* Percent rounded to one decimal point.
$12,000 – $23,500 = $(11,500)$12,000 – $23,500 = $(11,500)

Clover, Inc.Comparative Balance Sheets
December 31,
2005 2004Dollar
ChangePercent Change*
AssetsCurrent assets: Cash and equivalents 12,000$ 23,500$ (11,500)$ -48.9% Accounts receivable, net 60,000 40,000 Inventory 80,000 100,000 Prepaid expenses 3,000 1,200
Total current assets 155,000$ 164,700$
Property and equipment: Land 40,000 40,000 Buildings and equipment, net 120,000 85,000
Total property and equipment 160,000$ 125,000$
Total assets 315,000$ 289,700$
* Percent rounded to one decimal point.
($11,500 ÷ $23,500) × 100% = 48.94%($11,500 ÷ $23,500) × 100% = 48.94%
Complete the analysis for
the other assets.
Complete the analysis for
the other assets.

Clover, Inc.Comparative Balance Sheets
December 31,
2005 2004Dollar
ChangePercent Change*
AssetsCurrent assets: Cash and equivalents 12,000$ 23,500$ (11,500)$ -48.9% Accounts receivable, net 60,000 40,000 20,000 50.0% Inventory 80,000 100,000 (20,000) -20.0% Prepaid expenses 3,000 1,200 1,800 150.0%
Total current assets 155,000$ 164,700$ (9,700) -5.9%
Property and equipment: Land 40,000 40,000 - 0.0% Buildings and equipment, net 120,000 85,000 35,000 41.2%
Total property and equipment 160,000$ 125,000$ 35,000 28.0%
Total assets 315,000$ 289,700$ 25,300$ 8.7%
* Percent rounded to one decimal point.
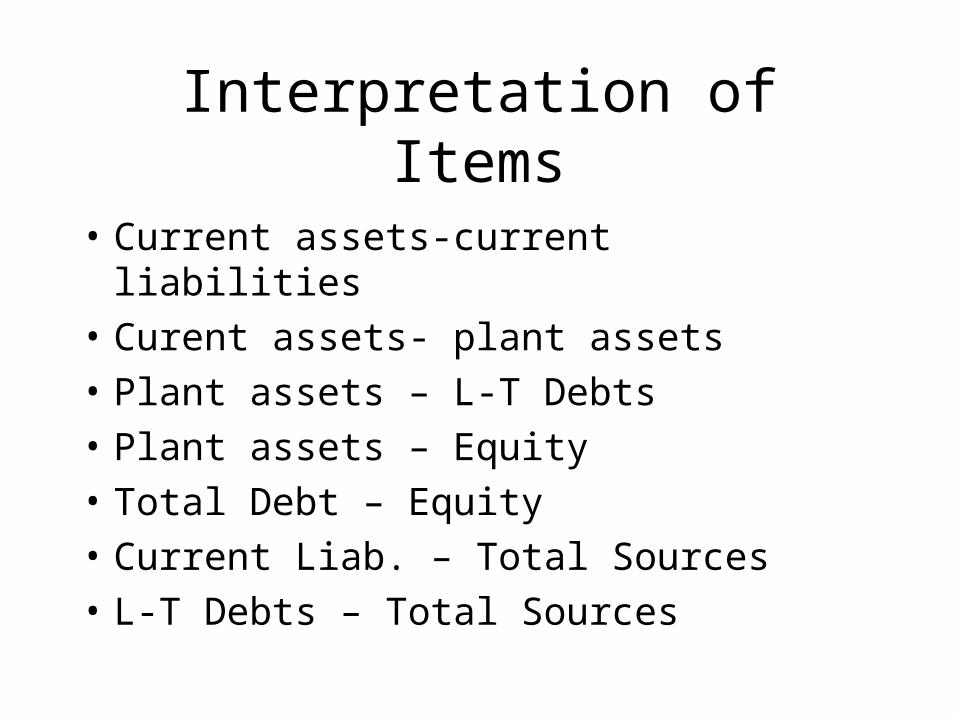
Interpretation of Items
• Current assets-current liabilities
• Curent assets- plant assets
• Plant assets – L-T Debts
• Plant assets – Equity
• Total Debt – Equity
• Current Liab. – Total Sources
• L-T Debts – Total Sources

Intrepretation of Items
• Accounts recbl.- Accounts payable
• Accounts receivable – Sales
• Inventory – Sales
• Sales – COGS
• Sales – Gross Profit
• Sales – Operating Income
• Sales – Net Income

Trend Analysis
– are computed by selecting a base year whose amounts are set equal to 100%.
• The amounts of each following year are expressed as a percentage of the base amount.
Trend % = Any year $ ÷ Base year $

Year 2000 1999 1998Revenues $27,611 $24,215 $21,718Cost of sales 15,318 14,709 13,049Gross profit $12,293 $ 9,506 $ 8,6691998 is the base year.
What are the trend percentages?
Trend Percentages

Year 2000 1999 1998Revenues 127% 111% 100%Cost of sales 117% 113% 100%Gross profit 142% 110% 100%
Trend Percentages
These percentages were calculated bydividing each item by the base year.
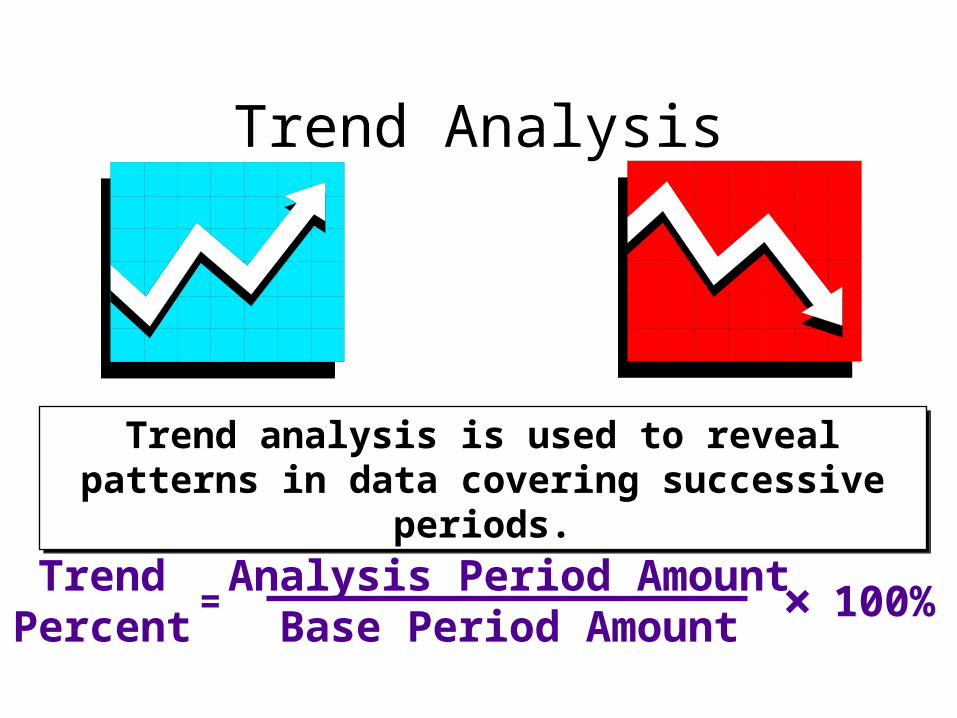
Trend analysis is used to reveal patterns in data covering successive periods.
Trend analysis is used to reveal patterns in data covering successive periods.
TrendPercent
Analysis Period Amount Base Period Amount
100%= ×
Trend Analysis

2001 is the base period so its amounts will equal 100%.
2001 is the base period so its amounts will equal 100%.
Berry ProductsIncome Information
For the Years Ended December 31, Item 2005 2004 2003 2002 2001
Revenues 400,000$ 355,000$ 320,000$ 290,000$ 275,000$ Cost of sales 285,000 250,000 225,000 198,000 190,000 Gross profit 115,000 105,000 95,000 92,000 85,000
Item 2004 2004 2003 2002 2001Revenues 145% 129% 116% 105% 100%Cost of sales 150% 132% 118% 104% 100%Gross profit 135% 124% 112% 108% 100%
(290,000 275,000) 100% = 105%(198,000 190,000) 100% = 104%(92,000 85,000) 100% = 108%
Trend Analysis

Examine the relative size of each item in the financial statements by computing component
(or common-sized) percentages.
Component Percent
100%Analysis Amount
Base Amount= ×
Financial Statement Base Amount
Balance Sheet Total Assets
Income Statement Revenues
Financial Statement Base Amount
Balance Sheet Total Assets
Income Statement Revenues
Component Percentages
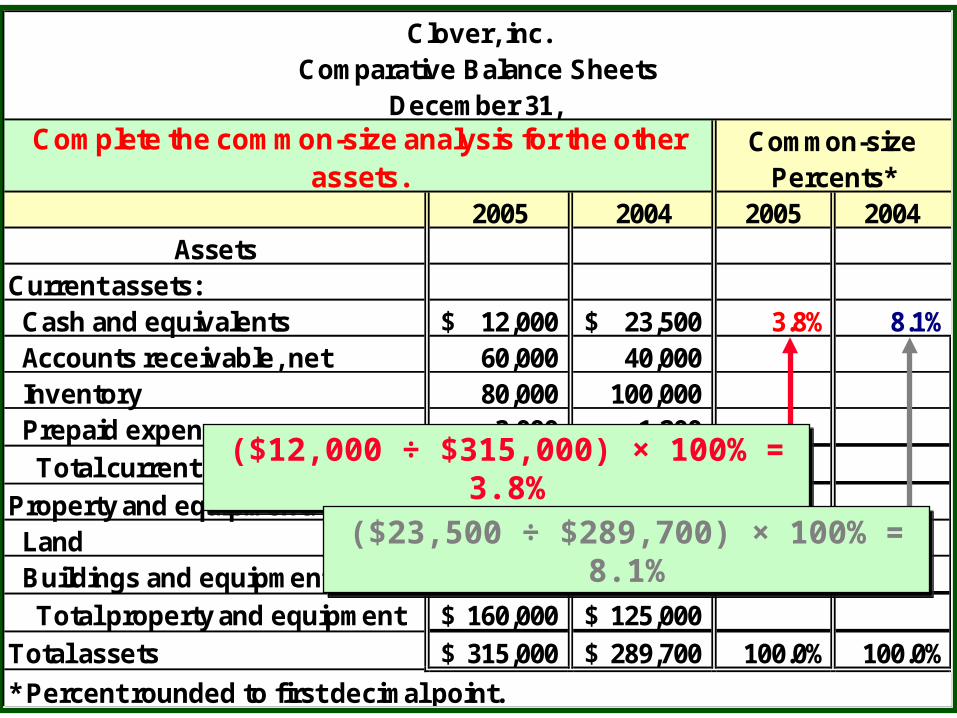
Clover, inc.Comparative Balance Sheets
December 31, Common-size
Percents*2005 2004 2005 2004
AssetsCurrent assets: Cash and equivalents 12,000$ 23,500$ 3.8% 8.1% Accounts receivable, net 60,000 40,000 Inventory 80,000 100,000 Prepaid expenses 3,000 1,200
Total current assets 155,000$ 164,700$
Property and equipment: Land 40,000 40,000 Buildings and equipment, net 120,000 85,000
Total property and equipment 160,000$ 125,000$
Total assets 315,000$ 289,700$ 100.0% 100.0%
* Percent rounded to first decimal point.
Complete the common-size analysis for the other assets.
($12,000 ÷ $315,000) × 100% = 3.8%($12,000 ÷ $315,000) × 100% = 3.8%
($23,500 ÷ $289,700) × 100% = 8.1%($23,500 ÷ $289,700) × 100% = 8.1%

Clover, Inc.Comparative Balance Sheets
December 31,
Common-size
Percents*
2005 2004 2005 2004Assets
Current assets: Cash and equivalents 12,000$ 23,500$ 3.8% 8.1% Accounts receivable, net 60,000 40,000 19.0% 13.8% Inventory 80,000 100,000 25.4% 34.6% Prepaid expenses 3,000 1,200 1.0% 0.4%
Total current assets 155,000$ 164,700$ 49.2% 56.9%
Property and equipment: Land 40,000 40,000 12.7% 13.8% Buildings and equipment, net 120,000 85,000 38.1% 29.3%
Total property and equipment 160,000$ 125,000$ 50.8% 43.1%
Total assets 315,000$ 289,700$ 100.0% 100.0%
* Percent rounded to first decimal point.

Clover, Inc.Comparative Balance Sheets
December 31,
Common-size
Percents*
2005 2004 2005 2004Liabilities and Shareholders' Equity
Current liabilities: Accounts payable 67,000$ 44,000$ 21.3% 15.2% Notes payable 3,000 6,000 1.0% 2.1%
Total current liabilities 70,000$ 50,000$ 22.3% 17.3%
Long-term liabilities: Bonds payable, 8% 75,000 80,000 23.8% 27.6%
Total liabilities 145,000$ 130,000$ 46.1% 44.9%
Shareholders' equity: Preferred stock 20,000 20,000 6.3% 6.9% Common stock 60,000 60,000 19.0% 20.6% Additional paid-in capital 10,000 10,000 3.2% 3.5%
Total paid-in capital 90,000$ 90,000$ 28.5% 31.1%Retained earnings 80,000 69,700 25.4% 24.1%
Total shareholders' equity 170,000$ 159,700$ 53.9% 55.1%Total liabilities and shareholders' equity 315,000$ 289,700$ 100.0% 100.0%
* Percent rounded to first decimal point.
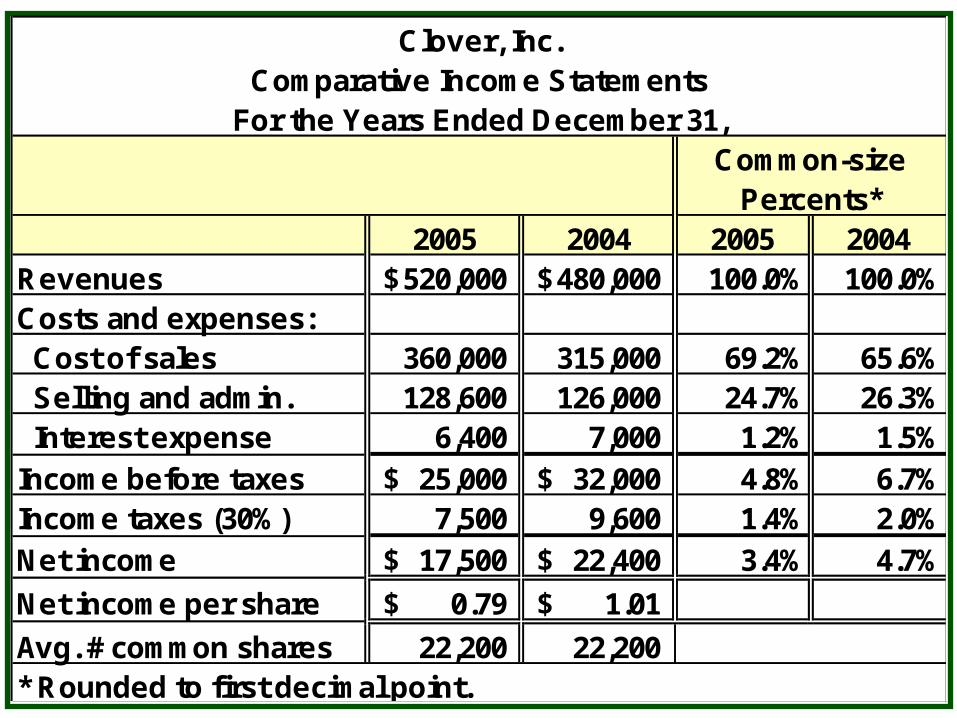
Clover, Inc.Comparative Income Statements
For the Years Ended December 31,Common-size
Percents*2005 2004 2005 2004
Revenues 520,000$ 480,000$ 100.0% 100.0%Costs and expenses: Cost of sales 360,000 315,000 69.2% 65.6% Selling and admin. 128,600 126,000 24.7% 26.3% Interest expense 6,400 7,000 1.2% 1.5%
Income before taxes 25,000$ 32,000$ 4.8% 6.7%Income taxes (30%) 7,500 9,600 1.4% 2.0%
Net income 17,500$ 22,400$ 3.4% 4.7%
Net income per share 0.79$ 1.01$
Avg. # common shares 22,200 22,200 * Rounded to first decimal point.
Ratios
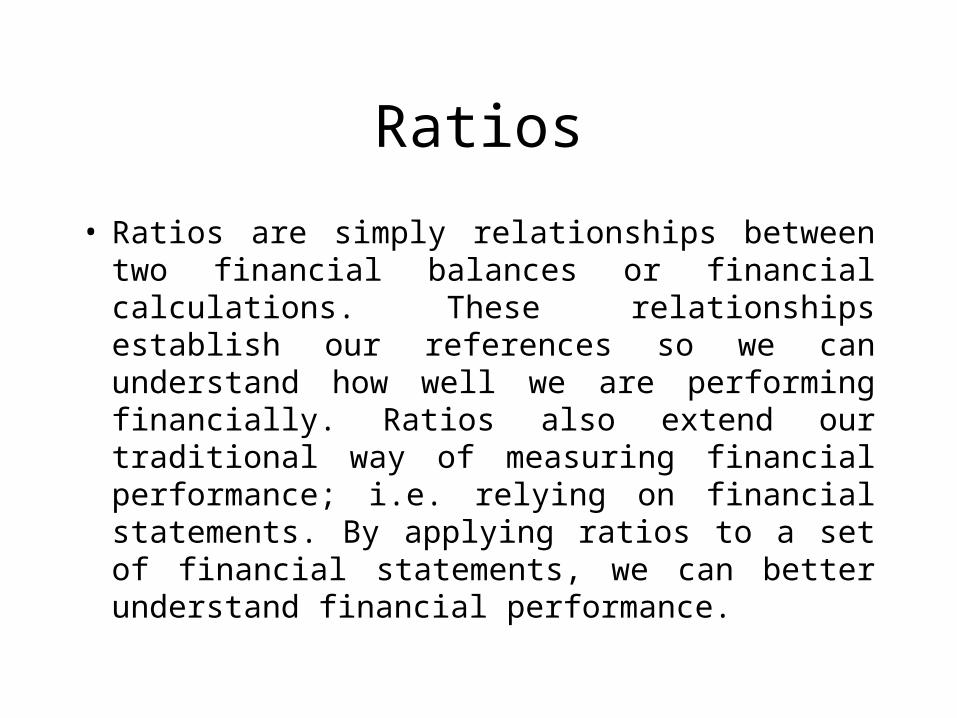
• Ratios are simply relationships between two financial balances or financial calculations. These relationships establish our references so we can understand how well we are performing financially. Ratios also extend our traditional way of measuring financial performance; i.e. relying on financial statements. By applying ratios to a set of financial statements, we can better understand financial performance.

Past perform ance topresent perform ance.
O ther companies toyour com pany.
Along w ith dollar and percentage changes,trend percentages, and com ponent percentages,
ratios can be used to com pare:
A ratio is a simple mathem atical expressionof the relationship betw een one item and another.
Ratios

Why are ratios useful
• Ratios standardize numbers and facilitate comparisons.
• Ratios are used to highlight weaknesses and strengths.
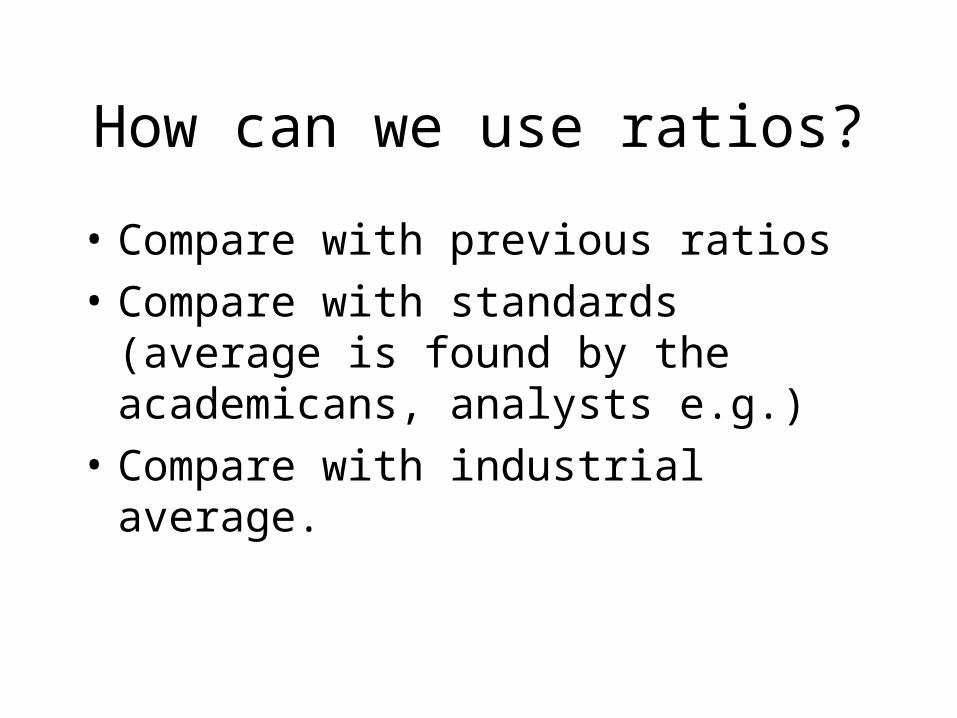
How can we use ratios?
• Compare with previous ratios
• Compare with standards (average is found by the academicans, analysts e.g.)
• Compare with industrial average.

What are the five major categories of ratios, and what questions do they
answer?• Liquidity ratios: Can we make required payments?• Activity ratios Asset management: right amount of
assets vs. sales?• Debt management ratios (leverage Ratios): Right
mix of debt and equity?• Profitability: Do sales prices exceed unit costs,
and are sales high enough as reflected in PM, ROE, and ROA?
• Market value: Do investors like what they see as reflected in P/E and M/B ratios?

Type of ratios
• Liquidity ratios provide information on a firm's ability to meet its short-term obligations.
• Activity ratios relate information on a firm's ability to manage its resources (that is, its assets) efficiently.

Type of ratios
• Financial leverage ratios provide information on the degree of a firm's fixed financing obligations and its ability to satisfy these financing obligations.
• Profitability ratios provide information on the amount of income from each dollar of sales.

Type of ratios
• Return on investment ratios provide information on the amount of profit, relative to the assets employed to produce that profit.
• Shareholder ratios describe the firm's financial condition in terms of amounts per share of stock.
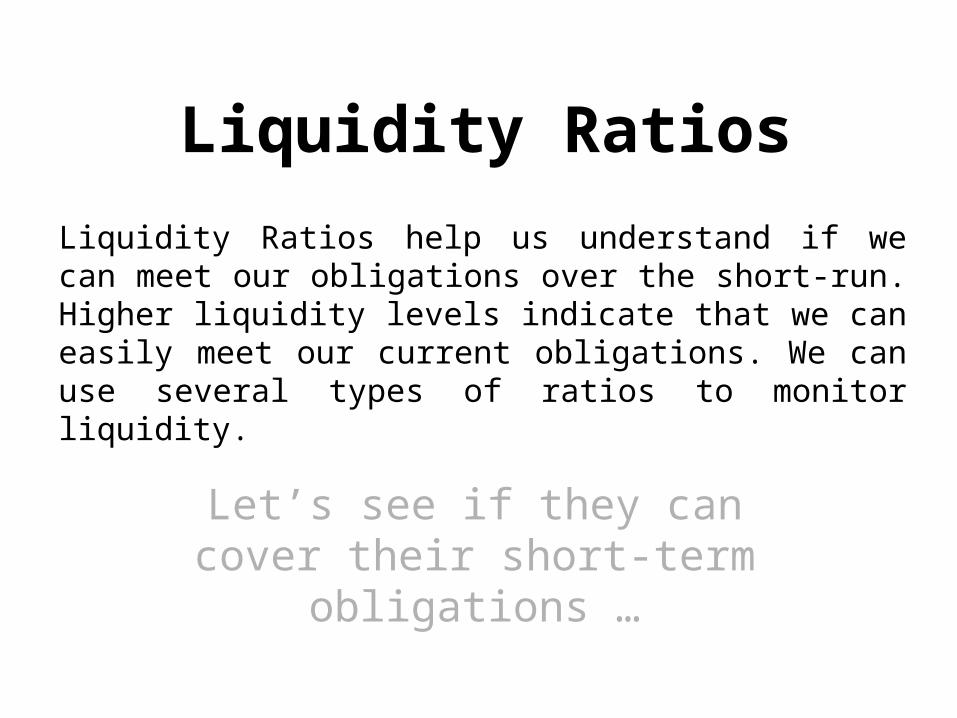
Liquidity Ratios
Let’s see if they can cover their short-term obligations …
Liquidity Ratios help us understand if we can meet our obligations over the short-run. Higher liquidity levels indicate that we can easily meet our current obligations. We can use several types of ratios to monitor liquidity.

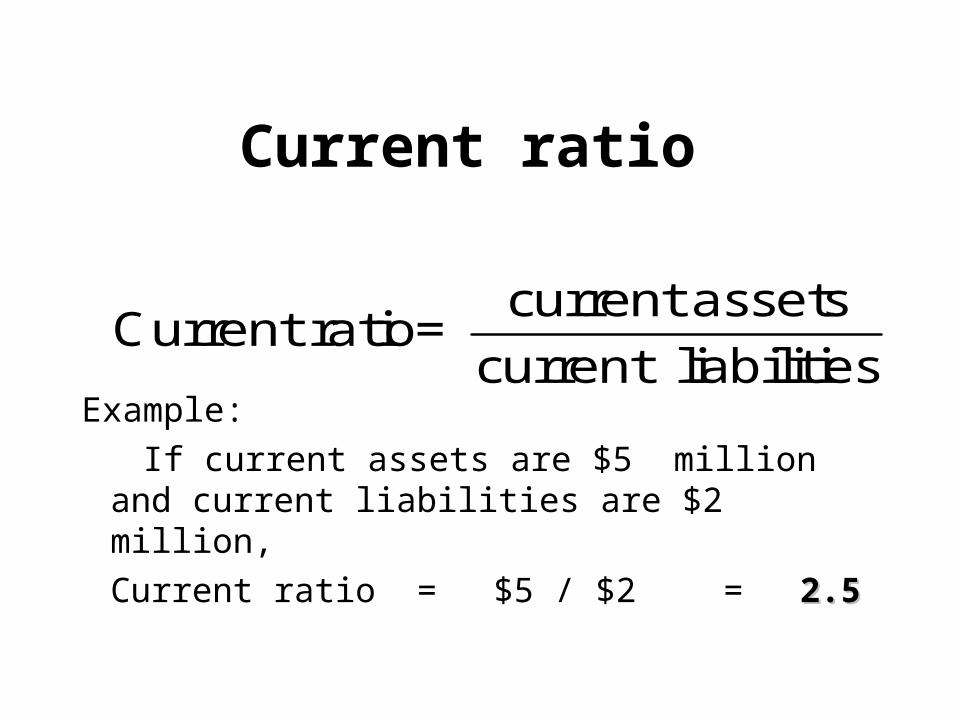
Liquidity ratios• The current ratio is the ratio of current assets
to current liabilities; indicates a firm's ability to satisfy its current liabilities with its current assets.
• Quick ratio is the ratio of quick assets (generally current assets less inventory) to current liabilities; indicates a firm's ability to satisfy current liabilities with its most liquid assets.
Current ratio
current assetsCurrent ratio=
current liabilitiesExample:
If current assets are $5 million and current liabilities are $2 million,
Current ratio = $5 / $2 = 2.52.5

Comments on current ratio
2003 2002 2001 Ind.
Current
ratio2.34x 1.20x 2.30x 2.70x
• Expected to improve but still below the industry average.
• Liquidity position is weak.

Quick ratio
sliabilitie current
inventoryassets currentratio Quick
Also referred to as the acid test ratio or liquidity ratio

Liquidity ratios: example
Suppose the firm has the following:
Cash $ 5Accounts receivables 16Inventory 20Accounts payable 12
a. What is the firm’s current ratio?
b. What is the firm’s quick ratio?

Liquidity ratios: example, cont.
Cash $ 5Accounts receivables 16Inventory 20Accounts payable 12
a. What is the firm’s current ratio?
Current ratio = ($5 + 16 + 20) / $12 = 3.423.42
b.What is the firm’s quick ratio?
Quick ratio = ($5 + 16) / $12 = 1.751.75
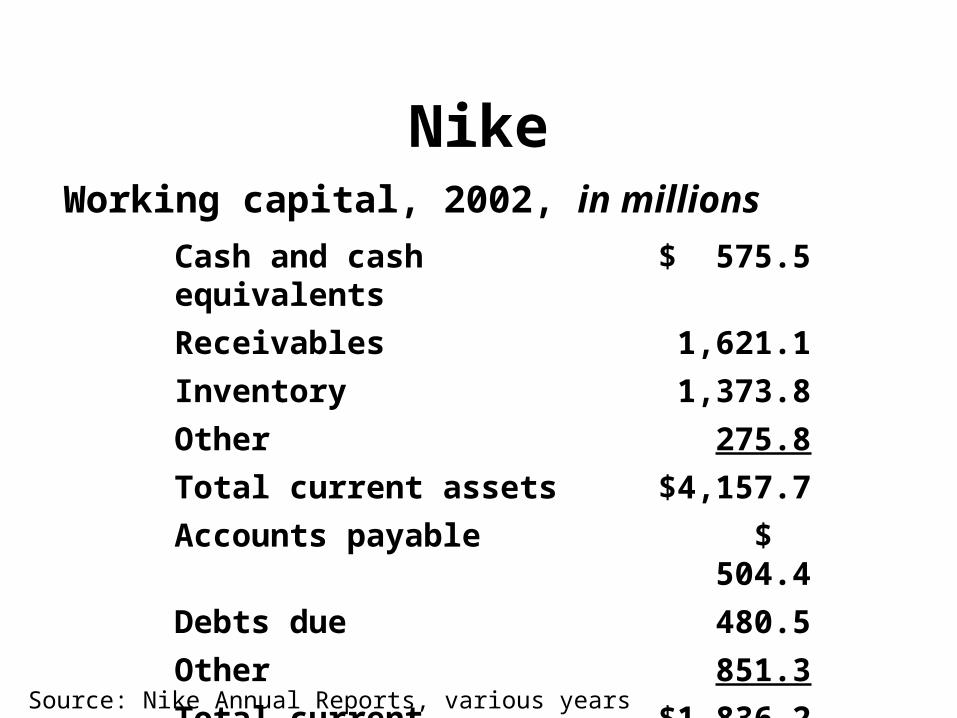
Nike
Cash and cash equivalents $ 575.5
Receivables 1,621.1
Inventory 1,373.8
Other 275.8
Total current assets $4,157.7
Accounts payable $ 504.4
Debts due 480.5
Other 851.3
Total current liabilities $1,836.2
Working capital, 2002, in millions
Source: Nike Annual Reports, various years

Problem
• Suppose a company has a current ratio of 1.5 and a quick ratio of 0.8. If its current liabilities are $2 million, what is its inventory?

Activity ratios
But are they any good at this stuff?
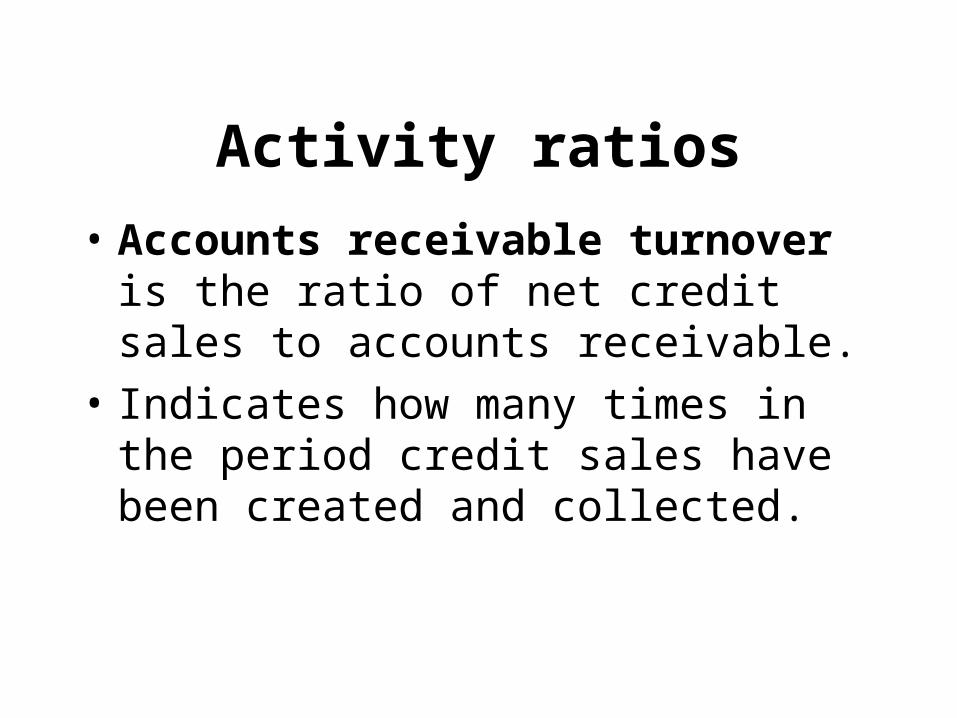
Activity ratios
• Accounts receivable turnover is the ratio of net credit sales to accounts receivable.
• Indicates how many times in the period credit sales have been created and collected.

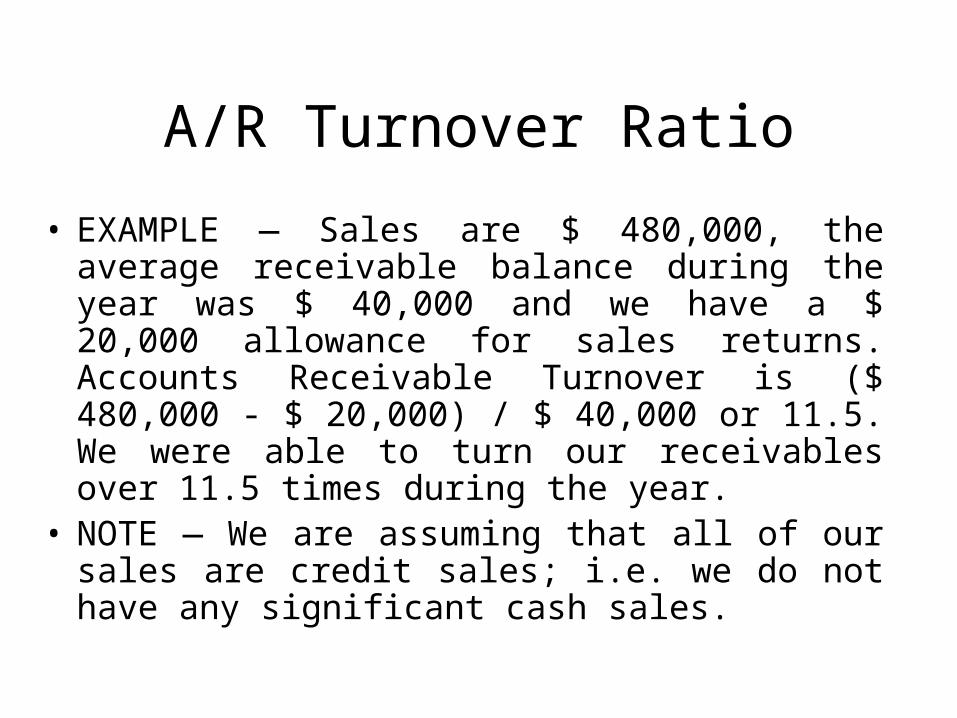
A/R Turnover Ratio
• Accounts Receivable Turnover measures the number of times we were able to convert our receivables over into cash. Higher turnover ratios are desirable.
•Net Sales / Average Accounts Receivable•Avrg. accounts receivable = (Beg.A/R + End. A/R) / 2
If there is only one year of information can be calculated as follows:
times..sreceivable accounts
salescredit = turnover A/R
A/R Turnover Ratio
• EXAMPLE — Sales are $ 480,000, the average receivable balance during the year was $ 40,000 and we have a $ 20,000 allowance for sales returns. Accounts Receivable Turnover is ($ 480,000 - $ 20,000) / $ 40,000 or 11.5. We were able to turn our receivables over 11.5 times during the year.
• NOTE — We are assuming that all of our sales are credit sales; i.e. we do not have any significant cash sales.

Number of Days in Accounts Receivable
• The Number of Days in Accounts Receivable is the average length of time required to collect our receivables. A low number of days is desirable. Days in Accounts Receivable is calculated as follows:
365 or 360 / Accounts Receivable Turnover Ratio
• EXAMPLE — If we refer to our previous example and we base our calculation on the full calendar year, we would require 32 days on average to collect our receivables. 365 / 11.5 = 32 days.

Inventory Turnover Ratio•Inventory Turnover is similar to accounts receivable turnover. We are measuring how many times did we turn our inventory over during the year. Higher turnover rates are desirable. A high turnover rate implies that management does not hold onto excess inventories and our inventories are highly marketable. Inventory Turnover is calculated as follows:
Cost of Sales / Average Inventory Avrg.Inventory = (Beg.Inventory + End.Inventory) / 2
EXAMPLE — Cost of Sales were $ 192,000 and the average inventory balance during the year was $ 120,000. The Inventory Turnover Rate is 1.6 or we were able to turn our inventory over 1.6 times during the year.
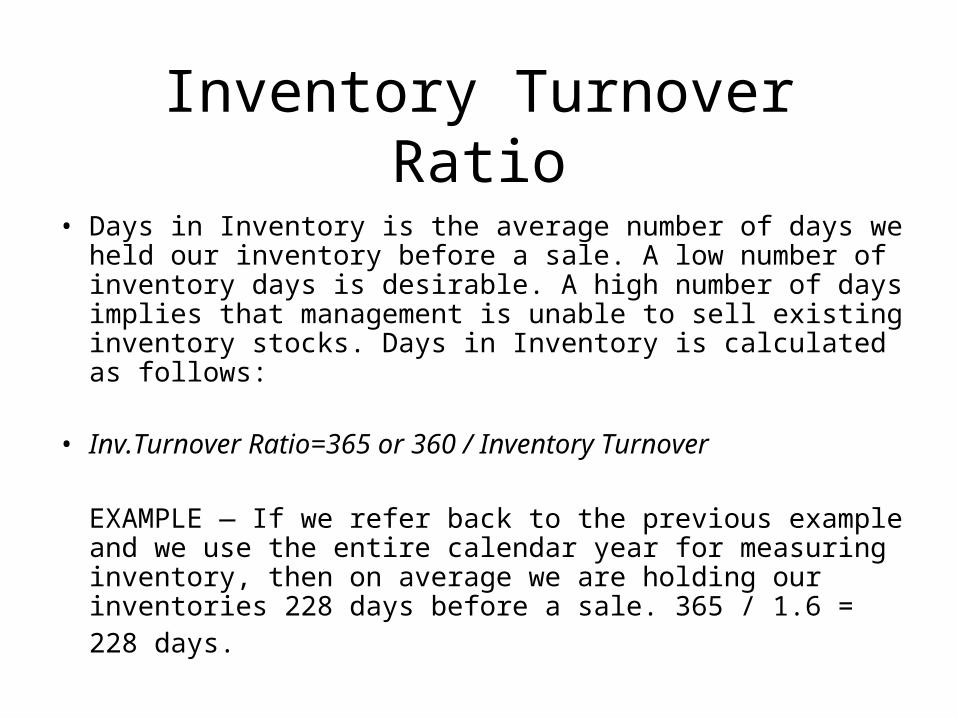
Inventory Turnover Ratio
• Days in Inventory is the average number of days we held our inventory before a sale. A low number of inventory days is desirable. A high number of days implies that management is unable to sell existing inventory stocks. Days in Inventory is calculated as follows:
• Inv.Turnover Ratio=365 or 360 / Inventory Turnover
EXAMPLE — If we refer back to the previous example and we use the entire calendar year for measuring inventory, then on average we are holding our inventories 228 days before a sale. 365 / 1.6 = 228 days.
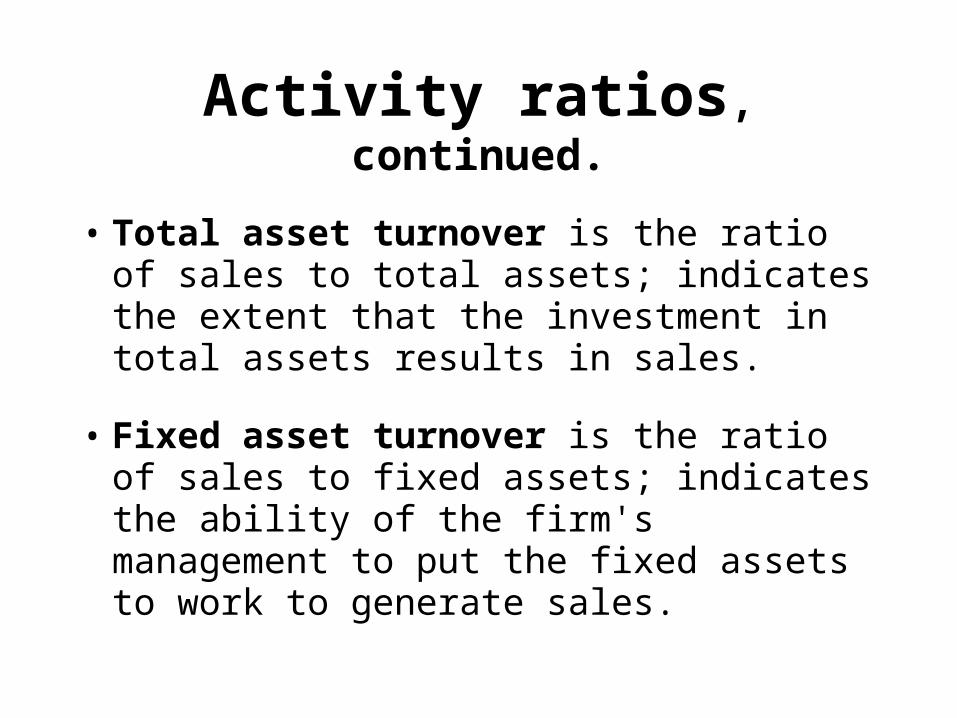
Activity ratios, continued.
• Total asset turnover is the ratio of sales to total assets; indicates the extent that the investment in total assets results in sales.
• Fixed asset turnover is the ratio of sales to fixed assets; indicates the ability of the firm's management to put the fixed assets to work to generate sales.
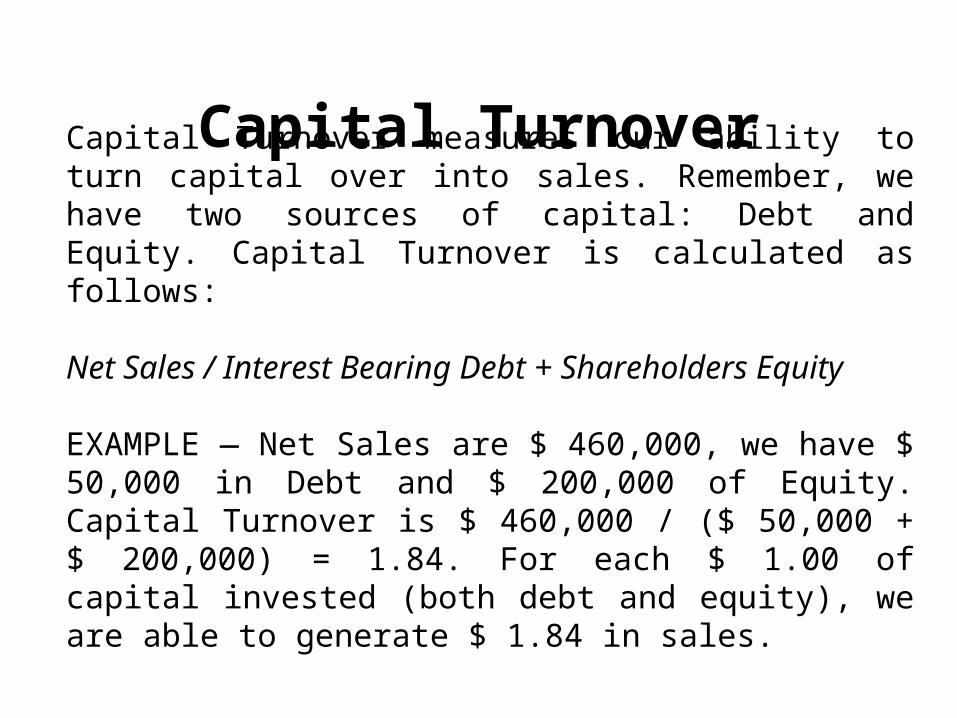
Capital TurnoverCapital Turnover measures our ability to turn capital over into sales. Remember, we have two sources of capital: Debt and Equity. Capital Turnover is calculated as follows:
Net Sales / Interest Bearing Debt + Shareholders Equity
EXAMPLE — Net Sales are $ 460,000, we have $ 50,000 in Debt and $ 200,000 of Equity. Capital Turnover is $ 460,000 / ($ 50,000 + $ 200,000) = 1.84. For each $ 1.00 of capital invested (both debt and equity), we are able to generate $ 1.84 in sales.

Turnover examples
Company Total asset turnover
for 2001
Nike (NKE) 1.5355 times
Skechers (SKX) 2.3569 times
Timberland (TBO) 2.3456 times
Source: Companies’ respective annual reports

The operating cycle
• The operating cycle is the length of time it takes to turn the investment of cash in inventory back into cash.
• The longer the operating cycle, the greater the need for liquid assets.
• The operating cycle is the sum of: Number of days of inventory Number of days of receivables

The operating cycle• Now that we have calculated the number of days for receivables
and the number of days for inventory, we can estimate our operating cycle. Operating Cycle = Number of Days in Receivables + Number of Days in Inventory. In our previous examples, this would be 32 + 228 = 260 days. So on average, it takes us 260 days to generate cash from our current assets.
• If we look back at our Current Ratio, we found that we had 2.5 times more current assets than current liabilities. We now want to compare our Current Ratio to our Operating Cycle.
• Our turnover within the Operating Cycle is 365 / 260 or 1.40. This is lower than our Current Ratio of 2.5. This indicates that we have additional assets to cover the turnover of current assets into cash. If our current ratio were below that of the Operating Cycle Turnover Rate, this would imply that we do not have sufficient current assets to cover current liabilities within the Operating Cycle. We may have to borrow short-term to pay our expenses.

The number of days inventory
• The number of days inventory
= inventory / avg. day’s cost of goods sold
• This the number of days a company could go without adding inventory until they deplete inventory.
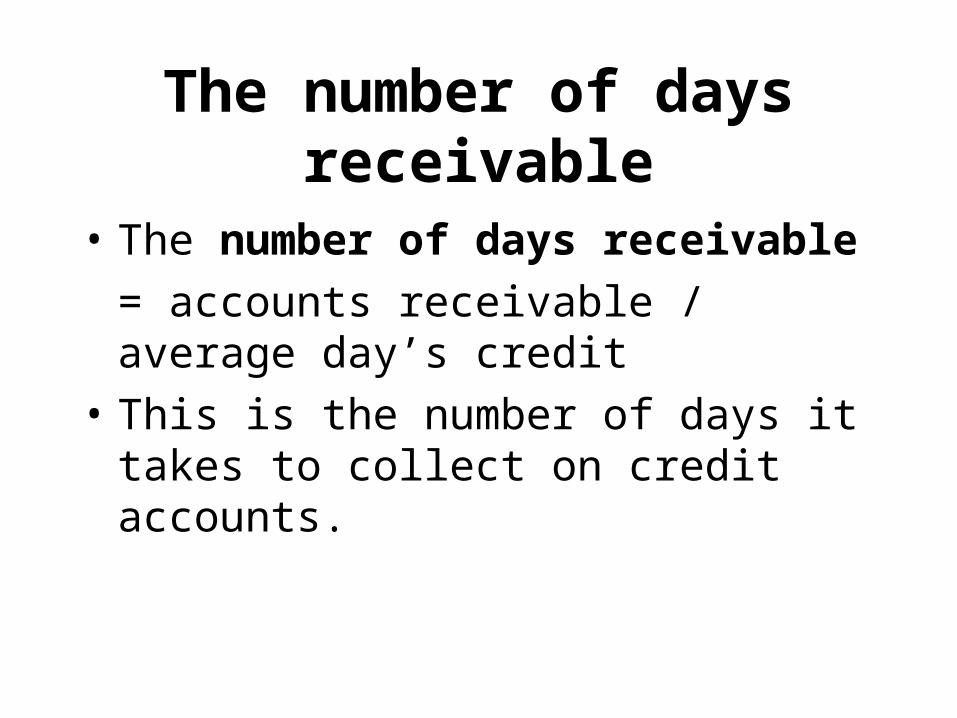
The number of days receivable
• The number of days receivable
= accounts receivable / average day’s credit
• This is the number of days it takes to collect on credit accounts.

Net operating cycle
• The net operating cycle is the number of days it takes to turn the investment in inventory into cash, considering that purchases are acquired with credit.
• The number of days payables
= accounts payable / average day’s purchases
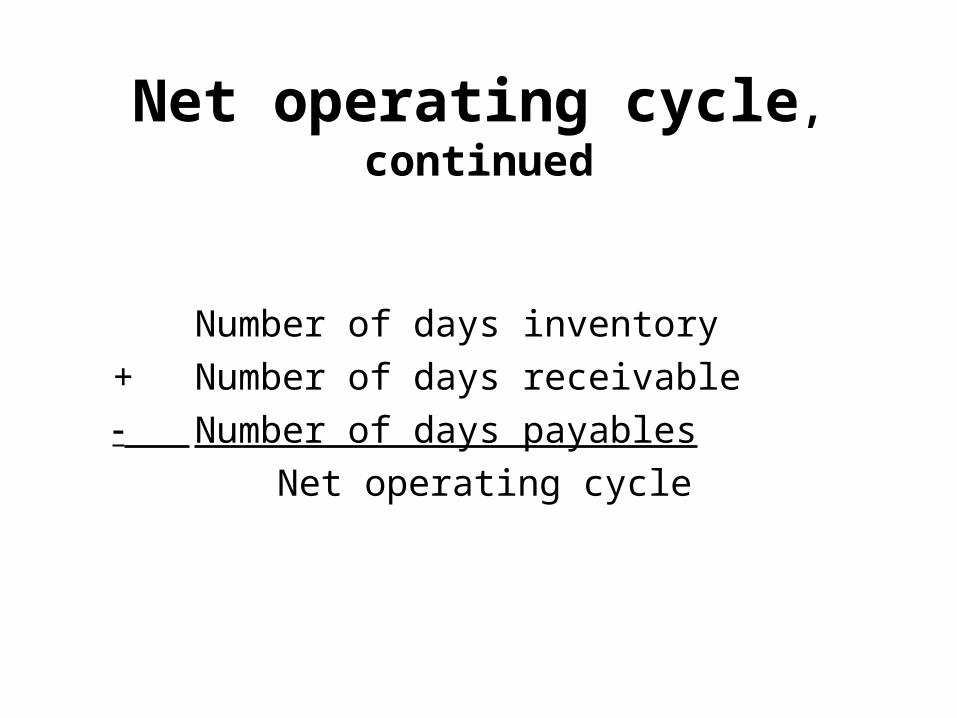
Net operating cycle, continued
Number of days inventory
+ Number of days receivable
Number of days payables
Net operating cycle

Example
Number of days …
General Electric 2002
Inventory 41.4 days
Receivables 148.9 days
Payables 93.7 days
Net operating cycle
96.6 days
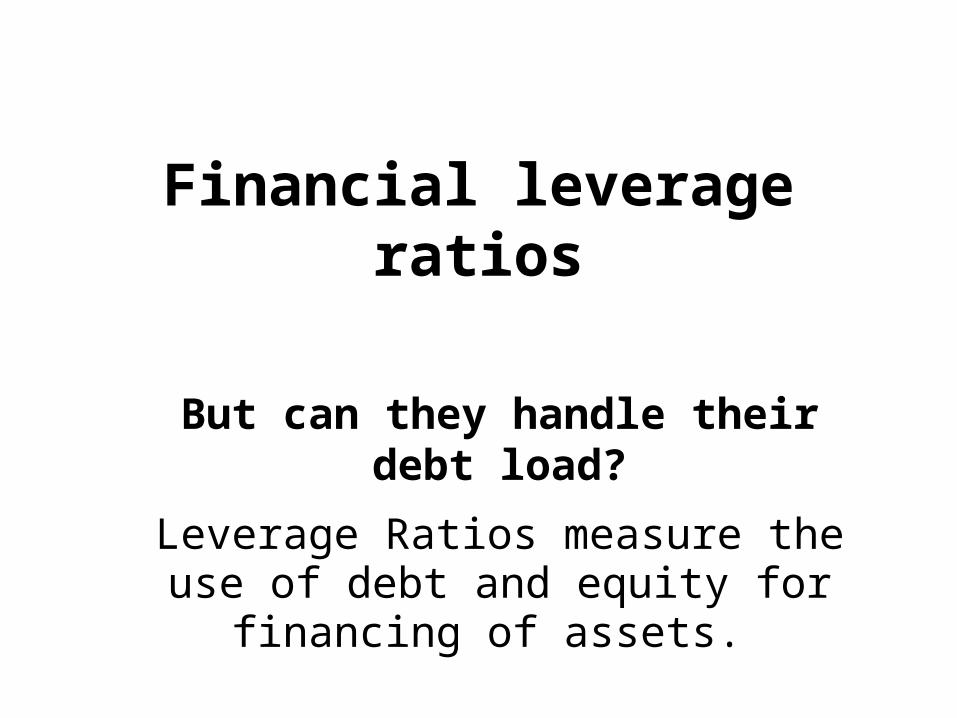
Financial leverage ratios
But can they handle their debt load?
Leverage Ratios measure the use of debt and equity for financing of assets.

Financial leverage ratios
• The debt to assets ratio indicates the proportion of assets that are financed with debt (both short-term and long-term debt).
• The debt to equity ratio indicates the relative uses of debt and equity as sources of capital to finance the firm's assets, evaluated using book values of the capital sources.

Debt to Equity Ratios• Debt to Equity is the ratio of Total Debt to Total Equity. It
compares the funds provided by creditors to the funds provided by shareholders. As more debt is used, the Debt to Equity Ratio will increase. Since we incur more fixed interest obligations with debt, risk increases. On the other hand, the use of debt can help improve earnings since we get to deduct interest expense on the tax return. So we want to balance the use of debt and equity such that we maximize our profits, but at the same time manage our risk. The Debt to Equity Ratio is calculated as follows:
• Total Liabilities / Shareholders Equity
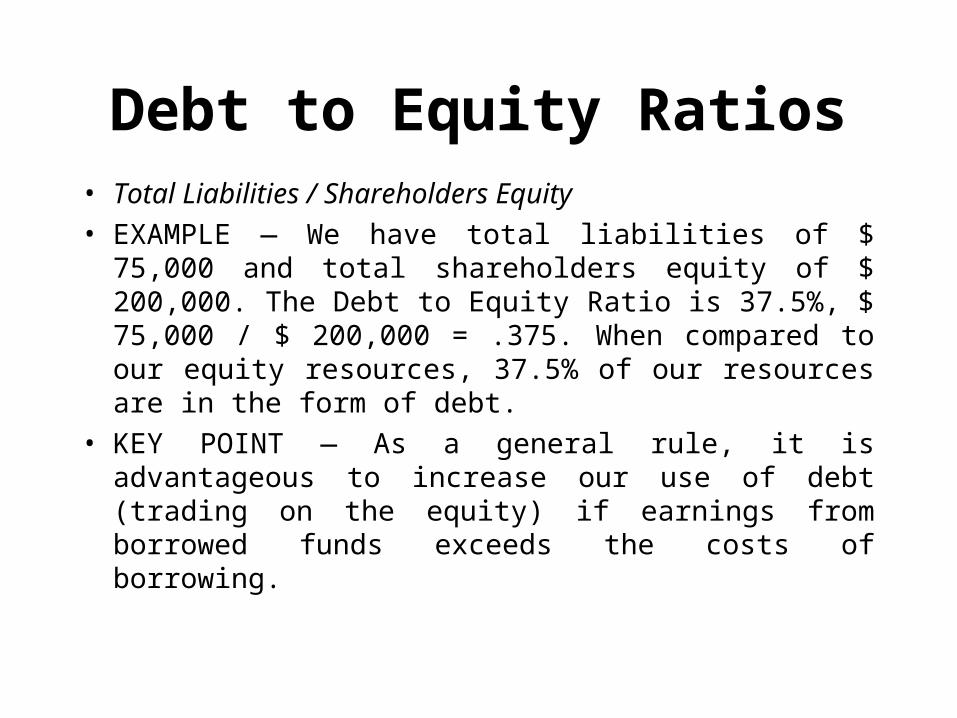
Debt to Equity Ratios• Total Liabilities / Shareholders Equity
• EXAMPLE — We have total liabilities of $ 75,000 and total shareholders equity of $ 200,000. The Debt to Equity Ratio is 37.5%, $ 75,000 / $ 200,000 = .375. When compared to our equity resources, 37.5% of our resources are in the form of debt.
• KEY POINT — As a general rule, it is advantageous to increase our use of debt (trading on the equity) if earnings from borrowed funds exceeds the costs of borrowing.
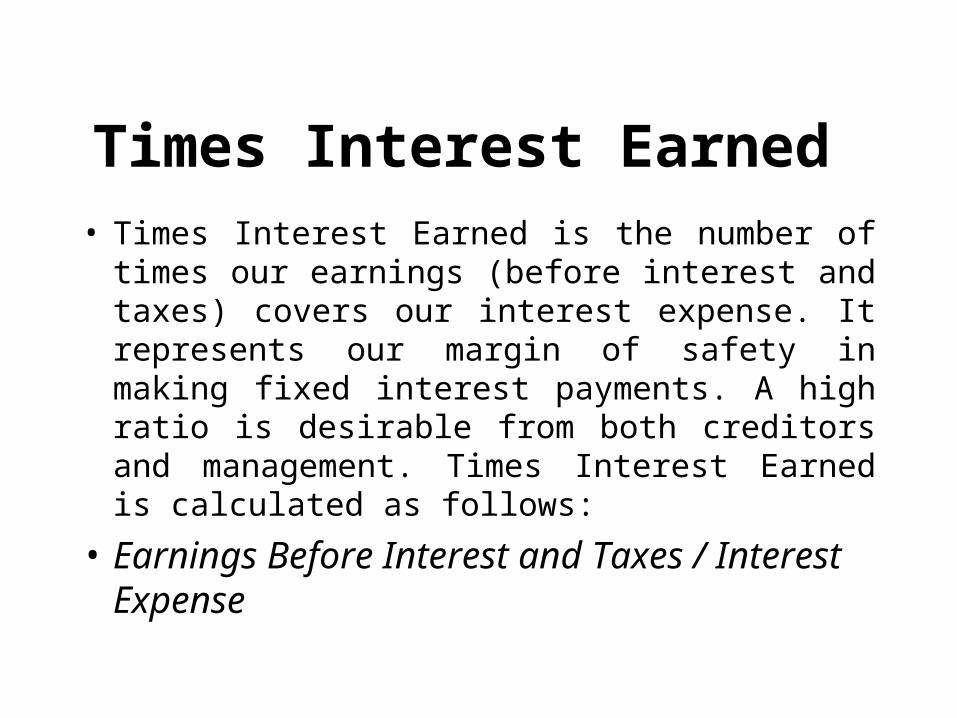
Times Interest Earned • Times Interest Earned is the number of times our
earnings (before interest and taxes) covers our interest expense. It represents our margin of safety in making fixed interest payments. A high ratio is desirable from both creditors and management. Times Interest Earned is calculated as follows:
• Earnings Before Interest and Taxes / Interest Expense

Times Interest Earned
• The interest coverage ratio indicates the firm's ability to satisfy interest obligations on its debt.
• Also known as the times-interest-earned ratio.
expenseinterest
EBIT = coverageInterest

Financial leverage examples
Debt-to-assets Debt-to-equity
Nike (NKE)
July,2002
40.41% 67.82%
Skechers (SKX)
December, 2001
51.16% 104.75%
Timberland (TBL)
December, 2001
40.47% 67.97%
Source: Data from Yahoo! Finance
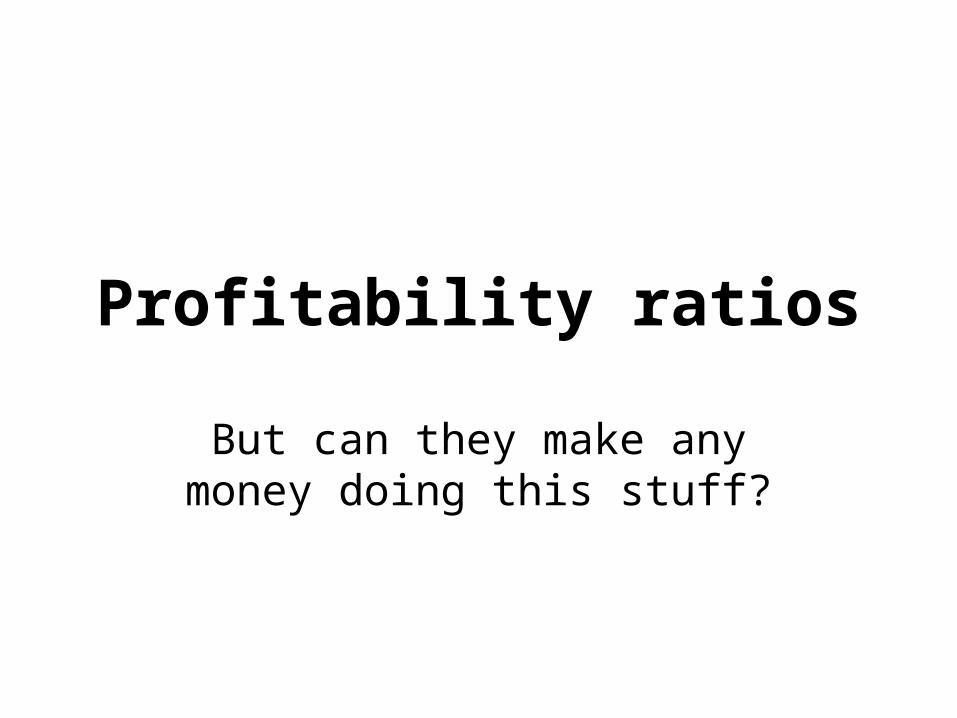
Profitability ratios
But can they make any money doing this stuff?

Gross profit margin
• Gross profit margin: the ratio of gross profit to sales.
• Indicates how much of every dollar of sales is left after costs of goods sold.
salesprofit gross
= marginprofit Gross

Operating profit margin
• Operating profit margin: the ratio of operating profit (EBIT) to sales.
• Indicates how much of each dollar of sales is left over after operating expenses.
operating profitOperating profit margin =
sales
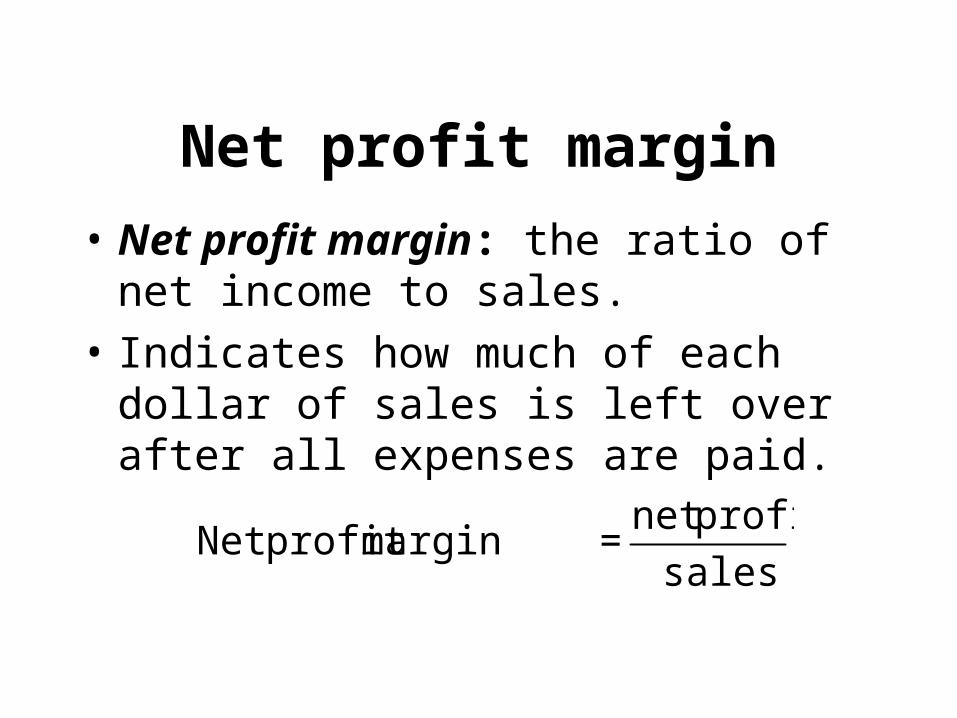
Net profit margin
• Net profit margin: the ratio of net income to sales.
• Indicates how much of each dollar of sales is left over after all expenses are paid.
sales
profit net = margin profit Net
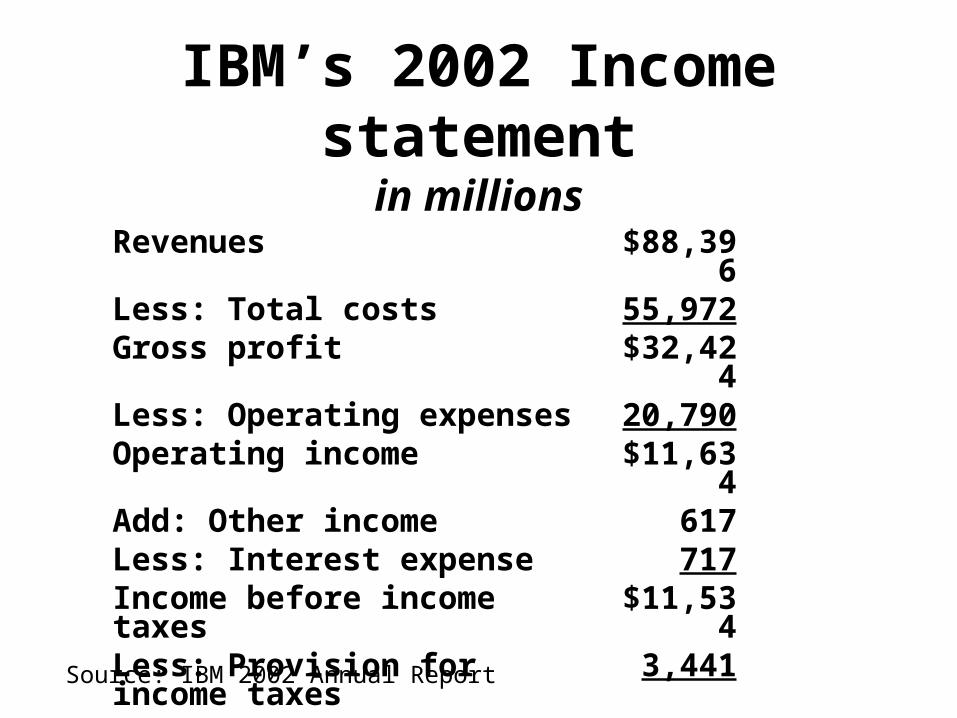
IBM’s 2002 Income statementin millions
Revenues $88,396Less: Total costs 55,972Gross profit $32,424Less: Operating expenses 20,790Operating income $11,634Add: Other income 617Less: Interest expense 717Income before income taxes $11,534Less: Provision for income taxes 3,441Net income $8,093
Source: IBM 2002 Annual Report
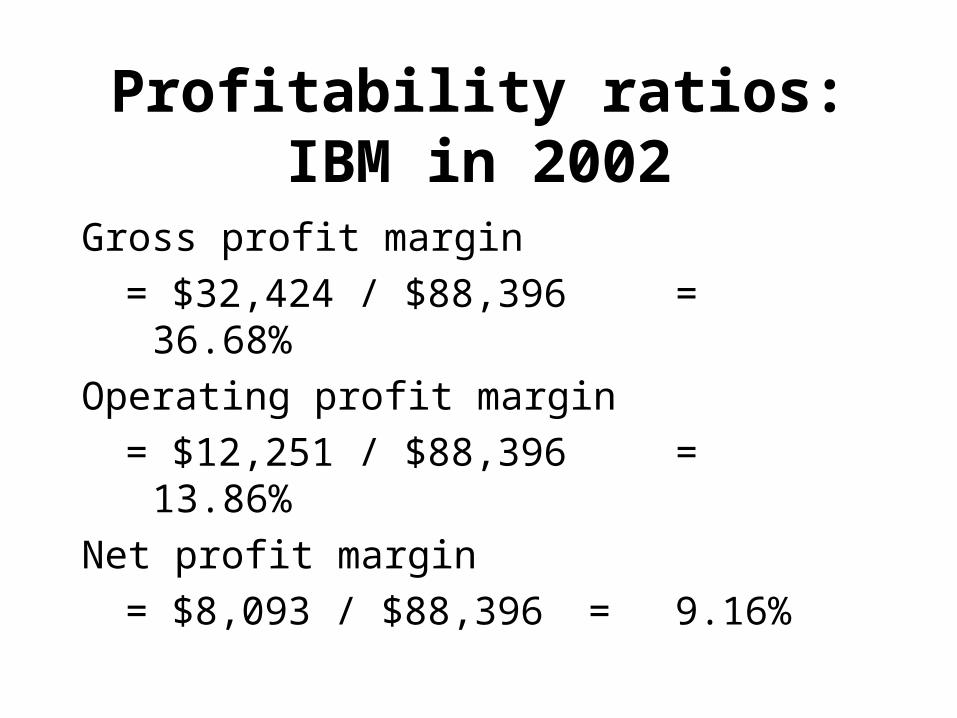
Profitability ratios: IBM in 2002
Gross profit margin
= $32,424 / $88,396 = 36.68%
Operating profit margin
= $12,251 / $88,396 = 13.86%
Net profit margin
= $8,093 / $88,396 = 9.16%

K Mart
Net revenues $37,028Less: Cost of revenues 29,658Gross profit $7,370Less: Operating expenses 7,461Operating income -$91Less: Interest expense 287Add: Taxes (carryover) 134Net income -$244
Income Statement, 1/31/2001 in millions
Source: Kmart 10-K Report

Return on investment
Hey, what’s the bottom line?
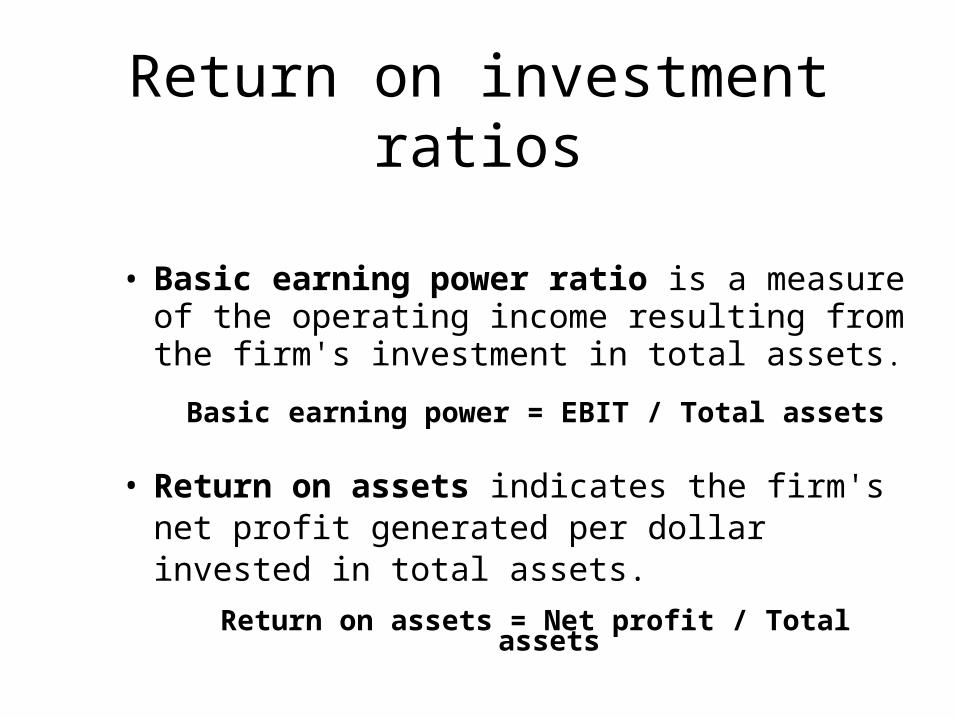
Return on investment ratios
• Basic earning power ratio is a measure of the operating income resulting from the firm's investment in total assets.
Basic earning power = EBIT / Total assets
• Return on assets indicates the firm's net profit generated per dollar invested in total assets.
Return on assets = Net profit / Total assets

Return on investment
• Return on equity is the profit generated per dollar of shareholders' investment (i.e., shareholders' equity).
equity of value book
profitnet = equity on Return

Coming attractions
• Return on investment ratios & the Du Pont system
• Shareholder ratios
• Common size analysis
• Effective use of financial analysis

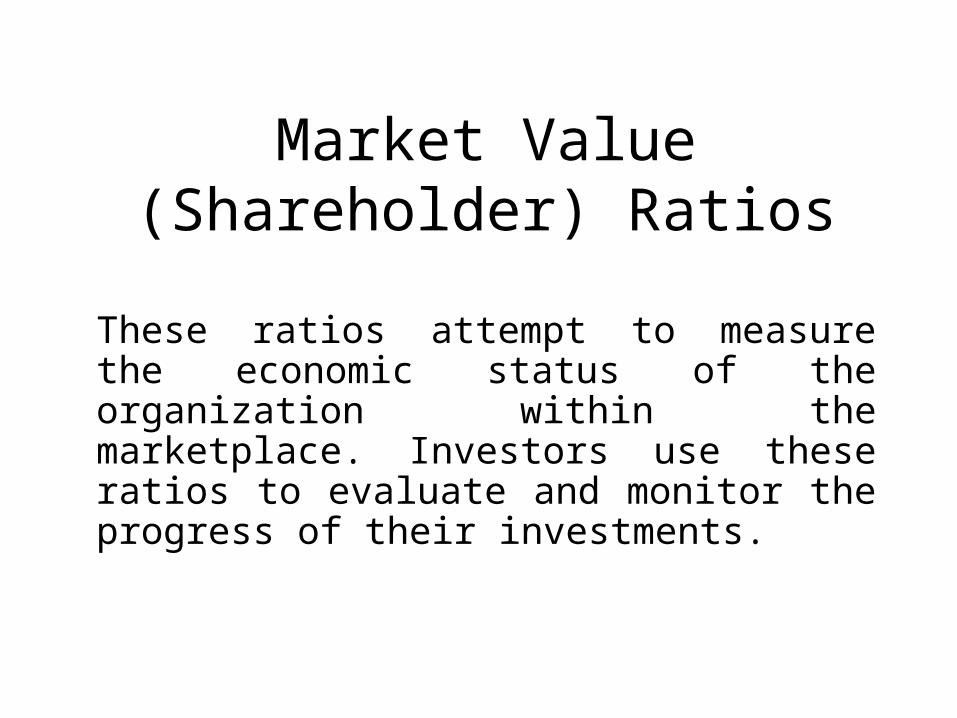
Market Value (Shareholder) Ratios
The view of the firm from the perspective of the owners, investor
and general public …
Market Value (Shareholder) Ratios
These ratios attempt to measure the economic status of the organization within the marketplace. Investors use these ratios to evaluate and monitor the progress of their investments.

Market Value Ratios
• Earnings per share (EPS) is the amount of income earned during a period per share of common stock.• Basic EPS & Diluted EPS
• Book value equity per share is the amount of the book value of common equity per share of stock.
• The price-earnings ratio (P/E or PE ratio) is the ratio of the price per share of stock to the earnings per share of stock.

Market Value Ratios, continued
• Dividends per share (DPS) is the dollar amount of cash dividends paid during a period, per share of common stock.
• The dividend payout ratio is the ratio of cash dividends paid to earnings for a period.
Dividend payout ratio = DPS / EPS
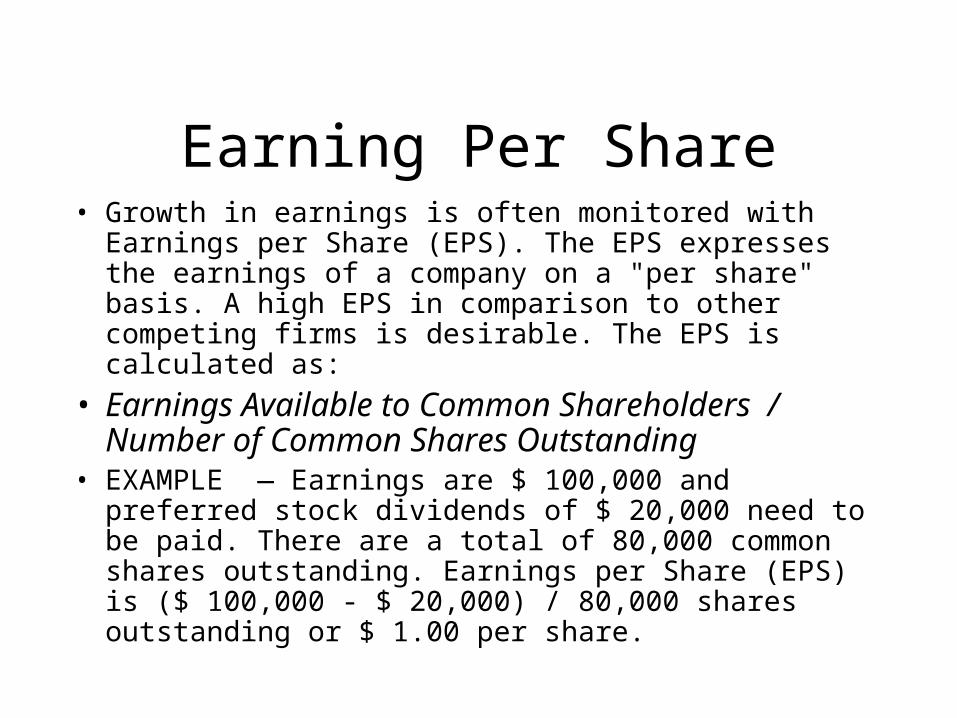
Earning Per Share• Growth in earnings is often monitored with Earnings per
Share (EPS). The EPS expresses the earnings of a company on a "per share" basis. A high EPS in comparison to other competing firms is desirable. The EPS is calculated as:
• Earnings Available to Common Shareholders / Number of Common Shares Outstanding
• EXAMPLE — Earnings are $ 100,000 and preferred stock dividends of $ 20,000 need to be paid. There are a total of 80,000 common shares outstanding. Earnings per Share (EPS) is ($ 100,000 - $ 20,000) / 80,000 shares outstanding or $ 1.00 per share.

Price to Earnings (P/E)• The relationship of the price of the stock in relation to EPS
is expressed as the Price to Earnings Ratio or P / E Ratio. Investors often refer to the P / E Ratio as a rough indicator of value for a company. A high P / E Ratio would imply that investors are very optimistic (bullish) about the future of the company since the price (which reflects market value) is selling for well above current earnings. A low P / E Ratio would imply that investors view the company's future as poor and thus, the price the company sells for is relatively low when compared to its earnings. The P / E Ratio is calculated as follows:

Price to Earnings (P/E)• Price of Stock / Earnings per Share *
• * Earnings per Share are fully diluted to reflect the conversion of securities into common stock.
• EXAMPLE — Earnings per share is $ 3.00 and the stock is selling for $ 36.00 per share. The P / E Ratio is $ 36 / $ 3 or 12. The company is selling for 12 times earnings.
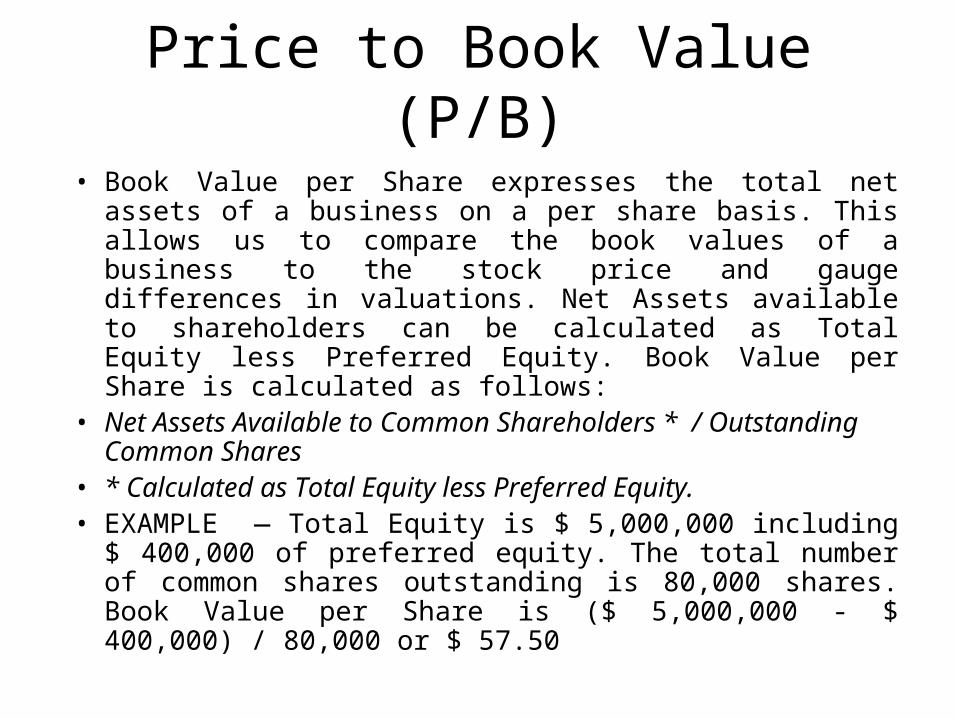
Price to Book Value (P/B)• Book Value per Share expresses the total net assets of a
business on a per share basis. This allows us to compare the book values of a business to the stock price and gauge differences in valuations. Net Assets available to shareholders can be calculated as Total Equity less Preferred Equity. Book Value per Share is calculated as follows:
• Net Assets Available to Common Shareholders * / Outstanding Common Shares
• * Calculated as Total Equity less Preferred Equity.• EXAMPLE — Total Equity is $ 5,000,000 including $
400,000 of preferred equity. The total number of common shares outstanding is 80,000 shares. Book Value per Share is ($ 5,000,000 - $ 400,000) / 80,000 or $ 57.50
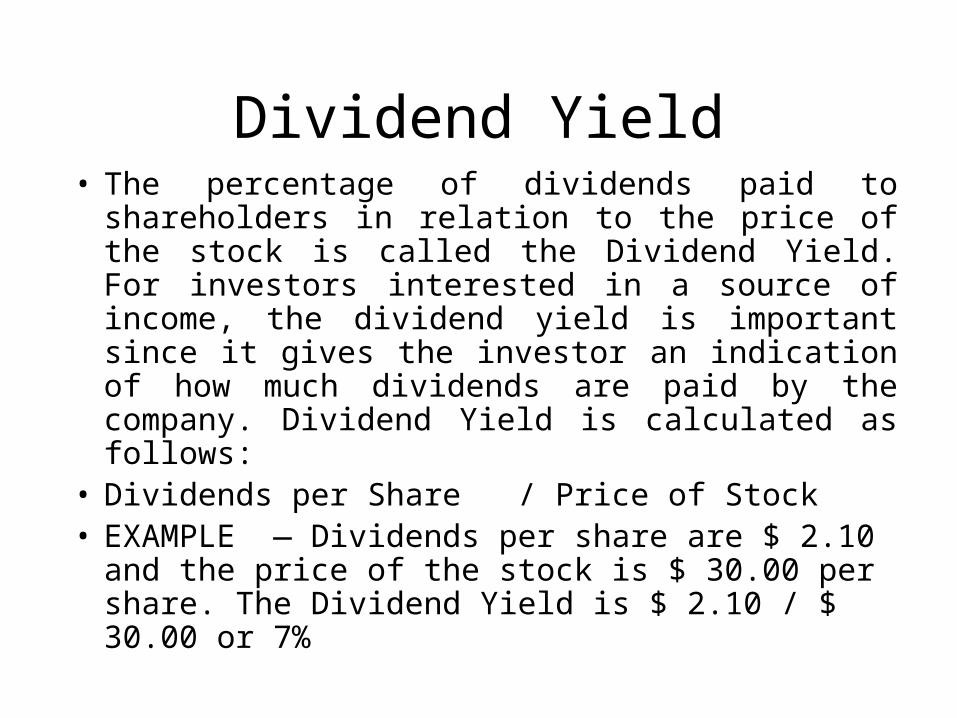
Dividend Yield• The percentage of dividends paid to shareholders in
relation to the price of the stock is called the Dividend Yield. For investors interested in a source of income, the dividend yield is important since it gives the investor an indication of how much dividends are paid by the company. Dividend Yield is calculated as follows:
• Dividends per Share / Price of Stock • EXAMPLE — Dividends per share are $ 2.10 and
the price of the stock is $ 30.00 per share. The Dividend Yield is $ 2.10 / $ 30.00 or 7%
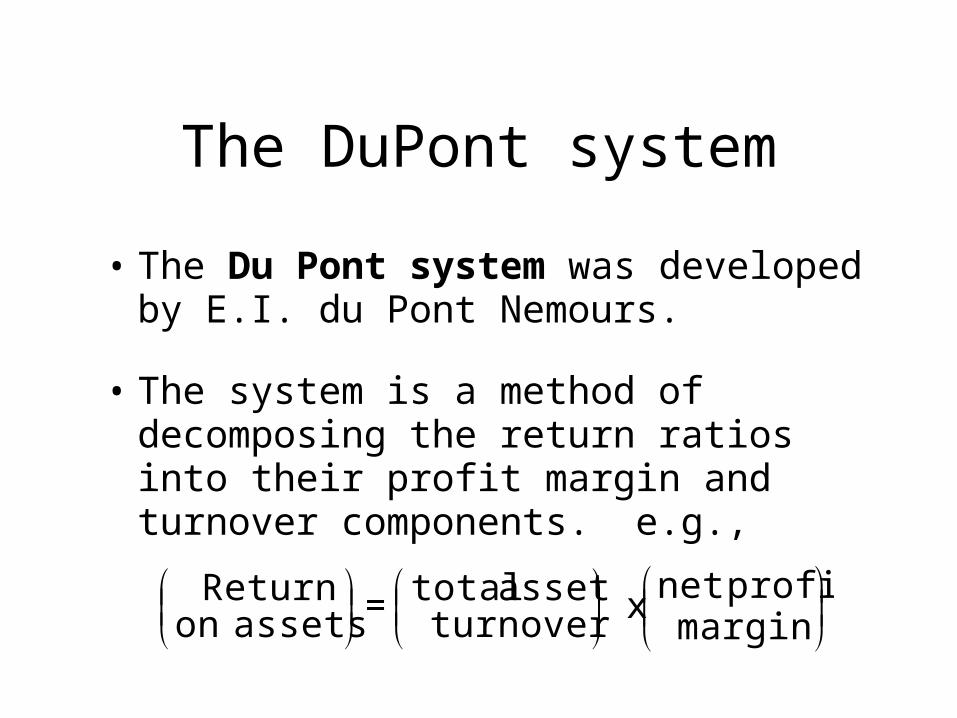
The DuPont system
• The Du Pont system was developed by E.I. du Pont Nemours.
• The system is a method of decomposing the return ratios into their profit margin and turnover components. e.g.,
marginprofit net x turnover
asset total = assets onReturn

A further breakdown
• Return on equity can be broken down into the return on assets and the equity multiplier.
• The greater the financial leverage, the greater the equity multiplier.
return on return on equity= ×equity assets multiplier
net income net income assets= ×
equity assets equity
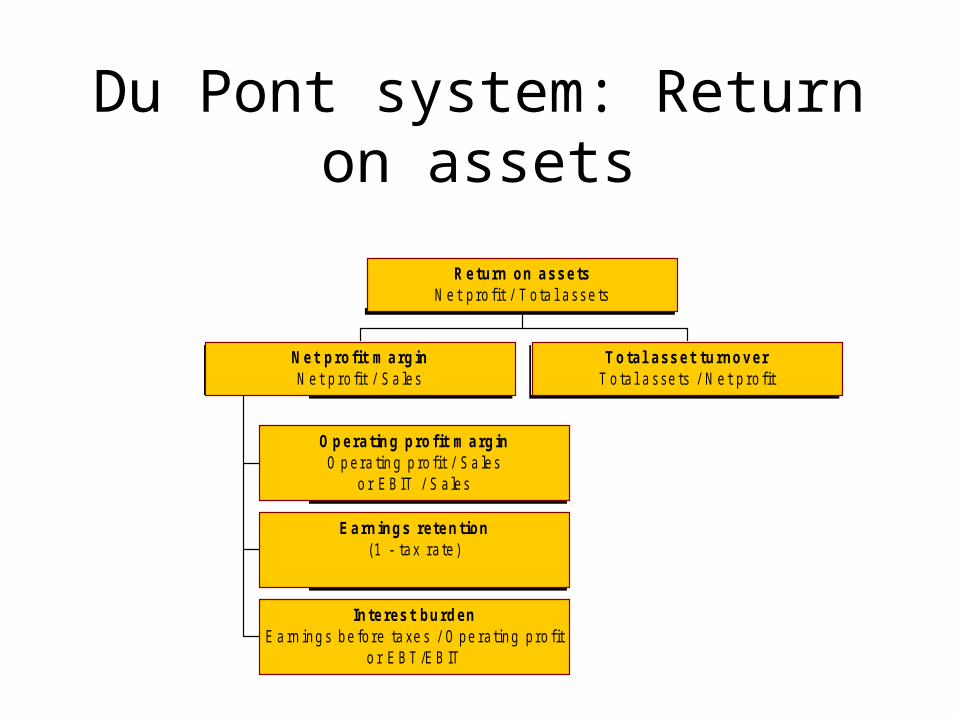
Du Pont system: Return on assets
O perating profit m arginO p era tin g p ro fi t / S a les
o r E B IT / S a les
Earnings retention(1 - tax ra te )
Interest burdenE a rn ing s be fo re ta xe s / O pe ra ting p ro fit
o r E B T /E B IT
Net profit m arginN e t p ro fi t / S a les
T otal asset turnoverT o ta l a sse ts / N e t p ro fit
Return on assetsN e t p ro fi t / T o ta l asse ts

Du Pont system: Return on equity
Operating profit m arginO p era tin g p ro fi t / S a les
o r E B IT / S a les
Earnings retention(1 - tax ra te )
Interest burdenE a rn ing s be fo re ta xe s / O pe ra ting p ro fit
o r E B T / E B IT
Net profit m arginN e t p ro fi t / S a les
Total asset turnoverT o ta l a sse ts / N e t p ro fit
Equity multiplierT o ta l asse ts / S h a re h o ld ers' e qu ity
Return on equityN et p ro fit / S h areh o ld ers ' e qu ity
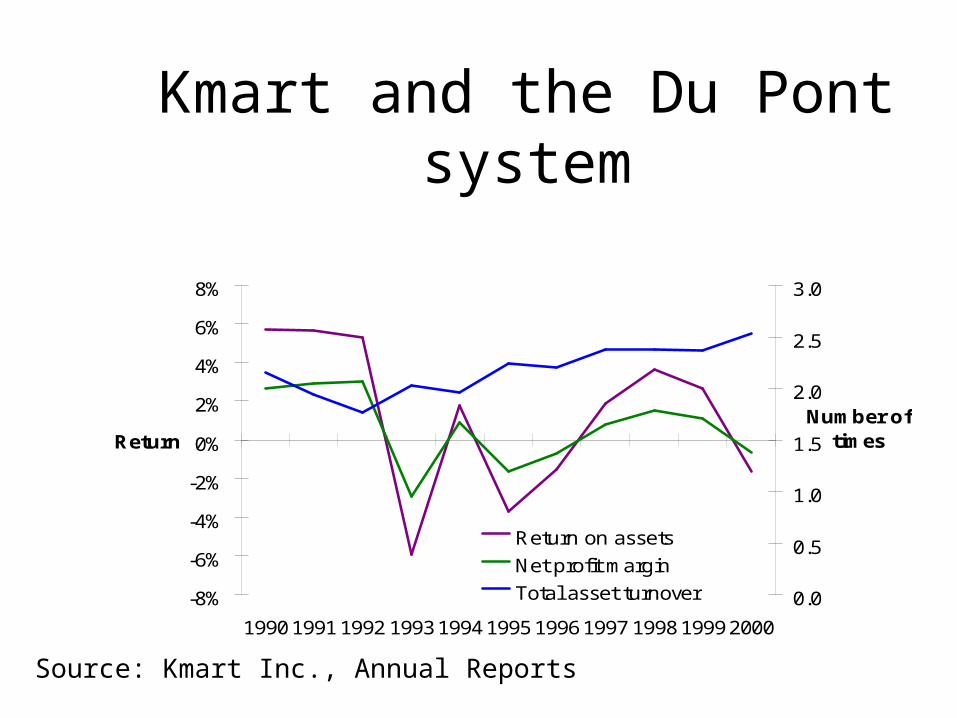
Kmart and the Du Pont system
-8%
-6%
-4%
-2%
0%
2%
4%
6%
8%
1990 1991 1992 1993 1994 1995 1996 1997 1998 1999 2000
Return
0.0
0.5
1.0
1.5
2.0
2.5
3.0
Number of times
Return on assets
Net profit margin
Total asset turnover
Source: Kmart Inc., Annual Reports

Wal-Mart: ROA & ROE
0%
5%
10%
15%
20%
25%
30%
1991 1992 1993 1994 1995 1996 1997 1998 1999 2000 2001 2002
ROA ROE
Source: Wal-Mart Stores, Inc., Annual Reports

Wal-Mart DuPont, 1991-2002
0%
5%
10%
15%
20%1
98
2
19
84
19
86
19
88
19
90
19
92
19
94
19
96
19
98
20
00
20
02
returnand
margin
00,511,522,533,5
times
Return on assets Net profit marginTotal asset turnover
Source: Wal-Mart Annual Reports, various years

Problems
• Suppose a company has a return on equity of 10% and a return on assets of 5%. What is its debt-to-equity ratio?
• If a company has a return on assets of 5% and a total asset turnover of 5 times, what is its net profit margin?

An example
Time to see if you can really do this stuff.

For a selected company …
• Calculate the following ratios:Current ratioDebt-to-equity ratioTotal asset turnoverNet profit marginEquity multiplierReturn on equity
• and turnover components.
Common size analysis

Common size analysis
• Common size analysis is the analysis of financial statement items through comparisons among financial statement or market data.
• Common size analysis compares each item in a financial statement with a benchmark item.
• Common size analysis is useful in analyzing trends in profitability and trends in investments and financing activity.

Common size analysis, continued.
• For the income statement, the benchmark is sales; each item in the income statement is restated as a percentage of sales.
• For the balance sheet, the benchmark is total assets; each item in the balance sheet is restated as a percentage of total assets.

Common size example:Toys R Us
0%
25%
50%
75%
100%
1997 1998 1999 2000 2001 2002
Other
Intangibles
Plant and equipment
Current assets
Assets
Source: Toys R Us Annual Reports

Common size example:Toys R Us
0%
25%
50%
75%
100%
1997 1998 1999 2000 2001 2002
Shareholders' equity
Other long-termliabilitiesLong-term debt
Deferred taxes
Current liabilities
Liabilities& equity
Source: Toys R Us Annual Reports

Effective use of financial analysis
Now what do we do with this stuff?

Uses of financial analysis
• Valuation• Use financial relations to predict future cash
flows
• Determine creditworthiness• Rating services (e.g., Moody’s)
• Bankruptcy prediction• Develop a statistical model that predicts
bankruptcy on the basis of financial characteristics

Case in point
IMC Global

IMC Global
• Industry: Agricultural chemicals
• Largest of the few companies in the industry
• Chemical prices are cyclical and sensitive to agricultural economy and world trade

IMC Global: Returns
-80%-70%-60%-50%-40%-30%-20%-10%
0%10%
1997 1998 1999 2000 2001 2002
ROE
ROA
Source: IMC Global 10-K Reports
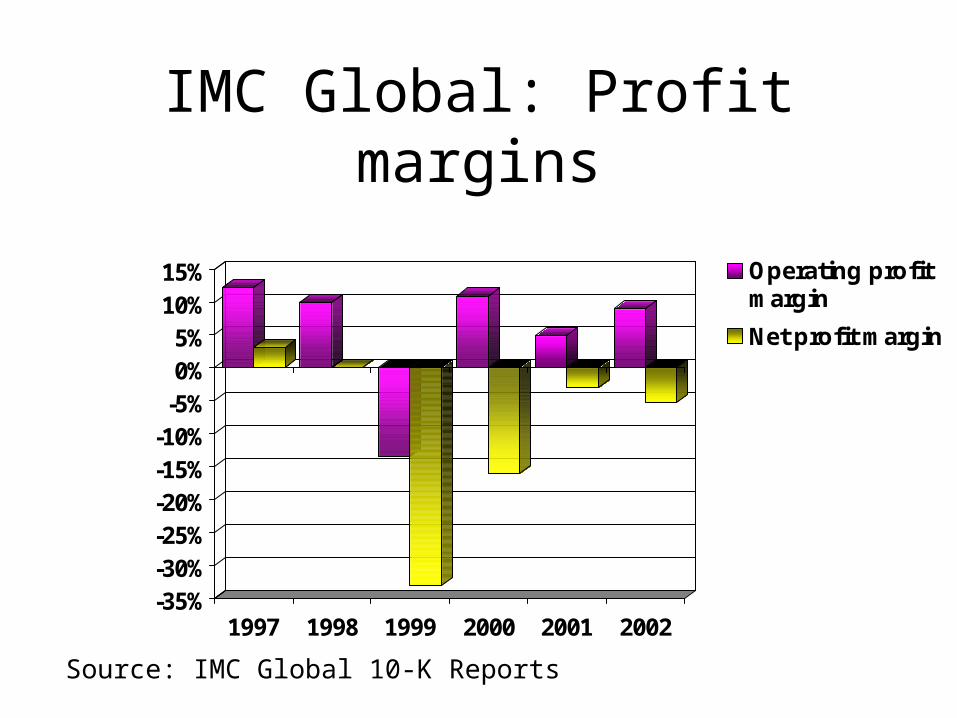
IMC Global: Profit margins
-35%-30%-25%-20%-15%-10%-5%0%5%
10%15%
1997 1998 1999 2000 2001 2002
Operating profitmargin
Net profit margin
Source: IMC Global 10-K Reports
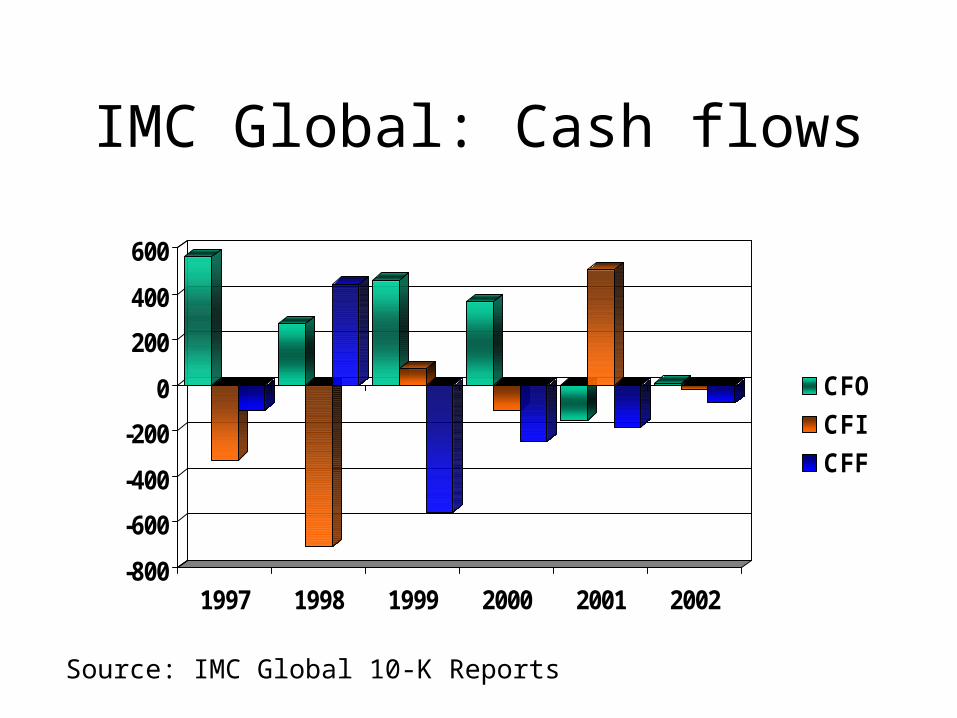
IMC Global: Cash flows
-800
-600
-400
-200
0
200
400
600
1997 1998 1999 2000 2001 2002
CFO
CFI
CFF
Source: IMC Global 10-K Reports
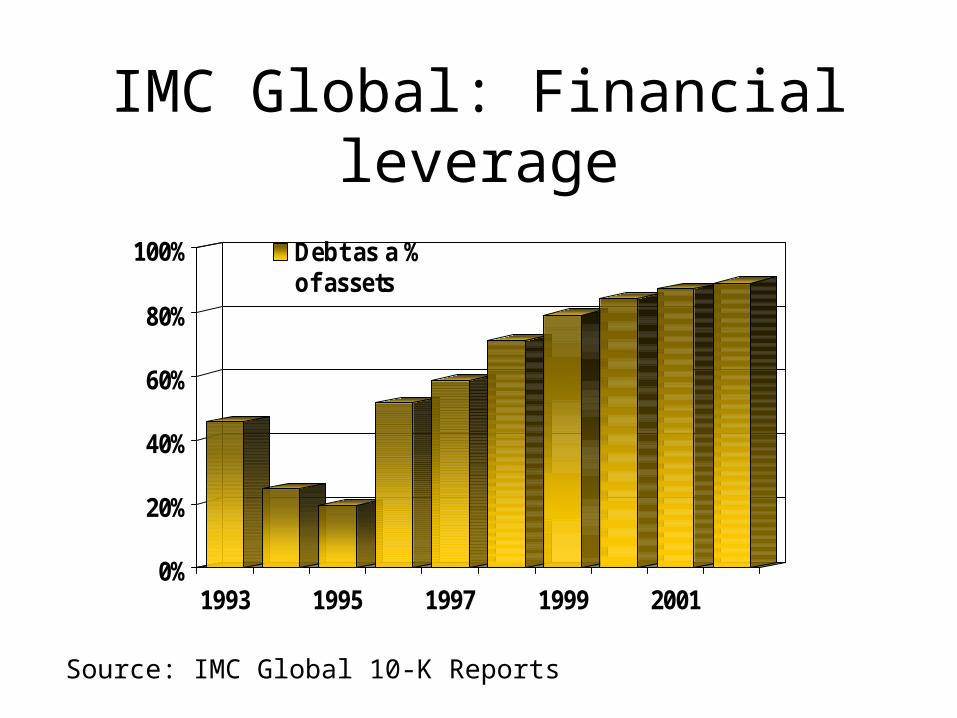
IMC Global: Financial leverage
0%
20%
40%
60%
80%
100%
1993 1995 1997 1999 2001
Debt as a %of assets
Source: IMC Global 10-K Reports

IMC Global: Additional considerations
• IMC Global is in a cyclical industry
• IMC Global has many environmental liabilities that are not shown in the balance sheet
• The reaction of competitors/industry to slump in phosphate prices affects the firm

Problems and dilemmas
There had to be a catch …
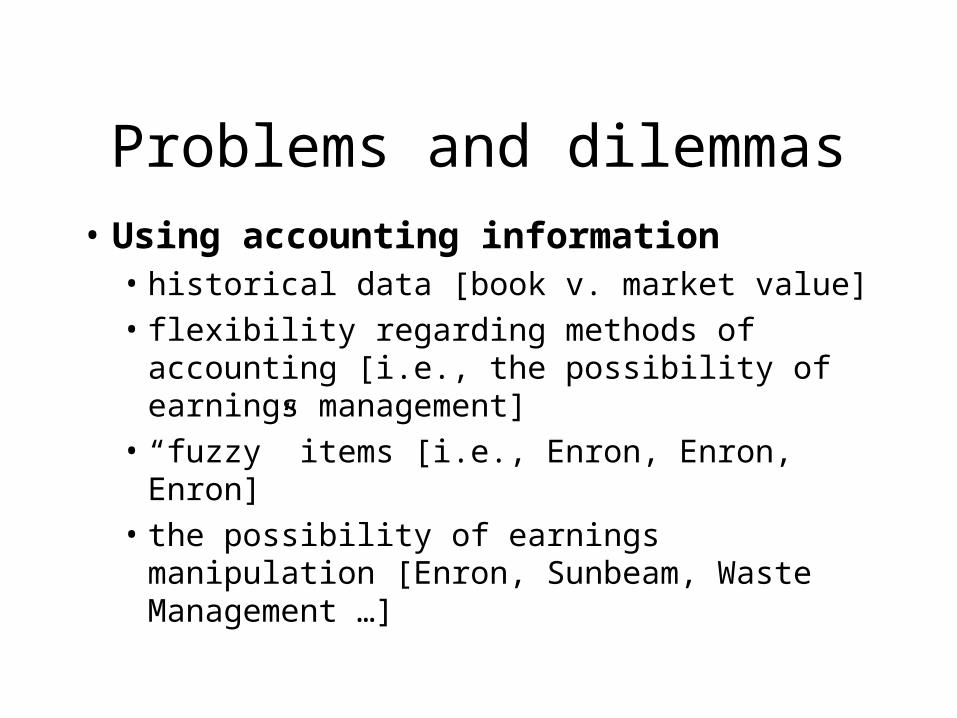
Problems and dilemmas
• Using accounting information• historical data [book v. market value]• flexibility regarding methods of accounting
[i.e., the possibility of earnings management]• “fuzzy” items [i.e., Enron, Enron, Enron]• the possibility of earnings manipulation [Enron,
Sunbeam, Waste Management …]

Problems and Dilemmas, continued
• Selecting a benchmark
• Financial ratios are most useful when compared with ratios of similar companies (e.g., by industry).
• It is difficult to choose comparison firms or to determine the industry.

Shoe companies
0%1%2%3%4%5%6%7%8%9%
1997 1998 1999 2000 2001 2002
Nike
Reebok
Skechers
Net profit margin1997-2002
Source: Companies’ annual reports, various years

Problems and dilemmas, continued.
• Selecting and interpreting ratios
• A single ratio is not indicative of a “good” or “bad” firm.
• Some ratios are not applicable to some firms.
• Some ratios don’t make sense in certain circumstance.
Forecasting with financial ratios
• Financial ratios are often used to determine a trend over time, which may then be used to develop expectations about the future.
• It is important to understand the accounting numbers to adequately forecast based on historical trends.
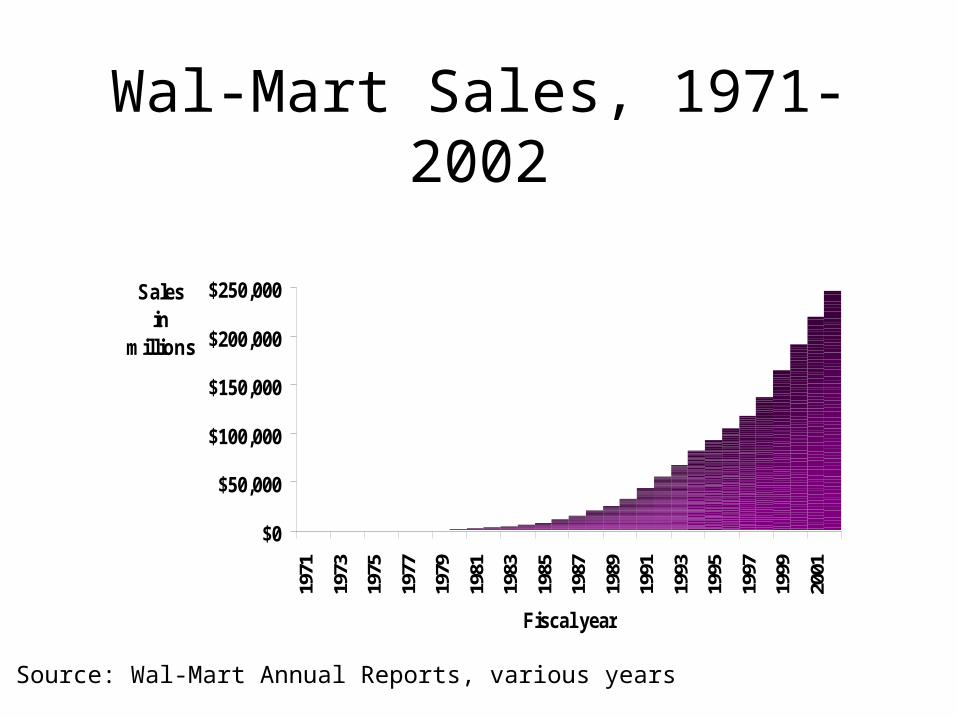
Wal-Mart Sales, 1971-2002
$0
$50,000
$100,000
$150,000
$200,000
$250,00019
71
1973
1975
1977
1979
1981
1983
1985
1987
1989
1991
1993
1995
1997
1999
2001
Fiscal year
Salesin
millions
Source: Wal-Mart Annual Reports, various years

Enron Sales, 1991-2000
$0
$20
$40
$60
$80
$100
$120
1991 1992 1993 1994 1995 1996 1997 1998 1999 2000
Fiscal year
Revenues(in billions)
Source: Enron 10-K Reports, various years
Matrix, Inc.2005
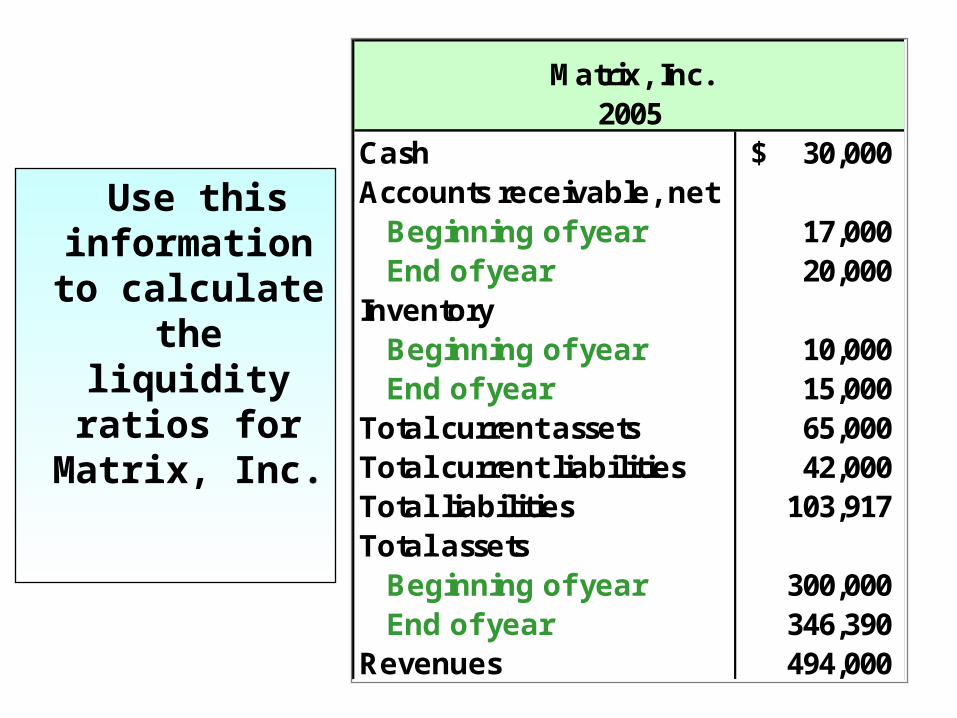
Cash 30,000$ Accounts receivable, net Beginning of year 17,000 End of year 20,000 Inventory Beginning of year 10,000 End of year 15,000 Total current assets 65,000 Total current liabilities 42,000 Total liabilities 103,917 Total assets Beginning of year 300,000 End of year 346,390 Revenues 494,000
Use this information to calculate the liquidity
ratios for Matrix, Inc.
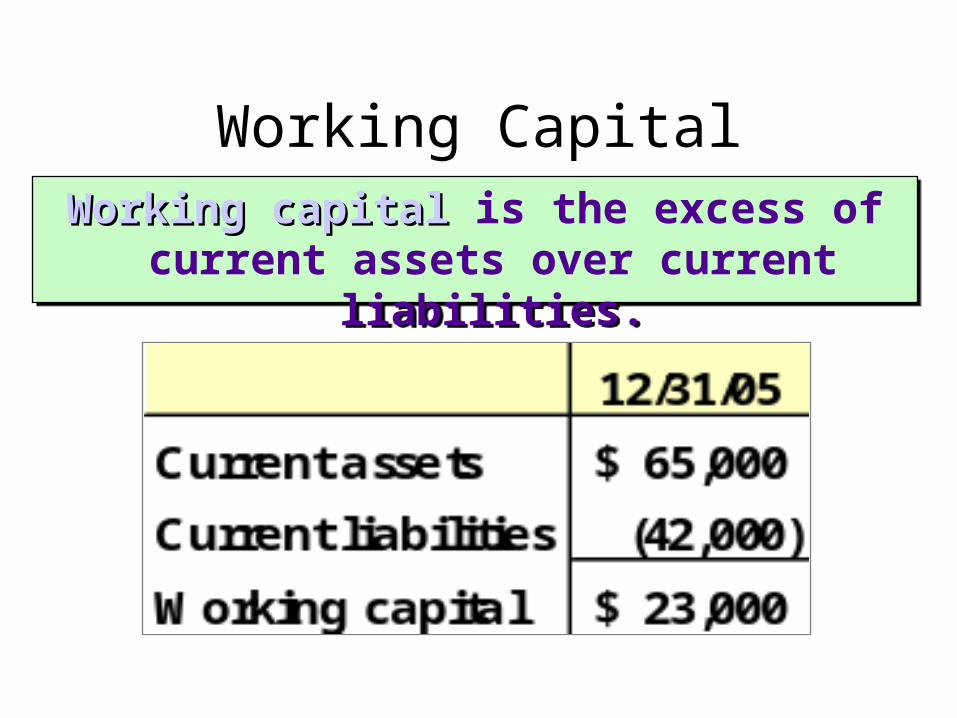
Working capital Working capital is the excess of current assets over current liabilities.
Working capital Working capital is the excess of current assets over current liabilities.
Working Capital

CurrentRatio
Current Assets Current Liabilities
=
= 1.55 : 1
This ratio measures the short-term debt-paying ability of the company.
This ratio measures the short-term debt-paying ability of the company.
Current Ratio
CurrentRatio
$65,000
$42,000
=

Quick assets are cash, marketable securities, and receivables.
Quick assets are cash, marketable securities, and receivables.
This ratio is like the currentratio but excludes current assets such as inventories that may be
difficult to quickly convert into cash.
This ratio is like the currentratio but excludes current assets such as inventories that may be
difficult to quickly convert into cash.
Quick Assets Current Liabilities
=QuickRatio
Quick Ratio

Quick Ratio Quick Assets Current Liabilities
=QuickRatio
This ratio is like the currentratio but excludes current assets such as inventories that may be
difficult to quickly convert into cash.
This ratio is like the currentratio but excludes current assets such as inventories that may be
difficult to quickly convert into cash.
$50,000 $42,000
= 1.19 : 1=QuickRatio

A measure of creditor’s long-term risk. A measure of creditor’s long-term risk.
The smaller the percentage of assets that are financed by debt, the smaller the risk
for creditors.
A measure of creditor’s long-term risk. A measure of creditor’s long-term risk.
The smaller the percentage of assets that are financed by debt, the smaller the risk
for creditors.
Debt Ratio

Ratios help usersunderstand
financial relationships.
Ratios provide forquick com parison
of companies.
U ses
M anagem ent may enterinto transactions m erely
to im prove the ratios.
Ratios do not help w ithanalysis of the company's
progress tow ardnonfinancial goals.
Lim itations
Uses and Limitations of Financial Ratios

An income statement can be prepared in either a multiple-step or single-step format.
An income statement can be prepared in either a multiple-step or single-step format.
The single-step format is simpler.The multiple-step format provides more detailed
information.
The single-step format is simpler.The multiple-step format provides more detailed
information.
Measures of Profitability

Proper Heading {Gross Margin {Operating Expenses {
{Non- operating Items
Income Statement (Multiple-Step)Income Statement (Multiple-Step)
Remember to compute EPS.Remember to compute EPS.

Proper Heading {Income Statement (Single-Step)Income Statement (Single-Step)
Expenses & Losses {
Revenues & Gains {
Remember to compute EPS.Remember to compute EPS.

Use this information to calculate
the profitability
ratios for Matrix, Inc.
Matrix, Inc.
2005
Number of common shares outstanding all of 2005 27,400 Net income 53,690$ Shareholders' equity Beginning of year 180,000 End of year 234,390 Revenues 494,000 Cost of sales 140,000 Total assets Beginning of year 300,000 End of year 346,390

This ratio is generally consideredthe best overall measure of a
company’s profitability.
This ratio is generally consideredthe best overall measure of a
company’s profitability.
Return On Assets (ROA)
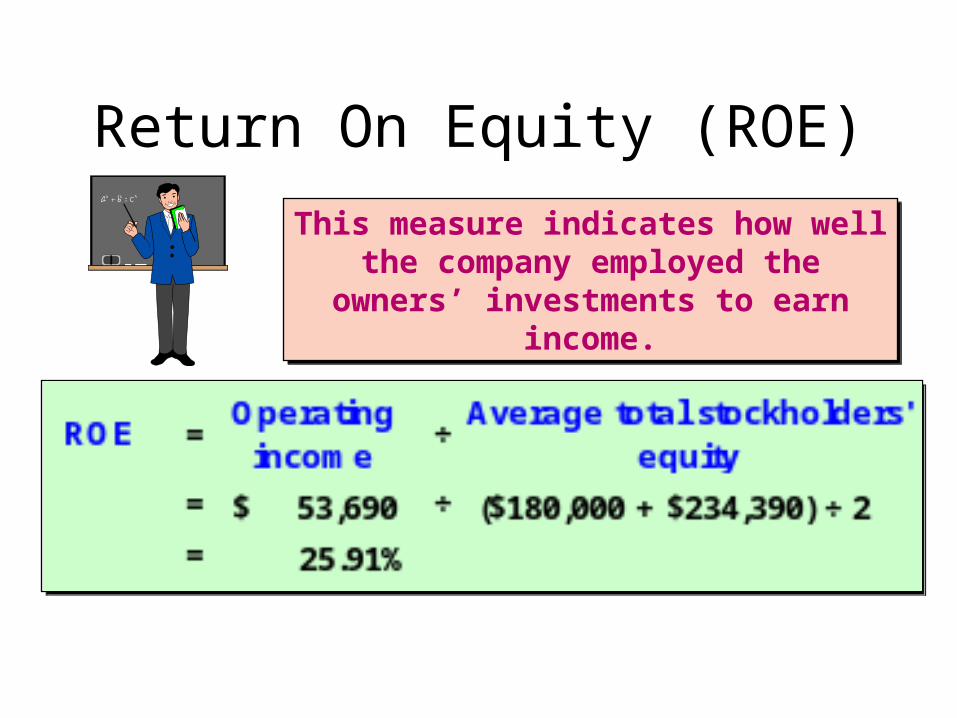
This measure indicates how well the company employed the owners’
investments to earn income.
This measure indicates how well the company employed the owners’
investments to earn income.
Return On Equity (ROE)
More issues regarding ratios
• Different operating and accounting practices can distort comparisons.
• Sometimes it is hard to tell if a ratio is “good” or “bad”.
• Difficult to tell whether a company is, on balance, in strong or weak position.
Qualitative factors to be considered when evaluating a company’s future
financial performance• Are the firm’s revenues tied to 1 key
customer, product, or supplier?
• What percentage of the firm’s business is generated overseas?
• Competition
• Future prospects
• Legal and regulatory environment

Objective 2
Perform a vertical analysis
of financial statements.

Vertical Analysis...
– compares each item in a financial statement to a base number set to 100%.
• Every item on the financial statement is then reported as a percentage of that base.

Vertical Analysis
1999 %Revenues $38,303 100.0Cost of sales 19,688 51.4Gross profit $18,615 48.6Total operating expenses 13,209 34.5Operating income $ 5,406 14.1Other income 2,187 5.7Income before taxes $ 7,593 19.8Income taxes 2,827 7.4Net income $ 4,766 12.4
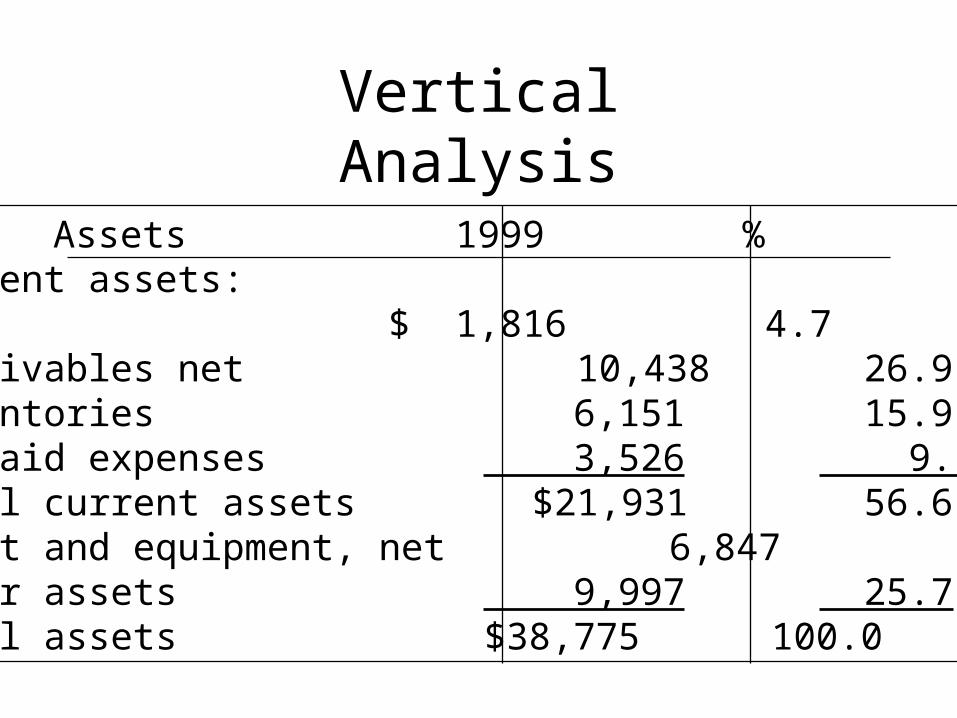
Vertical Analysis
Assets 1999 %Current assets:Cash $ 1,816 4.7Receivables net 10,438 26.9Inventories 6,151 15.9Prepaid expenses 3,526 9.1Total current assets $21,931 56.6Plant and equipment, net 6,847 17.7Other assets 9,997 25.7Total assets $38,775 100.0
Objective 3
Prepare common-size
financial statements.

Common-size Statements
• On the income statement, each item is expressed as a percentage of net sales.
• On the balance sheet, the common size is the total on each side of the accounting equation.
• Common-size statements are used to compare one company to other companies, and to the industry average.
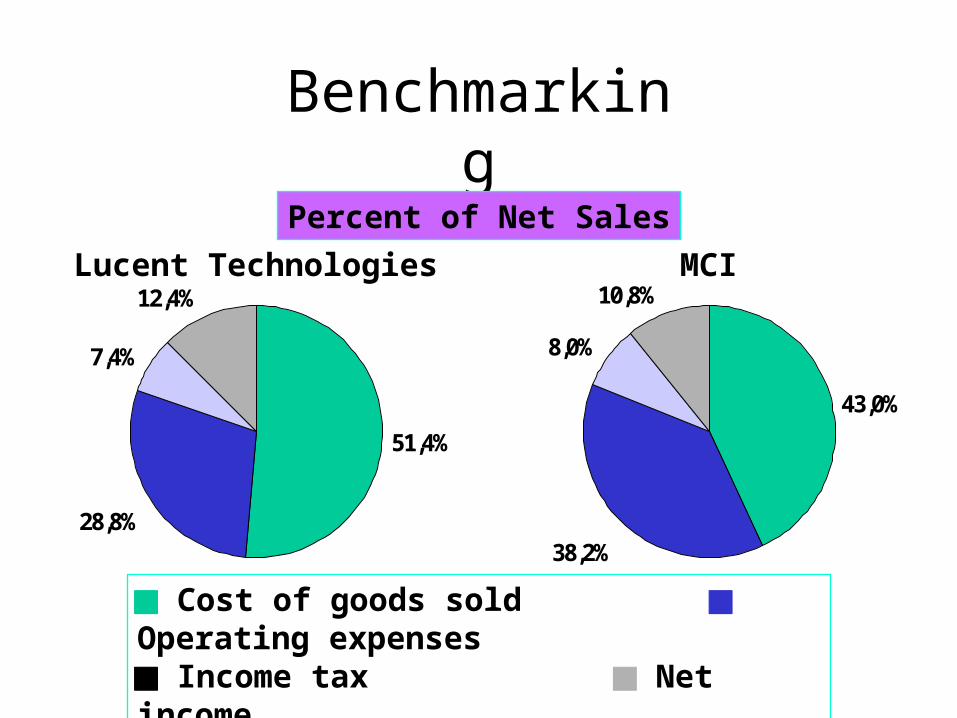
Benchmarking
43,0%
38,2%
8,0%
10,8%
51,4%
28,8%
7,4%
12,4%
Percent of Net Sales
MCILucent Technologies
Cost of goods sold Operating expenses Income tax Net income

Objective 4
Compute the standard
financial ratios.
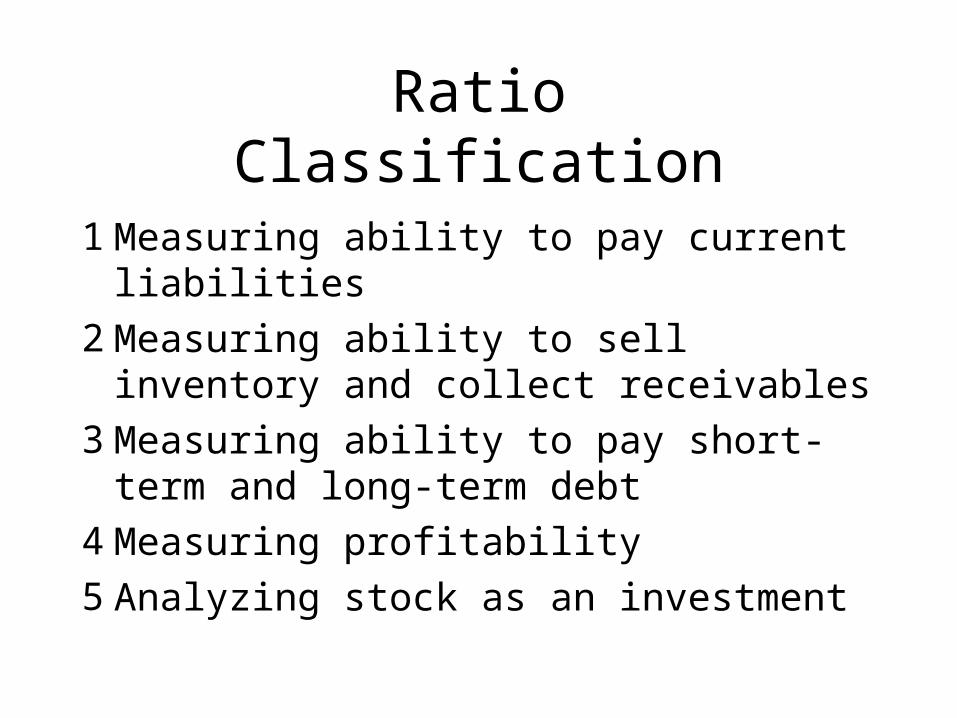
Ratio Classification
1 Measuring ability to pay current liabilities
2 Measuring ability to sell inventory and collect receivables
3 Measuring ability to pay short-term and long-term debt
4 Measuring profitability
5 Analyzing stock as an investment

Ratio Classification
Liquidity ratios: Mesuring ability to pay current liabilitiesActivity ratios: Measuring ability to sell inventory and collect receivablesFinancial leverage ratios: Measuring ability to pay short-term and long-term debtProfitability ratios: Measuring profitability of the bussines.

Palisades Furniture Example
Net sales (Year 2002) $858,000Cost of goods sold 513,000Gross profit $345,000Total operating expenses 244,000Operating income $101,000Interest revenue 4,000Interest expense (24,000)Income before taxes $ 81,000Income taxes 33,000Net income $ 48,000

Palisades Furniture Example
Assets 20x2 20x1Current assets:Cash $ 29,000 $ 32,000Receivables net 114,000 85,000Inventories 113,000 111,000Prepaid expenses 6,000 8,000Total current assets $262,000 $236,000Long-term investments 18,000 9,000Plant and equipment, net 507,000 399,000Total assets $787,000 $644,000

Palisades Furniture Example
Liabilities 20x2 20x1Current liabilities:Notes payable $ 42,000 $ 27,000Accounts payable 73,000 68,000Accrued liabilities 27,000 31,000Total current liabilities $142,000 $126,000Long-term debt 289,000 198,000Total liabilities $431,000 $324,000
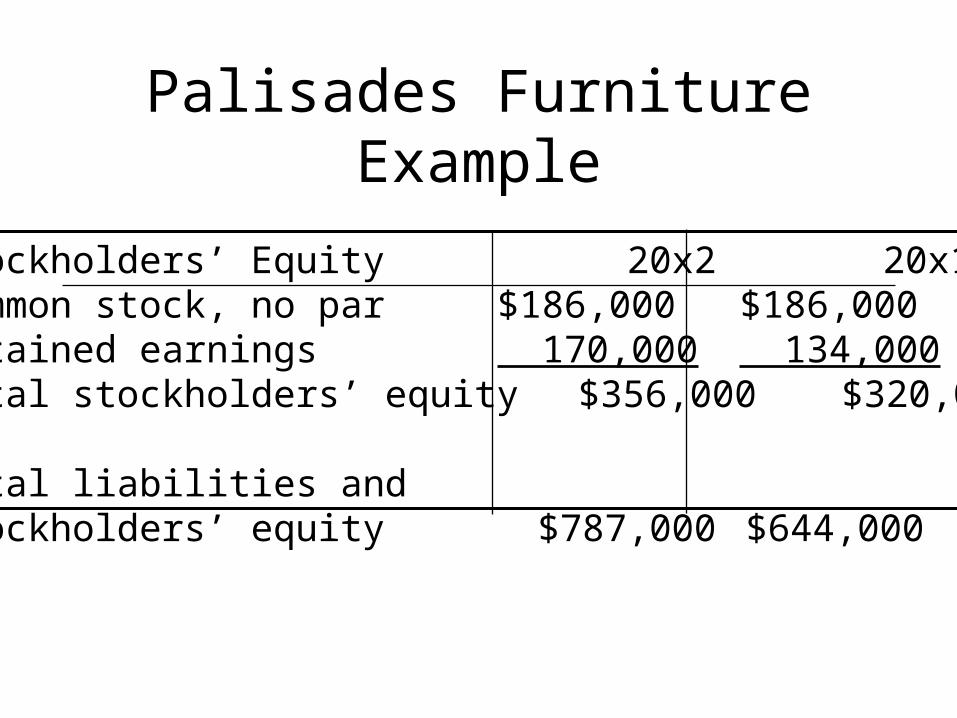
Stockholders’ Equity 20x2 20x1Common stock, no par $186,000 $186,000Retained earnings 170,000 134,000Total stockholders’ equity $356,000 $320,000
Total liabilities andstockholders’ equity $787,000 $644,000
Palisades Furniture Example

Current ratio =Total current assets ÷ Total current liabilities
Current ratio =Total current assets ÷ Total current liabilities
The current ratio measuresthe company’s ability to pay
current liabilities with current assets.
The current ratio measuresthe company’s ability to pay
current liabilities with current assets.
Measuring Ability toPay Current Liabilities

Measuring Ability toPay Current Liabilities
• Palisades’ current ratio:
• 20x1: $236,000 ÷ $126,000 = 1.87
• 20x2: $262,000 ÷ $142,000 = 1.85
• The industry average is 1.80.
• The current ratio decreased slightly during 20x2.

Acid-test ratio =(Cash + Short-term investments
+ Net current receivables)÷ Total current liabilities
Acid-test ratio =(Cash + Short-term investments
+ Net current receivables)÷ Total current liabilities
Measuring Ability toPay Current Liabilities
The acid-test ratio shows the company’sability to pay all current liabilities
if they come due immediately.
The acid-test ratio shows the company’sability to pay all current liabilities
if they come due immediately.
Measuring Ability toPay Current Liabilities
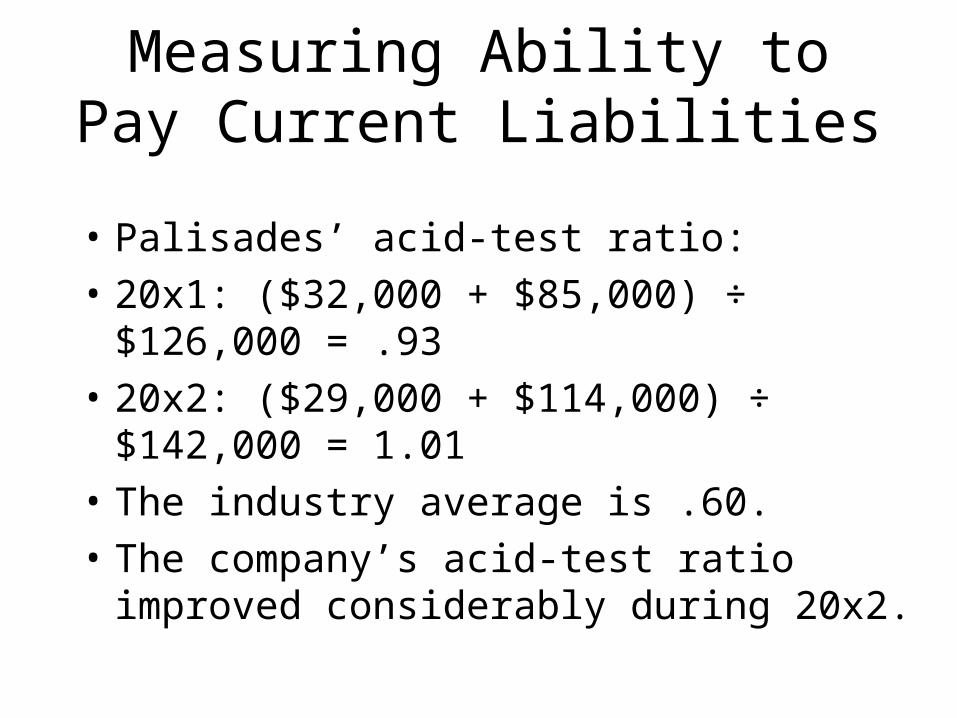
• Palisades’ acid-test ratio:
• 20x1: ($32,000 + $85,000) ÷ $126,000 = .93
• 20x2: ($29,000 + $114,000) ÷ $142,000 = 1.01
• The industry average is .60.
• The company’s acid-test ratio improved considerably during 20x2.

Inventory turnover = Cost of goods sold÷ Average inventory
Inventory turnover = Cost of goods sold÷ Average inventory
Inventory turnover is a measureof the number of times the average
level of inventory is sold during a year.
Inventory turnover is a measureof the number of times the average
level of inventory is sold during a year.
Measuring Ability toSell Inventory

Measuring Ability toSell Inventory
• Palisades’ inventory turnover:
• 20x2: $513,000 ÷ $112,000 = 4.58
• The industry average is 2.70.
• A high number indicates an ability to quickly sell inventory.
Accounts receivable turnover =Net credit sales ÷ Average accounts receivable
Accounts receivable turnover =Net credit sales ÷ Average accounts receivable
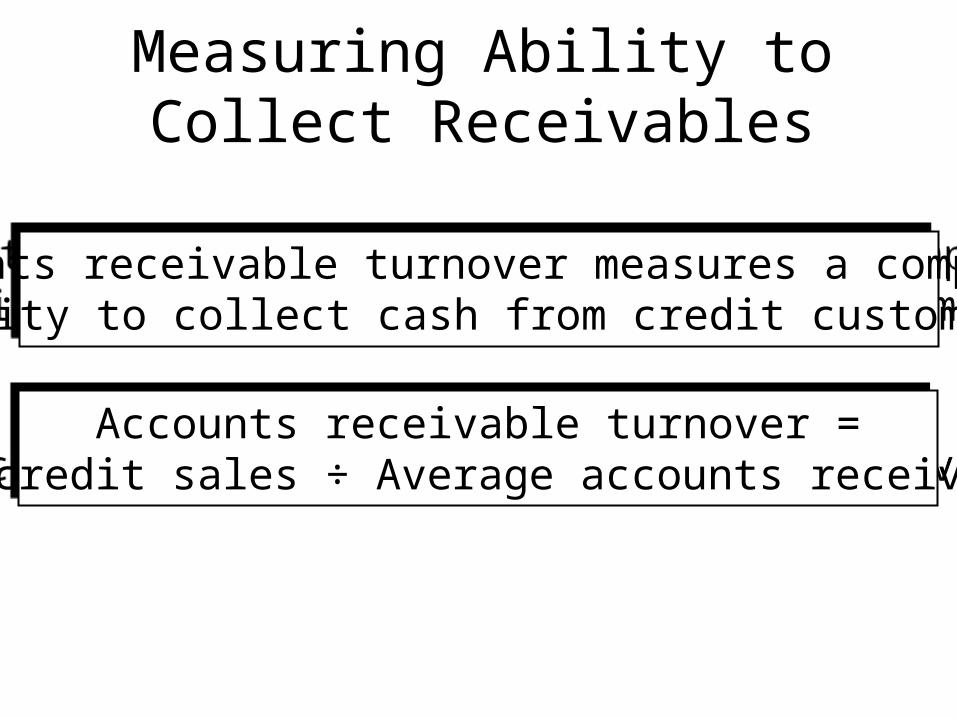
Accounts receivable turnover measures a company’sability to collect cash from credit customers.
Accounts receivable turnover measures a company’sability to collect cash from credit customers.
Measuring Ability toCollect Receivables

Measuring Ability toCollect Receivables
• Palisades’ accounts receivable turnover:
• 20x2: $858,000 ÷ $99,500 = 8.62 times
• The industry average is 22.2 times.
• Palisades’ receivable turnover is much lower than the industry average.
• The company is a home-town store that sells to local people who tend to pay their bills over a lengthy period of time.

One day’s sales = Net sales ÷ 365 daysOne day’s sales = Net sales ÷ 365 days
Days’ sales in Accounts Receivable =Average net Accounts Receivable ÷ One day’s sales
Days’ sales in Accounts Receivable =Average net Accounts Receivable ÷ One day’s sales
Measuring Ability toCollect Receivables
Days’ sales in receivable ratio measures howmany day’s sales remain in Accounts Receivable.
Days’ sales in receivable ratio measures howmany day’s sales remain in Accounts Receivable.

Measuring Ability toCollect Receivables
• Palisades’ days’ sales in Accounts Receivable for 20x2:
• One day’s sales:
• $858,000 ÷ 365 = $2,351
• Days’ sales in Accounts Receivable:
• $99,500 ÷ $2,351 = 42 days
• The industry average is 16 days.
Total liabilities ÷ Total assetsTotal liabilities ÷ Total assets
Measuring Ability toPay Debt
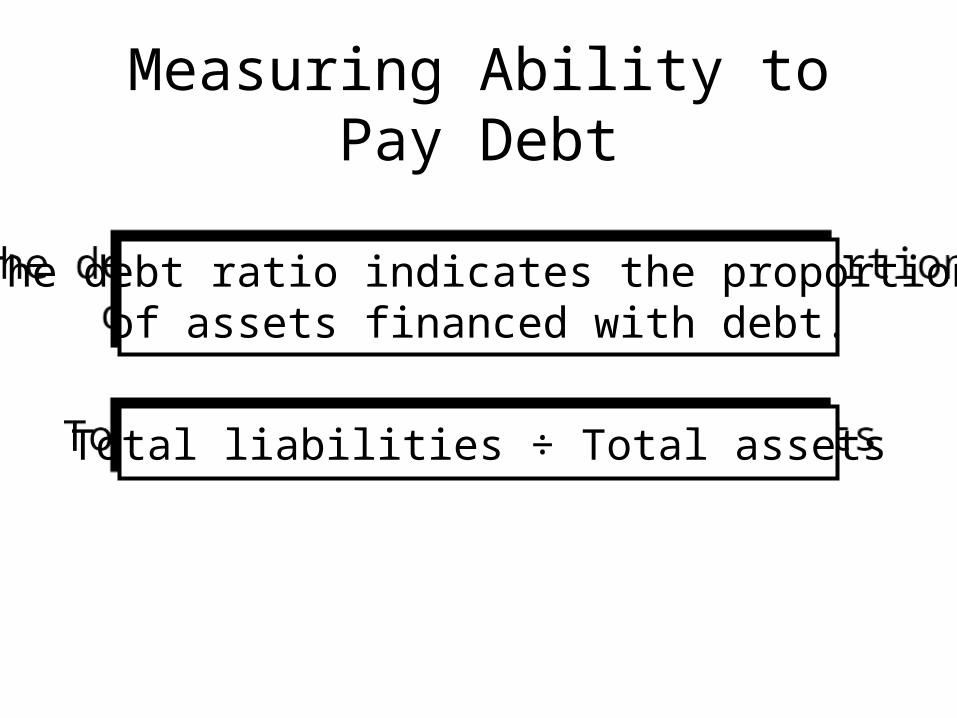
The debt ratio indicates the proportionof assets financed with debt.
The debt ratio indicates the proportionof assets financed with debt.
Measuring Ability toPay Debt
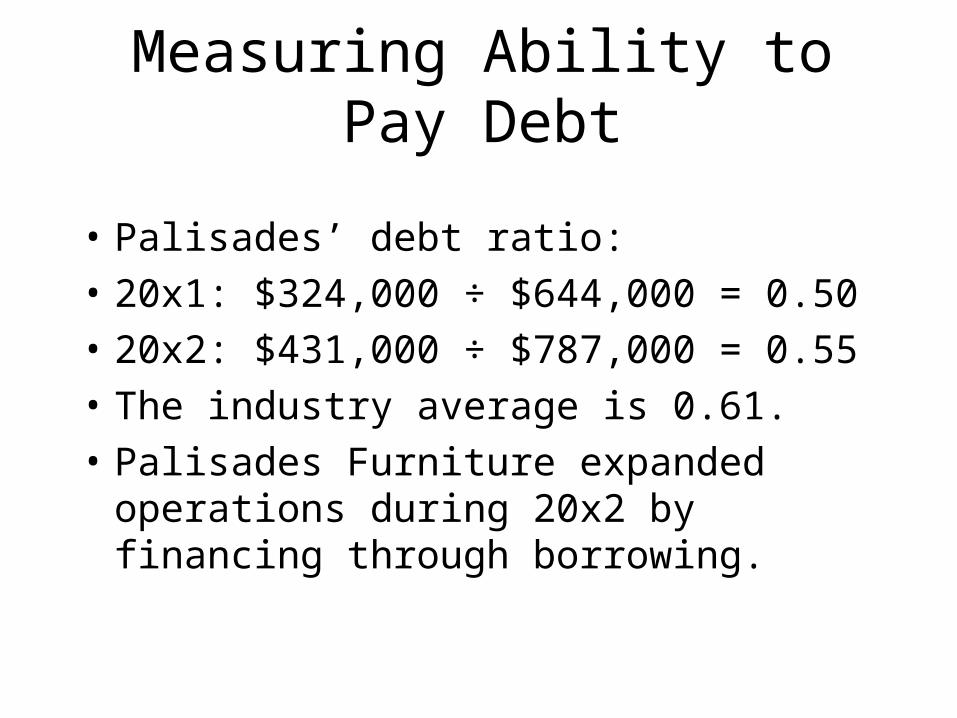
• Palisades’ debt ratio:
• 20x1: $324,000 ÷ $644,000 = 0.50
• 20x2: $431,000 ÷ $787,000 = 0.55
• The industry average is 0.61.
• Palisades Furniture expanded operations during 20x2 by financing through borrowing.
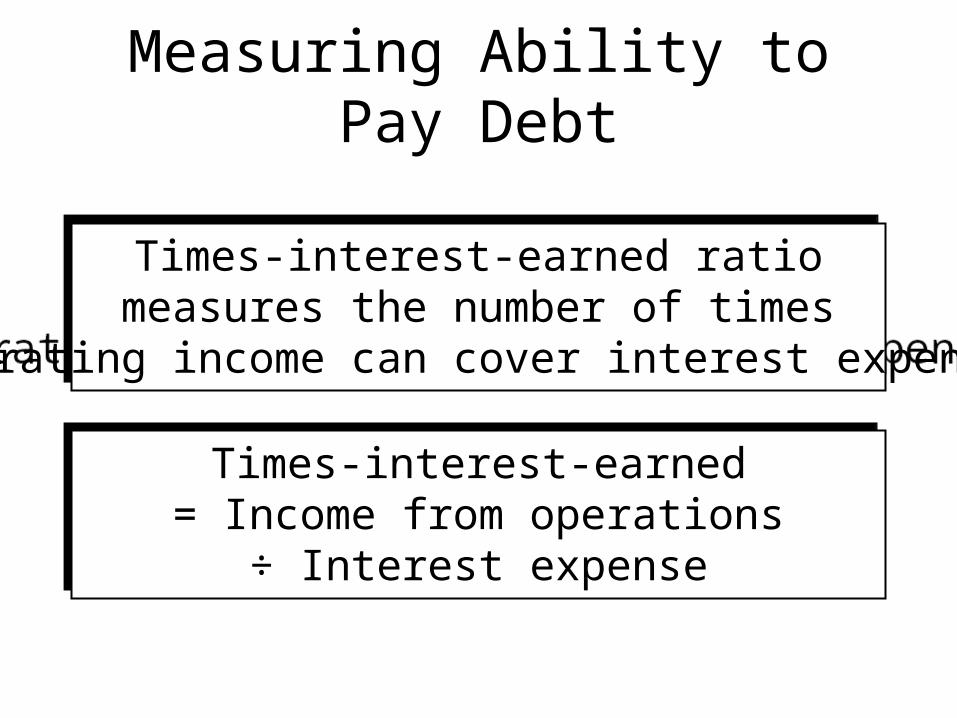
Times-interest-earned= Income from operations
÷ Interest expense
Times-interest-earned= Income from operations
÷ Interest expense
Measuring Ability toPay Debt
Times-interest-earned ratiomeasures the number of times
operating income can cover interest expense.
Times-interest-earned ratiomeasures the number of times
operating income can cover interest expense.

Measuring Ability toPay Debt
• Palisades’ times-interest-earned ratio:
• 20x1: $ 57,000 ÷ $14,000 = 4.07
• 20x2: $101,000 ÷ $24,000 = 4.21
• The industry average is 2.00.
• The company’s times-interest-earned ratio increased in 20x2.
• This is a favorable sign.

Rate of return on net sales =Net income ÷ Net sales
Rate of return on net sales =Net income ÷ Net sales
Measuring Profitability
Rate of return on net sales shows the percentageof each sales dollar earned as net income.
Rate of return on net sales shows the percentageof each sales dollar earned as net income.

Measuring Profitability
• Palisades’ rate of return on sales:
• 20x1: $26,000 ÷ $803,000 = 0.032
• 20x2: $48,000 ÷ $858,000 = 0.056
• The industry average is 0.008.
• The increase is significant in itself and also because it is much better than the industry average.

Rate of return on total assets = (Net income + interest expense) ÷ Average total assets
Rate of return on total assets = (Net income + interest expense) ÷ Average total assets
Measuring Profitability
Rate of return on total assets measureshow profitably a company uses its assets.
Rate of return on total assets measureshow profitably a company uses its assets.

Measuring Profitability
• Palisades’ rate of return on total assets for 20x2:
• ($48,000 + $24,000) ÷ $715,500 = 0.101
• The industry average is 0.049.
• How does Palisades compare to the industry?
• Very favorably.
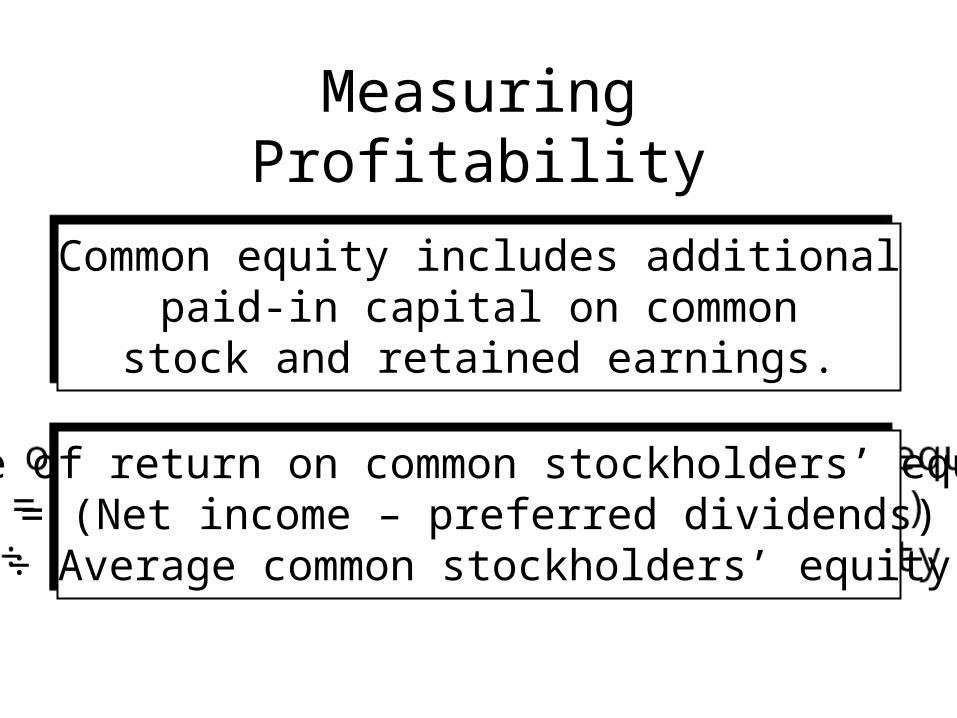
Rate of return on common stockholders’ equity= (Net income – preferred dividends)
÷ Average common stockholders’ equity
Rate of return on common stockholders’ equity= (Net income – preferred dividends)
÷ Average common stockholders’ equity
Measuring Profitability
Common equity includes additionalpaid-in capital on commonstock and retained earnings.
Common equity includes additionalpaid-in capital on commonstock and retained earnings.

Measuring Profitability
• Palisades’ rate of return on common stockholders’ equity for 20x2:
• ($48,000 – $0) ÷ $338,000 = 0.142
• The industry average is 0.093.
• Why is this ratio larger than the return on total assets (.101)?
• Because Palisades uses leverage.

Measuring Profitability
Earnings per share of common stock= (Net income – Preferred dividends)
÷ Number of shares of common stock outstanding
Earnings per share of common stock= (Net income – Preferred dividends)
÷ Number of shares of common stock outstanding

Measuring Profitability
• Palisades’ earnings per share:
• 20x1: ($26,000 – $0) ÷ 10,000 = $2.60
• 20x2: ($48,000 – $0) ÷ 10,000 = $4.80
• This large increase in EPS is considered very unusual.
Analyzing Stock as an Investment
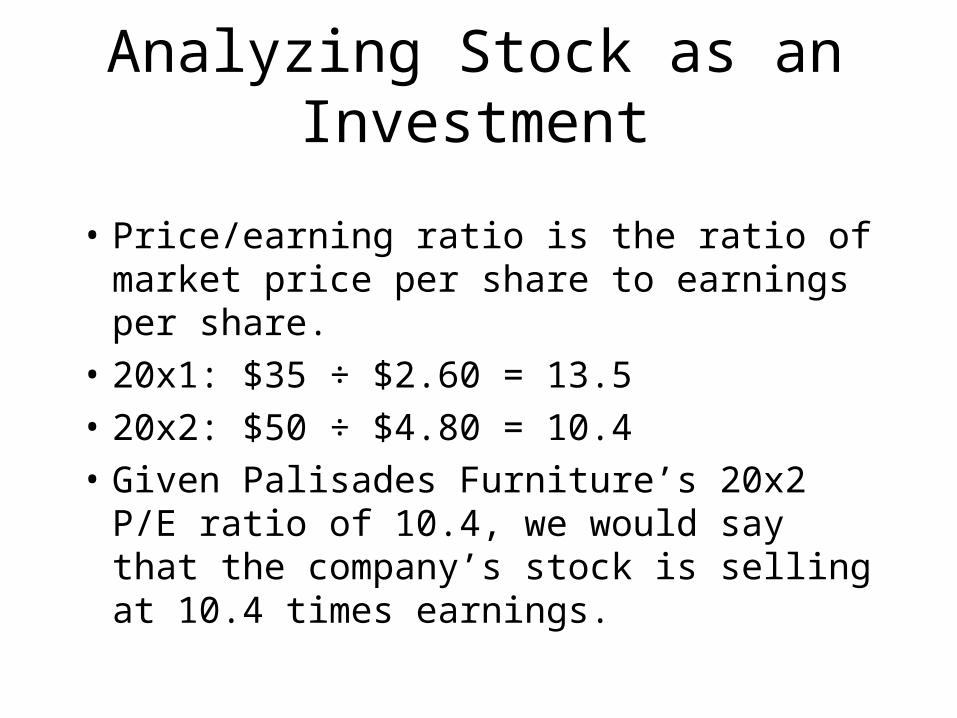
• Price/earning ratio is the ratio of market price per share to earnings per share.
• 20x1: $35 ÷ $2.60 = 13.5
• 20x2: $50 ÷ $4.80 = 10.4
• Given Palisades Furniture’s 20x2 P/E ratio of 10.4, we would say that the company’s stock is selling at 10.4 times earnings.

Dividend per share of common(or preferred) stock ÷ Market price per share
of common (or preferred) stock
Dividend per share of common(or preferred) stock ÷ Market price per share
of common (or preferred) stock
Analyzing Stock as an Investment
Dividend yield shows the percentageof a stock’s market value returned as
dividends to stockholders each period.
Dividend yield shows the percentageof a stock’s market value returned as
dividends to stockholders each period.

Analyzing Stock as an Investment
• Dividend yield on Palisades’ common stock:
• 20x1: $1.00 ÷ $35.00 = .029 (2.9%)
• 20x2: $1.20 ÷ $50.00 = .024 (2.4%)
• An investor who buys Palisades Furniture common stock for $50 can expect to receive 2.4% of the investment annually in the form of cash dividends.

Analyzing Stock as an Investment
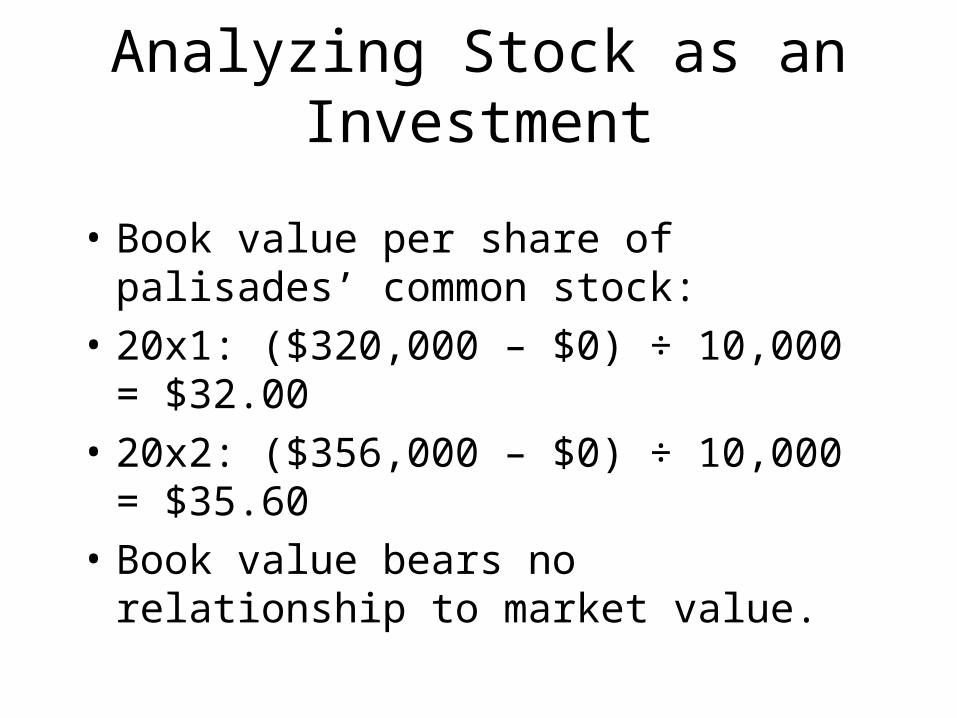
Book value per share of common stock= (Total stockholders’ equity – Preferred equity)
÷ Number of shares of common stock outstanding
Book value per share of common stock= (Total stockholders’ equity – Preferred equity)
÷ Number of shares of common stock outstanding
Analyzing Stock as an Investment
• Book value per share of palisades’ common stock:
• 20x1: ($320,000 – $0) ÷ 10,000 = $32.00
• 20x2: ($356,000 – $0) ÷ 10,000 = $35.60
• Book value bears no relationship to market value.

Objective 5
Use ratios in decision making.

Limitations of Financial Analysis
• Business decisions are made in a world of uncertainty.
• No single ratio or one-year figure should be relied upon to provide an assessment of a company’s performance.

Objective 6
Measure economic value added.

Economic Value Added (EVA®)
• Economic value added (EVA®) combines accounting income and corporate finance to measure whether the company’s operations have increased stockholder wealth.
• EVA® = Net income + Interest expense – Capital charge