financial statements 2016 · 2017-12-18 · finland tel. +358 9 758 71 [email protected] . 2 for...
TRANSCRIPT

www.marimekko.com Financial Statements 2016
Fin
an
cia
l Sta
tem
en
ts 20
16


1
CONTENTS
From the President and CEO
Report of the Board of Directors and the financial statements
for the financial period from 1 January to 31 December 2016
Report of the Board of Directors
Proposal for dividends
Consolidated financial statements, IFRS
Consolidated income statement
Consolidated balance sheet
Consolidated cash flow statement
Consolidated statement of changes in shareholders’ equity
Notes to the consolidated financial statements
Parent company financial statements, FAS
Parent company income statement
Parent company balance sheet
Parent company cash flow statement
Notes to the parent company financial statements
Group key figures
Share and shareholders
Signatures to the financial statements and the report of
the Board of Directors
Auditor’s report
Corporate Governance
Board of Directors and management
Information for shareholders
Colour and joy for everyday life
Marimekko is a Finnish design company
whose original prints and colours have
brought joy to people’s everyday lives
since 1951. Our product portfolio includes
high-quality clothing, bags and accessories
as well as home décor items ranging from
textiles to tableware. Quality, functionality
and timelessness are the cornerstones on
which our recognisable design has always
been built.
When Marimekko was founded, its
unparalleled printed fabrics gave it
a strong and unique identity. Textile
printing continues to be at the core of our
operations, and today our printing factory
in Helsinki produces around a million
metres of fabric every year.
Our products are sold in about 40
countries. In 2016, brand sales of the
products worldwide amounted to 194
million euros and our net sales were
close to 100 million euros. Roughly 160
Marimekko stores serve customers around
the globe. Our key markets are Northern
Europe, North America and the Asia-Pacific
region. We employ about 400 people.
The Marimekko share is quoted on Nasdaq
Helsinki Ltd.
2
5
5
12
14
14
15
16
17
18
40
40
41
42
43
52
54
58
59
65
74
76
© Marimekko CorporationPuusepänkatu 4 00880 HelsinkiFinland
Tel. +358 9 758 [email protected]

2
For Marimekko, the year 2016 was
a year of building and improving
profitability. We succeeded in restoring
our profitability to a good level. Our
trend in profits in the final quarter and
all in all for the second half of the year
was very good in comparison with the
previous year. The trend was supported
by the reorganisation carried out in the
early months of the year. Our net sales
for the whole year grew by 4 percent to
99.6 million euros (95.7); our operating
profit improved to 5.2 million euros
(1.5), and our comparable operating
profit was 6.1 million euros (1.5).
We continued our moderate
international expansion with the main
thrust on openings of retailer-owned
Marimekko stores. Of the 14 new stores
opened during the year, 11 are located
in the important Asia-Pacific region. In
Australia, we opened our fifth company-
owned store in November; our online
store opened there in April as part of
our continued efforts to develop our
digital business. In January 2017, we
announced that we have improved the
availability of our products in Europe by
extending our e-commerce to 16 new
countries. At the moment, our online
store reaches customers in 29 countries.
In September 2016, a new washing
machine worth around a million euros
came online at our textile printing
factory in Helsinki, where we print
about a million metres of fabric per
year. Investments in our own printing
factory are important because we want
to ensure that the factory provides us
with an ongoing and flexible ability to
innovate. Consumers around the world
are increasingly interested in knowing
where, how and by whom their products
have been made. The in-house printing
factory helps to underpin our expertise
in print design as a strong factor of
differentiation and as an international
competitive advantage.
The revamp of our collections and
our brand progressed, and this long-
term development work still continues.
Our strengths in intense competition
include the uniqueness of our brand and
our recognisable design language. Since
the beginning of our company, we have
remained true to our mission of bringing
joy to people’s everyday lives. Building
on Marimekko’s original, positive and
colourful design philosophy, we are
now going to enhance the commercial
prospects of our collections and seek
markedly stronger growth than before.
We have decided to move on to the
next stage in our design and product
development work. Anna Teurnell,
our creative director for the past two
and a half years, stepped down from
her position in February 2017, and I
want to thank Anna for her important
contribution to the development of
our collections in particular within the
ready-to-wear line. We have modernised
the line by improving combinability
and introducing versatility in materials,
which has resulted in increased
international interest in our brand.
Having reached this point, our design
and product development team is well
poised to continue the development of
our ready-to-wear collections to serve an
even wider group of customers around
the world.
From the Presidentand CEO

3From the President and CEO
There are signs of recovery in the
overall state of the retail market, but the
uncertainty over the global economy
that has overshadowed our sector for
years does not look like easing up this
year either. Consumers in all markets
are increasingly price-conscious. In
Finland, retailing has gone into a slight
upswing after several weaker years, but
the trend is forecast to be moderate.
I am confident that the implemented
reorganisation and enhanced efficiency
of operations will improve our chances
for growth in the coming years, and I
want to thank our skilled and committed
personnel for doing an excellent job in a
challenging operating environment. We
are now continuing our long-term work
towards profitable growth and reinforced
competitiveness.
This year, we have good reason to
celebrate as independent Finland has
its 100th anniversary. Our centenary
theme, “bold patterns for Finland”,
is strongly based on doing things
together, and throughout the year, we
will organise events encouraging people
to view traditional things from new
and unusual perspectives. A successful
future for Finland will be built by doing
things together and crossing boundaries
open-mindedly. Collaboration cultivates
an atmosphere of openness and trust –
a prerequisite for boldness and
creativity.
Tiina Alahuhta-Kasko
”Since the beginning of our company,
we have remained true to our mission of
bringing joy to people’s everyday lives.”

4
5
¹ Estimated sales of Marimekko products at consumer prices. Brand sales are calculated by adding together the company’s own retail sales and the estimated retail value of Marimekko products sold by other retailers. The estimate, based on Marimekko’s realised wholesale sales and royalty income, is unofficial and does not include VAT. This key figure is not audited. The calculation method for 2015 figures has been restated to correspond to licensing agreement terms.
2 Includes the company’s own retail stores, retailer-owned Marimekko stores and shop-in-shops with an area exceeding 30 sqm.
Report of the Board of Directors
2016 IN BRIEF
In 2016, the Marimekko Group’s net
sales grew by 4 percent on the previous
year and were EUR 99.6 million (95.7).
In Finland, net sales amounted to EUR
55.8 million (52.7). International sales
were EUR 43.8 million (43.0). Net sales
were improved by growth in wholesale
sales in Finland, EMEA and the Asia-
Pacific region. Growth in wholesale
sales in Finland was due to nonrecurring
promotional deliveries taking place in
the second half of the year. Net sales
were also boosted by growth in retail
sales in Finland and Australia. All
in all, retail sales grew by 2 percent
and wholesale sales by 9 percent. Brand
sales1 of Marimekko products rose by 10
percent to EUR 194.4 million (176.7).
Marimekko’s operating profit grew
in comparison with the previous year
and was EUR 5.2 million (1.5), including
a restructuring expense of EUR 0.8
million. Comparable operating profit was
EUR 6.1 million (1.5). Operating profit
was improved by a reduced cost level
including lower marketing expenses
than in the comparison year. Also,
operating profit was boosted by growth
in retail and wholesale sales in Finland
as well as growth in wholesale sales
in EMEA and the Asia-Pacific region.
Growth in wholesale sales in Finland
was due to nonrecurring promotional
deliveries. A drag was exerted on
operating profit by discount-driven
retail sales and a downturn in relative
sales margin. Profit after tax was
EUR 4.0 million (0.8) and earnings
per share were EUR 0.50 (0.10).
The Board of Directors will propose to
the Annual General Meeting that
a dividend of EUR 0.40 per share be
paid for 2016 (0.35).
OPERATING ENVIRONMENT
All in all, there is considerable
uncertainty over the global economy,
due partly to the unpredictability of the
political situation. There are several risk
factors, and concern has been growing
over the proliferation of barriers to
trade. Risks are increased, above all, by
uncertainty about the direction of US
economic policy. However, world GDP
is expected to grow at its average rate
of slightly over three percent. Average
growth in the EU countries appears
to be continuing at a fairly modest
rate. Consumers in all markets are
increasingly price-conscious.
In the Finnish economy, a more
positive vibe than before is prevailing,
but exports have not recovered.
Retailing has gone into a slight upswing
after several weaker years and growth
is forecast to continue at a slow pace. In
January, retail trade confidence picked
up somewhat and is now near the long-
term average. Consumer confidence in
the Finnish economy gained strength
in January; the last time it was equally
strong was more than six years ago.
(Confederation of Finnish Industries
EK: Economic Review, 19 December
2016; Confidence Indicators, January
2017; Business Tendency Survey,
February 2017. Statistics Finland:
Consumer Survey, January 2017.)
In 2016, the value of retail sales
in Finland grew by 0.7 percent on the
previous year and the volume of sales,
which measures real growth, rose by
1.6 percent (Statistics Finland: Turnover
of Trade, retail trade flash estimate,
December 2016).
CHANGES IN THE STORE NETWORK
In 2016, the main thrust in expanding the
Marimekko store network continued to be
on openings of retailer-owned Marimekko
stores. The company attained its goal of
opening around 10–20 new Marimekko
stores and shop-in-shops. The company
also continued to enhance the operations
of Marimekko stores opened in recent
years.
In the course of 2016, a total of 14
stores were opened, of which three were
company-owned, four retailer-owned,
and seven shop-in-shops. Of the stores
opened, 11 were located in the company’s
growth market of the Asia-Pacific region.
During the year, a total of eight
Marimekko stores and shop-in-shops were
closed. Of these, three were company-
owned, and they were located in Helsinki
(children’s wear), Berlin, and Täby,
Sweden.
At the end of 2016, the number of
Marimekko stores and shop-in-shops
totalled 159 (153)2. Of these, 55 (55) were
company-owned stores.
6
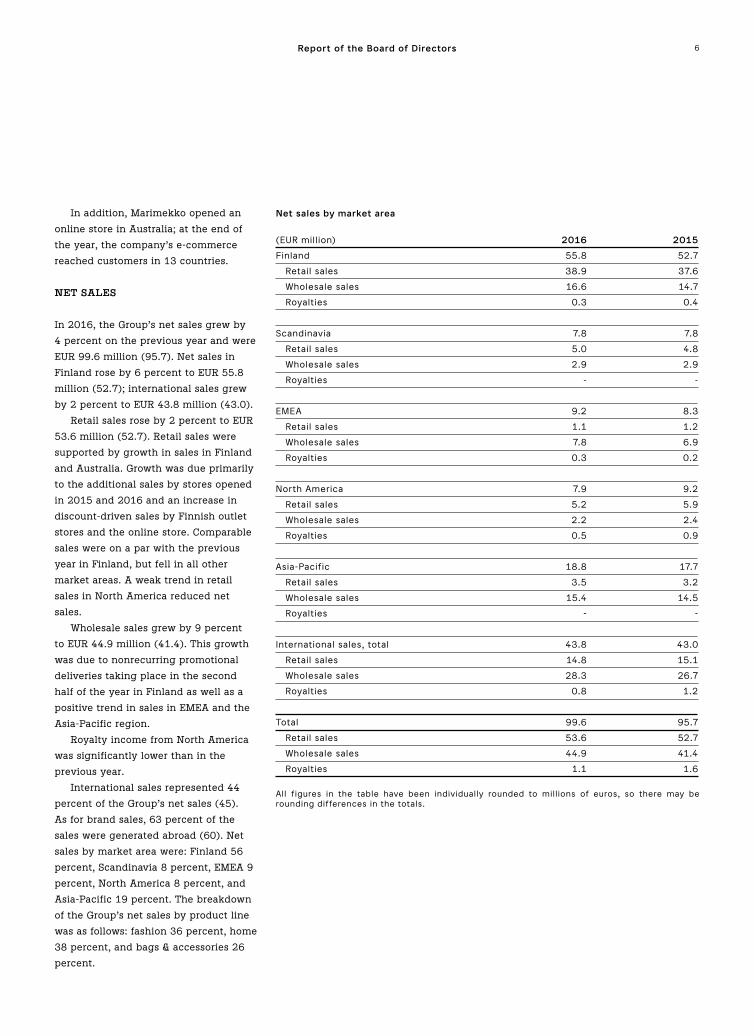
Net sales by market area (EUR million) 2016 2015
Finland 55.8 52.7
Retail sales 38.9 37.6
Wholesale sales 16.6 14.7
Royalties 0.3 0.4
Scandinavia 7.8 7.8
Retail sales 5.0 4.8
Wholesale sales 2.9 2.9
Royalties - -
EMEA 9.2 8.3
Retail sales 1.1 1.2
Wholesale sales 7.8 6.9
Royalties 0.3 0.2
North America 7.9 9.2
Retail sales 5.2 5.9
Wholesale sales 2.2 2.4
Royalties 0.5 0.9
Asia-Pacific 18.8 17.7
Retail sales 3.5 3.2
Wholesale sales 15.4 14.5
Royalties - -
International sales, total 43.8 43.0
Retail sales 14.8 15.1
Wholesale sales 28.3 26.7
Royalties 0.8 1.2
Total 99.6 95.7
Retail sales 53.6 52.7
Wholesale sales 44.9 41.4
Royalties 1.1 1.6
All f igures in the table have been individually rounded to millions of euros, so there may be rounding differences in the totals.
Report of the Board of Directors
In addition, Marimekko opened an
online store in Australia; at the end of
the year, the company’s e-commerce
reached customers in 13 countries.
NET SALES
In 2016, the Group’s net sales grew by
4 percent on the previous year and were
EUR 99.6 million (95.7). Net sales in
Finland rose by 6 percent to EUR 55.8
million (52.7); international sales grew
by 2 percent to EUR 43.8 million (43.0).
Retail sales rose by 2 percent to EUR
53.6 million (52.7). Retail sales were
supported by growth in sales in Finland
and Australia. Growth was due primarily
to the additional sales by stores opened
in 2015 and 2016 and an increase in
discount-driven sales by Finnish outlet
stores and the online store. Comparable
sales were on a par with the previous
year in Finland, but fell in all other
market areas. A weak trend in retail
sales in North America reduced net
sales.
Wholesale sales grew by 9 percent
to EUR 44.9 million (41.4). This growth
was due to nonrecurring promotional
deliveries taking place in the second
half of the year in Finland as well as a
positive trend in sales in EMEA and the
Asia-Pacific region.
Royalty income from North America
was significantly lower than in the
previous year.
International sales represented 44
percent of the Group’s net sales (45).
As for brand sales, 63 percent of the
sales were generated abroad (60). Net
sales by market area were: Finland 56
percent, Scandinavia 8 percent, EMEA 9
percent, North America 8 percent, and
Asia-Pacific 19 percent. The breakdown
of the Group’s net sales by product line
was as follows: fashion 36 percent, home
38 percent, and bags & accessories 26
percent.
7Report of the Board of Directors
NET SALES BY MARKET AREA
Finland
In 2016, net sales in Finland rose by
6 percent to EUR 55.8 million (52.7).
Comparable retail sales were on a par
with the previous year; sales grew by
9 percent in outlet stores, but fell by 5
percent in other stores. Wholesale sales
rose by 13 percent due to nonrecurring
promotional deliveries taking place in
the second half of the year.
Scandinavia
Net sales in Scandinavia held steady
at the previous year’s level and were
EUR 7.8 million (7.8). Euro-denominated
retail sales grew by 3 percent; retail
sales at comparable exchange rates rose
by 1 percent. Wholesale sales in euro
terms fell by 2 percent, while sales at
comparable exchange rates were on a
par with the previous year.
EMEA
In EMEA, net sales rose by 12 percent
and were EUR 9.2 million (8.3). Retail
sales declined by 10 percent, whereas
wholesale sales grew by 14 percent.
North America
Net sales in North America fell by
14 percent to EUR 7.9 million (9.2).
Retail sales declined by 11 percent
and wholesale sales by 9 percent.
The decline in retail sales was partly
attributable to the absence of sales by
the Beverly Hills store, which was closed
towards the end of the first quarter of
the comparison year, and to protracted
construction works in the vicinity of
some stores, including the New York
flagship store. The higher royalty income
booked in the previous year than in
2016 also contributed to the decrease in
net sales.
Asia-Pacific region
Net sales in the Asia-Pacific region grew
by 7 percent to EUR 18.8 million (17.7).
Wholesale sales improved by 6 percent.
In Japan, which is the most important
country in this market area, sales rose
by 6 percent, and in other countries too,
the trend was mostly positive. Retail
sales (Australia) grew by 10 percent,
principally due to additional sales by
stores opened in 2015 and 2016. Sales
by comparable stores in Australia fell
by 3 percent both in euro terms and in
terms of the sales currency.
FINANCIAL RESULT
In 2016, the Group’s operating profit
grew in comparison with the previous
year and was EUR 5.2 million (1.5),
including a restructuring expense
of EUR 0.8 million. Comparable
operating profit was EUR 6.1 million
(1.5). Operating profit was improved
by a reduced cost level including
lower marketing expenses than in the
comparison year. The costs for the
comparison year also included the
considerable expenses associated with
the closure of the store in Beverly Hills.
Operating profit was further boosted
by growth in retail and wholesale
sales in Finland as well as growth in
wholesale sales in EMEA and the Asia-
Pacific region. In Finland, growth in
wholesale sales was due to nonrecurring
promotional deliveries taking place in
the second half of the year. A drag was
exerted on operating profit by discount-
driven retail sales and a downturn in
relative sales margin. Operating profit
was also adversely affected by the
royalty income from North America
booked in the previous year, which was
higher than in 2016.
Marketing expenses for the year
2016 were EUR 4.4 million (5.1) or 4
percent of the Group’s net sales (5).
The Group’s depreciation and
impairments totalled EUR 4.1 million
(4.5) or 4 percent of net sales (5).
Operating profit margin was 5.3
percent (1.6) and comparable operating
profit margin was 6.1 percent (1.6).
Net financial expenses were EUR 0
million (0.2) or 0 percent of net sales
(0). Foreign exchange gains recorded in
net financial items amounted to EUR 0.1
million (0.0).
Result for 2016 before taxes was EUR
5.2 million (1.3). Result after taxes was
EUR 4.0 million (0.8) and earnings per
share were EUR 0.50 (0.10).
BALANCE SHEET
The consolidated balance sheet total
as of 31 December 2016 was EUR 48.5
million (46.1). Equity attributable to the
equity holders of the parent company
was EUR 28.3 million (27.1) or EUR 3.50
per share (3.35).
Non-current assets at the end of
2016 stood at EUR 15.6 million (17.4).
At the end of the year, net working
capital was EUR 15.3 million (13.0).
Inventories were EUR 21.4 million
(18.5).
CASH FLOW AND FINANCING
In 2016, cash flow from operating
activities was EUR 6.1 million (6.3)
or EUR 0.76 per share (0.78). Cash
flow before cash flow from financing
activities was EUR 3.6 million (3.1).
The Group’s financial liabilities at the
end of 2016 were EUR 6.0 million (7.3).
At the end of the year, the Group’s
cash and cash equivalents amounted
to EUR 3.5 million (4.2). In addition,
the Group had unused committed long-
and short-term credit lines of EUR 14.4
million (15.2).
The Group’s equity ratio at the end of
2016 was 58.5 percent (59.0). Gearing
was 8.8 percent (11.3).

8Report of the Board of Directors
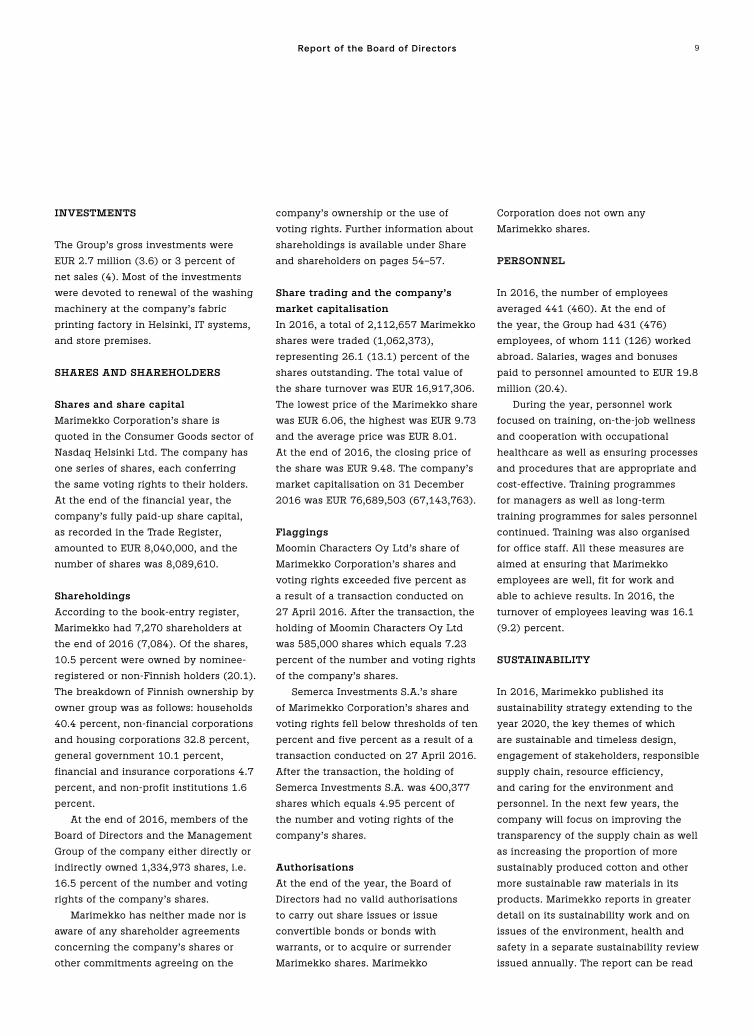
0
1
2
3
4
5
2014
4.1
0.8
4.0
2015 2016
Result after taxes (EUR million)
0
1
2
3
4
2014
2.1***
3.6
2.7
2015 2016
Gross investments (EUR million)
0
20
40
60
80
100
120
2014
94.2 95.7 99.6
2015 2016
Net sales (EUR million)
0
1
2
3
4
5
6
2014
5.6*5.2**
1.5
2015 2016
Operating profit (EUR million)
0
1
2
3
4
5
6
2014
5.9*
5.3**
1.6
2015 2016
Operating profit margin (%)
* Includes a nonrecurring expense of EUR 0.7 million connected with downsizing resulting from the statutory consultative negotiations completed in March 2014.
** Includes a nonrecurring expense of EUR 0.8 million connected with downsizing resulting from the statutory consultative negotiations completed in March 2016. *** Excluding finance lease investments.
0
100
200
300
400
500
600
2014
473 460 441
2015 2016
Average personnelEquity ratio (%)
0
20
40
60
80
2014
61.6 59.0 58.5
2015 2016
9Report of the Board of Directors
INVESTMENTS
The Group’s gross investments were
EUR 2.7 million (3.6) or 3 percent of
net sales (4). Most of the investments
were devoted to renewal of the washing
machinery at the company’s fabric
printing factory in Helsinki, IT systems,
and store premises.
SHARES AND SHAREHOLDERS
Shares and share capital
Marimekko Corporation’s share is
quoted in the Consumer Goods sector of
Nasdaq Helsinki Ltd. The company has
one series of shares, each conferring
the same voting rights to their holders.
At the end of the financial year, the
company’s fully paid-up share capital,
as recorded in the Trade Register,
amounted to EUR 8,040,000, and the
number of shares was 8,089,610.
Shareholdings
According to the book-entry register,
Marimekko had 7,270 shareholders at
the end of 2016 (7,084). Of the shares,
10.5 percent were owned by nominee-
registered or non-Finnish holders (20.1).
The breakdown of Finnish ownership by
owner group was as follows: households
40.4 percent, non-financial corporations
and housing corporations 32.8 percent,
general government 10.1 percent,
financial and insurance corporations 4.7
percent, and non-profit institutions 1.6
percent.
At the end of 2016, members of the
Board of Directors and the Management
Group of the company either directly or
indirectly owned 1,334,973 shares, i.e.
16.5 percent of the number and voting
rights of the company’s shares.
Marimekko has neither made nor is
aware of any shareholder agreements
concerning the company’s shares or
other commitments agreeing on the
company’s ownership or the use of
voting rights. Further information about
shareholdings is available under Share
and shareholders on pages 54–57.
Share trading and the company’s
market capitalisation
In 2016, a total of 2,112,657 Marimekko
shares were traded (1,062,373),
representing 26.1 (13.1) percent of the
shares outstanding. The total value of
the share turnover was EUR 16,917,306.
The lowest price of the Marimekko share
was EUR 6.06, the highest was EUR 9.73
and the average price was EUR 8.01.
At the end of 2016, the closing price of
the share was EUR 9.48. The company’s
market capitalisation on 31 December
2016 was EUR 76,689,503 (67,143,763).
Flaggings
Moomin Characters Oy Ltd’s share of
Marimekko Corporation’s shares and
voting rights exceeded five percent as
a result of a transaction conducted on
27 April 2016. After the transaction, the
holding of Moomin Characters Oy Ltd
was 585,000 shares which equals 7.23
percent of the number and voting rights
of the company’s shares.
Semerca Investments S.A.’s share
of Marimekko Corporation’s shares and
voting rights fell below thresholds of ten
percent and five percent as a result of a
transaction conducted on 27 April 2016.
After the transaction, the holding of
Semerca Investments S.A. was 400,377
shares which equals 4.95 percent of
the number and voting rights of the
company’s shares.
Authorisations
At the end of the year, the Board of
Directors had no valid authorisations
to carry out share issues or issue
convertible bonds or bonds with
warrants, or to acquire or surrender
Marimekko shares. Marimekko
Corporation does not own any
Marimekko shares.
PERSONNEL
In 2016, the number of employees
averaged 441 (460). At the end of
the year, the Group had 431 (476)
employees, of whom 111 (126) worked
abroad. Salaries, wages and bonuses
paid to personnel amounted to EUR 19.8
million (20.4).
During the year, personnel work
focused on training, on-the-job wellness
and cooperation with occupational
healthcare as well as ensuring processes
and procedures that are appropriate and
cost-effective. Training programmes
for managers as well as long-term
training programmes for sales personnel
continued. Training was also organised
for office staff. All these measures are
aimed at ensuring that Marimekko
employees are well, fit for work and
able to achieve results. In 2016, the
turnover of employees leaving was 16.1
(9.2) percent.
SUSTAINABILITY
In 2016, Marimekko published its
sustainability strategy extending to the
year 2020, the key themes of which
are sustainable and timeless design,
engagement of stakeholders, responsible
supply chain, resource efficiency,
and caring for the environment and
personnel. In the next few years, the
company will focus on improving the
transparency of the supply chain as well
as increasing the proportion of more
sustainably produced cotton and other
more sustainable raw materials in its
products. Marimekko reports in greater
detail on its sustainability work and on
issues of the environment, health and
safety in a separate sustainability review
issued annually. The report can be read
10Report of the Board of Directors
on the company’s website at company.
marimekko.com under Sustainability/
Sustainability review. The core level of
the GRI G4 guidelines provides the basis
for reporting. The next review will be
issued in spring 2017.
THE ENVIRONMENT, HEALTH
AND SAFETY
The environment
Care for the environment is one of
the cornerstones of Marimekko’s
business. The environmental aspects of
Marimekko’s in-house manufacturing
are related to the operations of the
textile printing factory in Herttoniemi,
Helsinki. Operating methods are
improved constantly for the monitoring
and minimising of environmental
impacts of manufacturing and other
business operations. Subcontractors
are contractually obligated to
commit themselves to shouldering
their environmental responsibilities.
Marimekko seeks to mitigate climate
change through energy efficiency and
by using renewable energy sources, by
reducing water consumption, and by
minimising, recycling and repurposing
waste. The goal is to continuously
reduce environmental impacts and to
enhance resource efficiency. Results are
achieved through close collaboration
between design, product development
and manufacturing.
Health and safety
Safety and well-being in the workplace
are actively monitored and improved
at Marimekko in collaboration with
the workplace safety committee and
occupational healthcare. Occupational
wellness is supported by promoting the
employees’ health, job and functional
capacity as well as their quality of life
in many ways. For instance, Marimekko
applies an early-intervention model
which provides support for the working
community. Securing a safe working
environment means the advance
prevention of accidents as well as
recognising and avoiding hazards
and near-misses. In order to prevent
potential hazards, personnel are trained
in issues of occupational safety and
safety risks are regularly monitored.
During 2016, the sickness absence
percentage based on theoretical regular
working hours was 2.6 (2.5) percent
among Marimekko’s employees in
Finland.
RESEARCH AND DEVELOPMENT
Marimekko’s product planning and
development costs arise from the design
of collections. Design costs are recorded
in expenses.
MANAGEMENT
Board of Directors, management
and auditors
Marimekko Corporation’s Board of
Directors are elected by the Annual
General Meeting. According to the
Articles of Association, the Board of
Directors shall consist of four to seven
members. Their term of office ends
at the conclusion of the next Annual
General Meeting. The Board elects a
Chairman from amongst its members.
The duties and responsibilities of
the Board of Directors are determined
primarily by the Articles of Association
and the Finnish Companies Act. The
Board deliberates on all matters that
are significant to the Marimekko
Group’s business operations. These
include approving strategic policies,
budgets and operating plans, and
deciding on significant investments,
mergers and acquisitions. The Articles
of Association do not provide the Board
of Directors or the President and CEO
with any powers other than those that
are customary. Decisions to amend the
Articles of Association or to increase the
share capital are made pursuant to the
provisions of the Finnish Companies Act
in force.
The Annual General Meeting
appointed six members to the company’s
Board of Directors. Elina Björklund, Arthur
Engel, Mika Ihamuotila, Mikko-Heikki
Inkeroinen, Joakim Karske and Catharina
Stackelberg-Hammarén were re-elected.
The Board is chaired by Mika Ihamuotila
and vice-chaired by Elina Björklund.
From among its members, the Board
of Directors elected Elina Björklund
as Chairman and Joakim Karske and
Catharina Stackelberg-Hammarén as
members of the Audit and Remuneration
Committee.
The Annual General Meeting resolved
that the annual remuneration payable to
the members of the Board of Directors
will be as follows: EUR 40,000 to the
Chairman, EUR 30,000 to the Vice
Chairman and EUR 22,000 to the other
members of the Board. Approximately
40 percent of the annual remuneration
would be paid in Marimekko
Corporation’s shares acquired from the
market and the rest in cash. In addition,
the Annual General Meeting resolved that
the remuneration will be paid entirely
in cash if the Board member on the date
of the Annual General Meeting, 11 April
2016, held the company’s shares worth
more than EUR 500,000. It was further
decided that no separate remuneration
will be paid for committee work to
persons elected to any committee. In
the remuneration payable to the Vice
Chairman of the Board, charing the Audit
and Remuneration Committee has been
taken into account.
The Board of Directors elects the
President and CEO and decides on
the President and CEO’s salary and
other remuneration on the basis of the
proposal of the Audit and Remuneration
Committee. The duties of the President
and CEO are set down in the Finnish

11Report of the Board of Directors
Companies Act. The post of Marimekko
Corporation’s President and CEO is held
by Tiina Alahuhta-Kasko.
The following changes took place
in the company’s management in
2016. Chief Product Office (CPO) Niina
Nenonen resigned her membership of
the Management Group on 15 March
2016; she continues with the company
as Head of Global Partner Sales,
being responsible for the strategically
important partner markets especially
in Asia. Lasse Lindqvist resigned as
Chief Marketing Officer (CMO) and
member of the Management Group on
15 June 2016. Marimekko announced
on 15 September 2016 that Päivi Paltola
has been appointed as the company’s
new Chief Marketing Officer (CMO)
and Management Group member; she
started in her post on 30 January 2017.
Also, the company announced on 29
November 2016 that Tanya Strohmayer
has been appointed as the company’s
new HR Director and member of the
Management Group; she will start in her
post on 10 February 2017.
At the end of the year, the
composition of the company’s
Management Group was as follows:
Tiina Alahuhta-Kasko as Chairman and
Elina Aalto (finance and administration),
Päivi Lonka (sales) and Anna Teurnell
(design) as members.
The Annual General Meeting re-
elected PricewaterhouseCoopers Oy,
Authorised Public Accountants, as the
company’s auditor, with Ylva Eriksson,
Authorised Public Accountant, as chief
auditor. It was decided that the auditor’s
fee will be paid by invoice.
Changes in governance model
On 22 February 2016, Marimekko
Corporation’s Board of Directors resolved
to change Marimekko’s governance
model, in which the duties of the
CEO and the President were separate.
Following the change, President Tiina
Alahuhta-Kasko’s role also includes
the duties of the CEO, involving
among other things responsibility
for developing and implementing
Marimekko’s strategy together with
the Management Group as well as
managing the company’s financial
affairs and stakeholder relations. Tiina
Alahuhta-Kasko has served as President
of Marimekko since 9 April 2015. Mika
Ihamuotila, who previously held the
post of CEO, continues to be employed
by the company pursuant to his full-
time executive service agreement.
Marimekko’s Annual General Meeting
elected him as a member of the Board of
Directors and, from among its members,
the Board elected him as its chairman.
Thereafter his post has been full-time
Chairman of the Board. These changes
came into effect after the Annual
General Meeting of 11 April 2016.
Corporate governance statement
The corporate governance statement is
issued separately from this Report of
the Board of Directors. It can be found
on the company’s website at Investors/
Management/Corporate Governance.
OTHER EVENTS DURING 2016
Consultative negotiations and
streamlining of operations
In early 2016, Marimekko conducted
consultative negotiations in order to
improve profitability and to streamline
the company’s operations and cost
structure. The negotiations included all
operations in Finland with the exception
of the personnel in company-owned
retail stores. There were 195 employees
within the scope of the negotiations.
The negotiations reached the conclusion
that operations can be streamlined
with fewer personnel reductions
than estimated, and they led to the
termination of 35 jobs.
All of the company’s fixed costs
were also scrutinised. Annual savings
from streamlining and reorganising
operations are approximately EUR 2.1
million. Most of the profit improvement
resulting from the cost savings was
visible as of the second quarter of 2016.
In connection with the downsizing, the
company posted a restructuring expense
of EUR 0.8 million for 2016.
MAJOR RISKS AND FACTORS OF
UNCERTAINTY
The global economic cycle and factors
of uncertainty affect consumers’
purchasing behaviour and buying power
in all of the company’s market areas.
The major strategic risks for the near
future are associated with the trend
in consumer confidence and overall
economic trends especially in Finland
and Japan, which are the company’s
biggest single countries for business.
Near-term strategic risks also
include risks related to changes in the
company’s design, the focal points of
collections, the product assortment and
product pricing, as well as increased
competition arising from the digitisation
of retailing. The company’s ability to
design, develop and commercialise
new products that meet consumers’
expectations while ensuring effective
production, sourcing and logistics has
an impact on the company’s sales and
profitability. International e-commerce
increases the options available to
consumers and multichannel business
is of growing importance in the retail
trade. Strengthening competitiveness
in a rapidly changing operating
environment being revolutionised
by digitisation demands agility,
efficiency and constant re-evaluation of
operations.
The distribution of Marimekko
products is being expanded in all
key market areas. Growth is based
primarily on opening retailer-owned
12Report of the Board of Directors
Marimekko stores and shop-in-shops
and expanding e-commerce as well
as setting up company-owned stores.
Changes in distribution channel
solutions may impact the company’s
sales and profitability. Expanding the
network of company-owned stores and
building international e-commerce have
increased the company’s investments,
lease liabilities of store premises and
inventories as well as the company’s
fixed costs. Furthermore, major
partnership agreements, the selection of
partners, and store lease agreements in
Finland and abroad involve risks.
Intellectual property rights play a
vital role in the company’s success,
and the company’s ability to manage
these rights may have an impact on the
value and reputation of the company.
Agreements with freelance designers
and fees paid to designers based on
these agreements are also an essential
part of the management of intellectual
property rights.
The company’s operational risks
prominently include those related
to the management and success of
modernisation and internationalisation,
the operational reliability of
procurement and logistics processes
and information systems, and changes
in the prices of raw materials and other
procurement items. The company
primarily uses subcontractors to
manufacture its products. Of the
sustainability aspects of manufacturing,
those related to the supply chain
and enhancing its transparency, in
particular, are of growing importance to
customers. Any delays or disturbances
in supply, or fluctuations in the quality
of products, may have a harmful impact
on business. As product distribution
is expanded and operations are
diversified, risks associated with
inventory management also grow. As
Marimekko is a small company, ongoing
modernisation and development projects
increase risks related to key personnel.
Among the company’s financial risks,
those related to the structure of sales,
price trends for factors of production,
changes in cost structure, changes in
exchange rates (particularly the US
dollar, Swedish krona and Australian
dollar), taxation, and customers’
liquidity may have an impact on the
company’s financial status.
A more detailed description of
Marimekko’s risk management process
is available on the company’s website
under Investors/Management/Risk
management and risks.
MARKET OUTLOOK AND
GROWTH TARGETS
The general uncertainty in the global
economy is forecast to continue, and
the estimated consumer demand
varies in Marimekko’s market areas.
Retailers are exercising caution in their
additional purchases and in selecting
new suppliers, which is expected to
impact Marimekko’s wholesale sales also
in 2017.
Finland, Marimekko’s important
domestic market, accounts for about
half of the company’s net sales. There
are signs of a more positive vibe for
retailing, and the trend is forecast to be
moderate. Nonrecurring promotional
deliveries had a positive impact on
the company’s sales in 2016, but no
similarly large deliveries are in sight
for 2017. Marimekko’s sales in Finland,
excluding income from nonrecurring
promotional deliveries, are expected to
be roughly on a par with the previous
year.
The Asia-Pacific region, Marimekko’s
second-biggest market, plays a
significant part in the company’s
internationalisation. Japan is clearly the
most important country in this region
to Marimekko; the other countries’
combined share of the company’s
net sales is still relatively small, as
operations in these markets are in fairly
early stages. Japan already has a very
comprehensive network of Marimekko
stores, and new ones are being opened
at a rate of a few stores per year.
Sales are supported by enhancing the
operations of stores and by optimising
the product range. Sales in the Asia-
Pacific region this year are forecast to
be roughly on a par with the previous
year. Most of the Marimekko stores and
shop-in-shops to be opened in 2017 will
be in the Asia-Pacific region, and the
company sees growing demand for its
products in this area especially in the
longer term. In Australia, prospects are
expected to continue to be positive.
In 2017, the main thrust in
expansion will continue to be on
openings of retailer-owned Marimekko
stores. The aim is to open around 10–20
new Marimekko stores and shop-in-
shops. The majority of the new stores
will be shop-in-shops. Furthermore, the
company will continue the enhancement
of the operations of Marimekko stores
opened in recent years. The company’s
own e-commerce and other online sales
channels are forecast to continue to
grow.
Royalty income from North America
is expected to increase slightly due to a
licensing agreement concluded with a
North American company.
The expenses of marketing
operations in 2017 are forecast to be
higher than in 2016 (EUR 4.4 million).
The total investments are estimated at
approximately EUR 2 million (2.7).
FINANCIAL GUIDANCE FOR 2017
The Marimekko Group’s net sales and
comparable operating profit for 2017 are
forecast to be at the same level as in the
previous year.

13Report of the Board of Directors
THE BOARD OF DIRECTORS’
PROPOSAL FOR THE DIVIDEND FOR
THE 2016 FINANCIAL YEAR
On 31 December 2016, the parent
company’s distributable funds amounted
to EUR 17,482,078.62; profit for the
financial year was EUR 5,576,900.81.
The Board of Directors will propose
to the Annual General Meeting that a
dividend of EUR 0.40 per share be paid
for 2016 to a total of EUR 3,235,844 and
that the remaining funds be retained
in equity. The Board will propose 10
April 2017 as the dividend record date,
and 19 April 2017 for the dividend
payout. No substantial changes in the
company’s financial position have
occurred after the end of the financial
year. The company’s liquidity is
good and, in the view of the Board of
Directors, the proposed dividend payout
does not jeopardise the company’s
solvency.
ANNUAL GENERAL MEETING
Marimekko Corporation’s Annual
General Meeting will be held on
Thursday, 6 April 2017 from 2 p.m.
onwards at the company’s head office,
Puusepänkatu 4, 00880 Helsinki,
Finland.
Helsinki, 8 February 2017
Marimekko Corporation
Board of Directors

14
CONSOLIDATED INCOME STATEMENT
(EUR 1,000) 1 Jan.–31 Dec. 2016 1 Jan.–31 Dec. 2015
NET SALES 1. 99,614 95,652
Other operating income 2. 376 335
Increase (-) / decrease (+) in inventories of completed and unfinished products 2,960 367
Raw materials and consumables 3. -40,199 -35,208
Employee benefit expenses 4. -25,671 -26,232
Depreciation and impairments 5. -4,114 -4,511
Other operating expenses 6. -27,716 -28,861
OPERATING PROFIT 5,249 1,542
Financial income 7. 164 49
Financial expenses 8. -243 -297
-79 -247
RESULT BEFORE TAXES 5,170 1,294
Income taxes 9. -1,138 -491
NET RESULT FOR THE PERIOD 4,032 803
Distribution of net result to equity holders of the parent company 4,032 803
Basic and diluted earnings per share calculated on the result attributable
to equity holders of the parent company, EUR 10. 0.50 0.10
COMPREHENSIVE CONSOLIDATED INCOME STATEMENT
(EUR 1,000) 1 Jan.–31 Dec. 2016 1 Jan.–31 Dec. 2015
Net result for the period 4,032 803
Items that could be reclassified to profit or loss at a future point in time
Change in translation difference -14 112
COMPREHENSIVE RESULT FOR THE PERIOD 4,018 915
Distribution of net result to equity holders of the parent company 4,018 915
The notes are an integral part of the f inancial statements.
Consolidated financialstatements, IFRS
15
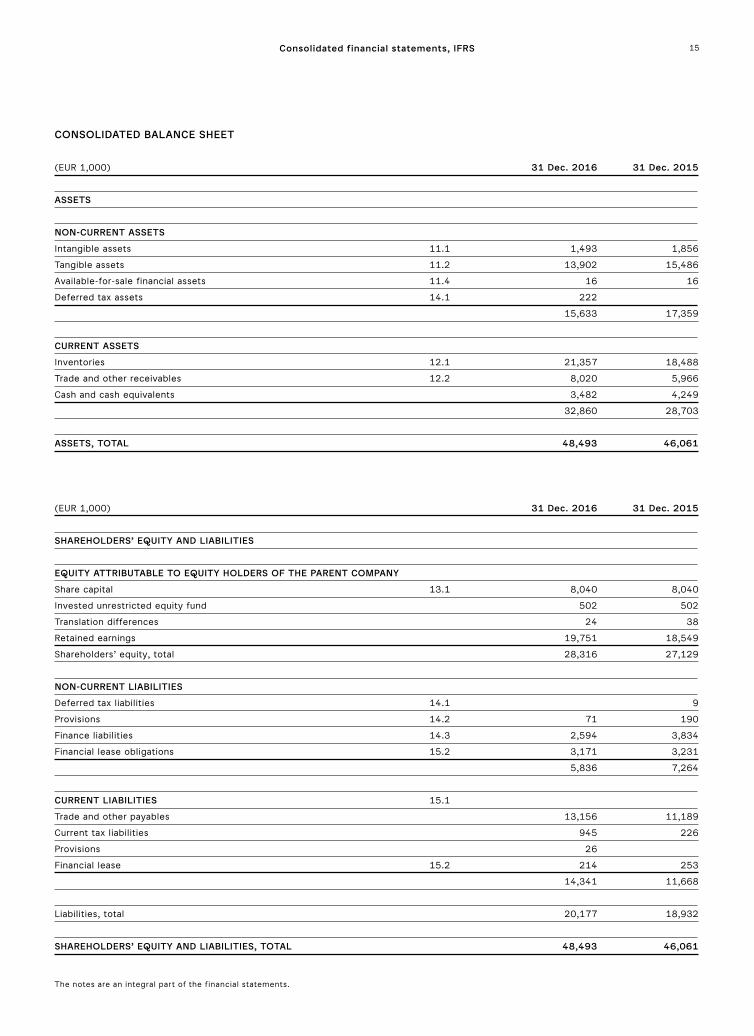
CONSOLIDATED BALANCE SHEET
(EUR 1,000) 31 Dec. 2016 31 Dec. 2015
ASSETS
NON-CURRENT ASSETS
Intangible assets 11.1 1,493 1,856
Tangible assets 11.2 13,902 15,486
Available-for-sale financial assets 11.4 16 16
Deferred tax assets 14.1 222
15,633 17,359
CURRENT ASSETS
Inventories 12.1 21,357 18,488
Trade and other receivables 12.2 8,020 5,966
Cash and cash equivalents 3,482 4,249
32,860 28,703
ASSETS, TOTAL 48,493 46,061
(EUR 1,000) 31 Dec. 2016 31 Dec. 2015
SHAREHOLDERS’ EQUITY AND LIABILITIES
EQUITY ATTRIBUTABLE TO EQUITY HOLDERS OF THE PARENT COMPANY
Share capital 13.1 8,040 8,040
Invested unrestricted equity fund 502 502
Translation differences 24 38
Retained earnings 19,751 18,549
Shareholders’ equity, total 28,316 27,129
NON-CURRENT LIABILITIES
Deferred tax liabilities 14.1 9
Provisions 14.2 71 190
Finance liabilities 14.3 2,594 3,834
Financial lease obligations 15.2 3,171 3,231
5,836 7,264
CURRENT LIABILITIES 15.1
Trade and other payables 13,156 11,189
Current tax liabilities 945 226
Provisions 26
Financial lease 15.2 214 253
14,341 11,668
Liabilities, total 20,177 18,932
SHAREHOLDERS’ EQUITY AND LIABILITIES, TOTAL 48,493 46,061
The notes are an integral part of the f inancial statements.
Consolidated financial statements, IFRS

16Consolidated financial statements, IFRS
The notes are an integral part of the f inancial statements.
CONSOLIDATED CASH FLOW STATEMENT
(EUR 1,000) 1 Jan.–31 Dec. 2016 1 Jan.–31 Dec. 2015
CASH FLOW FROM OPERATING ACTIVITIES
Net profit for the period 4,032 803
Adjustments
Depreciation and impairments 4,114 4,511
Other non-cash transactions 0
Financial income and expenses 79 247
Taxes 1,138 491
Cash flow before change in working capital 9,363 6,054
Change in working capital
Increase (-) / decrease (+) in current non-interest-bearing trade receivables -2,224 1,216
Increase (-) / decrease (+) in inventories -2,803 -930
Increase (+) / decrease (-) in current non-interest-bearing liabilities 2,445 1,216
Cash flow from operating activities before financial items and taxes 6,781 7,556
Paid interest and payments on other financial expenses -169 -305
Interest received 33 49
Taxes paid -520 -986
CASH FLOW FROM OPERATING ACTIVITIES 6,125 6,313
CASH FLOW FROM INVESTING ACTIVITIES
Investments in intangible assets 11.1. -573 -1,036
Investments in tangible assets 11.2. -1,986 -2,136
CASH FLOW FROM INVESTING ACTIVITIES -2,559 -3,171
CASH FLOW FROM FINANCING ACTIVITIES
Net change in long-term loans -1,240 139
Short-term loans drawn 4,000 -
Payments of short-term loans -4,000 -
Payments of finance lease liabilities -261 -280
Dividends paid -2,831 -2,831
CASH FLOW FROM FINANCING ACTIVITIES -4,332 -2,973
Change in cash and cash equivalents -766 170
Cash and cash equivalents at the beginning of the period 4,249 4,079
Cash and cash equivalents at the end of the period 3,482 4,249
17Consolidated financial statements, IFRS
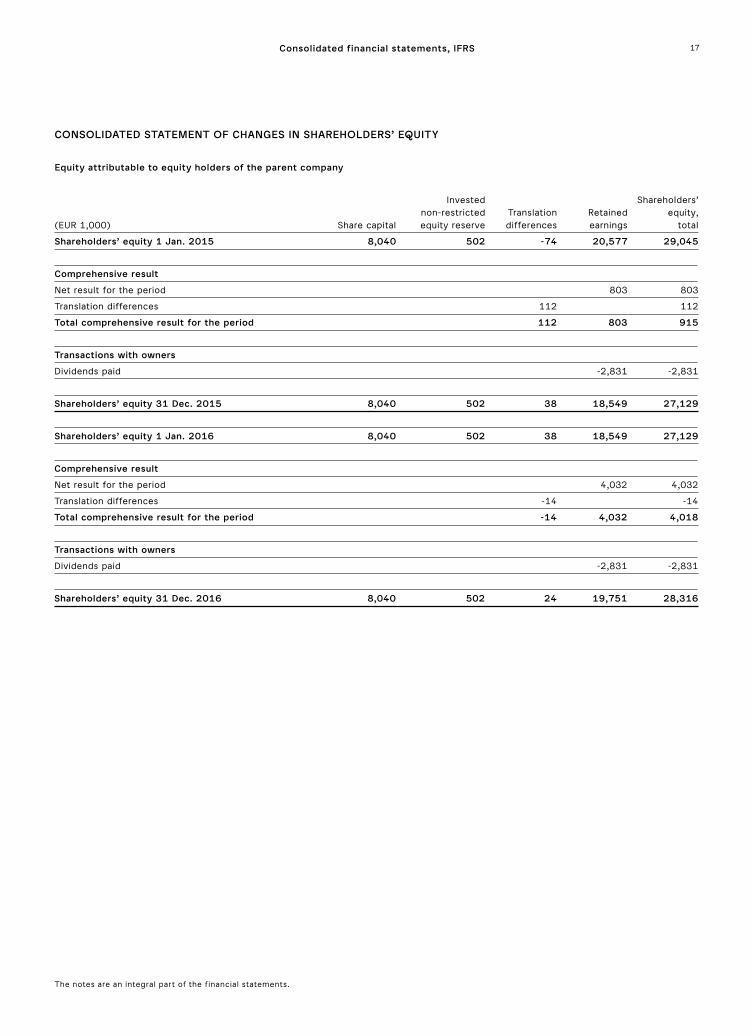
CONSOLIDATED STATEMENT OF CHANGES IN SHAREHOLDERS’ EQUITY
Equity attributable to equity holders of the parent company
Invested Shareholders’ non-restricted Translation Retained equity,(EUR 1,000) Share capital equity reserve differences earnings total
Shareholders’ equity 1 Jan. 2015 8,040 502 -74 20,577 29,045
Comprehensive result
Net result for the period 803 803
Translation differences 112 112
Total comprehensive result for the period 112 803 915
Transactions with owners
Dividends paid -2,831 -2,831
Shareholders’ equity 31 Dec. 2015 8,040 502 38 18,549 27,129
Shareholders’ equity 1 Jan. 2016 8,040 502 38 18,549 27,129
Comprehensive result
Net result for the period 4,032 4,032
Translation differences -14 -14
Total comprehensive result for the period -14 4,032 4,018
Transactions with owners
Dividends paid -2,831 -2,831
Shareholders’ equity 31 Dec. 2016 8,040 502 24 19,751 28,316
The notes are an integral part of the f inancial statements.

18Consolidated financial statements, IFRS
COMPANY PROFILE
Marimekko Corporation is a Finnish
clothing and textile company.
Marimekko Corporation and its
subsidiaries form a Group that designs,
manufactures and markets clothing,
interior decoration products and bags.
Marimekko Corporation’s shares are
quoted on Nasdaq Helsinki Ltd. The
company is domiciled in Helsinki, and
its registered address is Puusepänkatu
4, 00880 Helsinki, Finland. The financial
year of all Group companies is the
calendar year.
Copies of the consolidated financial
statements are available at company.
marimekko.com and the head office
of the Group’s parent company at
Puusepänkatu 4, 00880 Helsinki,
Finland.
Marimekko Corporation’s Board
of Directors approved these financial
statements for publication at its meeting
on 8 February 2017. According to the
Finnish Companies Act, shareholders
have the right to accept or reject the
financial statements at the Annual
General Meeting held after the
publication. The Annual General
Meeting may also amend the financial
statements.
ACCOUNTING POLICY APPLIED
IN THE CONSOLIDATED FINANCIAL
STATEMENTS
Accounting policy
The financial statements have been
prepared in accordance with the
International Financial Reporting
Standards (IFRS), complying with the
IAS and IFRS standards as well as the
SIC and IFRIC interpretations in force
as at 31 December 2016. In the Finnish
Accounting Act and the provisions laid
down pursuant to the Act, International
Financial Reporting Standards refer to
the standards approved for use in the EU
in accordance with the procedures laid
down in IAS Regulation (EC) 1606/2002
of the European Parliament, and the
interpretations of these standards. The
notes to the consolidated financial
statements also comply with Finnish
accounting and company legislation
which complements IFRS regulations.
The financial statements have been
prepared at historical cost. Financial
statement information is presented in
thousands of euros.
Accounting estimates and judgments
The preparation of financial statements
in accordance with IFRS calls for the
management to use estimates and
assumptions with regard to the future.
The estimates and assumptions included
in the financial statements are based on
the best knowledge of the management
as at the closing of the books. These
estimates and assumptions affect the
value of tangible and intangible assets
in the balance sheet and the income
and expenses for the year in the
income statement. Discretion also has
to be exercised when the accounting
conventions for the financial statements
are selected and applied, and estimates
have to be made, for example, of
depreciation periods, any impairments,
valuation of inventories, income taxes,
deferred tax assets and provisions
(including credit loss provisions). The
actual figures may deviate from these
estimates.
Principles of consolidation
Marimekko’s consolidated financial
statements include the accounts of the
parent company Marimekko Corporation
and its subsidiaries. Subsidiaries are
companies in which the Group has the
right to determine the financial and
operating principles of the undertaking
or business operations, usually by
virtue of a shareholding that entitles
to more than half of the voting rights.
Intra-Group share ownership has been
eliminated using the acquisition cost
method. Acquired subsidiaries are
consolidated in the Group’s financial
statements as of the date on which the
Group acquired a controlling interest
and divested subsidiaries until the date
when such control ceases. Intra-Group
business transactions, intra-Group profit
margins related to inventories and fixed
assets, intra-Group receivables and
liabilities and intra-Group distribution of
profit have been eliminated.
Segment reporting
The Group’s business segment is the
Marimekko business. The segment
information presented by the Group
is based on internal reporting to the
chief operational decision-maker, in
which the management’s assessment of
the segment’s profitability is based on
monitoring of the segment’s operating
profit and in which the valuation
principles for assets and liabilities are in
accordance with IFRS regulations.
The President and CEO of the
company acts as the chief operational
decision-maker.
Translation of items denominated in
foreign currency
The results and financial position
of Group units are measured in the
currency used in the primary business
environment of the unit in question
(functional currency). The consolidated
financial statements are presented in
euros, the functional and presentation
currency of the parent company.
Transactions in foreign currencies are
recognised in the functional currency
at the exchange rates on the date
of transaction. The foreign-currency
denominated receivables and liabilities
of the parent company and its Finnish
subsidiary have been converted to
euro amounts using the exchange
rates quoted by the European Central
NOTES TO THE CONSOLIDATED FINANCIAL STATEMENTS

19Consolidated financial statements, IFRS
Bank on the closing date. The foreign
currency-denominated receivables and
liabilities of foreign subsidiaries have
been converted at the exchange rate of
the country in question on the closing
date. Foreign exchange differences
in business operations are booked in
the corresponding income statement
accounts above operating profit and
foreign exchange differences on
financial items in financial income and
expenses.
The foreign-currency-denominated
income statements of subsidiaries
are converted to euro amounts using
the average exchange rate for the
financial year and the balance sheets
at the average rate on the closing date.
Differences arising from translation and
translation differences in shareholders’
equity are recorded as a separate item
in shareholders’ equity.
Revenue recognition and net sales
Most of the Group’s income is comprised
of wholesale and retail sales of products
plus royalties. Sales of products are
recognised as income when the
significant risks and rewards incident
to the ownership of goods have been
transferred to the buyer. The Group
then relinquishes oversight and control
of the product. In wholesale, this is
mainly the moment when the goods
are handed over to the customer as set
forth in the agreed delivery clause. In
retail where cash or a credit card is used
as the means of payment, the income
is recognised at the time of sale. The
revenue recognition of licensing and
royalty income is handled in accordance
with the clauses of the agreement
between Marimekko and the licensee.
The clauses in the licensing agreements
mainly provide for royalties payable to
Marimekko for sales of products covered
by the agreement, based either on a
percentage rate or the number of items.
At least the minimum annual royalty as
stipulated in the agreement is payable
by some of the licensees.
In the calculation of net sales, sales
proceeds are adjusted with indirect
taxes and sales adjusting items such
as discounts granted. The distribution
costs of products sold are recognised in
other operating expenses in the income
statement.
Other operating income
Other operating income includes, for
example, rental income from lease
agreements classified as other lease
agreements, insurance payouts and sales
proceeds of fixed assets.
Operating profit
IAS 1 Presentation of Financial
Statements does not contain a definition
of operating profit. The Group has
defined this concept as follows:
operating profit is the net amount of net
sales and other operating income less
the purchase expenses adjusted with the
expenses incurred due to the increase
or decrease in inventories or completed
and unfinished products and production
for own use, employee benefit expenses,
depreciations, possible impairment
loss and other operating expenses.
Any income statement items other
than the above are presented below
the operating profit. Foreign exchange
differences are included in the operating
profit, provided they are attributable to
items related to business operations.
Otherwise they are recognised in
financial items.
Employee benefits
Pension commitments
The pension security of the personnel
of the Group’s Finnish companies
has been arranged under the Finnish
statutory employee pension plan
(TyEL) through an external pension
insurance company. Foreign subsidiaries
have arranged pensions for their
personnel in accordance with local
legislation. The Group’s pension cover
is arranged wholly under defined
contribution schemes. Under a defined
contribution arrangement, the Group
pays contributions to publicly or
privately managed pension insurances.
These contributions are either
compulsory, based on an agreement
or voluntary. The Group does not have
any payment obligations other than
these contributions. The contributions
are recognised as employee benefit
expenses at the time when they
become due. Any contributions paid in
advance are included in the assets on
the balance sheet, insofar as they are
recoverable as future refunds or future
reductions of contributions.
Share-based payments
The long-term bonus systems granted
to the Management Group by the
Board of Directors are valued at fair
value at each closing date and the
change in fair value is recorded as an
employee benefit expense in the income
statement to the extent the share-
based payments have been vested. The
possible bonus will be paid in cash.
The bonus systems are described
in greater detail in Note 4 to the
consolidated financial statements.
Interest income
Interest income is recognised on a time-
proportion basis using the effective
interest method.
Dividend income
Dividend income is recognised as
income when the right to dividends is
established.
Income taxes
Taxes on the Group companies’
financial results for the period, taxes
from previous periods and the change
in deferred taxes are recorded as the

20Consolidated financial statements, IFRS
Group’s taxes. Taxes on the taxable
income for the period are calculated
on taxable income in accordance with
the tax rate in force in the country in
question. Deferred taxes are calculated
on all temporary differences between
the book value and the taxable value.
However, a deferred tax liability is not
accounted for if it arises from the initial
recognition of an asset or liability in
a transaction, other than a business
combination, that at the time of the
transaction affects neither accounting
nor taxable income. In taxation deferred
tax is not recognised for non-deductible
goodwill and deferred tax is not
recognised for distributable earnings
of subsidiaries where it is probable
that the difference will not reverse
in the foreseeable future. The largest
temporary differences are due to the
amortisation of fixed assets. Deferred
taxes are calculated using the tax rates
set by the closing date. Deferred tax
assets are recognised to the extent that
it is probable that future taxable profit,
against which the temporary difference
can be utilised, will be available.
Earnings per share
The basic earnings per share are
calculated by dividing the profit for the
period attributable to equity holders of
the parent company by the weighted
average of shares outstanding. The
weighted average number of shares
used to calculate the diluted earnings
per share takes into account the diluting
effect of the conversion of potential
common shares into actual shares
during the period.
Intangible assets
Intangible assets with finite useful
lives are recognised in the balance
sheet at original cost less depreciation.
Depreciation of intangible assets is
carried out on a straight-line basis over
their estimated useful life.
The estimated useful lives are as
follows:
• intangible rights 5–10 years
• computer software 3–5 years.
The major intangible asset items
are trademarks. Other intangible assets
are computer software and information
systems. The Group has not had any
such development expenditure that
should be recognised as assets under
IAS 38 and recorded as amortised
expense over their useful life.
Tangible assets
Tangible assets mainly consist
of buildings, machinery and
equipment. Tangible assets also
include expenditures on conversions
and renovations of leased premises
comprising, for example, completion
work on business interiors in rented
premises. Tangible assets are recorded
in the balance sheet at original cost
less depreciation. Depreciation of
tangible assets is carried out on a
straight-line basis over their estimated
useful life.
The estimated useful lives are as
follows:
• buildings and structures 40 years
• machinery and equipment 3–15 years.
The residual value and useful
life of tangible assets are checked
in connection with closing of each
financial year and if necessary adjusted
to reflect changes in the expectation of
economic benefit.
If a tangible asset consists of several
parts with different useful lives, each
part is treated as a separate asset.
Significant cost of replacing a part is
capitalised when the company will
derive economic benefit from the
asset. Other expenses such as regular
maintenance, repair and servicing costs
are entered as expenses in the income
statement when they are incurred.
Investment aid is recognised as a
reduction to investments and the aid
recorded in the income statement is
booked in other operating income.
Borrowing costs
Borrowing costs are recognised as
expenses during the financial year in
which they were incurred. Borrowing
costs have not been recognised as part
of the acquisition cost of the assets.
Provisions and contingent liabilities
A provision is recognised when
the Group has a present legal or
constructive obligation as a result of a
past event, and it is probable that an
outflow of resources will be required
to settle the obligation and a reliable
estimate of the amount of the obligation
can be made.
A restructuring provision is
recognised when the Group has
compiled a detailed restructuring
plan, launched its implementation or
informed the parties concerned.
A contingent liability is a potential
liability based on previous events.
It depends on the realisation of an
uncertain future event beyond the
Group’s control. Contingent liabilities
also include obligations which will
most likely not lead to a payment or
the amount of which cannot be reliably
determined. Contingent liabilities are
disclosed in the notes.
Impairment
On each closing date, asset items are
assessed for indications of impairment.
If there are such indications, the
recoverable amount of said asset item is
estimated. The impairment recognised
is the amount by which the book value
of the asset item exceeds its recoverable
amount, which is the higher of its net
selling price or value in use. Value in
use is based on discounted future net
cash flows as a rule.
21Consolidated financial statements, IFRS
Lease agreements
In accordance with IAS 17 Leases, lease
agreements in which the Group assumes
substantially all the risks and rewards
incident to ownership of the asset are
classified as finance lease agreements.
Assets acquired under finance
lease agreements, less accumulated
depreciation, are recognised in tangible
or intangible assets, and the obligations
of the agreements are recognised in
interest-bearing liabilities. A financial
lease is booked in the balance sheet
and recognised at fair value of the
asset at the time of entering into the
lease agreement or, if lower, at the
present value of future minimum lease
payments. Financial lease agreements in
accordance with IAS 17 are recognised
in the balance sheet and are depreciated
in line with the Group’s depreciation
policy over their useful life or lease
period, whichever is shorter and any
impairment loss is recognised. Rents
payable under lease agreements are
divided into financial expenses and debt
repayment.
Lease agreements in which the risks
and rewards incident to ownership are
retained by the lessor are treated as
other lease agreements. Rents payable
under other lease agreements are
expenses in the income statement on a
straight-line basis over the lease period.
Inventories
Inventories are presented at the
acquisition cost or at the lower probable
net realisation value. The acquisition
cost of manufactured inventories
includes not only purchase expenditure
on materials, direct labour and other
direct costs, but also a share of the fixed
and variable general costs of production.
Net realisable value is the estimated
selling price in the ordinary course of
business, less the estimated costs for
completion and selling expenses.
Financial assets
The Group classifies its financial assets
in the following categories: loans and
other receivables and available-for-
sale financial assets. The classification
depends on the purpose for which the
financial assets were acquired and is
determined at initial recognition by the
management.
Loans and receivables consist of
trade receivables, other receivables and
cash and cash equivalents.
Available-for-sale financial assets
comprise shares and they are included
in non-current assets, unless it is
intended that they will be held for
less than 12 months from the closing
date, in which case they are included
in current assets. Available-for-sale
financial assets are measured at fair
value or, where the fair value cannot
be reliably determined, at acquisition
cost. Available-for-sale financial assets
on the closing date comprise unlisted
shares measured at historical cost less
any impairment. The company does not
intend to dispose of these shares for the
present.
Loans and other receivables are
initially recognised at fair value and
subsequently at amortised cost using
the effective interest method. An
impairment of trade receivables is
recognised when there is objective
evidence that the Group will not receive
all of the benefits on the original terms.
Indications of the impairment of trade
receivables include the significant
financial difficulties of the debtor, the
likelihood of bankruptcy, failure to make
payments, or a delay of over 90 days in
paying. Impairment loss is recognised
under other operating expenses in the
income statement.
Cash and cash equivalents
The Group’s cash and cash equivalents
include cash at hand and at banks.
The Group does not have any other
items classified as cash and cash
equivalents.
Dividends, shareholders’ equity and
treasury shares
The Board of Directors’ proposal for
dividend distribution has not been
recognised in the financial statements;
the dividends will only be recognised
on the basis of the Annual General
Meeting’s approval.
Outstanding common shares are
presented as share capital. Costs related
to the granting or acquisition of the
company’s own equity instruments are
presented as equity allowance. If the
company purchases its own shares,
the price including direct costs is
recognised as decrease in equity.
Financial liabilities
Financial liabilities are initially
recognised at fair value including
transaction costs and subsequently
at amortised cost using the effective
interest method. Financial liabilities are
non-current, unless they are repayable
on demand or the Group intends to
repay them within the next 12 months.
New standards and interpretations
In preparing these consolidated
financial statements, the Group has
followed the same accounting policies
as in the annual financial statements
for 2015 except for the effect of
changes required by the adoption of the
following new standards, interpretations
and amendments to existing standards
and interpretations on 1 January 2016.
The new standards, interpretations
and amendments to existing standards
have not had a material impact on the
consolidated financial statements.
- IFRS 11 (amendment) ”Joint
arrangements”. This amendment
provides new guidance on how to
account for the acquisition of an
interest in a joint venture operation that
22Consolidated financial statements, IFRS
constitutes a business. The amendments
require an investor to apply the
principles of business combination
accounting when it acquires an interest
in a joint operation that constitutes a
business.
- IAS 16 (amendment) ”Property,
plant and equipment” and IAS 38,
”Intangible assets”. This amendment
clarifies that the use of revenue-based
methods to calculate the depreciation
of an asset is not appropriate because
revenue generated by an activity
that includes the use of an asset
generally reflects factors other than the
consumption of the economic benefits
embodied in the asset.
- IASB published the following
improvements to standards and
interpretations as part of the 2012–2014.
- IAS 1 (amendment) “Disclosure
Initiative”. The amendment aims at
preparers exercising their judgement in
presenting their financial reports.
Below is a list of standards,
interpretations and amendments that
have been issued and are effective for
periods after 1 January 2016. They will
be adopted by the Group in 2017 or
later. The impacts on the consolidated
financial statements are commented by
each change separately.
- IFRS 15 ”Revenue from Contracts
with Customers”. The new standard
provides a comprehensive framework
for recognizing revenue and the amount
and timing of the revenue. IFRS 15
replaces the effective guidelines for
recognition, such as IAS 18 Revenue,
IAS 11 Construction Contracts and IFRIC
13 Customer Loyalty Programmes.
According to IFRS 15, revenue is
recognised when a customer obtains
control of a good or service. The control
is obtained when the customer has
the ability to direct the use of and get
the benefits from the good or service.
The core principle of IFRS 15 is that an
entity recognises revenue to depict the
transfer of promised goods or services
to customers in an amount that reflects
the consideration to which the entity
expects to be entitled in exchange
for those goods or services. IFRS 15
will increase the amount of disclosure
information related to customer
contracts and significant judgements
made. In the transition to IFRS 15 there
are three alternative approaches: 1) Full
retrospective approach, 2) Retrospective
with practical expedient approach or 3)
Cumulative effect method. IFRS 15 shall
be applied starting 1 January 2018.
- The Group sells design products
in Marimekko stores, online stores, and
through wholesale trade both in Finland
and overseas. The goods are delivered
to the customer one by one or several
items at a time, in the stores or by the
carrier. The customer can utilize each
sold product separately and the products
are not dependent on other products
sold by Marimekko. In the recent years,
the Group has had no service or project
business and less than two percent
of the revenue has been consisted of
royalty revenues. In wholesale trade,
the terms of delivery determine the
point of time when the customer obtains
control of the goods. Determining the
separately identifiable performance
obligations is uncomplicated. Fulfilling
of the obligations are verifiable by the
payment receipts or transportation
documents. In compliance with IFRS
15, the contributions by the customers
are allocated to distinct goods and
recognised as revenue by the Group,
when the goods are granted to the
customer in the store or when the
wholesale customer obtains control
of the goods according to the terms
of delivery. The Group is performing
a more comprehensive analysis on
implementing IFRS 15. Based on
above stated, IFRS 15 is not expected
to have a significant impact on the
consolidated financial statements of
the Group. At this stage, the Group can
not give any estimate on quantitative
impacts of applying IFRS 15. The Group
has not made any decision between the
alternative approaches for implementing
IFRS 15 or the expedients.
- IFRS 9 ”Financial instruments”.
The new standard replaces most of
the guidance in IAS 39. IFRS 9 retains
but simplifies the mixed measurement
model and establishes three primary
measurement categories for financial
assets: amortised cost, fair value through
OCI and fair value through P&L. There
is now a new expected credit losses
model that replaces the incurred loss
impairment model used in IAS 39. The
standard’s requirements related to
general hedge accounting have also
been revised. IAS 39’s requirements for
recognition and derecognition of financial
instruments have been retained.
- IFRS 16 “Leases”. The new standard
requires lessees to recognise a liability
reflecting the future rental payments
and an asset related to authority to use
the asset, for almost all leases. Lessees
cease to classify leases as finance
leases or operating leases. The standard
contains an optional exemption for
assets with a lease term of 12 months
or less or the underlying asset having
a low value. Applying IFRS 16 will
increase the amount of assets and
liabilities recognised to the Group’s
consolidated balance sheet, related to
rental agreements of store premises.
Rental agreements of store premises are
currently classified as operating leases.
The change will also have an impact
on the consolidated balance sheet, as
the rental expense will be replaced by
depreciations of the leased asset and
interest expense on the finance lease
liability. *)
*) This standard, interpretation
or amendment is still subject to EU
endorsement.

23Consolidated financial statements, IFRS
1. SEGMENT INFORMATION
The operational segments are reported to the chief operational decision-maker in the same way as in internal reporting. The chief operational decision-maker monitors Marimekko’s business as a whole. The company is domiciled in Finland. Net sales from external customers in Finland totalled EUR 55,770 thousand and from external customers in other countries EUR 43,844 thousand. The total amount of non-current assets in Finland excluding financial instruments and deferred tax liabilities (the Group has no assets arising from employee benefits or insurance contracts) was EUR 14,913 thousand (15,382) and the total amount of corresponding non-current assets in other countries was EUR 498 thousand (1,977).
(EUR 1,000) 2016 2015
Net sales
Finland 55,770 52,690
Other countries 43,844 42,962
Total 99,614 95,652
Assets
Finland 39,332 37,677
Other countries 9,161 8,384
Total 48,493 46,061
Investments
Finland 2,327 2,772
Other countries 394 399
Total 2,721 3,171
(EUR 1,000) 2016 2015
Net sales
Product sales 98,532 94,089
Licence income 1,082 1,563
Total 99,614 95,652
2. OTHER OPERATING INCOME
(EUR 1,000) 2016 2015
Rental income 313 248
Other income 63 87
Total 376 335
3. RAW MATERIALS AND CONSUMABLES
(EUR 1,000) 2016 2015
Materials and supplies
Purchases during the financial year 26,777 23,092
Increase (-) / decrease (+) in inventories -135 -323
Total 26,643 22,769
External services 13,556 12,440
Total 40,199 35,208
Exchange rate differences included in raw materials and consumables
(EUR 1,000) 2016 2015
Exchange rate gains (-) / losses (+) of purchases 50 93

24Consolidated financial statements, IFRS
4. EMPLOYEE BENEFIT EXPENSES
(EUR 1,000) 2016 2015
Salaries, wages and bonuses 19,807 20,392
Share-based payments (cash settled) 30 12
Pension expenses – defined contribution plans 2,742 3,053
Other indirect social expenditure 3,092 2,774
Total 25,671 26,232
Average number of employees
2016 2015
Salaried employees 417 430
Non-salaried employees 24 30
Total 441 460
Share based payments Management Group’s long-term bonus systems During the financial year, the Marimekko Group had a long-term bonus system targeted at the Management Group. On 7 May 2014, the Board of Directors of Marimekko Corporation agreed on establishing a long-term bonus system targeted at the company’s Management Group. The system is composed of two earnings periods, which are 8 May 2014–31 October 2017 and 8 May 2014–28 February 2018. The possible bonus for each earnings period will be based on the total yield on Marimekko Corporation’s shares, including dividends. The possible bonus will be paid in cash in two batches, one in autumn 2017 and the other in spring 2018. Earning the bonus requires that the person still works for the company at the time of the payment. When receiving the bonus, the person in question commits themselves to using 50% of the net value of the bonus for acquiring the company’s shares at transaction price within six months from receiving the bonus. The shares acquired with the bonus cannot be surrendered prior to two years from the time of acquiring the shares. The annual maximum value of the bonus paid to a member of the Management Group in the bonus system cannot exceed the approximate value of fixed annual salary. The system encompasses the Management Group members excluding the Creative Director, a total of three persons. The fair value of granted share-based payments has been determined using the binary cash-or-nothing call option valuation model. The significant measurement parameters in the model were share price at the commencement date of the earning period, EUR 9.55 added with 10% resulting to EUR 10.50, and volatility 28%. The grant date of the share-based payments is the date of the Board resolution. The fair value of the share-based payments were on average EUR 1.05/option on the grant date whereby the total fair value of the plan amounted to EUR 313 thousand. Granted share-based payments will be subsequently valued at fair value at each closing date and the change in fair value will be recorded in the income statement to the extent they are vested. Each member to the plan will be compensated for the earnings period with an amount equivalent to 1.5 months’ gross salary for each one (1) euro which the closing share price (inclusive of dividends) exceeds the share value of EUR 10.50 at the date of commencement of the plan. Gross salary is defined for the purposes of the plan as the fixed monthly salary, inclusive of fringe benefits, prevailing at the commencement of the plan in May 2014. At the end of 2016 the fair value of share based payments booked as current liabilities to the extent they are vested, was EUR 81 (51) thousand. This EUR 30 thousand increase in fair value of the share based payments in 2016, was booked an an increase in employee benefit expenses in the consolidated income statement.
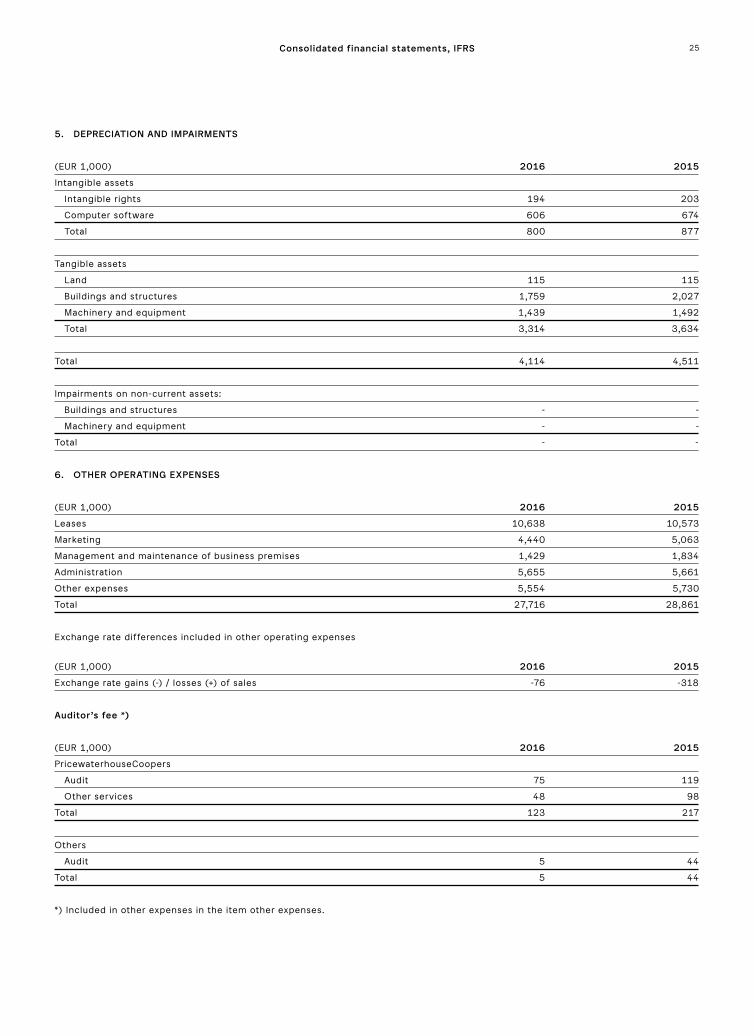
25Consolidated financial statements, IFRS
5. DEPRECIATION AND IMPAIRMENTS
(EUR 1,000) 2016 2015
Intangible assets
Intangible rights 194 203
Computer software 606 674
Total 800 877
Tangible assets
Land 115 115
Buildings and structures 1,759 2,027
Machinery and equipment 1,439 1,492
Total 3,314 3,634
Total 4,114 4,511
Impairments on non-current assets:
Buildings and structures - -
Machinery and equipment - -
Total - -
6. OTHER OPERATING EXPENSES
(EUR 1,000) 2016 2015
Leases 10,638 10,573
Marketing 4,440 5,063
Management and maintenance of business premises 1,429 1,834
Administration 5,655 5,661
Other expenses 5,554 5,730
Total 27,716 28,861
Exchange rate differences included in other operating expenses
(EUR 1,000) 2016 2015
Exchange rate gains (-) / losses (+) of sales -76 -318
Auditor’s fee *)
(EUR 1,000) 2016 2015
PricewaterhouseCoopers
Audit 75 119
Other services 48 98
Total 123 217
Others
Audit 5 44
Total 5 44
*) Included in other expenses in the item other expenses.
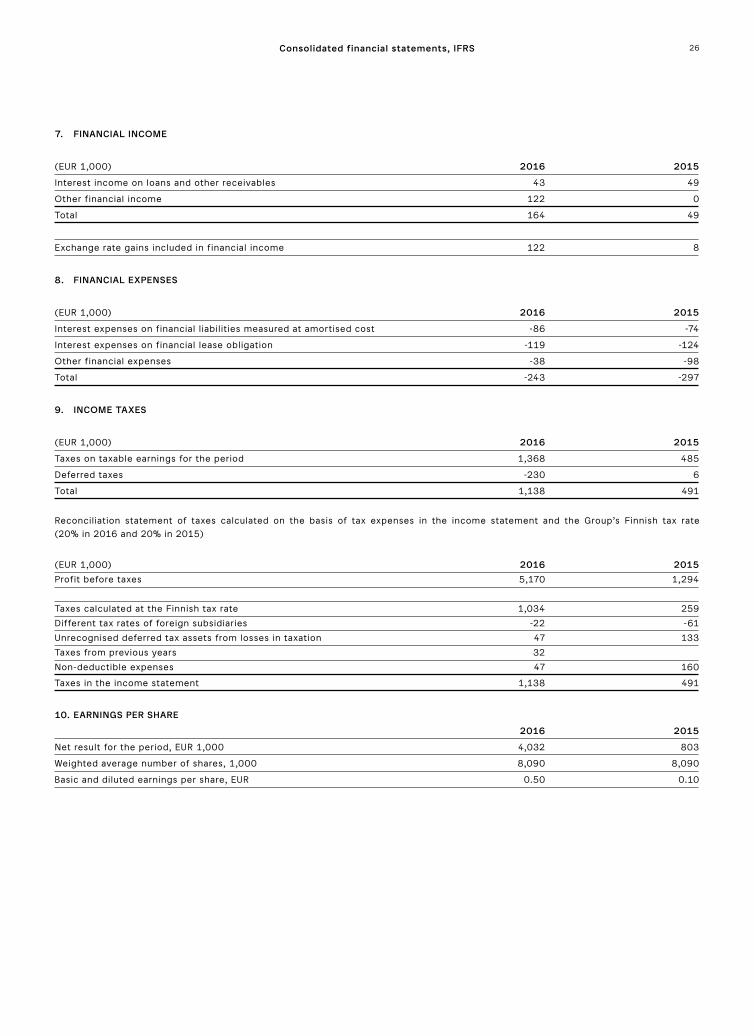
26
7. FINANCIAL INCOME
(EUR 1,000) 2016 2015
Interest income on loans and other receivables 43 49
Other financial income 122 0
Total 164 49
Exchange rate gains included in financial income 122 8
8. FINANCIAL EXPENSES
(EUR 1,000) 2016 2015
Interest expenses on financial liabilities measured at amortised cost -86 -74
Interest expenses on financial lease obligation -119 -124
Other financial expenses -38 -98
Total -243 -297
9. INCOME TAXES
(EUR 1,000) 2016 2015
Taxes on taxable earnings for the period 1,368 485
Deferred taxes -230 6
Total 1,138 491
Reconciliation statement of taxes calculated on the basis of tax expenses in the income statement and the Group’s Finnish tax rate (20% in 2016 and 20% in 2015)
(EUR 1,000) 2016 2015
Profit before taxes 5,170 1,294
Taxes calculated at the Finnish tax rate 1,034 259
Different tax rates of foreign subsidiaries -22 -61
Unrecognised deferred tax assets from losses in taxation 47 133
Taxes from previous years 32
Non-deductible expenses 47 160
Taxes in the income statement 1,138 491
10. EARNINGS PER SHARE
2016 2015
Net result for the period, EUR 1,000 4,032 803
Weighted average number of shares, 1,000 8,090 8,090
Basic and diluted earnings per share, EUR 0.50 0.10
Consolidated financial statements, IFRS

27
11. NON-CURRENT ASSETS
11.1 Intangible assets
2016 Advance payments and Intangible Computer acquisitions (EUR 1,000) rights software in progress Total
Acquisition cost, 1 Jan. 2016 2,278 7,628 268 10,174
Translation differences 1 6 7
Increases 81 315 177 573
Decreases -2,208 -142 -2,350
Transfers 171 -171
Acquisition cost, 31 Dec. 2016 2,360 5,913 131 8,403
Accumulated depreciation, 1 Jan. 2016 1,851 6,467 8,317
Translation differences 1 0 1
Accumulated depreciation of the decreases 2,208 2,208
Depreciation during the financial year 194 606 800
Accumulated depreciation, 31 Dec. 2016 2,045 4,866 6,910
Book value, 31 Dec. 2016 315 1,047 131 1,493
Book value, 1 Jan. 2016 428 1,161 268 1,856
Book value, 31 Dec. 2016 315 1,047 131 1,493
2015 Advance payments and Intangible Computer acquisitions (EUR 1,000) rights software in progress Total
Acquisition cost, 1 Jan. 2015 2,001 6,362 458 8,822
Translation differences 192 179 -1 370
Increases 85 328 617 1,030
Decreases -48 -48
Transfers 759 -759 0
Acquisition cost, 31 Dec. 2015 2,278 7,628 268 10,174
Accumulated depreciation, 1 Jan. 2015 1,494 5,766 7,260
Translation differences 154 26 180
Depreciation during the financial year 203 674 877
Accumulated depreciation, 31 Dec. 2015 1,851 6,467 8,317
Book value, 31 Dec. 2015 428 1,161 268 1,856
Book value, 1 Jan. 2015 507 596 458 1,561
Book value, 31 Dec. 2015 428 1,161 268 1,856
Consolidated financial statements, IFRS

28
11.2 Tangible assets
2016 Advance Machinery payments and Buildings and and acquisitions (EUR 1,000) Land structures equipment in progress Total
Acquisition cost, 1 Jan. 2016 3,515 20,060 19,400 318 43,292
Translation differences 18 28 46
Increases 595 1,124 62 1,782
Decreases -1 -46 -46
Transfers 274 -274
Acquisition cost, 31 Dec. 2016 3,515 20,673 20,826 60 45,074
Accumulated depreciation, 1 Jan. 2016 460 11,466 15,880 27,806
Translation differences 22 30 52
Depreciation during the financial year 115 1,759 1,439 3,314
Accumulated depreciation, 31 Dec. 2016 577 13,247 17,348 31,172
Book value, 31 Dec. 2016 2,938 7,426 3,477 60 13,902
Book value, 1 Jan. 2016 3,054 8,594 3,520 318 15,486
Book value, 31 Dec. 2016 2,938 7,426 3,477 60 13,902
Book value of production machinery 31 Dec. 2016 2,058
2015 Advance Machinery payments and Buildings and and acquisitions (EUR 1,000) Land structures equipment in progress Total
Acquisition cost, 1 Jan. 2015 3,515 18,076 18,572 176 40,339
Translation differences 453 134 587
Increases 1,531 693 228 2,453
Decreases -86 -86
Acquisition cost, 31 Dec. 2015 3,515 20,060 19,400 318 43,292
Accumulated depreciation, 1 Jan. 2015 345 9,083 14,209 23,637
Translation differences 356 179 535
Depreciation during the financial year 115 2,027 1,492 3,634
Accumulated depreciation, 31 Dec. 2015 460 11,466 15,880 27,806
Book value, 31 Dec. 2015 3,054 8,594 3,520 318 15,486
Book value, 1 Jan. 2015 3,169 8,993 4,363 176 16,702
Book value, 31 Dec. 2015 3,054 8,594 3,520 318 15,486
Book value of production machinery 31 Dec. 2015 1,473
Consolidated financial statements, IFRS

29
11.3 Finance lease agreements
Land as well as machinery and equipment in tangible assets include the following assets acquired under finance lease agreements. The finance lease assets constitute the land lease agreement of the property of the Helsinki head office and printing factory as well as machinery and equipment leased as finance leases since 1 January 2014.
2016
Machinery and (EUR 1,000) Land equipment Total
Acquisition cost, 1 Jan. 2016 3,460 588 4,048
Increases 167 167
Acquisition cost, 31 Dec. 2016 3,460 755 4,215
Accumulated depreciation, 1 Jan. 2016 461 286 747
Depreciation during the financial year 115 186 302
Accumulated depreciation, 31 Dec. 2016 577 472 1,049
Book value, 31 Dec. 2016 2,883 283 3,166
Book value, 1 Jan. 2016 2,999 302 3,301
Book value, 31 Dec. 2016 2,883 283 3,166
2015
Machinery and (EUR 1,000) Land equipment Total
Acquisition cost, 1 Jan. 2015 3,460 261 3,721
Increases 327 327
Acquisition cost, 31 Dec. 2015 3,460 588 4,048
Accumulated depreciation, 1 Jan. 2015 346 78 424
Depreciation during the financial year 115 208 324
Accumulated depreciation, 31 Dec. 2015 461 286 747
Book value, 31 Dec. 2015 2,999 302 3,301
Book value, 1 Jan. 2015 3,114 183 3,297
Book value, 31 Dec. 2015 2,999 302 3,301
11.4 Available-for-sale financial assets
(EUR 1,000) 2016 2015
Available-for-sale shares
Acquisition cost, 1 Jan. 16 16
Acquisition cost, 31 Dec. 16 16
Book value, 31 Dec. 16 16
Financial assets, total 16 16
Available-for-sale financial assets comprise unlisted shares, which are presented at cost because their fair values are not reliably known.
Consolidated financial statements, IFRS

30Consolidated financial statements, IFRS
12. CURRENT ASSETS 12.1 Inventories
(EUR 1,000) 2016 2015
Raw materials and consumables 5,037 5,334
Incomplete products 55 103
Finished products/goods 16,265 13,052
Total 21,357 18,488
No impairment was recognised on inventories.
12.2 Trade and other receivables
(EUR 1,000) 2016 2015
Trade receivables 5,799 4,414
Prepayments for inventory purchases 1,065 310
Other reveivables 194 33
Prepaid expenses and accrued income 962 1,208
Total 8,020 5,966
Prepaid expenses and accrued income
Royalty receivables 273 267
Employee benefits 27 229
Other prepaid expenses and accrued income 662 713
Total 962 1,208
Impairment of trade receivables 23 99
Analysis of trade receivables by age
Impairment Impairment (EUR 1,000) 2016 loss Net 2016 2015 loss Net 2015
Undue trade receivables 4,458 4,458 3,061 3,061
Overdue
less than 30 days 1,003 1,003 1,029 1,029
30–60 days 206 206 281 281
more than 60 days 155 -23 132 143 -99 44
Total 5,822 -23 5,799 4,513 -99 4,414
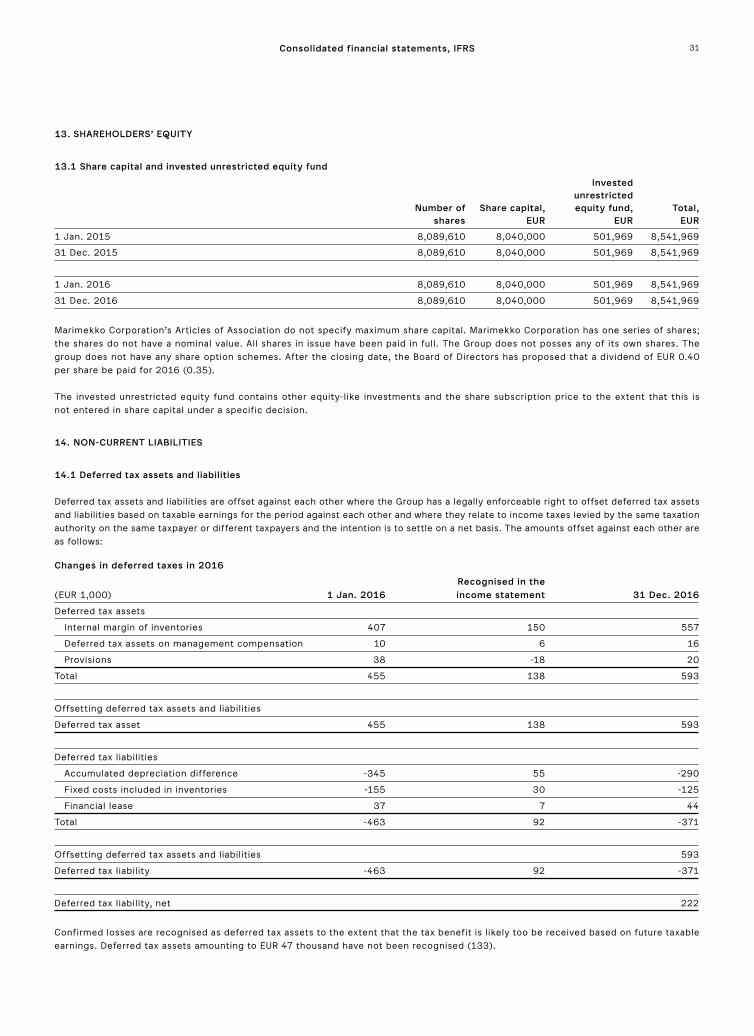
31Consolidated financial statements, IFRS
13. SHAREHOLDERS’ EQUITY
13.1 Share capital and invested unrestricted equity fund
Invested unrestricted Number of Share capital, equity fund, Total, shares EUR EUR EUR
1 Jan. 2015 8,089,610 8,040,000 501,969 8,541,969
31 Dec. 2015 8,089,610 8,040,000 501,969 8,541,969
1 Jan. 2016 8,089,610 8,040,000 501,969 8,541,969
31 Dec. 2016 8,089,610 8,040,000 501,969 8,541,969
Marimekko Corporation’s Articles of Association do not specify maximum share capital. Marimekko Corporation has one series of shares; the shares do not have a nominal value. All shares in issue have been paid in full. The Group does not posses any of its own shares. The group does not have any share option schemes. After the closing date, the Board of Directors has proposed that a dividend of EUR 0.40 per share be paid for 2016 (0.35). The invested unrestricted equity fund contains other equity-like investments and the share subscription price to the extent that this is not entered in share capital under a specific decision.
14. NON-CURRENT LIABILITIES
14.1 Deferred tax assets and liabilities
Deferred tax assets and liabilities are offset against each other where the Group has a legally enforceable right to offset deferred tax assets and liabilities based on taxable earnings for the period against each other and where they relate to income taxes levied by the same taxation authority on the same taxpayer or different taxpayers and the intention is to settle on a net basis. The amounts offset against each other are as follows: Changes in deferred taxes in 2016
Recognised in the (EUR 1,000) 1 Jan. 2016 income statement 31 Dec. 2016
Deferred tax assets
Internal margin of inventories 407 150 557
Deferred tax assets on management compensation 10 6 16
Provisions 38 -18 20
Total 455 138 593
Offsetting deferred tax assets and liabilities
Deferred tax asset 455 138 593
Deferred tax liabilities
Accumulated depreciation difference -345 55 -290
Fixed costs included in inventories -155 30 -125
Financial lease 37 7 44
Total -463 92 -371
Offsetting deferred tax assets and liabilities 593
Deferred tax liability -463 92 -371
Deferred tax liability, net 222
Confirmed losses are recognised as deferred tax assets to the extent that the tax benefit is likely too be received based on future taxable earnings. Deferred tax assets amounting to EUR 47 thousand have not been recognised (133).

32Consolidated financial statements, IFRS
Changes in deferred taxes in 2015 Recognised in the (EUR 1,000) 1 Jan. 2015 income statement 31 Dec. 2015
Deferred tax assets
Internal margin of inventories 509 -102 407
Deferred tax assets on management compensation 6 4 10
Provisions 38 38
Total 553 -98 455
Offsetting deferred tax assets and liabilities -455
Deferred tax asset 553 -98
Deferred tax liabilities
Accumulated depreciation difference -440 96 -345
Fixed costs included in inventories -144 -11 -155
Financial lease 28 9 37
Total -557 94 -463
Offsetting deferred tax assets and liabilities 455
Deferred tax liability -557 94 -463
Deferred tax liability, net -9
14.2 Non-current provisions
(EUR 1,000) 2016 2015
Provision for restructuring cost
Book value, 1 Jan. 190 190
Increases 0
Decreases -119
Book value, 31 Dec. 71 190
The non-current provisions are related to the company’s possible future obligation to pay the employer’s liability component within the unemployment insurance contribution. This future payment obligation to the Unemployment Insurance Fund was born when the company dismissed employees in Finland in connection with the restructuring negotiations held in 2013 and 2014 and 2015. The payment obligation materializes for the most part within two years after the ending of the employment of the employee meeting the requirements of the employer’s liability component.
14.3 Interest-bearing non-current liabilities
(EUR 1,000) 2016 2015
Financial liabilities 2,594 3,834
Finance lease obligations 3,171 3,231
Total 5,765 7,065
The interest rate of the financial liabilities was 0.218–1.250% (0.348–0.964%). All f inancial liabilities were euro denominated.

33Consolidated financial statements, IFRS
15. CURRENT LIABILITIES
15.1 Current liabilities
(EUR 1,000) 2016 2015
Trade and other payables
Trade payables 5,018 5,342
Other payables 2,611 2,429
Accrued liabilities and deferred income 5,527 3,418
Provisions 26
Finance lease obligations 214 253
Current tax liabilities 945 226
Total 14,341 11,668
Accrued liabilities and deferred income
Employee benefits 3,079 2,954
Other accrued liabilities and deferred income 2,447 464
Total 5,527 3,418
15.2 Finance lease obligations Assets are classif ied as assets leased under finance lease agreement, if the risks and rewards incidental to ownership of the assets substantially remain with the Group. The lease obligations have efficient security, since the lessor regains the right to the leased asset, if lease payments are neglected. The Group finance lease obligations relates to the land lease of the Helsinki head office and printing factory property as well as machinery and equipment leased as finance leases since 1 January 2014.
Gross amount of finance lease obligations – minimum lease payments by due date:
(EUR 1,000) 2016 2015
No later than 1 year 356 417
Later than 1 year – no later than 5 years 946 918
Later than 5 years 3,762 3,951
Total 5,064 5,285
Future financial expenses -1,678 -1,801
Current value of the finance lease obligations 3,385 3,484
The current value of the financial lease obligations matures as follows:
(EUR 1,000) 2016 2015
No later than 1 year 214 253
Later than 1 year – no later than 5 years 497 466
Later than 5 years 2,674 2,765
Current value of the financial lease obligations 3,385 3,484

34Consolidated financial statements, IFRS
16. FAIR VALUES OF FINANCIAL ASSETS AND LIABILITIES
The company’s financial assets consist of short-term trade and other receivables as well as cash and cash equivalents. Therefore the book value of these asstes is a fair assumption of their fair value. The book value of trade and other payables is also a fair assumption of their fair value. The book values and fair values of financial lease liabilites are presented below.
Book value Fair value Book value Fair value(EUR 1,000) 2016 2016 2015 2015
Financial liabilities 2,594 2,594 3,834 3,834
Financial lease obligations 3,385 3,385 3,484 3,484
The company has determined the fair value based on the discounted cash flows using the market rate and credit risk premium at the end of the financial period. The fair values have been classif ied at level 3 of the fair value hierarchy as they include management’s judgement. The levels of the fair value hierarchy ar presented below: - quoted prices in active markets for identical assets and liabilities (Level 1). - inputs other than quoted prices included in Level 1 that are observable for the asset or liability (Level 2). - inputs for the asset or liability that are not based on observable market data (unobservable inputs) (Level 3).
17. GUARANTEES, CONTINGENT LIABILITIES AND OTHER COMMITMENTS
(EUR 1,000) 2016 2015
Other own liabilities and commitments
Lease liabilities for machinery and equipment 361 558
Liabilities relating to lease agreements for business premises 32,348 35,693
Commitments, total 32,709 36,252
Other lease agreements
The Group as lessee
Minimum lease payments under other non-cancellable lease agreements
No later than 1 year 9,761 9,691
Later than 1 year – no later than 5 years 21,204 22,825
Later than 5 years 1,744 3,735
Total 32,709 36,252
The Group has leased several of its store, office and warehouse premises. These lease agreements are valid either for a fixed period or for the time being. The rent icrease index, renewal and other terms of the agreements vary. The 2016 income statement includes EUR 10,638 (10,573) thousand in rental expenses paid on the basis of other non-cancellable lease agreements. The Group has no liabilities resulting from derivative contracts, and there are no outstanding guarantees or any other contingent liabilities which have been granted on behalf of the management of the company or its shareholders.

35Consolidated financial statements, IFRS
18. RELATED PARTY TRANSACTIONS
The Group’s related party constitute the members of the Board of Directors and Management Group as well as the parent company and
subsidiaries.
The following members of the Board of Directors and Management Group were related parties to the Group in 2016:
Mika Ihamuotila, Chairman of the Board
Elina Björklund, Vice Chairman of the Board
Arthur Engel, member of the Board
Mikko-Heikki Inkeroinen, member of the Board
Joakim Karske, member of the Board
Catharina Stackelberg-Hammarén, member of the Board
Tiina Alahuhta-Kasko, President and CEO, member of the Management Group
Elina Aalto, CFO and member of the Management Group
Lasse Lindqvist, CMO and member of the Management Group until 15 June 2016
Päivi Lonka, CSO and member of the Management Group
Niina Nenonen, CPO and member of the Management Group until 15 March 2016
Anna Teurnell, Creative Director and member of the Management Group
The following members of the Board of Directors and Management Group were related parties to the Group in 2015:
Mika Ihamuotila, Chairman of the Board starting 9 April 2015
Pekka Lundmark, Chairman of the Board until 9 April 2015
Elina Björklund, Vice Chairman of the Board starting 9 April 2015
Arthur Engel, member of the Board
Mikko-Heikki Inkeroinen, member of the Board starting 9 April 2015
Joakim Karske, member of the Board
Catharina Stackelberg-Hammarén, member of the Board
Tiina Alahuhta-Kasko, President starting 9 April 2015 and member of the Management Group
Elina Aalto, CFO and member of the Management Group starting 11 December 2015
Thomas Ekström, CFO and member of the Management Group until 30 October 2015
Lasse Lindqvist, CMO and member of the Management Group starting 10 August 2015
Päivi Lonka, CSO and member of the Management Group
Niina Nenonen, CPO and member of the Management Group
Anna Teurnell, Creative Director and member of the Management Group
The relationships of the Group’s parent company and subsidiaries are as follows:
Parent company
Marimekko Corporation, Helsinki, Finland
Subsidiaries
Company and domicile Group’s holding, % Share of voting rights, %
Keskinäinen Kiinteistö Oy Marikko, Helsinki, Finland 100 100
Marimekko Services Oy, Helsinki, Finland 100 100
Marimekko AB, Stockholm, Sweden *) 100 100
Marimekko Australia PTY Ltd, Victoria, Australia 100 100
Marimekko GmbH, Frankfurt am Main, Germany 100 100
Marimekko North America LLC, Delaware, United States 100 100
Marimekko North America Retail LLC, Delaware, United States 100 100
Marimekko North America Holding Co, Delaware, United States 100 100
Marimekko UK Ltd, London, United Kingdom 100 100
*) Marimekko AB has branches in Norway and Denmark.

36Consolidated financial statements, IFRS
The following transactions were carried out with related parties: Management’s employee benefits
Emoluments
Employee benefits of the President and CEO as well as other members of the Management Group in 2016: Salaries, wages Share-based (EUR 1,000) and bonuses bonus system *) Total
Mika Ihamuotila, Full-time Chairman of the Board ¹ 171
Tiina Alahuhta-Kasko, President and CEO ² 232
Other members of the Management Group 609
Total 1,012 30 1,042
Remuneration to the Board of Directors in 2016: Fixed annual (EUR 1,000) remuneration
Elina Björklund 30
Arthur Engel ³ 47
Mika Ihamuotila ¹ 40
Mikko-Heikki Inkeroinen 22
Joakim Karske 22
Catharina Stackelberg-Hammarén 22
Total 183
Employee benefits of the management in 2016, total 1,225
*) Change in fair value of the cash settled plan in 20161 CEO and Chairman of the Board until 11 April 2016, Full-time Chairman of the Board starting 11 April 20162 President until 11 April 2016, President and CEO starting 11 April 20163 Board remuneration EUR 22 thousand and consulting services EUR 25 thousand
Employee benefits of the President and CEO as well as other members of the Management Board in 2015: Salaries, wages Share-based (EUR 1,000) and bonuses bonus system *) Total
Mika Ihamuotila, CEO and Chairman of the Board ¹ 478
Tiina Alahuhta-Kasko, President ² 178
Other members of the Management Group 676
Total 1,333 12 1,345
Remuneration to the Board of Directors in 2015: Fixed annual (EUR 1,000) remuneration
Elina Björklund 30
Arthur Engel ³ 61
Mika Ihamuotila ¹ 0
Mikko-Heikki Inkeroinen 22
Joakim Karske 22
Pekka Lundmark 4 8
Catharina Stackelberg-Hammarén 22
Total 165
Employee benefits of the management in 2015, total 1,510
*) Change in fair value of the cash settled plan in 20151 President and CEO until 9 April 2015, CEO and Chairman of the Board starting 9 April 20152 Chief Operating Officer until 9 April 2015, President starting 9 April 20153 Board remuneration EUR 22 thousand and payments for consulting services EUR 39 thousand4 Chairman of the Board until 9 April 2015

37Consolidated financial statements, IFRS
The pension benefits include only statutory pension payments. The management does not have additional pension benefits. Related parties are beneficiaries of share-based bonus systems. The management’s long-term bonus systems are presented further under note 4 to the financial statements. Other related party transactions Marimekko Corporation paid consultancy fees amounting to EUR 13 thousand to Oy H Ihamuotila Ab Ltd in 2016 (2015: 52). Oy H Ihamuotila Ab Ltd is owned by Helena Ihamuotila, wife of President and CEO Mika Ihamuotila. The consultancy assignments constituted separately determined PR assignments.
19. FINANCIAL RISK MANAGEMENT During the normal course of its business operations, the Marimekko Group is exposed to financial risks. The principal f inancial risks are liquidity risk, credit risk, foreign currency risk and interest rate risk. The company’s Board of Directors has confirmed the principles, responsibilities and organisation of risk management for the Group. The Board of Directors also monitors the success of risk management. According to its risk management principles, Marimekko classif ies its risks as strategic, operational, economic and accident risks. Economic risks include financial risks. Responsibility for the implementation of risk management measures concerning financial risks lies with the Group’s CFO. The main objective of financial risk management is to ensure reasonable-priced financing in all circumstances, and therefore minimise the unfavourable effects, if any, on the Group’s financial performance. Marimekko has not used derivative instruments when hedging against risks. Liquidity risk The Group continuously seeks to assess and monitor the amount of funding required by the business operations to ensure that sufficient liquid funds are available for the daily business and repayment of maturing debts. The assessment is based on monthly cash flow and liquidity forecasts. The Group aims to maintain a high liquidity level at all times in order to eliminate liquidity risk. In order to minimize the Group’s liquidity risk the Group’s near term and next few years’ f inancing need can be covered by liquid funds as well as long term commited credit facilities or credit facilities valid until further notice. The Group had at the end of the financial period access to credit facilities totalling EUR 17 million out of which EUR 4 million where committed credit facilities and EUR 13 million facilities valid until further notice. The committed credit facilities of EUR 4 million are due in 2017. At the end of the financial period, facilities valid until further notice amounting to EUR 2.6 million were drawn. No committed credit facilities were drawn at the end of the financial period. Marimekko Group’s borrowing is unsecured. However, the committed credit facilities include two financial covenants: The ratio of net debt excluding finance lease debt to EBITDA as well as the Group’s equity ratio. The conditions in the loan agreements have been met during the financial year. Maturity analysis for the Group’s financial liabilities; the figures are not discounted, and they include both interest payments and capital repayments:
31 Dec. 2016
(EUR 1,000) Less than 1 year 1–2 years 3–5 years Over 5 years
Finance liabilities 13 2,607
Finance lease obligations 414 536 597 3,575
Trade and other payables 13,156
Total 13,583 3,143 597 3,575
31 Dec. 2015
(EUR 1,000) Less than 1 year 1–2 years 3–5 years Over 5 years
Finance liabilities 27 3,848
Finance lease obligations 430 455 564 3,763
Trade and other payables 11,189
Total 11,646 4,302 564 3,763

38Consolidated financial statements, IFRS
Credit risk The trade receivables generated in the Group’s wholesale operations are associated with a credit risk, which is reduced by the Group’s broad and geographically diverse clientele. Marimekko continuously monitors the credit limits, credit history and financial situation of its customers. The Group has a centralised process in place for this purpose. Responsibility for the credit monitoring process lies with the Group’s CFO. The credit risk related to the wholesale business is also reduced by means of advance payments, bank guarantees and letters of credit. During the 2016 financial year, credit loss recognised through profit or loss amounted to EUR -34 thousand (99). Retail customers pay for their purchases using cash or the most common credit cards. Note 12.2 (Trade and other receivables) to the consolidated financial statements includes an analysis of trade receivables by age. Foreign currency risk The Group’s currency risk consists of sales and purchases made in foreign currency as well as balance sheet items and also foreign-currency-denominated net investments in units abroad. Transaction risk Marimekko Group’s transaction risk derives from currency flows connected with wholesale and retail sales as well as purchases and operative expenses of the Group’s business units as well as from from loans and receivables denominated in foreign currency. The Group’s principal sales currency is the euro. The other significant sales and invoicing currencies are the US dollar, Swedish krona, Danish krone, Norwegian krone, Australian dollar and Canadian dollar. The principal currencies used for purchases are the euro and, to a lesser extent, the US dollar. In 2016 foreign-currency-denominated sales accounted for approximately 19.9 percent (2015: 23.8 percent) of the Group’s entire sales and foreign-currency-denominated purchases with a transaction risk made up 18.4 percent (2015: 16.9 percent) of the Group’s purchases. Marimekko protects itself against the transaction risk of sales by taking into account the expected exchange rate at the time of sales when carrying out wholesale and retail pricing of products. Foreign subsidiaries are financed primarily in local currency, whereby the foreign subsidiary does not incur significant transaction risk. Group’s transaction exposure The foreign-currency-denominated assets and liabilities (cash and cash equivalents, trade receivables and trade payables) converted to euro amounts using the exchange rates quoted on the closing date are as follows:
(EUR 1,000) 2016 2015
USD SEK AUD USD SEK AUD
Current assets 1,445 1,081 2,636 5,821 2,665 2,114
Current liabilities -90 -23 -13 -96 -9 -18
Foreign currency exposure in the balance sheet 1,355 1,058 2,622 5,725 2,656 2,096
Sensitivity analysis, effect on result after taxes The strengthening or weakening of the euro against the US dollar, the Swedish krona or the Australian dollar would, given that all other factors remain unchanged, impact the Group’s result after taxes as follows. The impact portrays the Group’s transaction risk:
2016 2015
USD SEK AUD USD SEK AUD
Change in exchange rate, +10 % *) 10 10 10 10 10 10
Effects on result after taxes, EUR 1,000 15 -75 165 33 213 202
*) Strengthening (+) of the euro
Translation risk The Marimekko Group incurs translation risk when the financial statements of foreign subsidiaries are translated into euro amounts in the consolidated financial statements. For foreign-currency-denominated net investments, the effects of changes in foreign exchange rates appear as the translation difference in the Group’s equity. For the time being Marimekko has not hedged translation risk for equity, as the subsidiary sales and net investments are small from the Group’s perspective.

39Consolidated financial statements, IFRS
Interest rate risk The Group’s interest rate risk primarily results from changes in the interest on cash and cash equivalents and on current and non-current interest-bearing liabilities due to changes in market rates. The changes in the interest rates of these assets and liabilities has an impact on the Group’s profit.
(EUR 1,000) 2016 2015
Cash and cash equivalents 3,482 4,249
Interest-bearing liabilities 2,594 3,834
Finance lease obligations 3,385 3,484
The Group’s interest-bearing liabilities at the end of the financial year consisted of drawn credit facilities and finance lease obligations. The Group has access to variable-interest-rate long-term commited credit facilities or credit facilities valid until further notice totalling EUR 17 million of which EUR 13 million were valid until futher notice. At the end of the financial period facilities valid until further notice amounting to EUR 2.6 (3.8) million were drawn. A rise of one percentage point in market interest rates would have an imputed effect on Marimekko’s profit after taxes of EUR -0.0 million (-0.0). Correspondingly, a decline of one percentage point in market interest rates would have an imputed effect on Marimekko’s profit after taxes of EUR +0.0 million (+0.0).
20. CAPITAL MANAGEMENT
The purpose of capital management is to maintain a capital structure that optimally supports the Group’s strategic objectives. Efficient capital management measures ensure normal operating conditions for the business and increase the shareholder value in the long term. The principal factors affecting the capital structure are profitability, dividend distribution and investments. The capital managed equals the shareholders’ equity shown on the consolidated balance sheet. No external capital requirements are applied to the Group. The Group continuously monitors the development of its capital structure by means of the equity ratio and gearing. The Group’s strategic objective is to maintain the equity ratio at the minimum of 50 percent. At the end of 2016, the Group’s net liabilities amounted to EUR 2,497 thousand (3,070) and gearing was 8.8 percent (11.3).
Gearing
(EUR 1,000) 2016 2015
Interest-bearing liabilities 2,594 3,834
Financial lease obligations 3,385 3,484
Deducting cash and cash equivalents -3,482 -4,249
Net liabilities 2,497 3,070
Shareholders’ equity, total 28,316 27,129
Equity, total 30,813 30,199
Gearing, % 8.8 11.3
22. EVENTS AFTER THE CLOSING DATE
The management of the company is not aware of any significant events after the closing date.

40
Parent company financialstatements, FAS
PARENT COMPANY INCOME STATEMENT
(EUR 1,000) 1 Jan.–31 Dec. 2016 1 Jan.–31 Dec. 2015
NET SALES 1. 94,287 88,110
Increase (+) or decrease (-) in inventories of completed and unfinished products 2,544 367
Other operating income 2. 373 278
Materials and services 3. -40,559 -35,354
Personnel expenses 4. -18,495 -18,084
Depreciation and impairment 5. -2,189 -2,373
Other operating expenses 6. -29,756 -31,510
OPERATING PROFIT 6,204 1,434
Financial income and expenses 7. 528 26
RESULT BEFORE APPROPRIATIONS AND TAXES 6,732 1,459
Appropriations 8. 126 355
Income taxes 9. -1,282 -410
NET RESULT FOR THE PERIOD 5,577 1,404
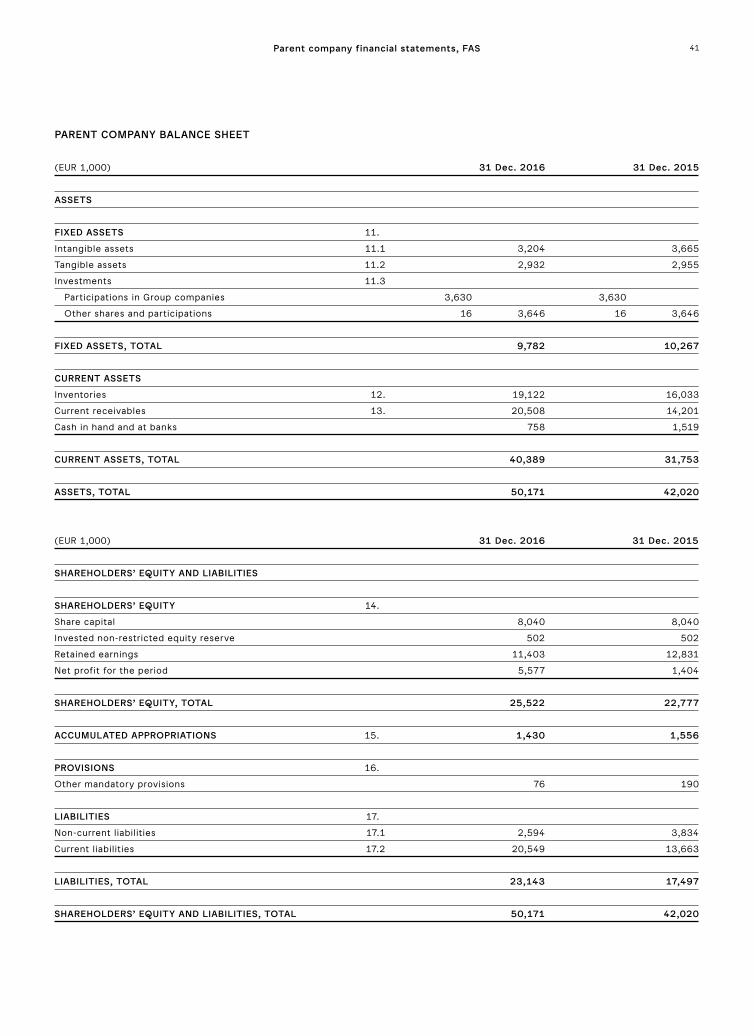
41
PARENT COMPANY BALANCE SHEET
(EUR 1,000) 31 Dec. 2016 31 Dec. 2015
ASSETS
FIXED ASSETS 11.
Intangible assets 11.1 3,204 3,665
Tangible assets 11.2 2,932 2,955
Investments 11.3
Participations in Group companies 3,630 3,630
Other shares and participations 16 3,646 16 3,646
FIXED ASSETS, TOTAL 9,782 10,267
CURRENT ASSETS
Inventories 12. 19,122 16,033
Current receivables 13. 20,508 14,201
Cash in hand and at banks 758 1,519
CURRENT ASSETS, TOTAL 40,389 31,753
ASSETS, TOTAL 50,171 42,020
(EUR 1,000) 31 Dec. 2016 31 Dec. 2015
SHAREHOLDERS’ EQUITY AND LIABILITIES
SHAREHOLDERS’ EQUITY 14.
Share capital 8,040 8,040
Invested non-restricted equity reserve 502 502
Retained earnings 11,403 12,831
Net profit for the period 5,577 1,404
SHAREHOLDERS’ EQUITY, TOTAL 25,522 22,777
ACCUMULATED APPROPRIATIONS 15. 1,430 1,556
PROVISIONS 16.
Other mandatory provisions 76 190
LIABILITIES 17.
Non-current liabilities 17.1 2,594 3,834
Current liabilities 17.2 20,549 13,663
LIABILITIES, TOTAL 23,143 17,497
SHAREHOLDERS’ EQUITY AND LIABILITIES, TOTAL 50,171 42,020
Parent company financial statements, FAS

42
PARENT COMPANY CASH FLOW STATEMENT
(EUR 1,000) 1 Jan.–31 Dec. 2016 1 Jan.–31 Dec. 2015
CASH FLOW FROM OPERATIONS
Net result for the period 5,577 1,404
Adjustments
Depreciation according to plan 2,189 2,373
Change in depreciation difference -126 -355
Financial income and expenses -528 -26
Taxes 1,282 410
Cash flow before change in working capital 8,393 3,807
Change in working capital
Increase (-) / decrease (+) in current non-interest-bearing trade receivables -5,190 -1,967
Increase (-) / decrease (+) in inventories -3,089 -190
Increase (+) / decrease (-) in current non-interest-bearing liabilities 6,159 4,562
Cash flow from operating activities before financial items and taxes 6,274 6,212
Paid interest and payments on other operational financial expenses -150 -162
Interest received 168 47
Taxes paid -495 -986
CASH FLOW FROM OPERATIONS 5,796 5,110
CASH FLOW FROM INVESTMENTS
Investments in tangible and intangible assets -2,024 -2,759
Loans granted -461
CASH FLOW FROM INVESTMENTS -2,485 -2,759
CASH FLOW FROM FINANCING
Long-term loans drawn 139
Long-term loans repaid -1,240
Short-term loans drawn 4,000
Short-term loans repaid -4,000
Dividends paid -2,831 -2,831
CASH FLOW FROM FINANCING -4,072 -2,692
Change in cash and cash equivalents -761 -342
Cash and cash equivalents at the beginning of the financial year 1,519 1,861
Cash and cash equivalents at the end of the financial year 758 1,519
Parent company financial statements, FAS

43Parent company financial statements, FAS
ACCOUNTING POLICY
Marimekko Corporation’s financial
statements have been prepared in
accordance with the legislation and
regulations that are in force in Finland.
The financial year of the company is the
calendar year.
Measurement of fixed assets
Fixed assets are recorded in the balance
sheet at the original acquisition cost
less depreciation according to plan.
Depreciation according to plan has
been calculated using straight-line
depreciation on the estimated useful life
of the fixed assets.
Periods of depreciation:
• intangible rights 5–10 years
• other capitalised expenditure
3–10 years
• machinery and equipment
5–15 years.
Inventories
Inventories are presented at the
acquisition cost or at the lower probable
net realisation value. The value of
inventories does not include any share
of fixed purchasing and manufacturing
costs.
Pension commitments
The pension security of the company’s
personnel has been arranged under the
statutory employee pension plan (TyEL)
through a pension insurance company.
Items denominated in foreign
currency
The foreign-currency-denominated
receivables and liabilities of the
company have been converted to euro
amounts using the exchange rate
quoted by the European Central Bank on
the closing date.
Leasing
Leasing payments are treated as rental
expenditures.
Appropriations
On the basis of local legislation and
accounting practices, companies in
Finland and Sweden can, in their
separate financial statements, record
in appropriations the depreciation
difference and the change in voluntary
reserves, which are items that mainly
have an effect on taxation.
Taxes
Recorded as direct taxes are the direct
taxes calculated from the taxable result
of the company.
NOTES TO THE PARENT COMPANY FINANCIAL STATEMENTS
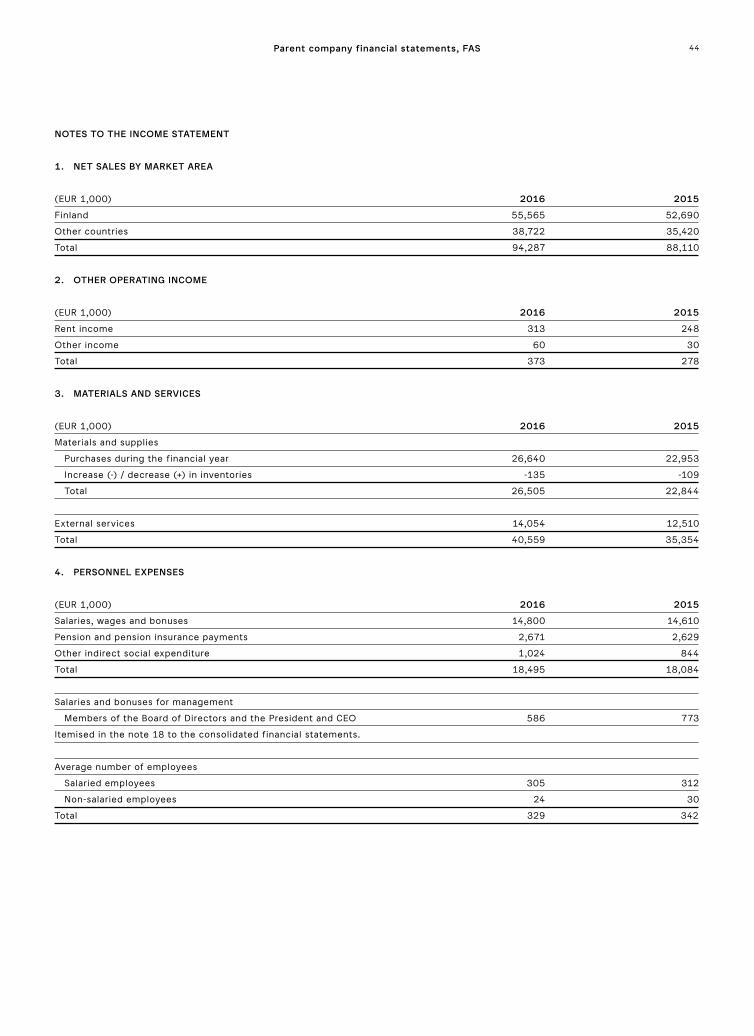
44
NOTES TO THE INCOME STATEMENT
1. NET SALES BY MARKET AREA
(EUR 1,000) 2016 2015
Finland 55,565 52,690
Other countries 38,722 35,420
Total 94,287 88,110
2. OTHER OPERATING INCOME
(EUR 1,000) 2016 2015
Rent income 313 248
Other income 60 30
Total 373 278
3. MATERIALS AND SERVICES
(EUR 1,000) 2016 2015
Materials and supplies
Purchases during the financial year 26,640 22,953
Increase (-) / decrease (+) in inventories -135 -109
Total 26,505 22,844
External services 14,054 12,510
Total 40,559 35,354
4. PERSONNEL EXPENSES
(EUR 1,000) 2016 2015
Salaries, wages and bonuses 14,800 14,610
Pension and pension insurance payments 2,671 2,629
Other indirect social expenditure 1,024 844
Total 18,495 18,084
Salaries and bonuses for management
Members of the Board of Directors and the President and CEO 586 773
Itemised in the note 18 to the consolidated financial statements.
Average number of employees
Salaried employees 305 312
Non-salaried employees 24 30
Total 329 342
Parent company financial statements, FAS
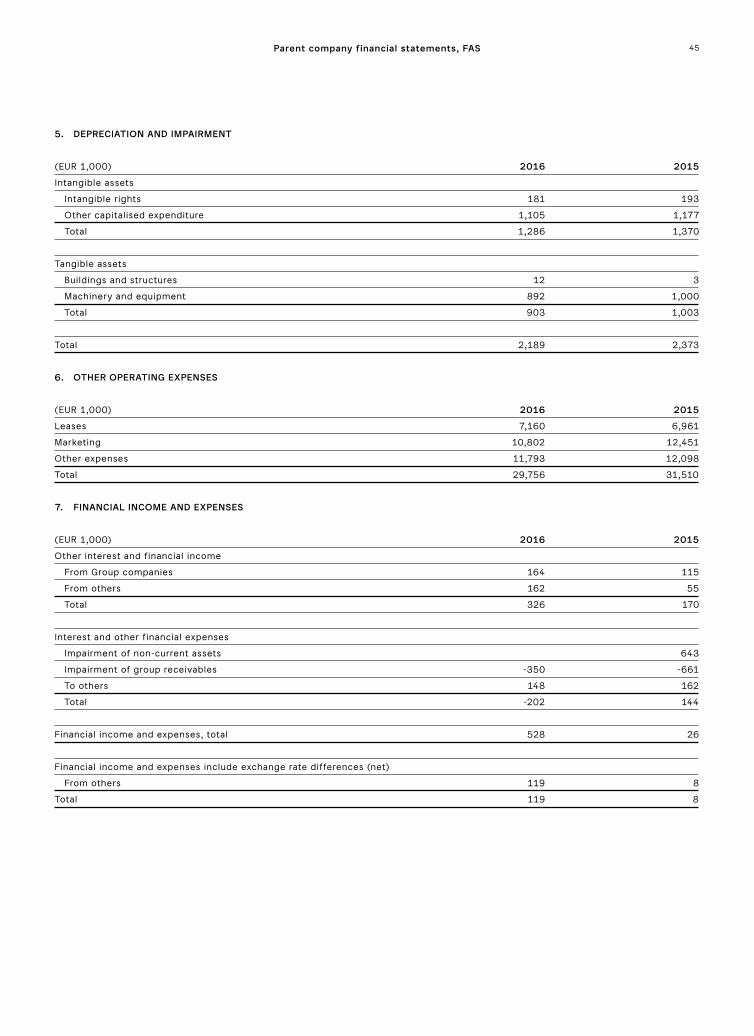
45
5. DEPRECIATION AND IMPAIRMENT
(EUR 1,000) 2016 2015
Intangible assets
Intangible rights 181 193
Other capitalised expenditure 1,105 1,177
Total 1,286 1,370
Tangible assets
Buildings and structures 12 3
Machinery and equipment 892 1,000
Total 903 1,003
Total 2,189 2,373
6. OTHER OPERATING EXPENSES
(EUR 1,000) 2016 2015
Leases 7,160 6,961
Marketing 10,802 12,451
Other expenses 11,793 12,098
Total 29,756 31,510
7. FINANCIAL INCOME AND EXPENSES
(EUR 1,000) 2016 2015
Other interest and financial income
From Group companies 164 115
From others 162 55
Total 326 170
Interest and other financial expenses
Impairment of non-current assets 643
Impairment of group receivables -350 -661
To others 148 162
Total -202 144
Financial income and expenses, total 528 26
Financial income and expenses include exchange rate differences (net)
From others 119 8
Total 119 8
Parent company financial statements, FAS

46Parent company financial statements, FAS
8. APPROPRIATIONS
(EUR 1,000) 2016 2015
Change in depreciation difference 126 355
9. INCOME TAXES
(EUR 1,000) 2016 2015
Income taxes on operations 1,282 410
Total 1,282 410
10. AUDITOR’S FEE
(EUR 1,000) 2016 2015
PricewaterhouseCoopers Oy, Authorised Public Accountants
Audit 75 119
Other services 48 98
Total 123 217

47
NOTES TO THE BALANCE SHEET
11. FIXED ASSETS 11.1 Intangible assets
2016 Advance Other payments and Intangible Computer capitalised acquisitions (EUR 1,000) rights software expenditure in progress Total
Acquisition cost, 1 Jan. 2016 1,601 5,292 6,187 269 13,350
Increases 81 567 177 825
Transfers between groups 171 142 -314
Acquisition cost, 31 Dec. 2016 1,682 5,464 6,896 132 14,174
Accumulated depreciation, 1 Jan. 2016 1,203 4,260 4,222 9,684
Depreciation during the financial year 181 606 498 1,286
Accumulated depreciation, 31 Dec. 2016 1,384 4,866 4,720 10,970
Book value, 31 Dec. 2016 299 598 2,176 132 3,204
2015 Advance Other payments and Intangible Computer capitalised acquisitions (EUR 1,000) rights software expenditure in progress Total
Acquisition cost, 1 Jan. 2015 1,517 4,206 4,839 459 11,021
Increases 85 328 1,348 616 2,377
Transfers between groups 758 -758
Decreases -48 -48
Acquisition cost, 31 Dec. 2015 1,601 5,292 6,187 269 13,350
Accumulated depreciation, 1 Jan. 2015 1,010 3,612 3,692 8,314
Depreciation during the financial year 193 648 530 1,370
Accumulated depreciation, 31 Dec. 2015 1,203 4,260 4,222 9,684
Book value, 31 Dec. 2015 399 1,033 1,965 269 3,665
11.2 Tangible assets
2016 Advance Machinery Other payments and Land and Buildings and and tangible acquisitions (EUR 1,000) water areas structures equipment assets in progress Total
Acquisition cost, 1 Jan. 2016 38 417 12,886 28 317 13,687
Increases 924 2 926
Transfers between groups 274 -274
Decreases -46 -46
Acquisition cost, 31 Dec. 2016 38 417 14,084 28 14,568
Accumulated depreciation, 1 Jan. 2016 260 10,472 10,732
Depreciation during the financial year 35 868 903
Accumulated depreciation, 31 Dec. 2016 295 11,340 11,635
Book value, 31 Dec. 2016 38 122 2,744 28 2,932
Parent company financial statements, FAS
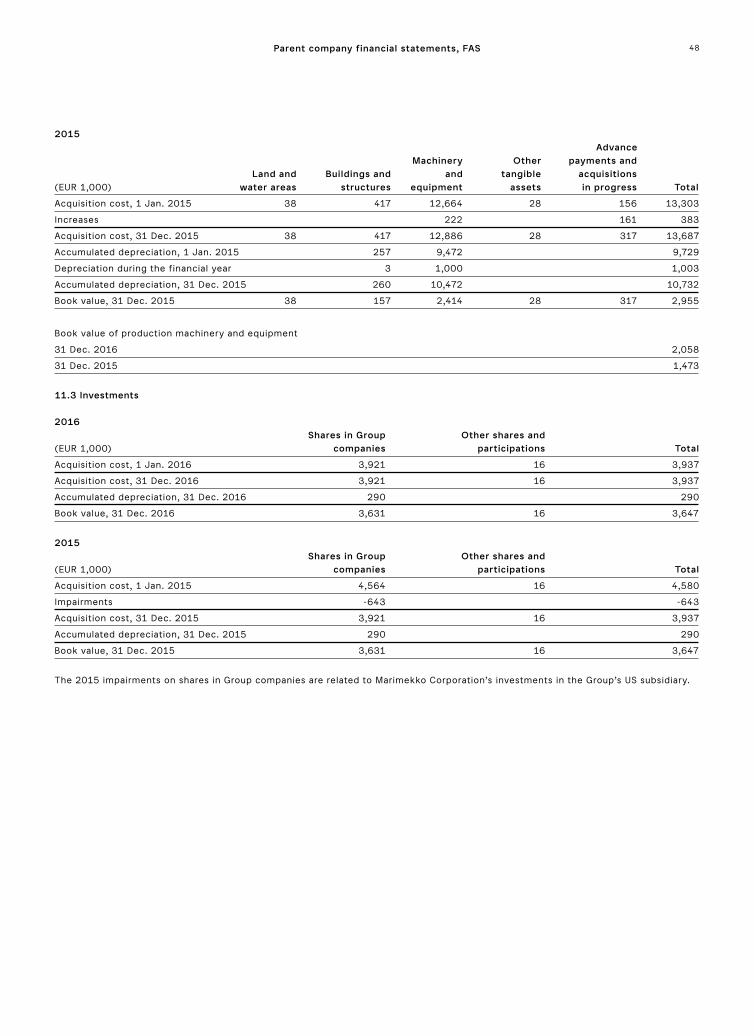
48
2015 Advance Machinery Other payments and Land and Buildings and and tangible acquisitions (EUR 1,000) water areas structures equipment assets in progress Total
Acquisition cost, 1 Jan. 2015 38 417 12,664 28 156 13,303
Increases 222 161 383
Acquisition cost, 31 Dec. 2015 38 417 12,886 28 317 13,687
Accumulated depreciation, 1 Jan. 2015 257 9,472 9,729
Depreciation during the financial year 3 1,000 1,003
Accumulated depreciation, 31 Dec. 2015 260 10,472 10,732
Book value, 31 Dec. 2015 38 157 2,414 28 317 2,955
Book value of production machinery and equipment
31 Dec. 2016 2,058
31 Dec. 2015 1,473
11.3 Investments 2016 Shares in Group Other shares and (EUR 1,000) companies participations Total
Acquisition cost, 1 Jan. 2016 3,921 16 3,937
Acquisition cost, 31 Dec. 2016 3,921 16 3,937
Accumulated depreciation, 31 Dec. 2016 290 290
Book value, 31 Dec. 2016 3,631 16 3,647
2015 Shares in Group Other shares and (EUR 1,000) companies participations Total
Acquisition cost, 1 Jan. 2015 4,564 16 4,580
Impairments -643 -643
Acquisition cost, 31 Dec. 2015 3,921 16 3,937
Accumulated depreciation, 31 Dec. 2015 290 290
Book value, 31 Dec. 2015 3,631 16 3,647
The 2015 impairments on shares in Group companies are related to Marimekko Corporation’s investments in the Group’s US subsidiary.
Parent company financial statements, FAS

49
Group companies
Company and domicile Group’s holding, % Share of voting rights, %
Keskinäinen Kiinteistö Oy Marikko, Helsinki, Finland 100 100
Marimekko Services Oy, Helsinki, Finland 100 100
Marimekko AB, Stockholm, Sweden *) 100 100
Marimekko Australia PTY Ltd, Victoria, Australia 100 100
Marimekko GmbH, Frankfurt am Main, Germany 100 100
Marimekko North America LLC, Delaware, United States 100 100
Marimekko North America Retail LLC, Delaware, United States 100 100
Marimekko North America Holding Co, Delaware, United States 100 100
Marimekko UK Ltd, London, United Kingdom 100 100
*) Marimekko AB has branches in Norway and Denmark.
12. INVENTORIES
(EUR 1,000) 2016 2015
Raw materials and consumables 4,982 5,334
Incomplete products 55 103
Finished products/goods 13,364 10,287
Advance payments 721 310
Total 19,122 16,033
13. CURRENT RECEIVABLES
(EUR 1,000) 2016 2015
Trade receivables 5,714 4,248
Receivables from Group companies
Trade receivables 4,789 579
Loan receivables 9,211 5,672
Prepaid expenses and accrued income 140 2,879
Total 14,140 9,130
Other receivables 41 22
Prepaid expenses and accrued income 612 801
Total 20,508 14,201
Prepaid expenses and accrued income
Royalty receivables 273 267
Statutory employee pension plan accrual 124
Tax assets 3 105
Other prepaid expenses and accrued income 336 306
Total 612 801
In 2016, Marimekko Corporation reversed impairment bookings made in 2013 amounting to EUR 350 thousand. The impairment reversal was made on loan receivables from the Swedish subsidiaries. In 2015, Marimekko Corporation reversed impairment bookings made in 2013 amounting to EUR 661 thousand. The impairment reversal was made on trade receivables, loan receivables and prepaid expenses and accrued income from the US, UK and Swedish subsidiaries.
Parent company financial statements, FAS

50Parent company financial statements, FAS
14. SHAREHOLDERS’ EQUITY
(EUR 1,000) 2016 2015
Share capital, 1 Jan. 8,040 8,040
Share capital, 31 Dec. 8,040 8,040
Invested non-restricted equity reserve, 1 Jan. 502 502
Invested non-restricted equity reserve, 31 Dec. 502 502
Retained earnings, 1 Jan. 14,235 15,662
Dividends paid -2,831 -2,831
Retained earnings, 31 Dec. 11,403 12,831
Net result for the period 5,577 1,404
Shareholders’ equity, total 25,522 22,777
Calculation of distributable funds, 31 Dec.
(EUR 1,000) 2016 2015
Retained earnings 11,403 12,831
Net result for the period 5,577 1,404
Invested non-restricted equity reserve 502 502
Total 17,482 14,737
15. ACCUMULATED APPROPRIATIONS
(EUR 1,000) 2016 2015
Accumulated depreciation difference
Intangible rights 68 84
Other capitalised expenditure 739 690
Machinery and equipment 482 642
Buildings and structures 141 139
Total 1,430 1,556
16. NON-CURRENT PROVISIONS
(EUR 1,000) 2016 2015
Provision for restructuring cost
Book value, 1 Jan. 190 190
Increases 0
Decreases 119
Book value, 31 Dec. 71 190

51Parent company financial statements, FAS
17. LIABILITIES
17.1 Interest-bearing and non-interest bearing liabilities
(EUR 1,000) 2016 2015
Interest-bearing liabilities
Non-current 2,594 3,834
Total 2,594 3,834
Non-interest-bearing liabilities
Current 20,549 13,663
Total 20,549 13,663
17.2 Current liabilities
(EUR 1,000) 2016 2015
Trade payables 4,541 4,800
Debts to Group companies
Trade payables 549 541
Accrued liabilities and deferred income 7,503 3,403
Other current liabilities 2,193 1,887
Accrued liabilities and deferred income 5,762 3,032
Total 20,549 13,663
Accrued liabilities and deferred income
Wages and salaries with social security contributions 2,915 2,526
Accrued income tax liabilities 938 151
Other accrued liabilities and deferred income 1,909 355
Total 5,762 3,032
18. GUARANTEES, CONTINGENT LIABILITIES AND OTHER COMMITMENTS
(EUR 1,000) 2016 2015
For the liabilities of the Group company
Guarantees 11,677 11,357
Other own liabilities and commitments
Leasing liabilities
Payments due in the following financial year 365 448
Payments due later 356 505
Total 722 953
Liabilities relating to lease agreements
Payments due in the following financial year 5,738 5,600
Payments due later 14,320 16,166
Total 20,057 21,765
The parent company has no liabilities from derivative contracts.

52
Per-share key figures
2016 2015 2014
Earnings per share (EPS), EUR 0.50 0.10 0.51
Equity per share, EUR 3.50 3.35 3.59
Dividend per share, EUR *) 0.40 0.35 0.35
Dividend per profit, % *) 80.2 352.5 68.6
Effective dividend yield, % *) 4.2 4.2 3.9
P/E ratio 19.0 83.6 17.5
Share issue adjusted average
number of shares 8,089,610 8,089,610 8,089,610
Share issue adjusted number of shares
at the end of the period 8,089,610 8,089,610 8,089,610
*) The Board of Directors’s proposal to the Annual General Meeting.
Key financial figures
2016 2015 2014
Net sales, EUR 1,000 99,614 95,652 94,150
Change in net sales, % 4.1 1.6 0.2
Operating profit, EUR 1,000 5,249 1,542 5,592
Operating profit margin, % 5.3 1.6 5.9
Financial income, EUR 1,000 164 49 252
Financial expenses, EUR 1,000 -243 -297 -360
Result before taxes, EUR 1,000 5,170 1,294 5,485
% of net sales 5.2 1.4 5.8
Taxes, EUR 1,000 1,138 491 1,370
Result after taxes, EUR 1,000 4,032 803 4,114
Balance sheet total, EUR 1,000 48,493 46,061 47,203
Net working capital, EUR 1,000 15,277 13,039 14,013
Interest-bearing liabilities, EUR 1,000 5,979 7,318 7,133
Shareholders’ equity, EUR 1,000 28,316 27,129 29,045
Return on equity (ROE), % 14.5 2.9 14.7
Return on investment (ROI), % 15.8 4.5 15.6
Equity ratio, % 58.5 59.0 61.6
Gearing, % 8.8 11.3 10.5
Gross investments, EUR 1,000 2,721 3,591 *) 2,063
% of net sales 2.7 3.3 2.2
Employee salaries, wages and
bonuses, EUR 1,000 19,807 20,392 19,475
Average personnel 441 460 473
Personnel at the end of the financial year 431 476 479
*) Excluding finance lease investments.
Key figures of the Group
* The Board of Directors’ proposal to the Annual General Meeting
0.0
0.1
0.2
0.3
0.4
0.5
0.6
2014
0.51
0.10
0.50
2015 2016
Earnings per share (EUR)
0
1
2
3
4
5
2014
4.2 4.2*
2015 2016
3.9
Effective dividend yield (%)
0
5
10
15
20
2014
2.9
14.7 14.5
2015 2016
Return on equity (ROE, %)
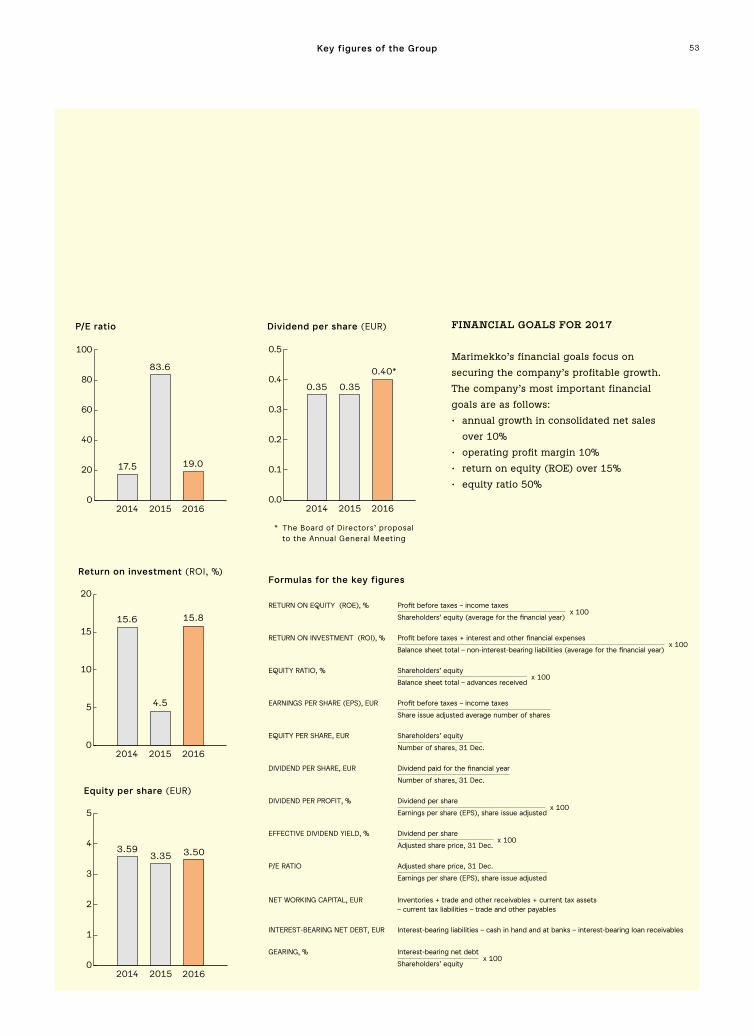
53
* The Board of Directors’ proposal to the Annual General Meeting
FINANCIAL GOALS FOR 2017
Marimekko’s financial goals focus on
securing the company’s profitable growth.
The company’s most important financial
goals are as follows:
• annual growth in consolidated net sales
over 10%
• operating profit margin 10%
• return on equity (ROE) over 15%
• equity ratio 50%
Key figures of the Group
0
1
2
3
4
5
2014
3.593.35 3.50
2015 2016
Equity per share (EUR)
0
20
40
60
80
100
2014
17.5
83.6
2015 2016
19.0
P/E ratio Dividend per share (EUR)
0.0
0.1
0.2
0.3
0.4
0.5
2014
0.35 0.35
0.40*
2015 2016
0
5
10
15
20
2014
15.6
4.5
2015 2016
15.8
Return on investment (ROI, %)
RETURN ON EQUITY (ROE), % Profit before taxes – income taxes x 100
Shareholders’ equity (average for the financial year)
RETURN ON INVESTMENT (ROI), % Profit before taxes + interest and other financial expenses x 100
Balance sheet total – non-interest-bearing liabilities (average for the financial year)
EQUITY RATIO, % Shareholders’ equity x 100
Balance sheet total – advances received
EARNINGS PER SHARE (EPS), EUR Profit before taxes – income taxes
Share issue adjusted average number of shares
EQUITY PER SHARE, EUR Shareholders’ equity
Number of shares, 31 Dec.
DIVIDEND PER SHARE, EUR Dividend paid for the financial year
Number of shares, 31 Dec.
DIVIDEND PER PROFIT, % Dividend per share x 100
Earnings per share (EPS), share issue adjusted
EFFECTIVE DIVIDEND YIELD, % Dividend per share x 100
Adjusted share price, 31 Dec.
P/E RATIO Adjusted share price, 31 Dec.
Earnings per share (EPS), share issue adjusted
NET WORKING CAPITAL, EUR Inventories + trade and other receivables + current tax assets – current tax liabilities – trade and other payables
INTEREST-BEARING NET DEBT, EUR Interest-bearing liabilities – cash in hand and at banks – interest-bearing loan receivables
GEARING, % Interest-bearing net debt x 100
Shareholders’ equity
Formulas for the key figures

54
Share
Marimekko Corporation’s share is quoted
in the Consumer Goods sector of Nasdaq
Helsinki Ltd. Marimekko Corporation
was listed on the I List of the Helsinki
Stock Exchange in March 1999 and on
the main list on 27 December 2002.
The company has one series of
shares, each conferring the same voting
rights to their holders. The company’s
shares have been included in the book-
entry register since 17 February 1999.
Share capital and number of shares
At the end of 2016, Marimekko
Corporation’s fully paid-up share capital,
as recorded in the Trade Register,
amounted to EUR 8,040,000, and the
number of shares was 8,089,610.
Authorisations
At the end of 2016, the Board of
Directors had no valid authorisations
to carry out share issues or issue
convertible bonds or bonds with
warrants, or to acquire or surrender
Marimekko shares.
Shareholder agreements
Marimekko has neither made nor is
aware of any shareholder agreements
concerning the company’s shares or
other commitments agreeing on the
company’s ownership or the use of
voting rights.
Dividend policy
Marimekko aims to pay a regular
dividend every year. The dividends
to be paid and their amount and the
payout date depend on the company’s
financial result, financial situation,
equity ratio, need for working capital
and other factors. Marimekko intends
to follow a stable and active dividends
policy that by and large reflects the
company’s earnings trend. Marimekko’s
goal is to distribute as dividends at least
half of earnings per share annually.
Dividend for 2015
A dividend of EUR 0.35 per share to
a total of EUR 2,831,364 was paid for
2015 in accordance with the decision of
the Annual General Meeting held on 11
April 2016. The dividend was paid out
on 20 April 2016.
Proposal for the dividend for 2016
The Board of Directors will propose
to the Annual General Meeting that
the dividend to be paid for the 2016
financial year be EUR 0.40 per share to
a total of EUR 3,235,844. The Board will
propose 10 April 2017 as the dividend
record date and 19 April 2016 as the
dividend payout date.
Shareholders
According to the book-entry register,
Marimekko Corporation had 7,270
registered shareholders at the end of
2016. Of the shares, 10.5 percent were
owned by nominee-registered or non-
Finnish holders at the year end.
Flaggings
Moomin Characters Oy Ltd’s share of
Marimekko Corporation’s shares and
voting rights exceeded five percent as
a result of a transaction conducted on
27 April 2016. After the transaction, the
Share andshareholders
holding of Moomin Characters Oy Ltd
was 585,000 shares which equals 7.23
percent of the number and voting rights
of the company’s shares.
Semerca Investments S.A.’s share
of Marimekko Corporation’s shares and
voting rights fell below thresholds of ten
percent and five percent as a result of a
transaction conducted on 27 April 2016.
After the transaction, the holding of
Semerca Investments S.A. was 400,377
shares which equals 4.95 percent of
the number and voting rights of the
company’s shares.
Management’s shareholding
At the end of 2016, members of the
Board of Directors and the Management
Group of the company either directly or
indirectly owned 1,334,973 shares, i.e.
16.5 percent of the number and voting
rights of the company’s shares.

55
Largest shareholders according to the book-entry register, 31 December 2016
Number of shares Percentage of and votes holding and votes
1. Muotitila Ltd 1,297,700 16.04
2. Moomin Characters Oy Ltd 585,000 7.23
3. Ehrnrooth Anna Sophia 400,377 4.95
4. Varma Mutual Pension Insurance Company 385,920 4.77
5. Oy Etra Invest Ab 236,823 2.93
6. Odin Finland 231,601 2.86
7. Veritas Pension Insurance Company Ltd. 219,217 2.71
8. Ilmarinen Mutual Pension Insurance Company 215,419 2.66
9. Aktia Europe Small Cap Equity Fund 168,900 2.09
10. Taaleri Micro Markka Equity Fund 100,000 1.24
Total 3,840,957 47.48
Nominee-registered and non-Finnish holders 845,430 10.45
Others 3,403,223 42.07
Total 8,089,610 100.00
Marimekko shares owned directly or indirectly by members of the Board of Directors
and the Management Group, 31 December 2016
Number of shares Percentage of and votes holding and votes
Mika Ihamuotila 1,297,700 16.04
Elina Björklund 9,255 0.11
Arthur Engel 11,558 0.14
Mikko-Heikki Inkeroinen 2,486 0.03
Joakim Karske 9,871 0.12
Catharina Stackelberg-Hammarén 2,753 0.03
Tiina Alahuhta-Kasko 450 0.00
Elina Aalto 0 0.00
Päivi Lonka 900 0.01
Anna Teurnell 0 0.00
Total 1,334,973 16.48
Share and shareholders
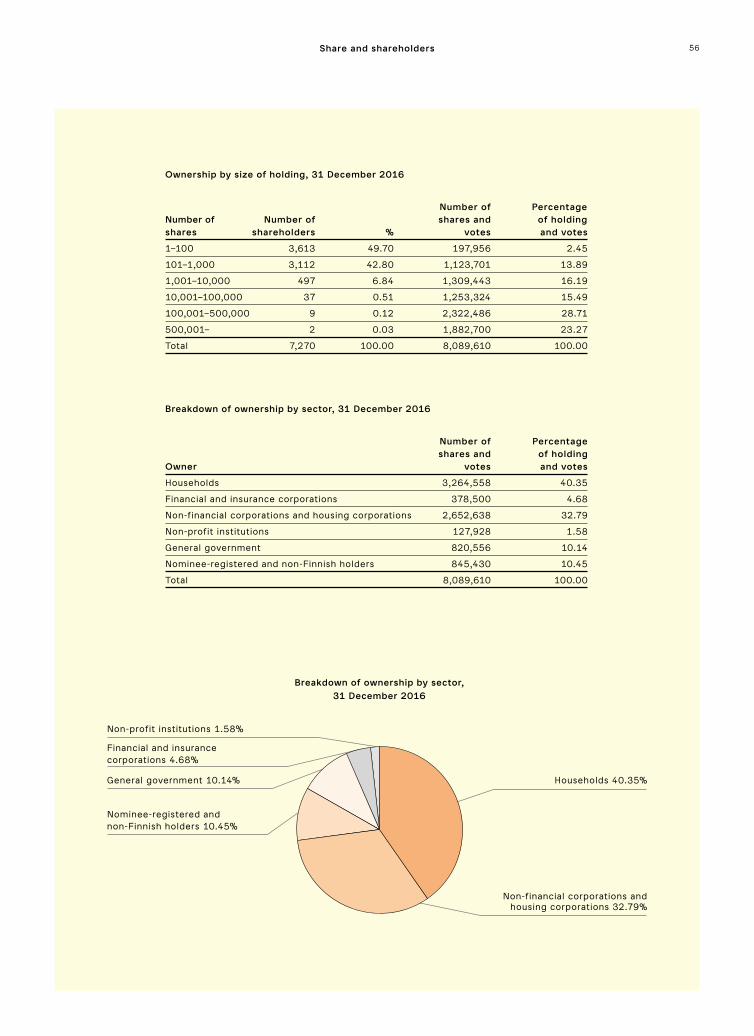
56
Ownership by size of holding, 31 December 2016
Number of Percentage Number of Number of shares and of holding shares shareholders % votes and votes
1–100 3,613 49.70 197,956 2.45
101–1,000 3,112 42.80 1,123,701 13.89
1,001–10,000 497 6.84 1,309,443 16.19
10,001–100,000 37 0.51 1,253,324 15.49
100,001–500,000 9 0.12 2,322,486 28.71
500,001– 2 0.03 1,882,700 23.27
Total 7,270 100.00 8,089,610 100.00
Breakdown of ownership by sector, 31 December 2016
Number of Percentage shares and of holdingOwner votes and votes
Households 3,264,558 40.35
Financial and insurance corporations 378,500 4.68
Non-financial corporations and housing corporations 2,652,638 32.79
Non-profit institutions 127,928 1.58
General government 820,556 10.14
Nominee-registered and non-Finnish holders 845,430 10.45
Total 8,089,610 100.00
Share and shareholders
Breakdown of ownership by sector, 31 December 2016
Non-profit institutions 1.58%
Financial and insurance corporations 4.68%
General government 10.14%
Nominee-registered and non-Finnish holders 10.45%
Households 40.35%
Non-financial corporations and housing corporations 32.79%
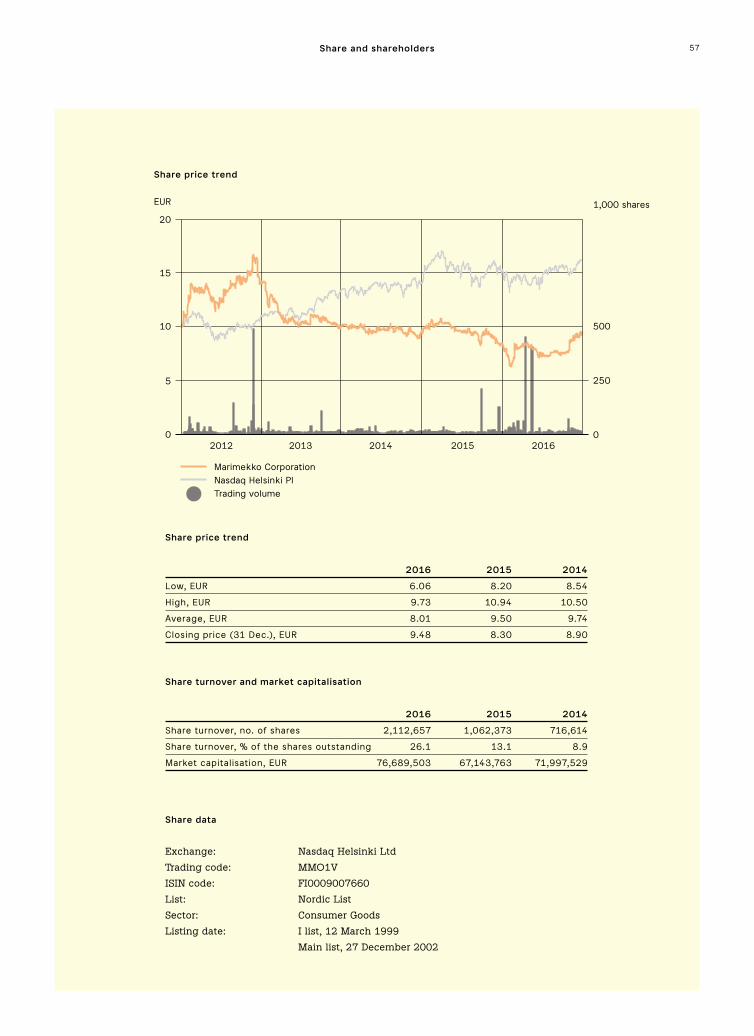
57
Share turnover and market capitalisation
2016 2015 2014
Share turnover, no. of shares 2,112,657 1,062,373 716,614
Share turnover, % of the shares outstanding 26.1 13.1 8.9
Market capitalisation, EUR 76,689,503 67,143,763 71,997,529
Share price trend
2016 2015 2014
Low, EUR 6.06 8.20 8.54
High, EUR 9.73 10.94 10.50
Average, EUR 8.01 9.50 9.74
Closing price (31 Dec.), EUR 9.48 8.30 8.90
Share data
Exchange: Nasdaq Helsinki Ltd
Trading code: MMO1V
ISIN code: FI0009007660
List: Nordic List
Sector: Consumer Goods
Listing date: I list, 12 March 1999
Main list, 27 December 2002
Share and shareholdersShare and shareholders
Share price trend
Marimekko CorporationNasdaq Helsinki PITrading volume
20
EUR 1,000 shares
15
10 500
250
0
5
02012 2013 2014 2015 2016
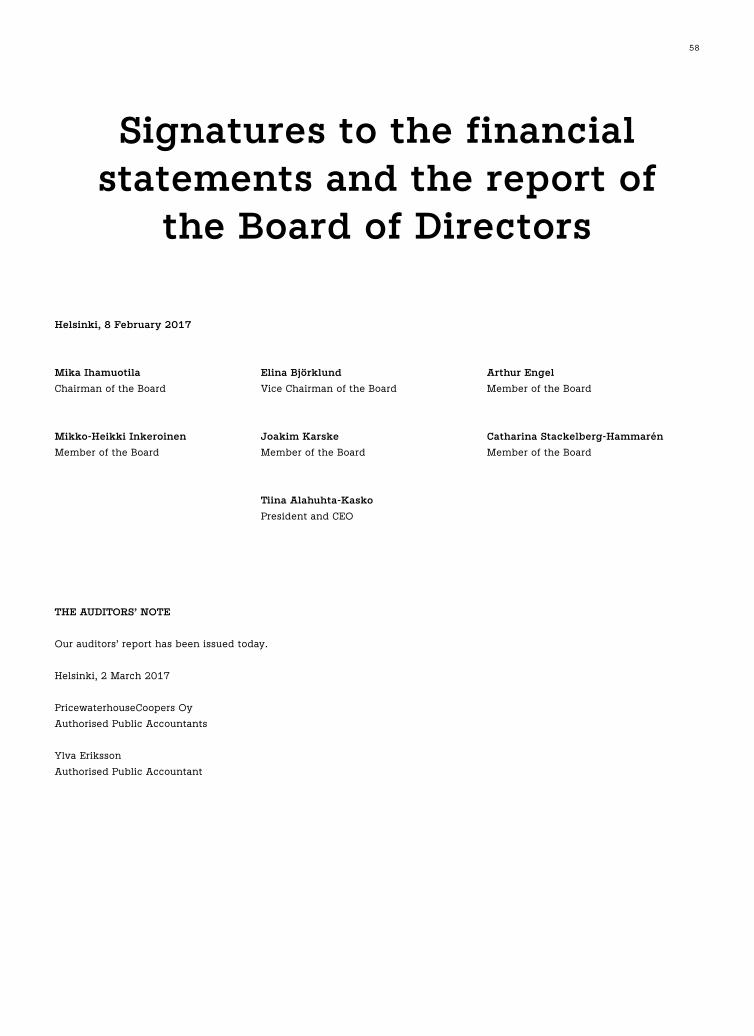
58
Mika Ihamuotila Elina Björklund Arthur Engel
Chairman of the Board Vice Chairman of the Board Member of the Board
Mikko-Heikki Inkeroinen Joakim Karske Catharina Stackelberg-Hammarén
Member of the Board Member of the Board Member of the Board
Tiina Alahuhta-Kasko
President and CEO
THE AUDITORS’ NOTE
Our auditors’ report has been issued today.
Helsinki, 2 March 2017
PricewaterhouseCoopers Oy
Authorised Public Accountants
Ylva Eriksson
Authorised Public Accountant
Helsinki, 8 February 2017
Signatures to the financial statements and the report of
the Board of Directors

59
REPORT ON THE AUDIT OF THE FINANCIAL STATEMENTS
OPINION
In our opinion,
• the consolidated financial statements give a true and fair view of the financial position, financial performance, and cash flows
of the group in accordance with International Financial Reporting Standards (IFRS) as adopted by the EU
• the financial statements give a true and fair view of both the consolidated and the parent company’s financial performance and
financial position in accordance with the laws and regulations governing the preparation of the financial statements in Finland
and comply with statutory requirements.
What we have audited
We have audited the financial statements of Marimekko Corporation (Business ID: 0111316-2) for the year ended 31 December
2016. The financial statements comprise:
• the consolidated balance sheet, income statement, statement of comprehensive income, statement of changes in equity and
statement of cash flows, and notes, including a summary of significant accounting policies
• the parent company’s balance sheet, income statement, cash flow statement and notes to the financial statements.
BASIS FOR OPINION
We conducted our audit in accordance with good auditing practice in Finland. Our responsibilities under good auditing practice
are further described in the Auditor’s Responsibilities for the Audit of the Financial Statements section of our report.
We believe that the audit evidence we have obtained is sufficient and appropriate to provide a basis for our opinion.
Independence
We are independent of the parent company and of the group companies in accordance with the ethical requirements that are
applicable in Finland and are relevant to our audit and we have fulfilled our other ethical responsibilities in accordance with
these requirements.
OUR AUDIT APPROACH
Overview
Auditor’s reportTO THE ANNUAL GENERAL MEETING OF MARIMEKKO CORPORATION
(Translation from the Finnish Original)
Materiality
• We have applied an overall group materiality of EUR 0.6 million
Audit Scope
• The group audit focused on the companies in Finland covering the
majority of the Group’s net sales, assets and liabilities
Key audit matters
• Revenue recognition
• Valuation and existence of the inventory
Materiality
Audit scope
Key auditmatters

60
As part of designing our audit, we determined materiality and assessed the risks of material misstatement in the financial
statements. In particular, we considered where management made subjective judgements; for example, in respect of significant
accounting estimates that involved making assumptions and considering future events that are inherently uncertain.
Materiality
The scope of our audit was influenced by our application of materiality. An audit is designed to obtain reasonable assurance
whether the financial statements are free from material misstatement. Misstatements may arise due to fraud or error. They are
considered material if individually or in aggregate, they could reasonably be expected to influence the economic decisions of
users taken on the basis of the financial statements.
Based on our professional judgement, we determined certain quantitative thresholds for materiality, including the overall
group materiality for the consolidated financial statements as set out in the table below. These, together with qualitative
considerations, helped us to determine the scope of our audit and the nature, timing and extent of our audit procedures and to
evaluate the effect of misstatements on the financial statements as a whole.
Overall group materiality EUR 0.6 million
How we determined it Net sales and profit before tax
Rationale for the materiality benchmark applied We chose the combination of net sales and profit before tax
as the benchmark because, in our view, the performance of
the Group is most commonly measured by users of the
financial statements by using these criteria, and it is a
generally accepted benchmark.
How we tailored our group audit scope
The group audit scope was tailored to take into account the structure of the Marimekko Group, the industry in which the Group
operates and the financial reporting related processes and controls.
We focused our group audit on the Finnish companies covering the majority of the Group’s revenues, assets and liabilities. In
addition, we performed analytical procedures on the foreign sales companies.
KEY AUDIT MATTERS
Key audit matters are those matters that, in our professional judgment, were of most significance in our audit of the financial
statements of the current period. These matters were addressed in the context of our audit of the financial statements as a whole,
and in forming our opinion thereon, and we do not provide a separate opinion on these matters.
As in all of our audits, we also addressed the risk of management override of internal controls, including among other matters
consideration of whether there was evidence of bias that represented a risk of material misstatement due to fraud.
Auditor’s report

61
We have no key audit matters to report with respect to our audit of the parent company financial statements.
KEY AUDIT MATTER IN THE AUDIT
OF THE GROUP
Revenue recognition
We refer to the income statement of the Group and to the notes
“Principles for revenue recognition and net sales”.
The Group’s revenue is generated from wholesale and retail
sales of clothes, bags, accessories and home décor items,
and from royalties. The wholesale contracts include different
delivery terms, which determine when the significant risks
and rewards have been transferred to the buyer. Retail
sales generally consist of small transactions paid by cash or
payment card and revenue is recognised at the time of the
sale transaction. Revenue from royalties is recognised in
accordance with the terms of the agreement with the licensee.
Revenue recognition include a risk that revenue is
not recorded in the correct period or that recorded sales
transactions have not occurred. Therefore, this was a focus
area in our audit.
Valuation and existence of inventory
We refer to the balance sheet of the Group and to the notes
“Inventory”.
Inventory consists of fabrics and other raw-materials as well
as of half-finished and finished goods which include clothes,
bags, accessories and home décor items.
Inventories are valued at the lower of acquisition cost
or probable net realisable value. The Group capitalises
certain directly attributable overheads within the cost of
manufactured inventories.
Inventory constitutes a significant part of the group’s
assets. The inventory accounting includes manual work
processes, among other things, relating to valuation and
compiling the inventory balances, which increases the risk for
errors.
Therefore, valuation and existence of inventory were focus
areas in our audit.
HOW OUR AUDIT ADDRESSED
THE KEY AUDIT MATTER
The audit of different revenue streams included both testing
of the company’s key controls, as well as substantive audit
procedures.
The substantive testing included, among other things, the
following procedures:
• We used system based data-analytics to obtain a thorough
understanding of the revenue postings and to target our
detailed tests on the entries that include a higher risk
of errors.
• We selected a sample of sales invoices recorded during the
financial period and compared them to the delivery notes
and payments received.
• We checked that sales transactions had been recorded
in the right financial period by comparing sales invoices
recorded before and after year-end to the dates of delivery
notes and to delivery terms, and by testing credit invoices
made in January 2017.
• For retail sales we tested reconciliations of cash and
payment card payments.
• We inspected the terms of selected licencing agreements
and tested that royalty income was recorded in accordance
with the terms of the agreements.
We tested the company’s key controls relating to inventory
balances and valuation. In addition, we performed, among
other things, the following:
• We attended physical stock counting in selected stores and
other inventory locations. We analysed the results of the
company’s own inventory counts and how the company had
resolved any inventory differences.
• We used system based data-analytics to identify
unexpected variances in the values of inventory items
during the year and we investigated the reasons for such
variances.
• We tested, on a sample basis, inventory items and
compared the values with latest purchase invoices.
• We compared the book value of selected inventory items to
their probable sales prices to ensure that the inventory is
not overvalued.
Auditor’s reportAuditor’s report

62
RESPONSIBILITIES OF THE BOARD OF DIRECTORS AND THE MANAGING DIRECTOR FOR THE FINANCIAL
STATEMENTS
The Board of Directors and the Managing Director are responsible for the preparation of consolidated financial statements that
give a true and fair view in accordance with International Financial Reporting Standards (IFRS) as adopted by the EU, as well as
for the preparation of financial statements that give a true and fair view in accordance with the laws and regulations governing
the preparation of the financial statements in Finland and comply with statutory requirements. The Board of Directors and the
Managing Director are also responsible for such internal control as they determine is necessary to enable the preparation of
financial statements that are free from material misstatement, whether due to fraud or error.
In preparing the financial statements, the Board of Directors and the Managing Director are responsible for assessing the
parent company’s and the group’s ability to continue as a going concern, disclosing, as applicable, matters related to going
concern and using the going concern basis of accounting. The financial statements are prepared using the going concern basis of
accounting unless there is an intention to liquidate the parent company or the group or cease operations, or there is no realistic
alternative but to do so.
AUDITOR’S RESPONSIBILITIES FOR THE AUDIT OF THE FINANCIAL STATEMENTS
Our objectives are to obtain reasonable assurance about whether the financial statements as a whole are free from material
misstatement, whether due to fraud or error, and to issue an auditor’s report that includes our opinion. Reasonable assurance
is a high level of assurance, but is not a guarantee that an audit conducted in accordance with good auditing practice will
always detect a material misstatement when it exists. Misstatements can arise from fraud or error and are considered material if,
individually or in the aggregate, they could reasonably be expected to influence the economic decisions of users taken on the
basis of these financial statements.
As part of an audit in accordance good auditing practice, we exercise professional judgment and maintain professional
skepticism throughout the audit. We also:
• Identify and assess the risks of material misstatement of the financial statements, whether due to fraud or error, design and
perform audit procedures responsive to those risks, and obtain audit evidence that is sufficient and appropriate to provide a
basis for our opinion. The risk of not detecting a material misstatement resulting from fraud is higher than for one resulting
from error, as fraud may involve collusion, forgery, intentional omissions, misrepresentations, or the override of internal control.
• Obtain an understanding of internal control relevant to the audit in order to design audit procedures that are appropriate in the
circumstances, but not for the purpose of expressing an opinion on the effectiveness of the parent company’s or the group’s
internal control.
• Evaluate the appropriateness of accounting policies used and the reasonableness of accounting estimates and related
disclosures made by management.
• Conclude on the appropriateness of the Board of Directors’ and the Managing Director’s use of the going concern basis of
accounting and based on the audit evidence obtained, whether a material uncertainty exists related to events or conditions that
may cast significant doubt on the parent company’s or the group’s ability to continue as a going concern. If we conclude that
a material uncertainty exists, we are required to draw attention in our auditor’s report to the related disclosures in the financial
statements or, if such disclosures are inadequate, to modify our opinion. Our conclusions are based on the audit evidence
obtained up to the date of our auditor’s report. However, future events or conditions may cause the parent company or the
group to cease to continue as a going concern.
• Evaluate the overall presentation, structure and content of the financial statements, including the disclosures, and whether the
financial statements represent the underlying transactions and events so that the financial statements give a true and fair view.
• Obtain sufficient appropriate audit evidence regarding the financial information of the entities or business activities within the
group to express an opinion on the consolidated financial statements. We are responsible for the direction, supervision and
performance of the group audit. We remain solely responsible for our audit opinion.
We communicate with those charged with governance regarding, among other matters, the planned scope and timing of the
audit and significant audit findings, including any significant deficiencies in internal control that we identify during our audit.
We also provide those charged with governance with a statement that we have complied with relevant ethical requirements
regarding independence, and to communicate with them all relationships and other matters that may reasonably be thought to
bear on our independence, and where applicable, related safeguards.
Auditor’s report

63
From the matters communicated with those charged with governance, we determine those matters that were of most
significance in the audit of the financial statements of the current period and are therefore the key audit matters. We describe
these matters in our auditor’s report unless law or regulation precludes public disclosure about the matter or when, in extremely
rare circumstances, we determine that a matter should not be communicated in our report because the adverse consequences of
doing so would reasonably be expected to outweigh the public interest benefits of such communication.
OTHER REPORTING REQUIREMENTS
OTHER INFORMATION
The Board of Directors and the Managing Director are responsible for the other information. The other information comprises
information included in the report of the Board of Directors and in the Annual Report, but does not include the financial
statements and our auditor’s report thereon. We obtained the report of the Board of Directors prior to the date of this auditor’s
report and the Annual Report is expected to be made available to us after the date.
Our opinion on the financial statements does not cover the other information.
In connection with our audit of the financial statements, our responsibility is to read the other information identified
above and, in doing so, consider whether the other information is materially inconsistent with the financial statements or our
knowledge obtained in the audit, or otherwise appears to be materially misstated. With respect to the report of the Board of
Directors our responsibility also includes considering whether the report of Board of Directors has been prepared in accordance
with the applicable legal requirements.
In our opinion,
• the information in the report of the Board of Directors is consistent with the information in the financial statements
• the report of the Board of Directors has been prepared in accordance with the applicable laws and regulations.
If, based on the work we have performed on the information included in the report of the Board of Directors, we conclude that
there is a material misstatement of this other information, we are required to report that fact. We have nothing to report in this
regard.
Helsinki, 2 March 2017
PricewaterhouseCoopers Oy
Authorised Public Accountants
Ylva Eriksson
Authorised Public Accountant
Auditor’s reportAuditor’s report
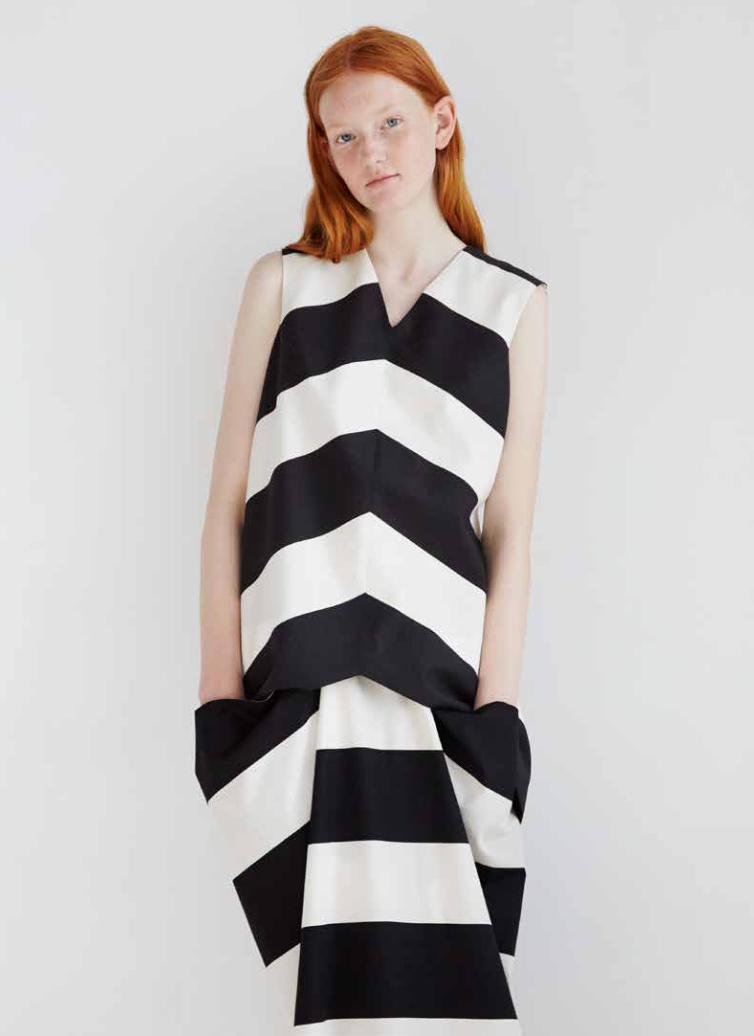
64
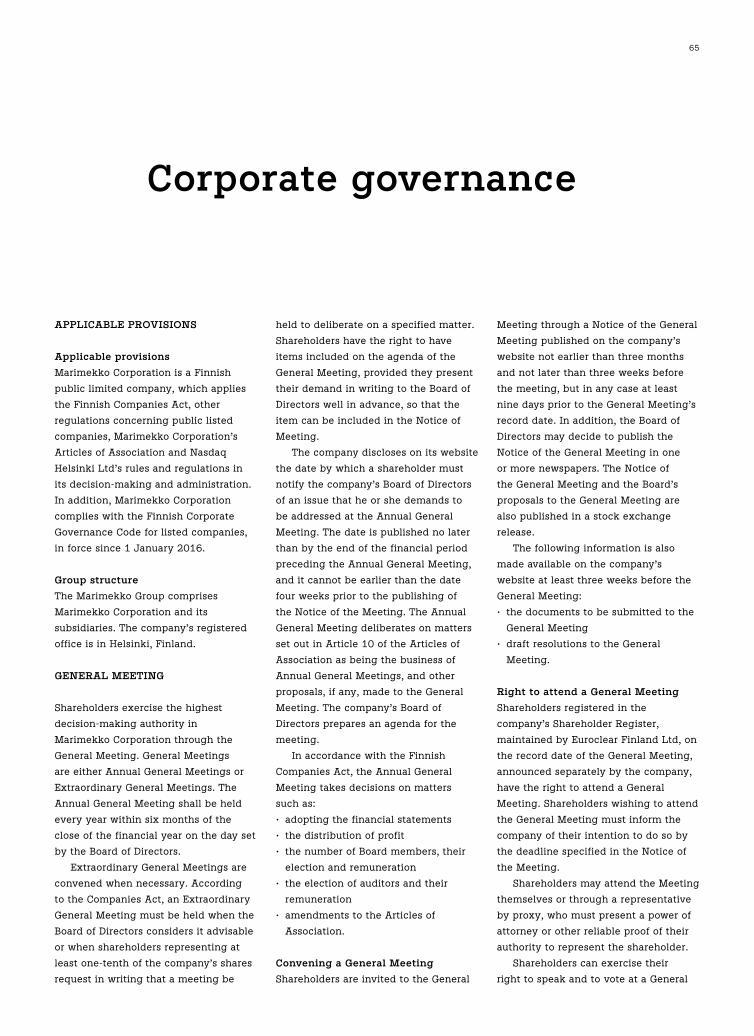
65
Corporate governance
APPLICABLE PROVISIONS
Applicable provisions
Marimekko Corporation is a Finnish
public limited company, which applies
the Finnish Companies Act, other
regulations concerning public listed
companies, Marimekko Corporation’s
Articles of Association and Nasdaq
Helsinki Ltd’s rules and regulations in
its decision-making and administration.
In addition, Marimekko Corporation
complies with the Finnish Corporate
Governance Code for listed companies,
in force since 1 January 2016.
Group structure
The Marimekko Group comprises
Marimekko Corporation and its
subsidiaries. The company’s registered
office is in Helsinki, Finland.
GENERAL MEETING
Shareholders exercise the highest
decision-making authority in
Marimekko Corporation through the
General Meeting. General Meetings
are either Annual General Meetings or
Extraordinary General Meetings. The
Annual General Meeting shall be held
every year within six months of the
close of the financial year on the day set
by the Board of Directors.
Extraordinary General Meetings are
convened when necessary. According
to the Companies Act, an Extraordinary
General Meeting must be held when the
Board of Directors considers it advisable
or when shareholders representing at
least one-tenth of the company’s shares
request in writing that a meeting be
held to deliberate on a specified matter.
Shareholders have the right to have
items included on the agenda of the
General Meeting, provided they present
their demand in writing to the Board of
Directors well in advance, so that the
item can be included in the Notice of
Meeting.
The company discloses on its website
the date by which a shareholder must
notify the company’s Board of Directors
of an issue that he or she demands to
be addressed at the Annual General
Meeting. The date is published no later
than by the end of the financial period
preceding the Annual General Meeting,
and it cannot be earlier than the date
four weeks prior to the publishing of
the Notice of the Meeting. The Annual
General Meeting deliberates on matters
set out in Article 10 of the Articles of
Association as being the business of
Annual General Meetings, and other
proposals, if any, made to the General
Meeting. The company’s Board of
Directors prepares an agenda for the
meeting.
In accordance with the Finnish
Companies Act, the Annual General
Meeting takes decisions on matters
such as:
• adopting the financial statements
• the distribution of profit
• the number of Board members, their
election and remuneration
• the election of auditors and their
remuneration
• amendments to the Articles of
Association.
Convening a General Meeting
Shareholders are invited to the General
Meeting through a Notice of the General
Meeting published on the company’s
website not earlier than three months
and not later than three weeks before
the meeting, but in any case at least
nine days prior to the General Meeting’s
record date. In addition, the Board of
Directors may decide to publish the
Notice of the General Meeting in one
or more newspapers. The Notice of
the General Meeting and the Board’s
proposals to the General Meeting are
also published in a stock exchange
release.
The following information is also
made available on the company’s
website at least three weeks before the
General Meeting:
• the documents to be submitted to the
General Meeting
• draft resolutions to the General
Meeting.
Right to attend a General Meeting
Shareholders registered in the
company’s Shareholder Register,
maintained by Euroclear Finland Ltd, on
the record date of the General Meeting,
announced separately by the company,
have the right to attend a General
Meeting. Shareholders wishing to attend
the General Meeting must inform the
company of their intention to do so by
the deadline specified in the Notice of
the Meeting.
Shareholders may attend the Meeting
themselves or through a representative
by proxy, who must present a power of
attorney or other reliable proof of their
authority to represent the shareholder.
Shareholders can exercise their
right to speak and to vote at a General

66Corporate governance
Meeting. Shareholders are entitled to
cast the total number of votes conferred
by their shareholding as on the record
date. One share confers one vote in
all matters addressed at the General
Meeting. Decisions are made by a
simple or qualified majority of votes
as provided by law and the Articles of
Association.
Record of proceedings at
General Meetings
The company prepares minutes of the
General Meeting, which, together with
voting results and the appendices to the
minutes that are part of a decision made
by the Meeting, are made available
to the shareholders on the company’s
website within two weeks of the General
Meeting. The documents related to the
General Meeting will be available on the
company’s website at least for five years
after the Meeting. The company also
announces any decisions taken at the
General Meeting in a stock exchange
release issued promptly after the
Meeting.
Presence of administrative bodies
at a General Meeting
The Chairman and all of the members
of the Board of Directors and the
President shall be present at the General
Meetings. The company’s auditor shall
attend the Annual General Meeting, and
candidates up for election to the Board
for the first time shall be present at the
Meeting in which the election is held.
BOARD OF DIRECTORS
Composition and term of office
The members of Marimekko
Corporation’s Board of Directors are
elected at the Annual General Meeting.
The proposal for the composition of the
Board of Directors is prepared by the
major shareholders of the company.
The term of office of the Board of
Directors expires at the close of the
Annual General Meeting following their
election. According to the Articles of
Association, the Board of Directors
comprises a minimum of four and a
maximum of seven ordinary members.
The number of Marimekko Corporation’s
Board members is set in proportion
to the company’s size. The Articles of
Association do not set an upper age
limit for Board members, restrict the
number of their terms of office or in any
other way restrict the General Meeting’s
authority in the election of Board
members. There is no particular order
governing the appointment of Board
members. The Board of Directors elects
a Chairman from amongst its members.
The company’s President cannot be
elected to serve as the Chairman of the
Board of Directors.
Diversity of the Board of Directors
When preparing the proposal for the
composition of the Board of Directors,
the major shareholders take account of
the company’s business requirements
and trends as well as the strategy
of the company. The main objective
is to ensure that the composition of
the Board of Directors supports the
company’s business operations, strategy
and customer-orientated approach
in an optimal manner. The diversity
of the Board of Directors ensures the
aforementioned objectives. The diversity
of the Board is reviewed from different
perspectives. The most important factors
for the company are the mutually
complementary experience, education
and know-how from different fields and
different geographic areas as well as
the personal attributes of the directors.
The diversity of the Board of Directors
is promoted in particular by the gender
and age diversity of the directors. Also
taken into account in the composition of
the Board of Directors are the long-term
objectives of the company as well as
succession planning.
Members of the Board of Directors
Marimekko Corporation’s Annual
General Meeting held on 11 April 2016
elected six members to the Board of
Directors for a term beginning on 11
April 2016 and ending at the close
of the 2017 Annual General Meeting.
Elina Björklund, Arthur Engel, Mika
Ihamuotila, Mikko-Heikki Inkeroinen,
Joakim Karske and Catharina
Stackelberg-Hammarén were re-elected
as members of the Board of Directors.
The Board is chaired by Mika Ihamuotila
and vice-chaired by Elina Björklund.
The Board members are presented on
the pages 74–75 and on the company’s
website under Investors/Management.
Independence evaluation
The Corporate Governance Code states
that the majority of Board members
shall be independent of the company.
A person without any significant
connection to the company other
than Board membership is considered
independent of the company. In
addition, at least two of the directors
representing this majority shall be
independent of significant shareholders
of the company. The Board evaluates
the independence of its members
annually. Among the members of
Marimekko Corporation’s Board of
Directors, Elina Björklund, Arthur Engel,
Mikko-Heikki Inkeroinen, Joakim Karske
and Catharina Stackelberg-Hammarén
are independent of the company and its
significant shareholders.
Mika Ihamuotila has acted as full-
time Chairman of the Board since 11
April 2016 on the basis of a separate
executive service agreement governing
his full-time chairmanship. Before
the above date, Mika Ihamuotila’s
executive service agreement also
included the duties of the CEO. The
Audit and Remuneration Committee
of the company handles and prepares
matters related to the executive
service agreement’s terms and Mika
Ihamuotila’s remuneration.
Duties and responsibilities of the
Board of Directors
The Board of Directors is responsible
for the proper organisation of the
company’s administration, operations,
accounting and asset management.
In addition to the duties specified in

67Corporate governanceCorporate governance
the Finnish Companies Act and the
Articles of Association, the written rules
of procedure adopted by the Board
contain further provisions concerning
the Board’s operating principles and
principal duties. The Board reviews and
confirms the rules of procedure annually
at its constitutive meeting, held
following the Annual General Meeting.
The Board reviews all matters that are
significant to or have long-term effects
on the company’s business operations.
According to the rules of procedure,
the Board addresses issues such as the
following:
• specifying and confirming strategic
objectives and policies for the Group
and the various business areas
• reviewing and confirming operating
plans and budgets for the Group and
the various business areas
• reviewing and approving interim
reports, the consolidated financial
statements and the Report of the
Board of Directors
• expanding and downsizing business
operations
• considering mergers, acquisitions
and demergers and restructuring
arrangements
• deciding on investments and the
acquisition and sale of assets that
are either strategically or financially
significant
• deciding on financial policy and
contingent liabilities related to
financing arrangements
• approving the Group’s reporting, risk
management procedures and internal
control procedures and audit and
control systems
• approving the audit plan
• appointing the company’s President
and the members of the Management
Group and deciding on their
remuneration
• providing instructions for the
President.
In 2016, the Board was focusing on
e.g. the following subjects:
• development of Marimekko
Corporation’s strategy as well as
confirming strategic objectives for
the various business areas
• reorganisation of the operations of the
company
• monitoring the challenging market
situation, and adapting the company’s
cost level to the current market
conditions
• reviewing and confirming operating
plans and budgets.
Meeting procedures and
decision-making
The Chairman of the Board is
responsible for convening and chairing
Board meetings. The Board has not
assigned responsibility for monitoring
any particular aspects of the business to
individual Board members. The Board
evaluates its performance annually
each January under the direction of the
Chairman. In 2016, the Board convened
nine times. The Board members’
attendance rate at meetings was 98.2%.
Committees
The Board of Directors elected by
the Annual General Meeting on 11
April 2016 appointed from among its
BOARD OF DIRECTORS
Independent of the company and Board member its significant Position since shareholders Attendance
Mika Ihamuotila Chairman since 2015 2008 No 9/9
Elina Björklund Vice Chairman since 2015 2011 Yes 9/9
Arthur Engel Member 2011 Yes 8/9
Mikko-Heikki Inkeroinen Member 2015 Yes 9/9
Joakim Karske Member 2008 Yes 9/9
Catharina Stackelberg-Hammarén Member 2014 Yes 9/9
COMMITTEES
Independent of Committee the company and member its significant Position since shareholders Attendance
Elina Björklund Chairman since 2015 2015 Yes 5/5
Joakim Karske Member 2015 Yes 5/5
Catharina Stackelberg-Hammarén Member 2015 Yes 4/5

68Corporate governance
members the Audit and Remuneration
Committee. The Board elected Elina
Björklund as the Chairman and Joakim
Karske and Catharina Stackelberg-
Hammarén as members of the Audit and
Remuneration Committee.
The Board of Directors has not
established any other committees.
The Audit and Remuneration
Committee handles and prepares
matters relating to the terms and
remuneration of Marimekko’s executive
management as well as other tasks and
supervision typically assigned to audit
and remuneration committees.
These include, for example, the
following:
• monitoring the reporting process of
financial statements
• supervising the financial reporting
process
• monitoring the efficiency of the
company’s internal control and
internal audit, if applicable, and risk
management systems
• reviewing the description of the main
features of the internal control and
risk management systems pertaining
to the financial reporting process,
which is included in the company’s
corporate governance statement
• monitoring the statutory audit of the
financial statements and consolidated
financial statements
• evaluating the independence of the
statutory auditor or audit firm and
especially the related services offered
to the company
• preparation of the proposal for
resolution on the election of the
auditor
• reviewing, overseeing and
verifying outcomes of management
compensation plans and programmes.
In 2016, the Audit and Remuneration
Committee held five meetings. The
Committee members’ attendance rate at
meetings was 94.4%.
MANAGEMENT OF THE GROUP
President
The Board of Directors elects the
company’s President and decides on the
terms of the President’s employment
agreement. The terms are specified in
a written contract which is approved
by the Board of Directors. The Audit
and Remuneration Committee of the
company handles and prepares matters
related to the terms of the employment
agreement and the remuneration of the
President. The President is responsible
for the day-to-day management and
development of the Group in accordance
with the instructions and orders of the
Board of Directors. The President is also
responsible for keeping the Board up to
date with regard to the development of
the company’s business and financial
situation.
Tiina Alahuhta-Kasko has been the
company’s President since 9 April 2015.
Since 11 April 2016, her role has also
included the duties of the CEO, which
were earlier included in the executive
service agreement of the full-time
Chairman of the Board, Mika Ihamuotila.
Subsidiary administration
The members of the subsidiaries’ Boards
of Directors are elected from amongst
the Marimekko Group’s executive
management.
Management Group
The company’s business operations
have been divided into a number of
responsibility areas, the directors of
which form the company’s Management
Group. The company’s President acts as
the Chairman of the Management Group.
The Board of Directors appoints the
members of the Management Group and
decides on their remuneration. The Audit
and Remuneration Committee of the
company handles and prepares matters
related to the terms of the employment
agreements and remuneration of the
Management Group. The Management
Group has no authority based on law or
the Articles of Association.
The Management Group reviews
business matters and procedures
affecting the entire Group. The
Management Group also reviews
the operating plans and business
development of the various business
areas. The Management Group
convenes every two weeks on
average. Information on the members
is presented on page 75 and on the
company’s website under Investors/
Management/Management Group.
REMUNERATION
The main objectives of remuneration at
Marimekko Corporation are to promote
competitiveness and long-term financial
success of the company, contribute
to the favourable development of
shareholder value and increase the
commitment of the company’s key
persons.
Remuneration of the members of
the Board of Directors
The Annual General Meeting decides
on the remuneration payable to the
Board of Directors. The Audit and
Remuneration Committee of the
company handles and prepares matters
related to the remuneration payable to
the Board of Directors. All members of
the Audit and Remuneration Committee
are independent of the company
and its significant shareholders. A
person serving the company under
an employment or service agreement
receives no fee for the membership of
the Board of a Marimekko subsidiary.
According to the resolution by
the Annual General Meeting of 11
April 2016, approximately 40 percent
of the annual remuneration to the
Board of Directors in 2016 was paid
in Marimekko Corporation’s shares
acquired from the market and the
rest in cash. In case a member of
the Board held the company’s shares
worth more than EUR 500,000 on the
date of the Annual General Meeting,
11 April 2016, the remuneration was
paid entirely in cash. According to the

69Corporate governanceCorporate governance
decision of the Annual General Meeting,
the shares were acquired directly on
behalf of the Board members within
two weeks from the release of the
interim report for 1 January–31 March
2016 or if this was not possible taken
into account the insider rules, as soon
as possible thereafter. There are no
special rules applied to the Board of
Directors concerning the ownership of
shares received as remuneration. The
Board is not, as a rule, entitled to any
other financial benefits in addition to
the fixed annual payment. Marimekko
has not issued monetary loans to the
Board members or guarantees or other
contingent liabilities on their behalf.
In 2016, the Annual General Meeting
resolved that the annual remuneration
payable to the members of the Board be
as follows: EUR 40,000 to the Chairman;
EUR 30,000 to the Vice Chairman; EUR
22,000 to the other members of the
Board. The Board members receive
no additional fee for attending board
meetings. The members of the Audit
and Remuneration Committee receive
no additional remuneration for the
committee work, nor any additional fee
for attending the committee meetings.
The fee of the Vice Chairman of the
Board includes chairing the Audit and
Remuneration Committee.
The full-time Chairman of the
Board, Mika Ihamuotila, had a full-
time executive service agreement with
the company, including the duties
of the CEO, until 11 April 2016. The
remuneration of the CEO consisted of
a regular salary and fringe benefits,
an annual bonus as well as a so-called
long-term bonus system. Under the
contract between the company and Mr
Ihamuotila, the CEO was, in addition
to his regular salary, entitled to an
annual bonus, the maximum amount
of which corresponded to his regular
salary for twelve months. The principles
determining the bonus were confirmed
by the Board based on a proposal by the
Audit and Remuneration Committee.
Since 11 April 2016, in addition to the
annual remuneration of the Chairman
of the Board resolved by the Annual
General Meeting, Mika Ihamuotila has
been paid EUR 8,800 as a monthly fee
under a separate full-time executive
service agreement with the company.
No other fees, such as annual bonuses
or benefits, in addition to the above-
mentioned, have been paid to Mr
Ihamuotila. His pension is determined
by the statutory employee pension plan
(TyEL). The Audit and Remuneration
Committee of the company handles
and prepares matters related to the
terms and remuneration of the full-time
executive service agreement of the full-
time Chairman of the Board.
Remuneration of the President
and CEO
The Board of Directors of Marimekko
Corporation decides on the salary and
remuneration payable to the President
and CEO. The Audit and Remuneration
Committee of the company handles
and prepares matters related to the
terms and remuneration of the service
contract of the President and CEO. All
members of the Audit and Remuneration
Committee are independent of
the company and its significant
shareholders.
The remuneration of the President
and CEO consists of a regular salary and
fringe benefits, an annual bonus as well
as a so-called long-term bonus system
targeted at the company’s management
group, including the President and
CEO. Under the contract between the
company and Tiina Alahuhta-Kasko,
the President and CEO is, in addition to
her regular salary, entitled to an annual
bonus, the maximum amount of which
corresponds to her regular salary for
four months. The principles determining
the bonus are confirmed annually by the
Board based on a proposal by the Audit
and Remuneration Committee. The
pension is determined by the statutory
employee pension plan (TyEL). If the
President and CEO resigns of her own
accord, her term of notice is six months
and she is entitled to a remuneration
corresponding to her regular salary for
six months. If the company terminates
the contract, the President and CEO’s
term of notice is six months and
she is entitled to a remuneration
corresponding to her regular salary for
six months. The remuneration in case of
termination is tied to a fixed-term non-
compete obligation.
Remuneration of other management
The Board of Directors of Marimekko
Corporation decides on the salary and
remuneration payable to the members
of the Management Group. The Audit
and Remuneration Committee of the
company handles and prepares matters
related to the terms and remuneration
of the service contracts of the senior
management.
All members of the Audit and
Remuneration Committee are
independent of the company and its
significant shareholders.
The remuneration of the
Management Group consists of a regular
salary and fringe benefits, an annual
bonus as well as a so-called long-term
bonus system. The annual bonus is
based on the growth of the company’s
consolidated net sales, operating result
and individual objectives separately
determined by the Board of Directors.
The members of the Management Group
fall within the scope of the statutory
employee pension plan (TyEL).
The Board of Directors decided on 7
May 2014 on establishing a long-term
bonus system targeted at the company’s
Management Group. The purpose of
the bonus system is to encourage the
Management Group to operate with
a business mentality and to add the
company’s value in the long-term
in particular. The aim is to combine
the owners’ and the Management
Group’s targets in order to increase
the company’s value and to elicit the
Management Group’s commitment to
the company in the span of several
years.
The system is composed of two
earnings periods, which are 8 May
2014–31 October 2017 and 8 May
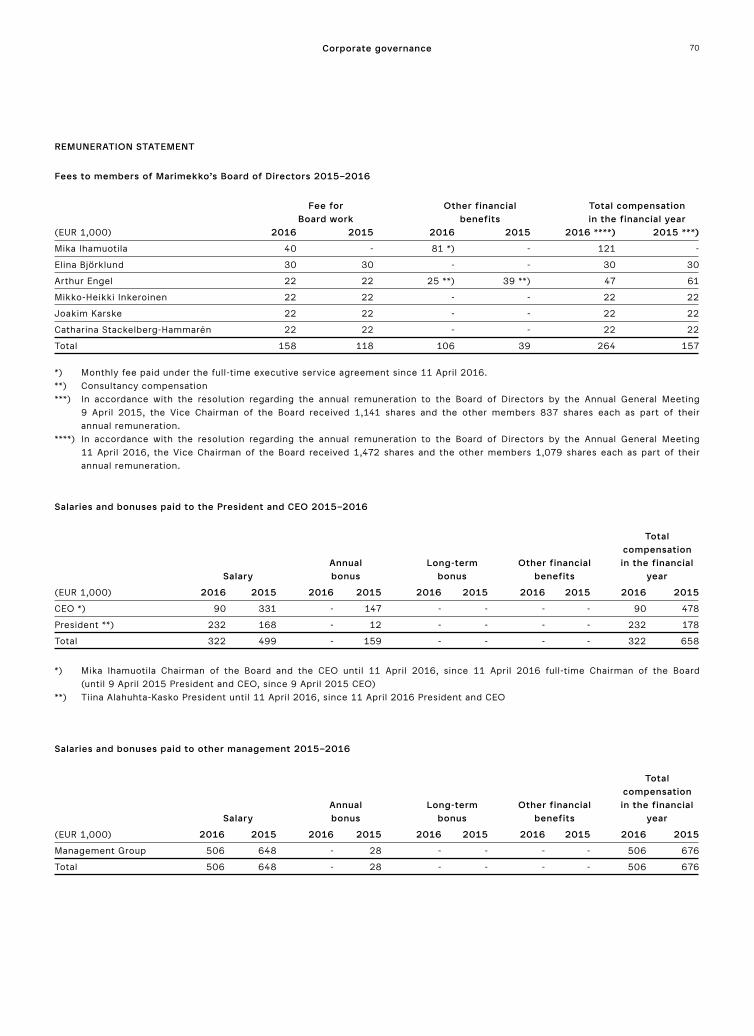
70Corporate governance
REMUNERATION STATEMENT
Fees to members of Marimekko’s Board of Directors 2015–2016
Fee for Other financial Total compensation Board work benefits in the financial year (EUR 1,000) 2016 2015 2016 2015 2016 ****) 2015 ***)
Mika Ihamuotila 40 - 81 *) - 121 -
Elina Björklund 30 30 - - 30 30
Arthur Engel 22 22 25 **) 39 **) 47 61
Mikko-Heikki Inkeroinen 22 22 - - 22 22
Joakim Karske 22 22 - - 22 22
Catharina Stackelberg-Hammarén 22 22 - - 22 22
Total 158 118 106 39 264 157
*) Monthly fee paid under the full-time executive service agreement since 11 April 2016.**) Consultancy compensation***) In accordance with the resolution regarding the annual remuneration to the Board of Directors by the Annual General Meeting 9 April 2015, the Vice Chairman of the Board received 1,141 shares and the other members 837 shares each as part of their annual remuneration.****) In accordance with the resolution regarding the annual remuneration to the Board of Directors by the Annual General Meeting 11 April 2016, the Vice Chairman of the Board received 1,472 shares and the other members 1,079 shares each as part of their annual remuneration.
Salaries and bonuses paid to the President and CEO 2015–2016
Total compensation Annual Long-term Other financial in the financial Salary bonus bonus benefits year
(EUR 1,000) 2016 2015 2016 2015 2016 2015 2016 2015 2016 2015
CEO *) 90 331 - 147 - - - - 90 478
President **) 232 168 - 12 - - - - 232 178
Total 322 499 - 159 - - - - 322 658
*) Mika Ihamuotila Chairman of the Board and the CEO until 11 April 2016, since 11 April 2016 full-time Chairman of the Board (until 9 April 2015 President and CEO, since 9 April 2015 CEO)**) Tiina Alahuhta-Kasko President until 11 April 2016, since 11 April 2016 President and CEO
Salaries and bonuses paid to other management 2015–2016
Total compensation Annual Long-term Other financial in the financial Salary bonus bonus benefits year
(EUR 1,000) 2016 2015 2016 2015 2016 2015 2016 2015 2016 2015
Management Group 506 648 - 28 - - - - 506 676
Total 506 648 - 28 - - - - 506 676

71Corporate governanceCorporate governance
2014–28 February 2018. The possible
bonus for each earnings period will be
based on the total yield on Marimekko
Corporation’s shares, including dividends.
The possible bonus will be paid in cash
in two batches, one in autumn 2017
and the other in spring 2018. Earning
the bonus requires that the person still
works for the company at the time of the
payment. When receiving the bonus, the
person in question commits themselves
to using 50 percent of the net value of
the bonus for acquiring the company’s
shares at transaction price within six
months from receiving the bonus. The
shares acquired with the bonus cannot
be surrendered prior to two years from
the time of acquiring the shares. The
annual maximum value of the bonus
paid to a member of the Management
Group in the bonus system equals the
approximate value of fixed annual salary.
On 31 December 2016, the system
encompassed the Management Group
members including the President and
CEO but excluding the Creative Director,
a total of three persons.
AUDIT
According to the Articles of Association,
the company must have one auditor and,
if the auditor is not an audit firm, one
deputy auditor. The Auditor and Deputy
Auditor must be authorised by the
Finnish Central Chamber of Commerce.
The auditors are appointed in the Annual
General Meeting.
The Annual General Meeting
held on 11 April 2016 elected
PricewaterhouseCoopers Oy, Authorised
Public Accountants, as auditor for
the Marimekko Group and the Group
companies, with Ylva Eriksson,
Authorised Public Accountant, as chief
auditor. The Annual General Meeting also
decided that the auditor’s fee will be paid
by invoice.
The remuneration paid for audit
services in 2016 was EUR 75 thousand.
The remuneration paid to the auditor for
non-audit services in 2016 was EUR 48
thousand.
The auditor issues an auditor’s report
in connection with the company’s
financial statements to the Board of
Directors and, as required by law, an
audit report to the shareholders. The
auditor is present at the Board meeting
where the annual financial statements
are reviewed and, if needed, at the
meetings of the Audit and Remuneration
Committee.
INTERNAL CONTROL, RISK
MANAGEMENT AND INTERNAL
AUDIT
Internal control, risk management and
internal auditing are crucial elements
of Marimekko’s administration and
management. The Board of Directors
and the President and CEO bear
responsibility for organising controls.
The Audit and Remuneration Committee
handles and prepares matters relating to
risk management.
Risk management and risks
Marimekko Corporation’s risk
management is based on the risk
management policy confirmed by the
company’s Board of Directors, which
defines the principles, objectives and
responsibilities of risk management, as
well as the organisation and control of
the risk management process.
Risk management principles
Marimekko Corporation’s risk
management aims to safeguard
the smooth continuity of business
operations and ensure stable profit
development for the company.
Comprehensive risk management is
an ongoing, systematic process which
involves identifying and evaluating
risks associated with the company’s
operations and operating environment.
The company’s key risks comprise risks
which could prevent the company from
exploiting business opportunities or
jeopardise or prevent the achievement
of the strategic objectives of the Group
or a Group company, or the continuity
of operations or would otherwise
have significant consequences for the
company, its personnel or stakeholders.
Risk management is an integral element
of the company’s management and
decision-making process, covering all of
the Group’s functions.
A more detailed description of
Marimekko’s risk management process
and the most significant risks is
available on pages 11–12.
Internal control and internal audit
Marimekko applies internal control
principles and an operating plan for the
execution and monitoring of internal
control. Considering the nature and
extent of the company’s business,
Marimekko has not found it necessary
to establish a separate internal audit
function. The Audit and Remuneration
Committee is responsible for monitoring
the efficiency of internal controls and
risk management and reporting to the
Board at least once a year. The Board
verifies the level of internal control.
Where necessary, the Board may
purchase internal audit services from an
external service provider.
In the Marimekko Group, internal
control is a process, for which the Board
of Directors and the President and CEO
are responsible.
The objective of internal control is to
provide reasonable assurance that:
• the company’s operations are effective
and aligned with strategy
• financial reporting and management
information is reliable
• the Group is in compliance with
applicable laws and regulations
• a Code of Conduct and ethical values
are established.
The system of internal control
of Marimekko Corporation is based
on the Committee of Sponsoring
Organizations (COSO) framework, which
consists of five key components: the
control environment, risk assessment,
control activities, information and
communications, and monitoring.
72
INSIDER ADMINISTRATION
Marimekko’s insider policy
Marimekko Corporation’s insider
policy is based on the Guidelines
for Insiders of Nasdaq Helsinki Ltd.,
the Market Abuse Regulation (MAR),
which entered into force on 3 July
2016, and other related regulation
and guidance. Marimekko’s insider
policy reflects the main obligations of
insiders of Marimekko Corporation as
well as describes the trade reporting of
managers and their closely associated
persons under MAR and related
regulation and guidance.
The Board of Directors of Marimekko
Corporation confirms the policy.
Insider lists and trading restrictions
Marimekko is obligated to draw up and
maintain a list of all persons who have
access to inside information and who
are working for Marimekko under a
contract of employment, or otherwise
performing tasks through which they
have access to inside information (such
as advisers, accountants or credit rating
agencies). Marimekko has decided
not to maintain a list of permanent
insiders. Consequently, all persons
having inside information will be
identified as deal-specific insiders for
the relevant projects. Establishment of
each such project/event is determined
simultaneously with the decision to
delay the disclosure of information.
Deal-specific insider lists are not public.
Marimekko’s Insider Administration
is responsible for the maintenance of
the insider lists. Persons entered in the
deal-specific insider list of Marimekko
are not allowed to trade in the
company’s financial instruments during
the validity of the project.
Preparation of periodic disclosure
(interim reports, financial statement
bulletin) or regular access to
unpublished financial information is
not regarded as an insider project,
nor does the company resolve to
delay disclosure in relation thereto.
However, due to the sensitive nature
of unpublished information on the
company’s financial results, the company
applies principles stated in the policy,
such as maintaining a list of persons who
have authorised access to unpublished
financial result information and a closed
period before the publishing of annual
and/or interim results.
Trading in financial instruments
relating to Marimekko is always
prohibited when a person holds inside
information concerning Marimekko or its
financial instruments.
Transactions of managers and their
closely associated persons
Managers (Members of the Board of
Directors and Management Group) and
their closely associated persons are
required to notify Marimekko and the
Finnish Financial Supervisory Authority
of every transaction conducted on their
own account relating to the financial
instruments of Marimekko. Promptly
upon receipt of the notification,
Marimekko is required to disclose such
information as a stock exchange release.
Each manager shall identify the
persons closely associated to him/her
and notify the company in writing of the
names and other required information
of such persons. According to MAR, the
obligations of the managers, such as
trading restrictions and the obligation to
notify the company of every transaction,
also apply to persons closely associated
to the managers.
Closed period
Marimekko applies a closed period of 30
days before the publishing of annual and
interim results. During the closed period,
the members of the company’s Board of
Directors or members of the Management
Group are prohibited from trading in the
shares or other financial instruments
linked to Marimekko. The closed period
also applies to persons participating in
the preparation of annual and interim
results and to the persons determined
by the company having, based on their
position or access rights, access to the
unpublished financial result information.
Supervision of the insider policy
The General Counsel of the company
is responsible for the insider
administration. Marimekko’s employees
may report actual or potential
infringements of this policy or financial
market regulation in accordance with
the internal anonymous procedure of
Marimekko.
INVESTOR RELATIONS
The Chief Financial Officer is
responsible for Marimekko Corporation’s
investor relations and the content
of financial information. Corporate
Communications is responsible
for the company’s stock exchange
releases, investor and analyst meeting
arrangements and the company’s
online investor information. Marimekko
publishes all of its investor information
in Finnish and English.
CORPORATE GOVERNANCE
STATEMENT
The corporate governance statement is
issued separately from the Report of the
Board of Directors. It can be found on
the company’s website under Investors/
Management/Corporate governance.
Corporate governance

73Corporate governance

74
Board of Directors andmanagement, 31 Dec. 2016
BOARD OF DIRECTORS
Mika Ihamuotila born 1964
Chairman of the Board
Ph.D. (Econ.)
Principal occupation: Executive
Chairman of the Board of Marimekko
Corporation, 2016–
Primary work experience and
key positions of trust:
Chairman of the Board and CEO of
Marimekko Corporation, 2015–2016;
President and CEO of Marimekko
Corporation and Vice Chairman of
the Board, 2008–2015; President and
CEO of Sampo Bank plc, 2001–2007;
President and CEO of Mandatum Bank
Plc, 2000–2001; Executive Director of
Mandatum Bank Plc, 1998–2000; Partner
of Mandatum & Co Ltd, 1994–1998;
Visiting scholar of Yale University (USA),
1992–1993; Member of the Board of
Sanoma Corporation, 2013–; Member of
the Board of Rovio Entertainment Ltd,
2013–
Elina Björklund born 1970
Vice Chairman of the Board
Chairman of the Audit and
Remuneration Committee
M.Sc. (Econ.), IDBM Pro
Principal occupation: CEO of Reima Ltd,
2012–
Primary work experience and
key positions of trust:
Partner and Director of BletBI Advisors
(Shanghai, China), 2011–2012;
Vice President Marketing in Fiskars
Corporation’s Home division and
Member of Executive Board, 2009–
2010; several executive positions and
Member of Executive Board in Iittala
Group Ltd, 2005–2009 and Development
Manager, 2004–2005; CEO of Ebit Ltd,
2001–2004; Deputy Managing Director of
Merita Securities Ltd (current Nordea),
1998–1999 and Chief Equity Analyst,
1996–1999; Equity Analyst of Kansallis-
Osake-Pankki Equity Research, 1994–
1995; Member of the Board of Directors
and Audit Committee of Finnair Plc
2009–2012; Member of the Board of the
HSE Foundation, 2013–, Member of the
Board of The Finnish-Russian Chamber
of Commerce 2016–, Member of EVA
Supervisory Board 2016–
Arthur Engel born 1967
Member of the Board of Directors
Economics degree
Principal occupation: Non-executive
board member; independent advisor and
investor at Hilaritas AB, 2013–
Primary work experience and
key positions of trust:
CEO of Björn Borg AB, 2008–2013; CEO
of GANT Company AB, 2001–2007 and
COO, 2000–2001; CEO and several
executive positions in Leo Burnett
Advertising Agency, 1994–2000; Statoil
Svenska AB, 1991–1994; Chairman of the
Board of Directors of Caliroots AB, 2013–;
Member of the Board of Directors of MQ,
2014–; Member of the Advisory Board
for Economic studies at the University
of Stockholm; Chairman of the Board of
Directors of Rapunzel of Sweden 2015–;
Chairman of the Board of Directors
of OnePiece AS, 2015–; Chairman of
the Board of Directors of Five AB, 2016–;
Member of the Board of Directors of Eton
AB, 2016–
Mikko-Heikki Inkeroinen born 1987
Member of the Board of Directors
M. Soc.Sc.
Principal occupation: Head of Digital
Commerce of Expert AS, 2015–
Primary work experience and
key positions of trust:
Marketing & E-commerce manager and
a member of company steering group of
Expert ASA Oy, 2010–2015; Member of
the Board of Suomen Kierrätysyhteisö
Oy, 2014–2015; Member of the Board
of Finnish Conscript Union, 2008–2009;
Member of the Board of Union of Finnish
Upper Secondary School Students,
2006–2007
Joakim Karske born 1963
Member of the Board of Directors
Member of the Audit and Remuneration
Committee
Master of Arts
Principal occupation: Senior Vice
President, Brands & customer experience,
OP Financial Group, 2014–
Primary work experience and
key positions of trust:
Interim head of the Nokia brand, 2014;
Head of Design Strategy at Nokia, 2009–
2013; Nokia Mobile Phones and Vertu,
Head of Design, 2006–2008; various
designer and chief designer positions:
Volvo Strategic Design (Barcelona,
Spain), 2001–2005; DaimlerChrysler
Advanced Design Centre (Tokyo,
Japan), 1999–2001; Mercedes-Benz AG
(Stuttgart, Germany), 1998–1999; Volvo
Cars (Gothenburg, Sweden) 1995–1998;
Member of the Board of Korpinen Oy,
2012–2015; Association of Finnish Work,
board member 2015–

75
Catharina Stackelberg-Hammarén
born 1970
Member of the Board of Directors
Member of the Audit and Remuneration
Committee
M.Sc. (Econ.)
Principal occupation: Founder and
Managing Director of Marketing Clinic,
2004–
Primary work experience and
key positions of trust:
Managing Director of Coca-Cola Finland,
2003–2004 & 2000–2002; Managing
Director of Coca-Cola AB, 2002–2003;
Marketing Director of Coca-Cola
Nordic & Baltic Division (Copenhagen,
Denmark), 2000; Consumer Marketing
Manager of Coca-Cola Finland, 1996–
2000; Marketing Manager of Sentra
plc, 1994–1996; Member of the Board
of Mint of Finland Ltd, 2004–2011;
Member of the Board of Tradedoubler
Ltd, 2006–2007; Member of the Board
of EQ Plc, 2011–2012; Member of the
Board of Cision AB, 2013–2014; Member
of the Board of Jokerit Hockey Club Oy,
2013–2014; Member of the Board of
Scan Securities Ab 1996–; Member of
the Board of Alma Media Corporation,
2009–; Member of the Board of
Stiftelsen Svenska Handelshögskolan,
2011–; Member of the Board of Aktia
Bank p.l.c., 2012–
MANAGEMENT GROUP
Tiina Alahuhta-Kasko born 1981
President and CEO
Employed by the company since 2005
Elina Aalto born 1968
Chief Financial Officer (CFO)
Employed by the company since 2015
Päivi Lonka born 1962
Chief Sales Officer (CSO)
Employed by the company since 2004
Anna Teurnell born 1966
Creative Director
Employed by the company since 2014
On 15 March 2016, 15 June 2016, 15
September 2016 and 29 November
2016, the company announced changes
in its management. For additional
information see the Report of the Board
of Directors, Management at page 11.
Information on the shareholdings in
Marimekko Corporation by the members
of the Board of Directors and the
Management Group on 31 December
2016 is provided on the page 55.
Board of Directors and management

76
Information forshareholders
Schedule for financial reporting
in 2017
– Financial Statements Bulletin 2016,
Thursday, 9 February 2017
– Financial Statements 2016, week 11,
at the latest
– Interim Reports
• January–March,
Wednesday, 10 May 2017
• January–June,
Thursday, 10 August 2017
• January–September,
Thursday, 2 November 2017
Annual General Meeting
Marimekko Corporation’s Annual General
Meeting will be held from 2 p.m.
onwards on Thursday, 6 April 2017 at
Marimekko Corporation’s head office,
Puusepänkatu 4, 00880 Helsinki, Finland.
Shareholders who have been registered
by the Annual General Meeting’s record
date of 27 March 2017 at the latest in the
company’s Shareholder Register kept by
Euroclear Finland Ltd have the right to
attend the Annual General Meeting. The
shareholder in whose name the shares
are registered is automatically entered in
the company’s Shareholder Register.
Shareholders who wish to attend the
Annual General Meeting must notify
the company of their intention to do so
before 4 p.m. on Monday, 3 April 2017 at
the latest:
• by filling in the registration form on
the company’s website company.
marimekko.com under Investors/
Management/General Meeting;
• by email to [email protected];
• by telephone on +358 20 770 6893.
A holder of nominee-registered shares
may participate in the Annual General
Meeting with those shares under which
the holder would be entitled to be
registered in the company’s Shareholder
Register on 27 March 2017. Additionally,
participation requires that the holder
of nominee-registered shares is
temporarily registered in the Shareholder
Register no later than 3 April 2017 at
10 a.m. Temporary registration in the
Shareholder Register shall be deemed to
be a registration for the Annual General
Meeting. A holder of nominee-registered
shares is advised to request necessary
instructions regarding the temporary
registration in the Shareholder Register,
the issuing of proxy documents and
registration for the General Meeting from
their custodian bank well in advance.
The account management organisation of
the custodian bank will register a holder
of nominee-registered shares, who wants
to participate in the Annual General
Meeting, to be temporarily entered into
the company’s Shareholder Register by
the above-mentioned date.
Any proxy documents should be
sent in original to the company before
the registration deadline. Notice of the
Annual General Meeting and further
information is provided on the company’s
website under Investors/Management/
General Meeting.
Dividends
The Board of Directors will propose to the
Annual General Meeting that a dividend
of EUR 0.40 per share be paid for 2016.
The dividend will be paid to shareholders
who are registered on the dividend
payout record date of 10 April 2017 in
the company’s Shareholder Register kept
by Euroclear Finland Ltd. The Board
of Directors will propose to the Annual
General Meeting that the dividend be
paid on 19 April 2017.
Principles of investor relations
Corporation complies with the principles
of equity in its investor communications
and publishes all its investor information
primarily on its website in Finnish and
English.
Information sessions and
silent period
Information sessions are held at least
twice a year for analysts and the media,
always when the financial statements
and half-year results are released as
well as when necessary in connection
with the disclosure of other significant
matters. Marimekko has a four-week
silent period before the publication of
earnings reports.
Analysts
A list of banks and securities brokers
that actively follow Marimekko’s
development is available on the
company’s website under Investors/
Marimekko as an investment/Analysts.
Financial reports
Marimekko Corporation’s financial
statements and interim reports are
published in Finnish and English.
Printed financial statements 2016
are available upon request. Interim
reports are also sent upon request to
the address provided by the subscriber.
Financial information is posted on the
company’s website under Releases and
publications.
To order publications, contact:
Marimekko Corporation
Corporate Communications
P.O. Box 107, 00811 Helsinki, Finland
Tel. +358 9 758 71
Investor relations
Elina Aalto, CFO
Marimekko Corporation
P.O. Box 107, 00811 Helsinki, Finland
Tel. +358 9 758 7261
Piia Kumpulainen,
Communications Director
Marimekko Corporation
P.O. Box 107, 00811 Helsinki
Tel. +358 9 758 7293


www.marimekko.com Tilinpäätös 2016
Tilin
pä
ätö
s 20
16