financial statements contents · financial statements contents 17 statement by the board ... as set...
TRANSCRIPT
financiaL stateMents contents17 Statement by the Board
18 Independent Auditors’ Report
20 Statements of Financial Position
22 Statements of Income and Expenditure
24 Statements of Comprehensive Income
25 Consolidated Statement of Changes in Equity
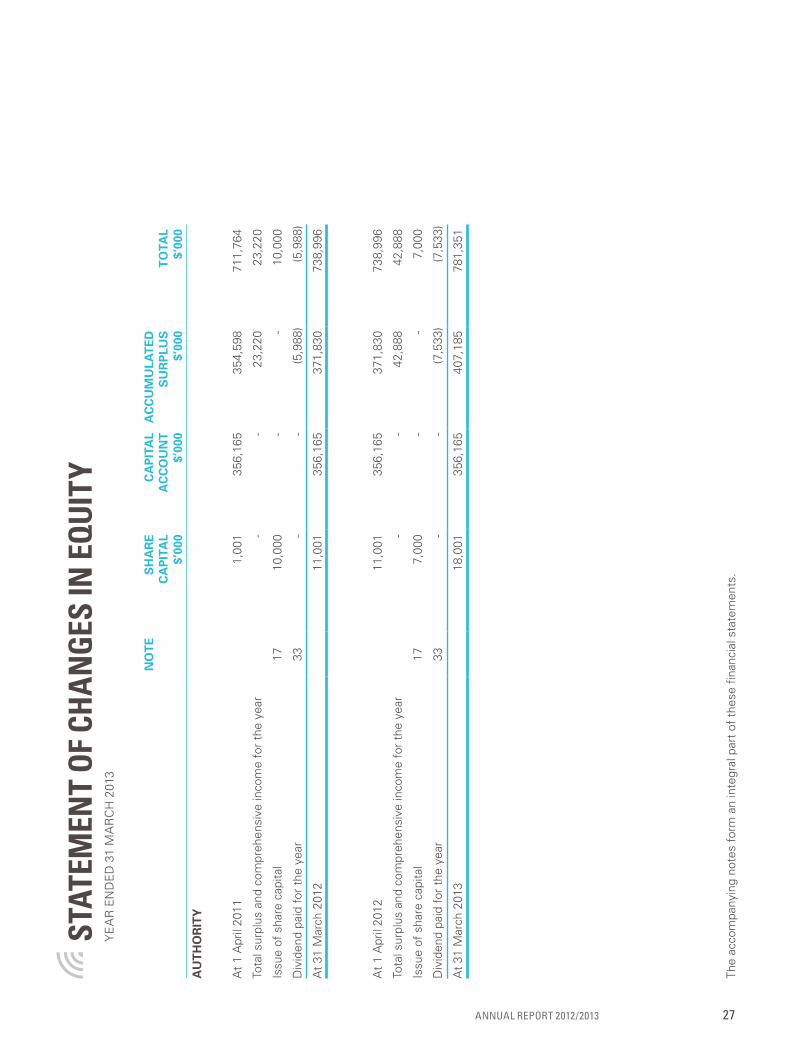
27 Statement of Changes in Equity
28 Consolidated Statement of Cash Flows
30 Notes to Financial Statements
Infocomm Development AuthorIty of SIngApore16
Statement by the board of theInfo-CommunICatIonS development authorIty of SIngapore
In our opInIon:(a) the accompanying financial statements of Info-Communications Development Authority of Singapore (the “Authority”)
and its subsidiaries (the “Group”) as set out on pages FS1 to FS65 are drawn up in accordance with the provisions of the Info-Communications Development Authority of Singapore Act (Cap. 137A, 2000 Revised Edition) (the “Act”) and Statutory Board Financial Reporting Standards so as to present fairly, in all material respects, the state of affairs of the Group and of the Authority as at 31 March 2013, the results and changes in equity of the Group and of the Authority, and cash flows of the Group for the year ended on the date; and
(b) proper accounting and other records have been kept, including records of all assets of the Authority whether purchased, donated or otherwise; and
(c) the receipts, expenditure, investment of moneys and the acquisition and disposal of assets by the Authority during the year have been in accordance with the provisions of the Act.
The Board of the Info-Communications Development Authority of Singapore has, on the date of this statement, authorised these financial statements for issue.
on behalf of the board
Yong Ying-I Ronnie TayChairman Chief Executive Officer
9 June 2013
AnnuAl RepoRt 2012/2013 17

Independent audItorS’ report
report on the fInancIal statementsWe have audited the financial statements of Info-Communications Development Authority of Singapore (the “Authority”) and its subsidiaries (the “Group”), which comprise the statements of financial position of the Group and of the Authority as at31 March 2013, the statements of income and expenditure, the statements of comprehensive income and statements of changes in equity of the Group and of the Authority and consolidated statement of cash flows of the Group for the year then ended, and a summary of significant accounting policies and other explanatory information, as set out on pages FS1 to FS65.
Management’s responsibility for the financial statementsManagement is responsible for the preparation and fair presentation of these financial statements in accordance with the provisions of the Info-communications Development Authority of Singapore Act (Cap. 137A, 2000 Revised Edition) (the “Act”) and Statutory Board Financial Reporting Standards (“SB-FRS”), and for such internal control as management determines is necessary to enable the preparation of financial statements that are free from material misstatement, whether due to fraud or error.
Auditors’ responsibilityOur responsibility is to express an opinion on these financial statements based on our audit. We conducted our audit in accordance with Singapore Standards on Auditing. Those standards require that we comply with ethical requirements and plan and perform the audit to obtain reasonable assurance about whether the financial statements are free from material misstatement.
An audit involves performing procedures to obtain audit evidence about the amounts and disclosures in the financial statements. The procedures selected depend on the auditor’s judgement, including the assessment of the risks of material misstatement of the financial statements, whether due to fraud or error. In making those risk assessments, the auditor considers internal control relevant to the entity’s preparation and fair presentation of the financial statements in order to design audit procedures that are appropriate in the circumstances, but not for the purpose of expressing an opinion on the effectiveness of the entity’s internal control. An audit also includes evaluating the appropriateness of accounting policies used and the reasonableness of accounting estimates made by management, as well as evaluating the overall presentation of the financial statements.
We believe that the audit evidence we have obtained is sufficient and appropriate to provide a basis for our audit opinion.
OpinionIn our opinion, the consolidated financial statements of the Group and the statement of financial position, statement of income and expenditure, statement of comprehensive income and statement of changes in equity of the Authority are properly drawn up in accordance with the provisions of the Act and SB-FRS so as to present fairly, in all material respects, the state of affairs of the Group and of the Authority as at 31 March 2013 and the results and changes in equity of the Group and of the Authority and cash flows of the Group for the year ended on that date.
Other matterThe consolidated financial statements of the Group and the statement of financial position, statement of income and expenditure, statement of comprehensive income and statement of changes in equity of the Authority as at and for the year ended 31 March 2012 were audited by another auditor who expressed an unmodified opinion on those statements on 22 June 2012.
MEMBERS OF ThE AuThORITYInFO-COMMunICATIOnS DEvElOpMEnT AuThORITY OF SInGApORE
Infocomm Development AuthorIty of SIngApore18

report on other legal and regulatory requIrementsManagement’s responsibility for compliance with legal and regulatory requirementsManagement is responsible for ensuring that the receipts, expenditure, investment of moneys and the acquisition and disposal of assets, are in accordance with the provisions of the Act. This responsibility includes implementing accounting and internal controls as management determines are necessary to enable compliance with the provisions of the Act.
Auditors’ responsibilityOur responsibility is to express an opinion on management’s compliance based on our audit of the financial statements. We conducted our audit in accordance with Singapore Standards on Auditing. We planned and performed the compliance audit to obtain reasonable assurance about whether the receipts, expenditure, investment of moneys and the acquisition and disposal of assets, are in accordance with the provisions of the Act.
Our compliance audit includes obtaining an understanding of the internal control relevant to the receipts, expenditure, investment of moneys and the acquisition and disposal of assets; and assessing the risks of material misstatement of the financial statements from non-compliance, if any, but not for the purpose of expressing an opinion on the effectiveness of the entity’s internal control. Because of the inherent limitations in any accounting and internal control system, non-compliances may nevertheless occur and not be detected.
We believe that the audit evidence we have obtained is sufficient and appropriate to provide a basis for our opinion on management’s compliance.
OpinionIn our opinion:(a) the receipts, expenditure, investment of moneys and acquisition and disposal of assets by the Authority during the
year are, in all material respects, in accordance with the provisions of the Act; and
(b) proper accounting and other records have been kept, including records of all assets of the Authority, whether purchased, donated or otherwise.
(c) the accounting and other records of those subsidiaries incorporated in Singapore of which we are the auditors have seem properly kept in accordance with the Singapore Companies Act, Chapter 50.
Kpmg llpPublic Accountants andCertified Public Accountants
singapore9 June 2013
AnnuAl RepoRt 2012/2013 19
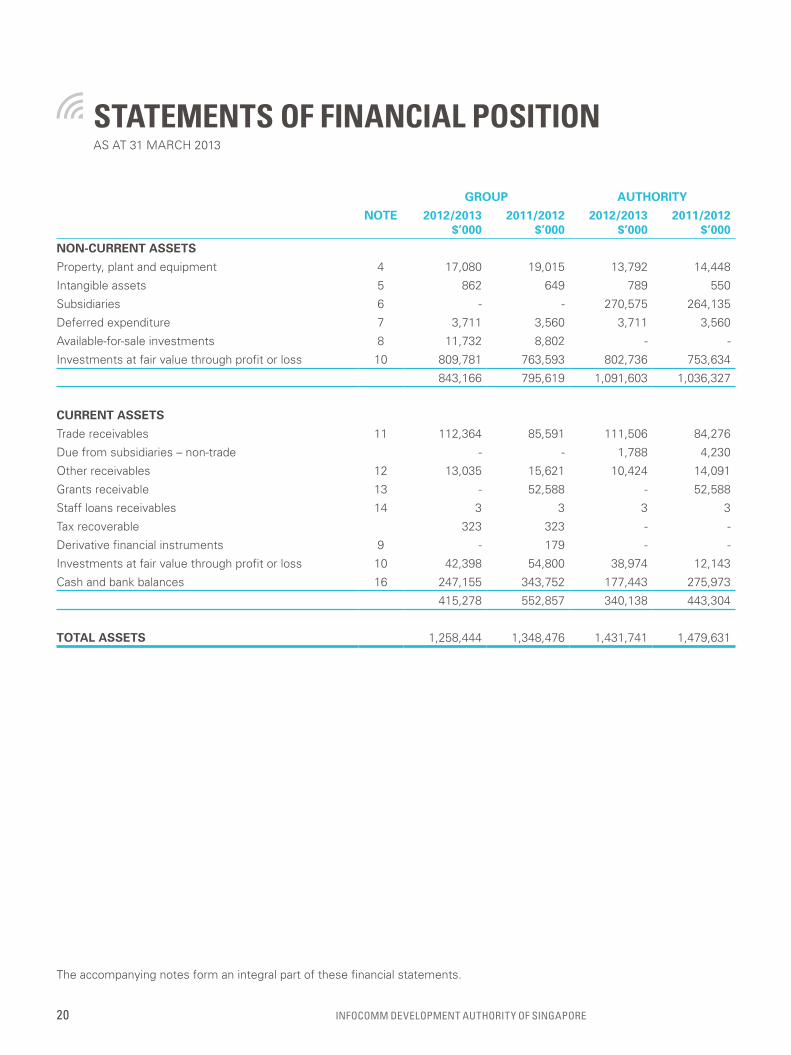
StatementS of fInanCIal poSItIonAS AT 31 MARCh 2013
group authorIty
note 2012/2013$’000
2011/2012$’000
2012/2013$’000
2011/2012$’000
non-current assets
property, plant and equipment 4 17,080 19,015 13,792 14,448
Intangible assets 5 862 649 789 550
Subsidiaries 6 - - 270,575 264,135
Deferred expenditure 7 3,711 3,560 3,711 3,560
Available-for-sale investments 8 11,732 8,802 - -
Investments at fair value through profit or loss 10 809,781 763,593 802,736 753,634
843,166 795,619 1,091,603 1,036,327
current assets
Trade receivables 11 112,364 85,591 111,506 84,276
Due from subsidiaries – non-trade - - 1,788 4,230
Other receivables 12 13,035 15,621 10,424 14,091
Grants receivable 13 - 52,588 - 52,588
Staff loans receivables 14 3 3 3 3
Tax recoverable 323 323 - -
Derivative financial instruments 9 - 179 - -
Investments at fair value through profit or loss 10 42,398 54,800 38,974 12,143
Cash and bank balances 16 247,155 343,752 177,443 275,973
415,278 552,857 340,138 443,304
total assets 1,258,444 1,348,476 1,431,741 1,479,631
The accompanying notes form an integral part of these financial statements.
Infocomm Development AuthorIty of SIngApore20
group authorIty
note 2012/2013$’000
2011/2012$’000
2012/2013$’000
2011/2012$’000
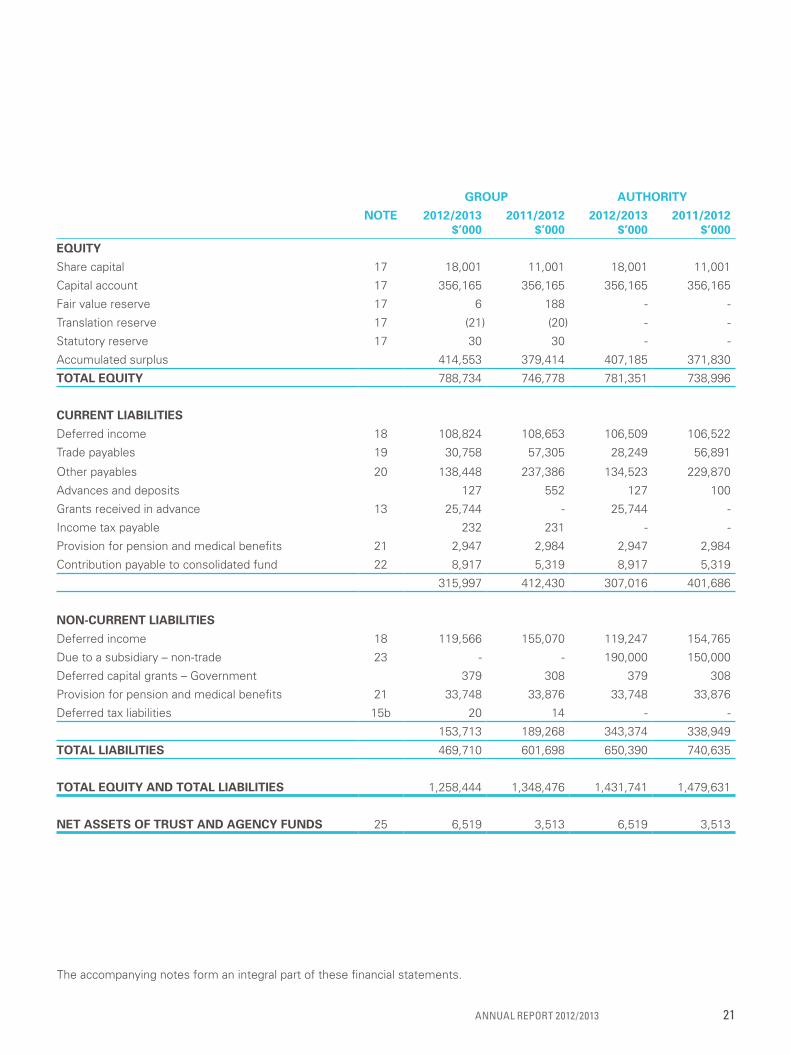
equIty
Share capital 17 18,001 11,001 18,001 11,001
Capital account 17 356,165 356,165 356,165 356,165
Fair value reserve 17 6 188 - -
Translation reserve 17 (21) (20) - -
Statutory reserve 17 30 30 - -
Accumulated surplus 414,553 379,414 407,185 371,830
total equIty 788,734 746,778 781,351 738,996
current lIabIlItIes
Deferred income 18 108,824 108,653 106,509 106,522
Trade payables 19 30,758 57,305 28,249 56,891
Other payables 20 138,448 237,386 134,523 229,870
Advances and deposits 127 552 127 100
Grants received in advance 13 25,744 - 25,744 -
Income tax payable 232 231 - -
provision for pension and medical benefits 21 2,947 2,984 2,947 2,984
Contribution payable to consolidated fund 22 8,917 5,319 8,917 5,319
315,997 412,430 307,016 401,686
non-current lIabIlItIes
Deferred income 18 119,566 155,070 119,247 154,765
Due to a subsidiary – non-trade 23 - - 190,000 150,000
Deferred capital grants – Government 379 308 379 308
provision for pension and medical benefits 21 33,748 33,876 33,748 33,876
Deferred tax liabilities 15b 20 14 - -
153,713 189,268 343,374 338,949
total lIabIlItIes 469,710 601,698 650,390 740,635
total equIty and total lIabIlItIes 1,258,444 1,348,476 1,431,741 1,479,631
net assets of trust and agency funds 25 6,519 3,513 6,519 3,513
The accompanying notes form an integral part of these financial statements.
AnnuAl RepoRt 2012/2013 21

StatementS of InCome and expendIture
group authorIty
note 2012/2013$’000
2011/2012$’000
2012/2013$’000
2011/2012$’000
Income
Service fees 192,755 190,978 182,126 180,372
Standard ICT service fees 226,941 163,300 226,941 163,300
licence and frequency fees 77,411 77,550 77,411 77,550
Interest income 26 18,495 12,712 18,137 12,252
positive fair value changes on investments at fair value through profit or loss 15,802 19,307 15,802 16,792
Gain on disposal of available-for-sale investments 2,183 2,820 - -
Gain on disposal of investments at fair value through profit or loss 18,409 3,152 18,249 -
Other income 27 8,357 10,748 9,263 12,472
Dividend income 672 1,037 2,777 577
Distributions from fund - 186 - -
total Income before developmentproject Income 561,025 481,790 550,706 463,315
Development project income 28 10,430 15,016 10,430 15,016
total Income 571,455 496,806 561,136 478,331
expendIture
Salaries, CpF and other contributions 29 230,743 196,574 220,505 186,254
professional services 34,299 35,881 29,115 32,969
Regulatory and promotion 3,872 5,843 1,888 2,417
Other expenses 30 17,172 15,794 15,237 13,248
Standard ICT charges 206,146 150,056 206,146 150,056
Rental expenses 39,698 17,681 39,418 17,540
Staff welfare and allowance 5,122 5,535 4,865 5,313
Repairs and maintenance 3,949 5,793 3,636 4,585
Overseas missions and meetings 3,785 3,760 2,776 2,682
Supplies and services 2,099 2,725 2,099 2,725
Staff training 5,396 4,994 5,352 4,984
Depreciation of property, plant and equipment 4 7,947 6,395 5,516 5,501
Amortisation of intangible assets 5 668 695 612 661
provision for pension and medical benefits 21 2,782 1,737 2,782 1,737
property, plant and equipment expensed off 426 610 426 610
Board members’ allowance 338 346 283 259
negative fair value changes on investmentsat fair value through profit or loss 614 - 146 -
Foreign currency exchange (gain) loss - net 53 51 21 46
Balance brought forward 565,109 454,470 540,823 431,587
YEAR EnDED 31 MARCh 2013
The accompanying notes form an integral part of these financial statements.
Infocomm Development AuthorIty of SIngApore22

group authorIty
note 2012/2013$’000
2011/2012$’000
2012/2013$’000
2011/2012$’000
Balance carried forward 565,109 454,470 540,823 431,587
Allowance for impairment on trade receivables 11 161 119 161 119
loss on disposal of property, plant and equipment 6 85 3 85
Impairment loss of available-for-sale investments - 1,230 - -
Impairment on investment in a subsidiary 6 - - 7,560 9,400
Impairment on infrastructure 4 - 1,726 - -
Interest expenses - - 3,367 667
total expenses beforedevelopment expenses 565,276 457,630 551,914 441,858
Development expenses 28 113,572 247,336 116,680 252,112
total expenses 678,848 704,966 668,594 693,970
defIcIt before government grants (107,393) (208,160) (107,458) (215,639)
government grants
Operating grants 70,677 37,154 70,677 37,154
Development grants 89,048 209,570 89,048 209,570
13 159,725 246,724 159,725 246,724
Deferred capital grants amortised 188 205 188 205
159,913 246,929 159,913 246,929
surplus before contrIbutIon to consolIdated fund and Income tax 52,520 38,769 52,455 31,290
Contribution to consolidated fund 22 (9,567) (8,070) (9,567) (8,070)
Income tax expense 15a (281) (275) - -
net surplus for the year 42,672 30,424 42,888 23,220
The accompanying notes form an integral part of these financial statements.
AnnuAl RepoRt 2012/2013 23

StatementS of ComprehenSIve InComeYEAR EnDED 31 MARCh 2013
group authorIty
2012/2013$’000
2011/2012$’000
2012/2013$’000
2011/2012$’000
net surplus for the year 42,672 30,424 42,888 23,220
other comprehensIve Income
net change in fair value of available-for-sale financial investments (182) (1,327) - -
net change in fair value of available-for-sale financial assets reclassified to profit or loss - (2,540) - -
Foreign currency translation differences –foreign operations (1) 3 - -
other comprehensIve loss for the year (183) (3,864) - -
total comprehensIve Income for the year 42,489 26,560 42,888 23,220
The accompanying notes form an integral part of these financial statements.
Infocomm Development AuthorIty of SIngApore24

Con
SolI
date
d St
atem
ent
of C
ha
nge
S In
eq
uIty
YE
AR
En
DE
D 3
1 M
AR
Ch
201
3 no
te
sh
ar
ec
ap
Ita
l$’
000
ca
pIt
al
ac
co
un
t$’
000
faIr
va
lue
re
se
rv
e$’
000
tr
an
sla
tIo
n
re
se
rv
e$’
000
sta
tu
to
ry
r
es
er
ve
$’00
0
ac
cu
mu
lat
ed
s
ur
plu
s$’
000
to
tal
$’00
0
gr
ou
p
At
1 A
pril
2011
1,00
135
6,16
54,
055
(23)
2135
4,98
771
6,20
6
to
tal
co
mp
re
he
ns
Ive
Inc
om
e
for
th
e y
ea
r
pro
fit f
or t
he y
ear
--
--
-30
,424
-
ot
he
r c
om
pr
eh
en
sIv
e In
co
me
net
cha
nge
in f
air
valu
e of
ava
ilabl
e-fo
r-sa
le fi
nanc
ial i
nves
tmen
ts-
-(1
,327
)-
--
(1,3
27)
net
cha
nge
in f
air
valu
e of
ava
ilabl
e-fo
r-sa
le fi
nanc
ial a
sset
s re
clas
sifie
d to
pr
ofit
or lo
ss-
-(2
,540
)-
--
(2,5
40)
Fore
ign
curr
ency
tra
nsla
tion
diff
eren
ce-
--
3-
-3
ot
he
r c
om
pr
eh
en
sIv
e In
co
me
fo
r t
he
ye
ar
--
(3,8
67)
3-
-(3
,864
)
to
tal
co
mp
re
he
ns
Ive
Inc
om
e
for
th
e y
ea
r-
-(3
,867
)3
-30
,424
26,5
60
tr
an
sa
ct
Ion
s w
Ith
ow
ne
rs
, r
ec
og
nIs
ed
dIr
ec
tly
In e
qu
Ity
co
nt
rIb
ut
Ion
s b
y a
nd
d
Ist
rIb
ut
Ion
s t
o o
wn
er
s
Issu
e of
sha
re c
apita
l17
10,0
00-
--
--
10,0
00
Div
iden
d pa
id f
or t
he y
ear
33-
--
--
(5,9
88)
(5,9
88)
to
tal
co
nt
rIb
ut
Ion
s b
y a
nd
d
Ist
rIb
ut
Ion
s t
o o
wn
er
s10
,000
--
--
(5,9
88)
4,01
2
Tran
sfer
to
stat
utor
y re
serv
e-
--
-9
(9)
-
At
31 M
arch
201
211
,001
356,
165
188
(20)
3037
9,41
474
6,77
8
The
acco
mpa
nyin
g no
tes
form
an
inte
gral
par
t of
the
se fi
nanc
ial s
tate
men
ts.
AnnuAl RepoRt 2012/2013 25

no
te
sh
ar
ec
ap
Ita
l$’
000
ca
pIt
al
ac
co
un
t$’
000
faIr
va
lue
re
se
rv
e$’
000
tr
an
sla
tIo
n
re
se
rv
e$’
000
sta
tu
to
ry
r
es
er
ve
$’00
0
ac
cu
mu
lat
ed
s
ur
plu
s$’
000
to
tal
$’00
0
gr
ou
p
At
1 A
pril
2012
11,0
0135
6,16
518
8(2
0)30
379,
414
746,
778
to
tal
co
mp
re
he
ns
Ive
Inc
om
e
for
th
e y
ea
r
pro
fit f
or t
he y
ear
--
--
-42
,672
42,6
72
ot
he
r c
om
pr
eh
en
sIv
e In
co
me
net
cha
nge
in f
air
valu
e of
ava
ilabl
e-fo
r-sa
le fi
nanc
ial i
nves
tmen
ts-
-(1
82)
--
-(1
82)
net
cha
nge
in f
air
valu
e of
ava
ilabl
e-fo
r-sa
le fi
nanc
ial a
sset
s re
clas
sifie
d to
pr
ofit
or lo
ss-
--
--
--
Fore
ign
curr
ency
tra
nsla
tion
diff
eren
ce-
--
(1)
--
(1)
ot
he
r c
om
pr
eh
en
sIv
e In
co
me
fo
r t
he
ye
ar
--
(182
)(1
)-
-(1
83)
to
tal
co
mp
re
he
ns
Ive
Inc
om
e
for
th
e y
ea
r-
-(1
82)
(1)
-42
,672
42,4
89
tr
an
sa
ct
Ion
s w
Ith
ow
ne
rs
, r
ec
og
nIs
ed
dIr
ec
tly
In e
qu
Ity
co
nt
rIb
ut
Ion
s b
y a
nd
d
Ist
rIb
ut
Ion
s t
o o
wn
er
s
Issu
e of
sha
re c
apita
l17
7,00
0-
--
--
7,00
0
Div
iden
d pa
id f
or t
he y
ear
33-
--
--
(7,5
33)
(7,5
33)
to
tal
co
nt
rIb
ut
Ion
s b
y a
nd
d
Ist
rIb
ut
Ion
s t
o o
wn
er
s7,
000
--
--
(7,5
33)
(533
)
At
31 M
arch
201
318
,001
356,
165
6(2
1)30
414,
553
788,
734
The
acco
mpa
nyin
g no
tes
form
an
inte
gral
par
t of
the
se fi
nanc
ial s
tate
men
ts.
Con
SolI
date
d St
atem
ent
of C
ha
nge
S In
eq
uIty
YE
AR
En
DE
D 3
1 M
AR
Ch
201
3
Infocomm Development AuthorIty of SIngApore26
The
acco
mpa
nyin
g no
tes
form
an
inte
gral
par
t of
the
se fi
nanc
ial s
tate
men
ts.
no
te
sh
ar
ec
ap
Ita
l$’
000
ca
pIt
al
ac
co
un
t$’
000
ac
cu
mu
lat
ed
s
ur
plu
s$’
000
to
tal
$’00
0
au
th
or
Ity
At
1 A
pril
2011
1,00
135
6,16
535
4,59
871
1,76
4
Tota
l sur
plus
and
com
preh
ensi
ve in
com
e fo
r th
e ye
ar-
-23
,220
23,2
20
Issu
e of
sha
re c
apita
l17
10,0
00-
-10
,000
Div
iden
d pa
id f
or t
he y
ear
33-
-(5
,988
)(5
,988
)
At
31 M
arch
201
211
,001
356,
165
371,
830
738,
996
At
1 A
pril
2012
11,0
0135
6,16
537
1,83
073
8,99
6
Tota
l sur
plus
and
com
preh
ensi
ve in
com
e fo
r th
e ye
ar-
-42
,888
42,8
88
Issu
e of
sha
re c
apita
l17
7,00
0-
-7,
000
Div
iden
d pa
id f
or t
he y
ear
33-
-(7
,533
)(7
,533
)
At
31 M
arch
201
318
,001
356,
165
407,
185
781,
351
Stat
emen
t of
Ch
an
geS
In e
quI
tyY
EA
R E
nD
ED
31
MA
RC
h 2
013
AnnuAl RepoRt 2012/2013 27
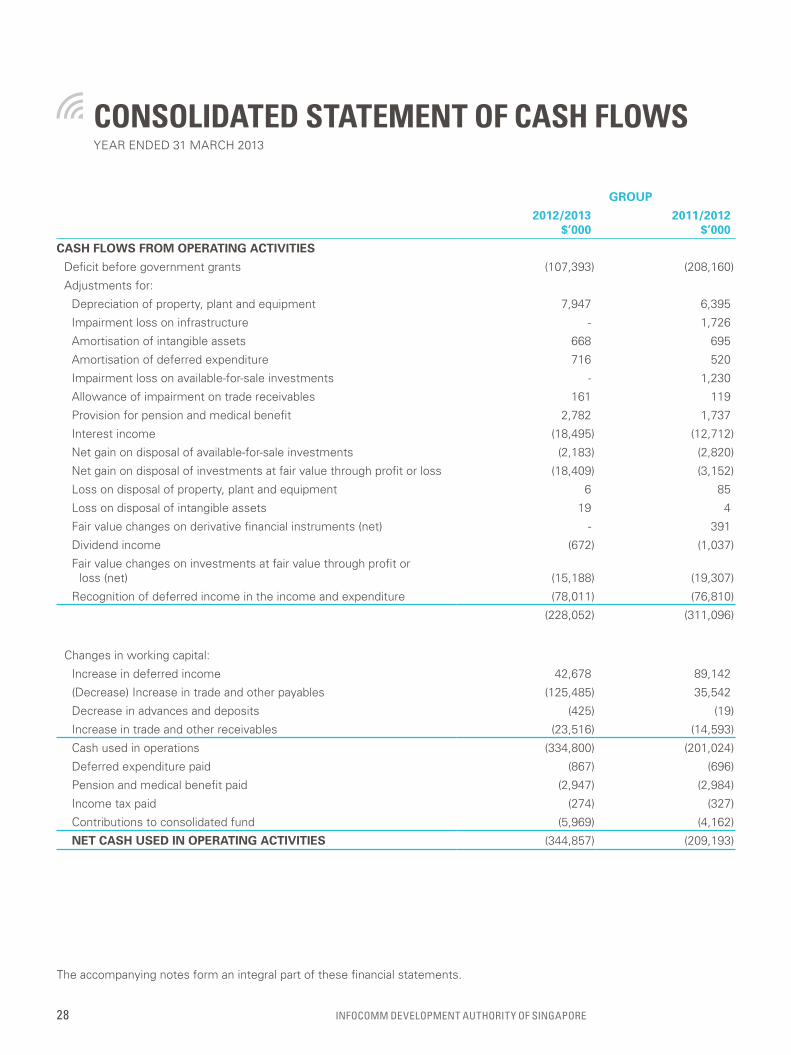
ConSolIdated Statement of CaSh flowS
group
2012/2013$’000
2011/2012$’000
cash flows from operatIng actIvItIes
Deficit before government grants (107,393) (208,160)
Adjustments for:
Depreciation of property, plant and equipment 7,947 6,395
Impairment loss on infrastructure - 1,726
Amortisation of intangible assets 668 695
Amortisation of deferred expenditure 716 520
Impairment loss on available-for-sale investments - 1,230
Allowance of impairment on trade receivables 161 119
provision for pension and medical benefit 2,782 1,737
Interest income (18,495) (12,712)
net gain on disposal of available-for-sale investments (2,183) (2,820)
net gain on disposal of investments at fair value through profit or loss (18,409) (3,152)
loss on disposal of property, plant and equipment 6 85
loss on disposal of intangible assets 19 4
Fair value changes on derivative financial instruments (net) - 391
Dividend income (672) (1,037)
Fair value changes on investments at fair value through profit orloss (net) (15,188) (19,307)
Recognition of deferred income in the income and expenditure (78,011) (76,810)
(228,052) (311,096)
Changes in working capital:
Increase in deferred income 42,678 89,142
(Decrease) Increase in trade and other payables (125,485) 35,542
Decrease in advances and deposits (425) (19)
Increase in trade and other receivables (23,516) (14,593)
Cash used in operations (334,800) (201,024)
Deferred expenditure paid (867) (696)
pension and medical benefit paid (2,947) (2,984)
Income tax paid (274) (327)
Contributions to consolidated fund (5,969) (4,162)
net cash used In operatIng actIvItIes (344,857) (209,193)
YEAR EnDED 31 MARCh 2013
The accompanying notes form an integral part of these financial statements.
Infocomm Development AuthorIty of SIngApore28

group
2012/2013$’000
2011/2012$’000
cash flows from InvestIng actIvItIes
net proceeds (payments) from sale and purchase of investments at fair value through profit or loss
(11) 49,282
Interest income received 18,010 4,145
Dividend income received 949 1,277
net proceeds (payments) from sale and purchase of available-for-sale investments (1,553) 3,223
proceeds on disposal of property, plant and equipment 30 394
purchase of intangible assets (657) (386)
purchase of property, plant and equipment (6,291) (18,614)
net cash from InvestIng actIvItIes 10,477 39,321
cash flows from fInancIng actIvItIes
Operating and development grants received 238,317 284,212
Decrease in cash earmarked for payment of pension and medical benefits 165 1,247
Decrease (Increase) in cash set aside for specific development project expenses 35,597 (65,381)
Issue of share capital 7,000 10,000
Dividends paid (7,533) (5,988)
net cash from fInancIng actIvItIes 273,546 224,090
net (decrease) Increase In cash and banK balances (60,834) 54,218
Cash and cash equivalents at the beginning of year 130,208 75,987
Effects of exchange rate changes on the balance of cash held in foreign currencies (1) 3
cash and banK balances at the end of year (note a) 69,373 130,208
note A
Cash and bank balances:
Cash with AGD 242,976 322,566
Cash at bank 1,525 3,369
Cash with external fund managers 2,654 17,817
247,155 343,752
less:
Cash earmarked for payment of pension and medical benefits (note 16) (36,695) (36,860)
Cash set aside for specific development project expenses (note 16) (141,087) (176,684)
69,373 130,208
The accompanying notes form an integral part of these financial statements.
AnnuAl RepoRt 2012/2013 29
noteS to the fInanCIal StatementS
1 domIcIle and actIvItIesInfo-communications Development Authority of Singapore (the “Authority”) is a statutory board established in Singapore on 1 December 1999 under the Info-communications Development Authority Act of Singapore Act, (Cap. 137A, 2000 Revised Edition).
As a statutory board, the Authority is subjected to the control of its supervisory ministry, Ministry of Communications and Information (“MCI”), and is required to follow the policies and instructions issued from time to time by MCI and other government ministries and departments such as the Ministry of Finance (“MOF”).
The Authority is domiciled in Singapore and has its registered office at 10 pasir panjang Road, #10-01, Mapletree Business City, Singapore 117438.
The principal activities of the Authority are:(a) to develop and promote the efficiency and international competitiveness of the info-communications industry
in Singapore;(b) to ensure that the telecommunication services are readily accessible and delivered competitively at
performance standards that meet the social, industrial and commercial needs of Singapore;(c) to exercise licensing and regulatory functions in respect of telecommunication systems and services in
Singapore;(d) to promote the use of the internet, broadband and electronic commerce and to establish regulatory frameworks
for that purpose;(e) to plan, promote, develop and implement information and communications technology systems and services
for government ministries, departments and agencies; and(f) to provide consultancy and advisory services concerning info-communications technology.
The consolidated financial statements of the Group as at and for the year ended 31 March 2013 comprise the Authority and its subsidiaries (together referred to as the “Group” and individually as the “Group entities”). The principal activities of the subsidiaries are as stated in note 6.
2 basIs of preparatIon2.1 statement of compliance
The financial statements have been prepared in accordance with the provision of the Info-communications Development Authority of Singapore Act (Cap. 137A, 2000 Revised Edition) and Statutory Board Financial Reporting Standards (“SB-FRS”), including Interpretations of SB-FRS (“InT SB-FRS”) and SB-FRS Guidance notes as promulgated by the Accountant-General.
2.2 basis of measurementThe financial statements have been presented on the historical cost basis except for certain financial assets and liabilities which are measured at fair value as stated in the respective accounting policies detailed below.
2.3 functional and presentation currencyThe financial statements are presented in Singapore dollars, which is the functional currency of the Authority. All financial information presented in Singapore dollars have been rounded to the nearest thousand, unless otherwise stated.
ThESE nOTES FORM An InTEGRAl pART OF ThE FInAnCIAl STATEMEnTS.ThE FInAnCIAl STATEMEnTS WERE AuThORISED FOR ISSuE BY ThE BOARD On 9 JunE 2013.
Infocomm Development AuthorIty of SIngApore30

2.4 use of estimates and judgementsThe preparation of financial statements in conformity with SB-FRS requires management to make judgements, estimates and assumptions that affect the application of accounting policies and reported amounts of assets, liabilities, income and expenses. Actual results may differ from these estimates.
Estimates and underlying assumptions are reviewed on an ongoing basis. Revisions to accounting estimates are recognised in the period in which the estimates are revised and in any future periods affected.
Information about critical judgments in applying accounting policies that have the most significant effect on the amounts recognised in the financial statements is as follows:
• Classification of available-for-sale investments and investments at fair value through profit or loss
The Group designated investments at fair value through profit or loss in the following circumstances:- The investments forms a part of a group of financial assets or financial instruments or both, which
is managed and its performance is evaluated on a fair value basis, in accordance with the Group’s documented risk management or investment strategy, and information about the grouping is provided internally on that basis;
- The designation eliminated or significantly reduced an accounting mismatch, which would otherwise have arisen; or
- The asset contained an embedded derivative that significantly modified the cash flows that would otherwise have been required to be bifurcated. Where the embedded derivatives are not capable of being measured separately from the host contracts, either at inception or at subsequent reporting periods, the entire contract is designated as investments at fair value through profit or loss.
The Group designated available-for-sale investments in the following circumstances:- long term investments in companies that are involved in start up activities in the information and
communication technologies sectors with an expected investment period of 3 – 5 years; and- Any other investment that is not designated as investments at fair value through profit or loss or loans
and receivables.
• Impairment of available-for-sale investmentsThe Group follows the guidance of SB-FRS 39 in determining when an available-for-sale investment is impaired as opposed to a temporary aberration. This determination process requires the exercising of significant judgement and the use of estimates by management. The Group evaluates, among other factors, the duration or the extent to which the fair value of an investment falls short of its carrying amount; the financial health and near term business outlook of the investee entity, including factors such as changes in technology, overall industry and sector performance; as well as operational and financial cash flows historically generated and forecasted to be generated by the investee entity.
Management regularly monitors these investments for indicators of impairment, including deteriorating financial performance, disorderly change in top management, key product failure, loss of major customers and other adverse news and reports on the investee entities. Management exercises judgement to determine whether impairment has set in based on all relevant information available, and where accessible, interviews conducted with management team of the investee entities. If the impairment is determined to have set in, the quantum of impairment loss is estimated based on internal guidelines.
AnnuAl RepoRt 2012/2013 31
• Service feesThe Group applies judgment and consideration of all relevant facts and circumstances in determining whether the Group is acting as a principal or as an agent in any revenue generating arrangement. The Group would be determined to be acting as a principal when the Group have risks and rewards associated with rendering of services.
• OneKey security devicesIn order to achieve pervasive adoption of strong authentication by public facing online services, OneKey security devices will be distributed free to all Singaporeans and permanent Residents within the first five years of the roll-out of the national Authentication Framework (“nAF”) programme. In making this judgement, management has assessed that these devices will be expensed off upon purchase as it reflects the underlying economic substance at the current implementation phase of the nAF project.
Information about assumptions and estimation uncertainties that have a significant risk of resulting in a material adjustment within the next financial year are included in the following notes:
• Impairment loss on property, plant and equipmentThe Group assesses the carrying amounts of its property, plant and equipment against their recoverable amounts at each reporting date to determine whether there is any indication of impairment.
Estimates of recoverable amounts were based on the higher of calculated value-in-use and fair value less cost to sell as determined by an independent professional valuer. The fair value are based on estimated amounts obtainable for the sale of the asset on an arm’s length transaction between knowledgeable, willing parties, less the cost of disposal, utilising an open market value and replacement costs basis for separately identifiable components of the asset.
Indications of impairment could appear and the recoverable amounts could change significantly as a result of changes in market conditions and the assumptions used in determining the fair values.
• Impairment loss on subsidiariesManagement reviews the carrying amounts of the investment in subsidiaries at each reporting date to determine whether there is any indication of impairment. If such indication exists, the recoverable amount is estimated.
Estimates of recoverable amounts were based on the higher of calculated value-in-use and fair value less cost to sell. In assessing value-in-use, management need to estimate the future cash flows expected from the cash-generating units and an appropriate discount rate to calculate the present value of future cash flows.
Differences between the actual performance of the subsidiaries and management’s annual impairment review would affect the results of the period in which such differences are determined. An increase in impairment losses would increase impairment on investment in a subsidiary expense and decrease non-current assets.
• Valuation of investmentsThe determination of fair value for financial assets and financial liabilities for which there is no observable market price requires the use of valuation techniques as described in note 24. For financial instruments that trade infrequently and have little price transparency, fair value is less objective and requires varying degrees of judgement depending on liquidity, concentration, uncertainty of market factors, pricing assumptions and other risks affecting the specific instrument.
noteS to the fInanCIal StatementS
Infocomm Development AuthorIty of SIngApore32

• Provision for medical and pension benefitsprovision for medical and pension benefits is estimated by management based on the most recent valuation by professional actuaries. Changes to assumptions and estimates used in the valuation would result in change to the provision for medical and pension benefits amounts estimated.
• Utilisation of tax lossesCertain subsidiaries of the Company have unused tax losses at the end of the reporting period. utilisation of such losses is subjected to the agreement of the Inland Revenue Authority of Singapore and the retention of majority shareholders as defined. These subsidiaries have not recognised any deferred tax benefits in respect of such tax losses which may be available for offsetting against profits due to the unpredictability of future profit streams.
• Long-term service contractsRevenue and profit recognition on long-term service contracts are dependent on estimating the eventual outcome of the contracts, as well as work done to date. Actual outcome in terms of total costs or revenue may be higher or lower than estimated at the reporting date, which would affect the revenue and profit recognised in future years. As at the reporting date, the management considered that all costs to complete and revenue can be reliably estimated.
3 sIgnIfIcant accountIng polIcIesThe Group has adopted all the new and revised SB-FRSs, InT SB-FRSs and Guidance notes which became effective during the year. The initial adoption of these SB-FRs, InT SB-FRSs and Guidance notes did not have a material impact on these financial statements.
The accounting policies set out below have been applied consistently to all periods presented in these financial statements, and have been applied consistently by Group entities.
3.1 basis of consolidation(i) Subsidiaries
Subsidiaries are entities controlled by the Group. Control exists when the Authority has power to govern the financial and operating policies of an entity so as to obtain benefits from it activities. The financial statements of subsidiaries are included in the consolidated financial statements from the date that control commences until the date that control ceases. The accounting policies of subsidiaries have been changed when necessary to align them with the policies adopted by the Group.
(ii) Transactions eliminated on consolidationIntra-group balances and transactions, and any unrealised income and expense arising from intra-group transactions, are eliminated in preparing the consolidated financial statements.
(iii) Subsidiaries in the separate financial statementsInvestment in subsidiaries is stated in the Authority’s statement of financial position at cost less accumulated impairment losses.
AnnuAl RepoRt 2012/2013 33
3.2 foreign currency(i) Foreign currency transactions
Transactions in foreign currencies are translated to the respective functional currencies of Group entities at exchange rates at the dates of the transactions. Monetary assets and liabilities denominated in foreign currencies at the end of the reporting period are retranslated to the functional currency at the exchange rate at that date. The foreign currency gain or loss on monetary items is the difference between amortised cost in the functional currency at the beginning of the year, adjusted for effective interest and payments during the year, and the amortised cost in foreign currency translated at the exchange rate at the end of the year.
non-monetary assets and liabilities denominated in foreign currencies that are measured at fair value are retranslated to the functional currency at the exchange rate at the date that the fair value was determined. non-monetary items in a foreign currency that are measured in terms of historical cost are translated using the exchange rate at the date of the transaction. Foreign currency differences arising on retranslation are recognised in profit or loss, except for the following differences which are recognised in other comprehensive income arising on the retranslation of available-for-sale equity instruments (except on impairment in which case foreign currency differences that have been recognised in other comprehensive income are reclassified to profit or loss).
(ii) Foreign operationsThe assets and liabilities of foreign operations are translated to Singapore dollars at exchange rates at the end of the reporting period. The income and expenses of foreign operations are translated to Singapore dollars at exchange rates at the dates of the transactions.
Foreign currency differences are recognised in other comprehensive income, and presented in the foreign currency translation reserve (translation reserve) in equity. When a foreign operation is disposed of such that control, significant influence or joint control is lost, the cumulative amount in the translation reserve related to that foreign operation is reclassified to profit or loss as part of the gain or loss on disposal. When the Group disposes of only part of its interest in a subsidiary that includes a foreign operation while retaining control, the relevant proportion of the cumulative amount is reattributed to non-controlling interests.
When the settlement of a monetary item receivable from or payable to a foreign operation is neither planned nor likely to occur in the foreseeable future, foreign exchange gains and losses arising from such a monetary item that are considered to form part of a net investment in a foreign operation are recognised in other comprehensive income, and are presented in the translation reserve in equity.
3.3 property, plant and equipment(i) Recognition and measurement
Items of property, plant and equipment are measured at cost less accumulated depreciation and any accumulated impairment losses.
Cost includes expenditure that is directly attributable to the acquisition of the asset. The cost of self-constructed assets includes: the cost of materials and direct labour; any other costs directly attributable to bringing the assets to a working condition for their intended use; when the Group has an obligation to remove the asset or restore the site, an estimate of the costs of dismantling and removing the items and restoring the site on which they are located; and capitalised borrowing costs.
noteS to the fInanCIal StatementS
Infocomm Development AuthorIty of SIngApore34
purchased software that is integral to the functionality of the related equipment is capitalised as part of that equipment.
When parts of an item of property, plant and equipment have different useful lives, they are accounted for as separate items (major components) of property, plant and equipment.
The gain or loss on disposal of an item of property, plant and equipment is determined by comparing the proceeds from disposal with the carrying amount of property, plant and equipment, and is recognised net in profit or loss.
(ii) Subsequent costsThe cost of replacing a component of an item of property, plant and equipment is recognised in the carrying amount of the item if it is probable that the future economic benefits embodied within the component will flow to the Group, and its cost can be measured reliably. The carrying amount of the replaced component is derecognised. The costs of the day-to-day servicing of property, plant and equipment are recognised in profit or loss as incurred.
(iii) DepreciationDepreciation is based on the cost of an asset less its residual value. Significant components of individual assets are assessed and if a component has a useful life that is different from the remainder of that asset, that component is depreciated separately.
Depreciation is recognised as an expense in profit or loss on a straight-line basis over the estimated useful lives of each component of an item of property, plant and equipment, unless it is included in the carrying amount of another asset.
Depreciation is recognised from the date that the property, plant and equipment are installed and are ready for use, or in respect of internally constructed assets, from the date that the asset is completed and ready for use.
The estimated useful lives for the current and comparative years are as follows:Infrastructure 3 yearsEquipment 3 to 5 yearsFurniture and fittings 10 yearsplant and machinery 5 to 7 yearsBuildings 50 years
Depreciation methods, useful lives and residual values are reviewed at the end of each reporting period and adjusted if appropriate.
Assets below $2,000 are expensed off in the year of purchase.
AnnuAl RepoRt 2012/2013 35
3.4 Intangible assetsIntangible assets that are acquired by the Group and have finite useful lives are measured at cost less accumulated amortisation and accumulated impairment losses.
Subsequent expenditure is capitalised only when it increases the future economic benefits embodied in the specific asset to which it relates. All other expenditure is recognised in profit or loss as incurred.
Amortisation is calculated based on the cost of the asset, less its residual value. Amortisation is recognised in profit or loss on a straight-line basis over the estimated useful lives of intangible assets from the date that they are available for use.
The estimated useful lives for the current and comparative years are as follows:Application software 3 years
Amortisation methods, useful lives and residual values are reviewed at the end of each reporting period and adjusted if appropriate.
Application software below $10,000 is expensed off in the year of purchase.
3.5 deferred expenditure Expenditure incurred in providing scholarships is capitalised and stated at cost less accumulated amortisation. Amortisation is calculated on a straight-line basis to write off the cost over the period of the scholarship bond from 4 to 6 years commencing from the year that the scholars commence employment with the Group.
3.6 government grants and contribution received Government grants and contributions from other organisations are recognised initially at their fair value where there is reasonable assurance that the grants and contributions will be received and the Group will comply with the conditions associated with the grants and contributions.
(i) Operating grantsGovernment grants and contributions from other organisations that compensate the Group for expenses incurred are recognised in profit or loss on a systematic basis in the same periods in which the expenses are recognised.
(ii) Development grantsGovernment grants and contributions from other organisations for specific development project expenditure are recognised as grants received in advance on the statement of financial position, upon receipt and are recognised in profit or loss on a systematic basis in the same periods in which the development expenses are recognised.
(iii) Capital grantsCapital grants are recognised in profit or loss on a systematic basis over the useful life of the asset. Government grants and contributions from other organisations utilised for the purchase of depreciable assets are initially recorded as “deferred capital grants” on the statement of financial position of the Group. Deferred capital grants are then recognised in the statement of income and expenditure over the periods necessary to match the depreciation of the assets purchased, with the related grants. upon the disposal of the asset, the balance of the related deferred capital grants is recognised in the statement of income and expenditure to match the net book value of the assets written off.
noteS to the fInanCIal StatementS
Infocomm Development AuthorIty of SIngApore36
3.7 financial instruments (i) non-derivative financial assets
The Group initially recognises loans and receivables and deposits on the date that they are originated. All other financial assets (including assets designated at fair value through profit or loss) are recognised initially on the trade date, which is the date that the Group becomes a party to the contractual provisions of the instrument.
The Group derecognises a financial asset when the contractual rights to the cash flows from the asset expire, or it transfers the rights to receive the contractual cash flows on the financial asset in a transaction in which substantially all the risks and rewards of ownership of the financial asset are transferred. Any interest in transferred financial assets that is created or retained by the Group is recognised as a separate asset or liability.
Financial assets and liabilities are offset and the net amount presented in the statement of financial position when, and only when, the Group has a legal right to offset the amounts and intends either to settle on a net basis or to realise the asset and settle the liability simultaneously.
The Group classifies non-derivative financial assets into the following categories: financial assets at fair value through profit or loss, loans and receivables and available-for-sale financial assets.
Financial assets at fair value through profit or lossA financial asset is classified at fair value through profit or loss if it is classified as held for trading or is designated as such upon initial recognition. Financial assets are designated at fair value through profit or loss if the Group manages and evaluates the performance of the assets on fair value basis in accordance with the Group’s documented risk management or investment strategy. Attributable transaction costs are recognised in profit or loss as incurred. Financial assets at fair value through profit or loss are measured at fair value, and changes therein, which takes into account any dividend income, are recognised in profit or loss.
Financial assets designated at fair value through profit or loss comprise equity and debt securities that otherwise would have been classified as available for sale.
Loans and receivablesloans and receivables are financial assets with fixed or determinable payments that are not quoted in an active market. Such assets are recognised initially at fair value plus any directly attributable transaction costs. Subsequent to initial recognition, loans and receivables are measured at amortised cost using the effective interest method, less any impairment losses.
loans and receivables comprise cash and bank balances, trade receivables, due from subsidiaries (non-trade), other receivables, grants receivables and staff loans receivables. Cash and bank balances comprised cash held with Accountant General’s Department (“AGD”), cash held with external fund managers, cash on hand and short-term deposits with maturities of three months or less that are subject to an insignificant risk of changes in their fair value. For the purpose of the statement of cash flows, cash and bank balances earmarked for payment of pension and medical benefits to pensioners are excluded.
AnnuAl RepoRt 2012/2013 37
Available-for-sale financial assetsAvailable-for-sale financial assets are non-derivative financial assets that are designated as available for sale or are not classified in any of the above categories of financial assets.
Available-for-sale financial assets are recognised initially at fair value plus any directly attributable transaction costs. Subsequent to initial recognition, they are measured at fair value and changes therein, other than impairment losses and foreign currency differences on available-for-sale debt instruments, are recognised in other comprehensive income and presented in the fair value reserve in equity. When an investment is derecognised, the gain or loss accumulated in equity is reclassified to profit or loss.
Investments in equity instruments that do not have a quoted market price in an active market and whose fair value cannot be reliably measured and derivatives that are linked to and must be settled by delivery of such unquoted equity instruments are measured at cost.
Available-for-sale financial assets comprise equity securities and fund investments.
(ii) non-derivative financial liabilitiesFinancial liabilities (including liabilities designated at fair value through profit or loss) are recognised initially on the trade date, which is the date that the Group becomes a party to the contractual provisions of the instrument.
The Group derecognises a financial liability when its contractual obligations are discharged, cancelled or expire.
Financial assets and liabilities are offset and the net amount presented in the statement of financial position when, and only when, the Group has a legal right to offset the amounts and intends either to settle on a net basis or to realise the asset and settle the liability simultaneously.
The Group classifies non-derivative financial liabilities into the other financial liabilities category. Such financial liabilities are recognised initially at fair value plus any directly attributable transaction costs. Subsequent to initial recognition, these financial liabilities are measured at amortised cost using the effective interest method.
Other financial liabilities comprise trade payables, other payables, advances and deposits, amount to subsidiaries (non-trade), grants received in advance and contribution payable to consolidated fund.
(iii) Share capitalShares are classified as equity. Incremental costs directly attributable to the issue of shares are recognised as a deduction from equity, net of tax effects.
(iv) Derivative financial instrumentsThe Group enters into credit derivative swaps and other derivative financial instruments, when deemed necessary, to manage its exposure to credit risk and other risks.
Embedded derivatives are separate from the host contract and accounted for separately if the economic characteristics and risk of the host contract and the embedded derivative are not closely related, a separate instrument with the same terms as the embedded derivative would meet the definition of a derivative, and the combined instrument is not measured at fair value through profit or loss.
noteS to the fInanCIal StatementS
Infocomm Development AuthorIty of SIngApore38

In cases where the embedded derivative cannot be separated from its host contract because the Group is unable to measure the embedded derivate separately either at acquisition or at a subsequent financial reporting date, it shall designate the entire hybrid (combined) contract as at fair value through profit or loss.
Derivatives are recognised initially at fair value; attributable transaction costs are recognised in profit or loss as incurred. Subsequent to initial recognition, derivatives are measured at fair value, and changes therein are accounted for as described below.
Separable embedded derivativesChanges in the fair value of separated embedded derivatives are recognised immediately in profit or loss.
Other non-trading derivativesWhen a derivative financial instrument is not designated in a hedge relationship that qualifies for hedge accounting, all changes in its fair value are recognised immediately in profit or loss.
3.8 Impairment (i) non-derivative financial assets
A financial asset not carried at fair value through profit or loss is assessed at the end of each reporting period to determine whether there is objective evidence that it is impaired. A financial asset is impaired if objective evidence indicates that a loss event has occurred after the initial recognition of the asset, and that the loss event has a negative effect on the estimated future cash flows of that asset that can be estimated reliably.
Objective evidence that financial assets (including equity securities) are impaired can include default or delinquency by a debtor, restructuring of an amount due to the Group on terms that the Group would not consider otherwise, indications that a debtor or issuer will enter bankruptcy, adverse changes in the payment status of borrowers or issuers in the group, economic conditions that correlate with defaults or the disappearance of an active market for a security. In addition, for an investment in an equity security, a significant or prolonged decline in its fair value below its cost is objective evidence of impairment.
Loans and receivablesThe Group considers evidence of impairment for loans and receivables at both a specific asset and collective level. All individually significant loans and receivables are assessed for specific impairment. All individually significant receivables found not to be specifically impaired are then collectively assessed for any impairment that has been incurred but not yet identified. loans and receivables that are not individually significant are collectively assessed for impairment by grouping together loans and receivables with similar risk characteristics.
In assessing collective impairment, the Group uses historical trends of the probability of default, the timing of recoveries and the amount of loss incurred, adjusted for management’s judgement as to whether current economic and credit conditions are such that the actual losses are likely to be greater or less than suggested by historical trends.
An impairment loss in respect of a financial asset measured at amortised cost is calculated as the difference between its carrying amount and the present value of the estimated future cash flows, discounted at the asset’s original effective interest rate. losses are recognised in profit or loss and reflected in an allowance account against loans and receivables. Interest on the impaired asset continues to be recognised. When a subsequent event (e.g. repayment by a debtor) causes the amount of impairment loss to decrease, the decrease in impairment loss is reversed through profit or loss.
AnnuAl RepoRt 2012/2013 39
Available-for-sale financial assetsImpairment losses on available-for-sale financial assets are recognised by reclassifying the losses accumulated in the fair value reserve in equity to profit or loss. The cumulative loss that is reclassified from equity to profit or loss is the difference between the acquisition cost, net of any principal repayment and amortisation, and the current fair value, less any impairment loss recognised previously in profit or loss. Changes in cumulative impairment provisions attributable to application of the effective interest method are reflected as a component of interest income. If, in a subsequent period, the fair value of an impaired available-for-sale debt security increases and the increase can be related objectively to an event occurring after the impairment loss was recognised, then the impairment loss is reversed. The amount of the reversal is recognised in profit or loss. however, any subsequent recovery in the fair value of an impaired available-for-sale equity security is recognised in other comprehensive income.
(ii) non-financial assetsThe carrying amounts of the Group’s non-financial assets are reviewed at each reporting date to determine whether there is any indication of impairment. If any such indication exists, then the asset’s recoverable amount is estimated. An impairment loss is recognised if the carrying amount of an asset or its related cash-generating unit (CGu) exceeds its estimated recoverable amount.
The recoverable amount of an asset or CGu is the greater of its value in use and its fair value less costs to sell. In assessing value in use, the estimated future cash flows are discounted to their present value using a pre-tax discount rate that reflects current market assessments of the time value of money and the risks specific to the asset or CGu. For the purpose of impairment testing, assets that cannot be tested individually are grouped together into the smallest group of assets that generates cash inflows from continuing use that are largely independent of the cash inflows of other assets or CGus.
Impairment losses are recognised in profit or loss. Impairment losses recognised in respect of CGus are allocated to reduce the carrying amounts of the other assets in the CGu (group of CGus) on a pro rata basis.
Impairment losses recognised in prior periods are assessed at each reporting date for any indications that the loss has decreased or no longer exists. An impairment loss is reversed if there has been a change in the estimates used to determine the recoverable amount. An impairment loss is reversed only to the extent that the asset’s carrying amount does not exceed the carrying amount that would have been determined, net of depreciation or amortisation, if no impairment loss had been recognised.
3.9 provisions A provision is recognised if, as a result of a past event, the Group has a present legal or constructive obligation that can be estimated reliably, and it is probable that an outflow of economic benefits will be required to settle the obligation. provisions are determined by discounting the expected future cash flows at a pre-tax rate that reflects current market assessments of the time value of money and the risks specific to the liability. The unwinding of the discount is recognised as interest expense.
A provision for onerous contracts is recognised when the expected benefits to be derived by the Group from a contract are lower than the unavoidable cost of meeting the obligations under the contract. The provision is measured at the present value of the lower of the expected cost of terminating the contract and the expected net cost of continuing with the contract. Before a provision is established, the Group recognises any impairment loss on the assets associated with the contract.
noteS to the fInanCIal StatementS
Infocomm Development AuthorIty of SIngApore40
3.10 employee benefits (i) Defined contribution plans
A defined contribution plan is a post-employment benefit plan under which an entity pays fixed contributions into a separate entity and will have no legal or constructive obligation to pay further amounts. Obligations for contributions to defined contribution pension plans are recognised as an employee benefit expense in profit or loss in the periods during which related services are rendered by employees.
(ii) Defined benefit plansA defined benefit plan is a post-employment benefit plan other than a defined contribution plan. The Group’s net obligation in respect of defined benefit pension plans is calculated separately for each plan by estimating future benefit that the employees have earned in return for their service in the current and prior periods; that benefit is discounted to determine its present value. Any unrecognised past service costs and the fair value of any plan assets are deducted. The discount rate is the yield of a government bond rate that have maturity dates approximating the terms of the Group’s obligations and that are denominated in the same currency in which the benefits are expected to be paid.
The calculation is performed annually by a qualified actuary using the projected unit credit method. under the method, a “projected accrued benefit” is calculated for each benefit. For all active members of the scheme, the “projected accrual benefit” is based on the scheme’s accrual formula and upon service as of the valuation date, but using the employee’s scheme salary, projected to the age at which the employee is assumed to leave active service. For inactive members, it is the total benefit. The defined benefit obligation/project benefit obligation/plan liability is the discounted present value of the “projected accrued benefits”. The service cost is the corresponding value of benefits earned by active members over the year as a result of one more year of service.
The Group recognises all actuarial gains and losses arising from defined benefit plans immediately in other comprehensive income and all expenses related to defined benefit plans in employee benefits expense in profit or loss.
(iii) Termination benefitsTermination benefits are recognised as an expense when the Group is committed demonstrably, without realistic possibility of withdrawal, to a formal detailed plan to either terminate employment before the normal retirement date, or to provide termination benefits as a result of an offer made to encourage voluntary redundancy. Termination benefits for voluntary redundancies are recognised as an expense if the Group has made an offer of voluntary redundancy, it is probable that the offer will be accepted, and the number of acceptances can be estimated reliably. If benefits are payable more than 12 months after the reporting date, then they are discounted to their present value.
(iv) Short-term employee benefitsShort-term employee benefit obligations are measured on an undiscounted basis and are expensed when the related service is provided. A liability is recognised for the amount expected to be paid under short-term cash bonus if the Group has a present legal or constructive obligation to pay this amount as a result of past service provided by the employee, and the obligation can be estimated reliably.
AnnuAl RepoRt 2012/2013 41
3.11 trust and agency funds Moneys received from the Government and other organisations where the Authority is not the owner and beneficiary are accounted for as trust and agency funds. The receipts and expenditure in respect of agency funds are taken directly to the funds accounts and the net assets relating to these funds are shown as a separate line item on the statement of financial position. Trust and agency funds are accounted for on an accrual basis.
3.12 Income Income is recognised to the extent that it is probable that the economic benefits will flow to the Group and the income can be reliably measured. Income is measured at the fair value of the consideration received or receivable, net of returns, trade discounts and volume rebates.
(i) Service feesService fees are recognised in the period when the services are rendered to customers, net of goods and service tax.
(ii) licence and frequency feeslicence and frequency fees are recognised on the accrual basis over the validity period, except for certain types of fees that are recognised in the year in which they are received, net of goods and services tax.
(iii) long-term service contractsContract revenue includes the initial amount agreed in the contract plus any variations in contract work, claims and incentive payments, to the extent that it is probable that they will result in revenue and can be measured reliably. As soon as the outcome can be estimated reliably, contract revenue is recognised in income and expenditure in proportion to the stage of completion of the contract. Contract expenses are recognised as incurred unless they create an asset related to future contract activity.
The stage of completion is measured by the proportion of direct labour costs incurred for work performed to date relative to the estimated total direct labour costs. Where the outcome of a contract cannot be estimated reliably, contract revenue is recognised to the extent of contract costs incurred that is probable will be recoverable. An expected loss on a contract is recognised immediately in profit or loss.
When contract costs incurred to date plus recognised profits less recognised losses exceed gross billings, the surplus representing amounts due from customer is included in other receivables.
(iv) Dividend incomeDividend income is recognised in statement of income and expenditure on the date that the Group’s right to receive payment is established, which in the case of quoted securities is normally the ex-dividend date.
(v) Development project incomeDevelopment income is recognised in statement of income and expenditure on a systematic basis in the same periods in which the development expense is recognised.
(vi) Interest incomeInterest income is recognised as it accrues in statement of income and expenditure, using the effective interest method.
noteS to the fInanCIal StatementS
Infocomm Development AuthorIty of SIngApore42
3.13 Interest expenses Borrowing costs that are not directly attributable to the acquisition, construction or production of a qualifying asset are recognised in statement of income and expenditure using the effective interest method.
3.14 leases
Operating lease
When entities within the Group are lessees of an operating leaseWhere the Group has the use of assets under operating leases, payments made under the leases are recognised in the statement of comprehensive income on a straight-line basis over the term of the lease. lease incentives received are recognised in the statement of comprehensive income as an integral part of the total lease payments made. leased assets are not recognised in the Group’s statement of financial position.
Determining whether an arrangement contains a leaseAt inception of an arrangement, the Group determines whether such an arrangement is or contains a lease. A specific asset is the subject of a lease if fulfilment of the arrangement is dependent on the use of that specified asset. An arrangement conveys the right to use the asset if the arrangement conveys to the Group the right to control the use of the underlying asset. At inception or upon reassessment of the arrangement, the Group separates payments and other consideration required by such an arrangement into those for the lease and those for other elements on the basis of their relative fair values. If the Group concludes for a finance lease that it is impracticable to separate the payments reliably, then an asset and a liability are recognised at an amount equal to the fair value of the underlying asset. Subsequently, the liability is reduced as payments are made and an imputed finance charge on the liability is recognised using the Group’s incremental borrowing rate.
AnnuAl RepoRt 2012/2013 43
noteS to the fInanCIal StatementS
3.15 tax The Authority is a tax-exempted institution under the provisions of the Income Tax Act (Cap.134, 2004 Revised Edition). The subsidiaries of the Authority are subject to local income tax regulation.
Tax expense comprises current and deferred tax. Current tax and deferred tax is recognised in statement of income and expenditure except to the extent that it relates to a business combination, or items recognised directly in equity or in other comprehensive income.
Current tax is the expected tax payable or receivable on the taxable income or loss for the year, using tax rates enacted or substantively enacted at the reporting date, and any adjustment to tax payable in respect of previous years.
Deferred tax is recognised in respect of temporary differences between the carrying amounts of assets and liabilities for financial reporting purposes and the amounts used for taxation purposes. Deferred tax is not recognised for: temporary differences on the initial recognition of assets or liabilities in a transaction that is not a business combination and that affects neither accounting nor taxable profit or loss; and temporary differences related to investments in subsidiaries to the extent that the Group is able to control the timing of the reversal of the temporary difference and it is probable that they will not reverse in the foreseeable future.
The measurement of deferred taxes reflects the tax consequences that would follow the manner in which the Group expects, at the end of the reporting period, to recover or settle the carrying amount of its assets and liabilities. Deferred tax is measured at the tax rates that are expected to be applied to temporary differences when they reverse, based on the laws that have been enacted or substantively enacted by the reporting date.
Deferred tax assets and liabilities are offset if there is a legally enforceable right to offset current tax liabilities and assets, and they relate to taxes levied by the same tax authority on the same taxable entity, or on different tax entities, but they intend to settle current tax liabilities and assets on a net basis or their tax assets and liabilities will be realised simultaneously.
A deferred tax asset is recognised for unused tax losses, tax credits and deductible temporary differences, to the extent that it is probable that future taxable profits will be available against which they can be utilised. Deferred tax assets are reviewed at each reporting date and are reduced to the extent that it is no longer probable that the related tax benefit will be realised.
In determining the amount of current and deferred tax, the Group takes into account the impact of uncertain tax positions and whether additional taxes and interest may be due. The Group believes that its accruals for tax liabilities are adequate for all open tax years based on its assessment of many factors, including interpretations of tax law and prior experience. This assessment relies on estimates and assumptions and may involve a series of judgements about future events. new information may become available that causes the Group to change its judgement regarding the adequacy of existing tax liabilities; such changes to tax liabilities will impact tax expense in the period that such a determination is made.
3.16 new standards and interpretations not adopted A number of new standards, amendments to standards and interpretations are effective for annual periods beginning 1 January 2013, and have not been applied in preparing these financial statements. Those new standards, amendments to standards and interpretations are not expected to have a significant effect on the financial statements of the Group and the Authority in future financial periods and which the Group does not plan to early adopt.
Infocomm Development AuthorIty of SIngApore44

4 p
ro
pe
rt
y, p
lan
t a
nd
eq
uIp
me
nt
fur
nIt
ur
e
an
d f
Itt
Ing
s$’
000
eq
uIp
me
nt
$’00
0
pla
nt
an
d
ma
ch
Ine
ry
$’00
0b
uIl
dIn
g$’
000
Infr
as
tr
uc
tu
re
$’00
0
ca
pIt
al
wo
rK
-In
-pr
og
re
ss
$’00
0t
ota
l$’
000
gr
ou
p
co
st
At
1 A
pril
2011
12,1
7813
,125
6,31
580
9-
10,8
2243
,249
Add
ition
s5,
722
1,89
772
2-
5,33
395
614
,630
Dis
posa
ls(1
0,58
8)(1
,453
)(1
70)
--
(346
)(1
2,55
7)
Rec
lass
ifica
tion
8,10
338
228
7-
1,24
7(1
0,01
9)-
Rec
lass
ifica
tion
to in
tang
ible
ass
ets
--
--
-(4
2)(4
2)
At
31 M
arch
201
215
,415
13,9
517,
154
809
6,58
01,
371
45,2
80
Add
ition
s64
72,
486
45-
193
2,92
06,
291
Dis
posa
ls(1
52)
(1,0
66)
(2)
--
(34)
(1,2
54)
Rec
lass
ifica
tion
334
412
270
--
(1,0
16)
-
Rec
lass
ifica
tion
to in
tang
ible
ass
ets
--
--
-(2
43)
(243
)
At
31 M
arch
201
316
,244
15,7
837,
467
809
6,77
32,
998
50,0
74
ac
cu
mu
lat
ed
de
pr
ec
Iat
Ion
an
d
Impa
Irm
en
t l
os
s
At
1 A
pril
2011
11,9
8711
,607
5,81
980
9-
-30
,222
Dep
reci
atio
n fo
r th
e ye
ar3,
495
1,83
333
6-
731
-6,
395
Dis
posa
ls(1
0,47
5)(1
,453
)(1
50)
--
-(1
2,07
8)
Impa
irmen
t lo
ss-
--
-1,
726
-1,
726
At
31 M
arch
201
25,
007
11,9
876,
005
809
2,45
7-
26,2
65
Dep
reci
atio
n fo
r th
e ye
ar3,
953
1,43
035
5-
2,20
9-
7,94
7
Dis
posa
ls(1
48)
(1,0
68)
(2)
--
-(1
,218
)
At
31 M
arch
201
38,
812
12,3
496,
358
809
4,66
6-
32,9
94
ca
rr
yIn
g a
mo
un
ts
At
1 A
pril
2011
191
1,51
849
6-
-10
,822
13,0
27
At
31 M
arch
201
210
,408
1,96
41,
149
-4,
123
1,37
119
,015
At
31 M
arch
201
37,
432
3,43
41,
109
-2,
107
2,99
817
,080
AnnuAl RepoRt 2012/2013 45

fur
nIt
ur
e
an
d f
Itt
Ing
s$’
000
eq
uIp
me
nt
$’00
0
pla
nt
an
d
ma
ch
Ine
ry
$’00
0b
uIl
dIn
g$’
000
ca
pIt
al
wo
rK
-In
-pr
og
re
ss
$’00
0t
ota
l$’
000
au
th
or
Ity
co
st
At
1 A
pril
2011
12,0
5110
,910
6,31
580
99,
574
39,6
59
Add
ition
s5,
615
1,63
872
2-
925
8,90
0
Dis
posa
ls(1
0,56
8)(1
,441
)(1
70)
-(3
47)
(12,
526)
Rec
lass
ifica
tion
8,10
338
228
7-
(8,7
72)
-
Rec
lass
ifica
tion
to in
tang
ible
ass
ets
--
--
(42)
(42)
At
31 M
arch
201
215
,201
11,4
897,
154
809
1,33
835
,991
Add
ition
s62
12,
355
45-
2,08
95,
110
Dis
posa
ls(5
8)(1
,066
)(2
)-
(4)
(1,1
30)
Rec
lass
ifica
tion
334
412
270
-(1
,016
)-
Rec
lass
ifica
tion
to in
tang
ible
ass
ets
--
--
(243
)(2
43)
At
31 M
arch
201
316
,098
13,1
907,
467
809
2,16
439
,728
ac
cu
mu
lat
ed
de
pr
ec
Iat
Ion
At
1 A
pril
2011
11,9
019,
575
5,81
980
9-
28,1
04
Dep
reci
atio
n fo
r th
e ye
ar3,
473
1,69
233
6-
-5,
501
Dis
posa
ls(1
0,47
1)(1
,441
)(1
50)
--
(12,
062)
At
31 M
arch
201
24,
903
9,82
66,
005
809
-21
,543
Dep
reci
atio
n fo
r th
e ye
ar3,
935
1,22
635
5-
-5,
516
Dis
posa
ls(5
5)(1
,066
)(2
)-
-(1
,123
)
At
31 M
arch
201
38,
783
9,98
66,
358
809
-25
,936
ca
rr
yIn
g a
mo
un
ts
At
1 A
pril
2011
150
1,33
549
6-
9,57
411
,555
At
31 M
arch
201
210
,298
1,66
31,
149
-1,
338
14,4
48
At
31 M
arch
201
37,
315
3,20
41,
109
-2,
164
13,7
92
no
teS
to t
he f
Ina
nCI
al
Stat
emen
tS
Infocomm Development AuthorIty of SIngApore46
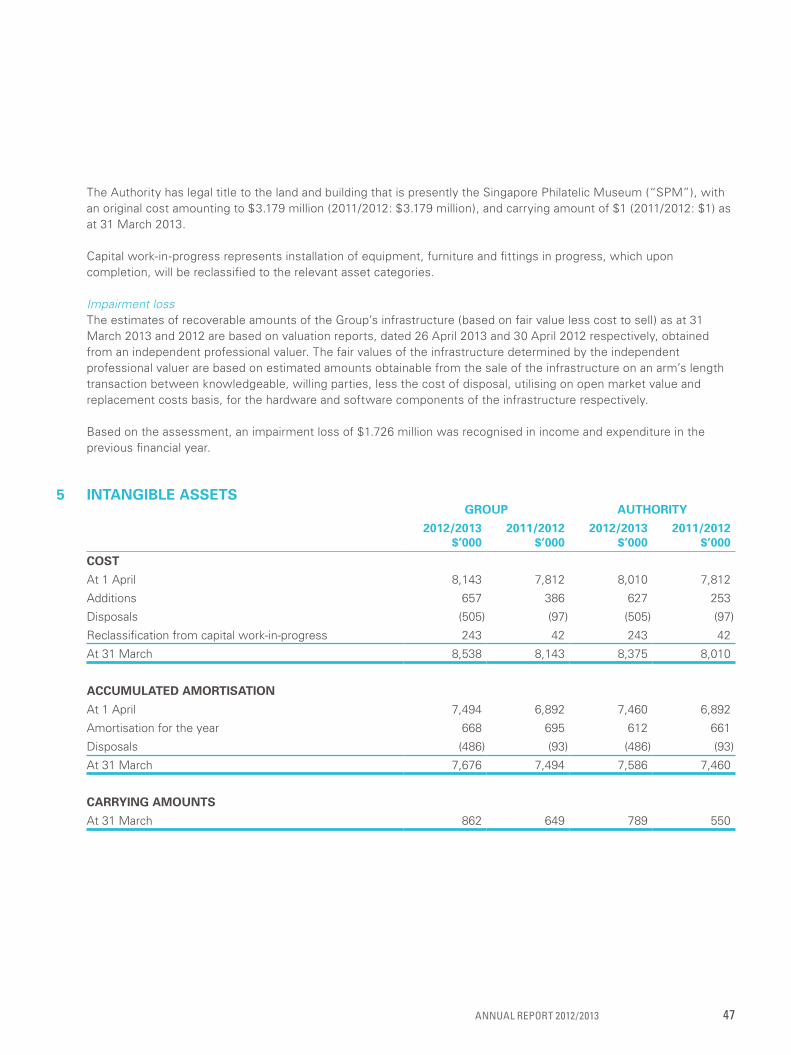
The Authority has legal title to the land and building that is presently the Singapore philatelic Museum (“SpM”), with an original cost amounting to $3.179 million (2011/2012: $3.179 million), and carrying amount of $1 (2011/2012: $1) as at 31 March 2013.
Capital work-in-progress represents installation of equipment, furniture and fittings in progress, which upon completion, will be reclassified to the relevant asset categories.
Impairment lossThe estimates of recoverable amounts of the Group’s infrastructure (based on fair value less cost to sell) as at 31 March 2013 and 2012 are based on valuation reports, dated 26 April 2013 and 30 April 2012 respectively, obtained from an independent professional valuer. The fair values of the infrastructure determined by the independent professional valuer are based on estimated amounts obtainable from the sale of the infrastructure on an arm’s length transaction between knowledgeable, willing parties, less the cost of disposal, utilising on open market value and replacement costs basis, for the hardware and software components of the infrastructure respectively.
Based on the assessment, an impairment loss of $1.726 million was recognised in income and expenditure in the previous financial year.
5 IntangIble assetsgroup authorIty
2012/2013$’000
2011/2012$’000
2012/2013$’000
2011/2012$’000
cost
At 1 April 8,143 7,812 8,010 7,812
Additions 657 386 627 253
Disposals (505) (97) (505) (97)
Reclassification from capital work-in-progress 243 42 243 42
At 31 March 8,538 8,143 8,375 8,010
accumulated amortIsatIon
At 1 April 7,494 6,892 7,460 6,892
Amortisation for the year 668 695 612 661
Disposals (486) (93) (486) (93)
At 31 March 7,676 7,494 7,586 7,460
carryIng amounts
At 31 March 862 649 789 550
AnnuAl RepoRt 2012/2013 47

6 subsIdIarIes
authorIty
2012/2013$’000
2011/2012$’000
unquoted shares, at cost 287,535 273,535
less: Impairment loss (16,960) (9,400)
270,575 264,135
Details of the Authority’s subsidiaries at the end of reporting period are as follows:
name of subsIdIary
prIncIpal actIvItIes/country of
IncorporatIon and operatIon
cost of Investment by the authorIty
proportIon of ownershIp Interest and votIng power
held
2012/2013$’000
2011/2012$’000
2012/2013%
2011/2012%
held by the authorIty
Infocomm Investmentspte ltd a
Investment holding and investment management/ Singapore
237,822 237,822 100 100
Singapore network Information Centre (SGnIC) pte ltd a
Registry of internet domain names/Singapore
3,813 3,813 100 100
IDA International pte ltd a provide consultancy services to foreign governments and public agencies as part of its overall charter to develop, collaborate and promote the Singapore local infocomm enterprises overseas/Singapore
9,900 9,900 100 100
Assurity Trusted Solutionspte ltd a
provide information security services including second factor authorisation services/Singapore
36,000 22,000 100 100
held by subsIdIary
IDA International Bahrain pte ltd SpC b
provide consultancy services/Kingdom of Bahrain
- - 100 100
a Audited by KpMG llp, Singapore.b Audited by other member firms of KpMG International.
noteS to the fInanCIal StatementS
Infocomm Development AuthorIty of SIngApore48

Impairment lossAt the end of each reporting period, management reviews the carrying amounts of the investment in subsidiaries to determine whether there are any indications that the investment is impaired.
Taking into consideration of the nationwide distribution of the oneKey security devices to all Singaporeans and permanent Residents within the first five years of the national Authentication Framework (“nAF”) programme from 2011/2012, an impairment loss of $7.560 million (2011/2012: $9.400 million) was recognised on the investment in that subsidiary as a matter of prudence. The recoverable amount is determined based on the net tangible assets of that subsidiary at the end of the reporting period as it is determined to approximate its fair value.
7 deferred expendIture group and authorIty
2012/2013$’000
2011/2012$’000
cost
At 1 April 8,617 7,921
Additions 1,122 883
Written-off (255) (187)
At 31 March 9,484 8,617
accumulated amortIsatIon
At 1 April 5,057 4,537
Amortisation for the year 716 520
At 31 March 5,773 5,057
carryIng amount
At 31 March 3,711 3,560
AnnuAl RepoRt 2012/2013 49

8 avaIlable-for-sale Investments
group authorIty
note 2012/2013$’000
2011/2012$’000
2012/2013$’000
2011/2012$’000
unquoted fund investments, at fair value (i) 1,625 2,512 - -
unquoted equity shares, at fair value 8,363 4,533 - -
unquoted equity shares, at cost (ii) 4,576 4,589 - -
less: impairment loss (2,832) (2,832) - -
1,744 1,757 - -
Total 11,732 8,802 - -
(i) unquoted fund investments at fair value include impairment losses amounting to $9.895 million (2011/2012: $9.895 million).
(ii) Investments in unquoted equity shares, at cost, represent equity interest in companies that are involved in start-up activities in the information and communication technologies sectors which have a gestation period of approximately 3 to 5 years. The fair value estimates of these investments generated by the various valuation models cannot be reliably estimated as the range of fair values vary significantly. Accordingly, these investments are stated at cost less impairment loss.
Movements in allowance for impairment loss during the year are as follows:
group authorIty
2012/2013$’000
2011/2012$’000
2012/2013$’000
2011/2012$’000
unquoted equity shares, at fair value
At 1 April - 431 - -
Disposals - (431) - -
At 31 March - - - -
unquoted equity shares, at cost
At 1 April 2,832 1,602 - -
Impairment loss - 1,230 - -
At 31 March 2,832 2,832 - -
noteS to the fInanCIal StatementS
Infocomm Development AuthorIty of SIngApore50
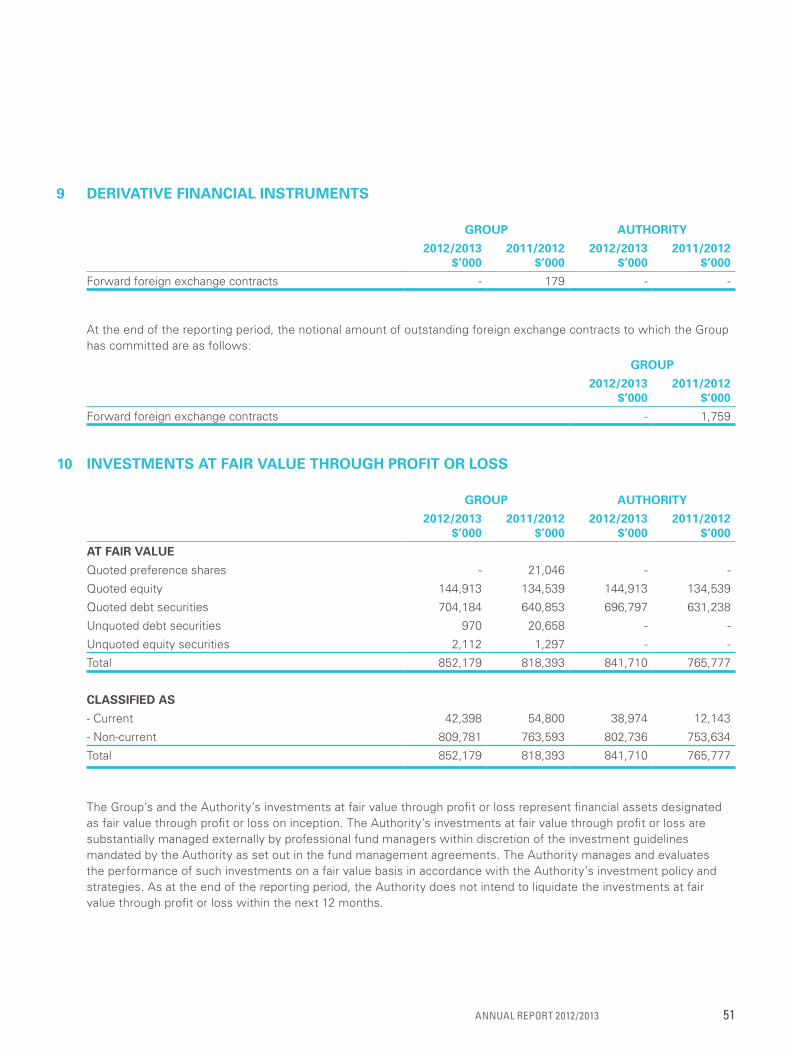
9 derIvatIve fInancIal Instruments
group authorIty
2012/2013$’000
2011/2012$’000
2012/2013$’000
2011/2012$’000
Forward foreign exchange contracts - 179 - -
At the end of the reporting period, the notional amount of outstanding foreign exchange contracts to which the Group has committed are as follows:
group
2012/2013$’000
2011/2012$’000
Forward foreign exchange contracts - 1,759
10 Investments at faIr value through profIt or loss
group authorIty
2012/2013$’000
2011/2012$’000
2012/2013$’000
2011/2012$’000
at faIr value
Quoted preference shares - 21,046 - -
Quoted equity 144,913 134,539 144,913 134,539
Quoted debt securities 704,184 640,853 696,797 631,238
unquoted debt securities 970 20,658 - -
unquoted equity securities 2,112 1,297 - -
Total 852,179 818,393 841,710 765,777
classIfIed as
- Current 42,398 54,800 38,974 12,143
- non-current 809,781 763,593 802,736 753,634
Total 852,179 818,393 841,710 765,777
The Group’s and the Authority’s investments at fair value through profit or loss represent financial assets designated as fair value through profit or loss on inception. The Authority’s investments at fair value through profit or loss are substantially managed externally by professional fund managers within discretion of the investment guidelines mandated by the Authority as set out in the fund management agreements. The Authority manages and evaluates the performance of such investments on a fair value basis in accordance with the Authority’s investment policy and strategies. As at the end of the reporting period, the Authority does not intend to liquidate the investments at fair value through profit or loss within the next 12 months.
AnnuAl RepoRt 2012/2013 51
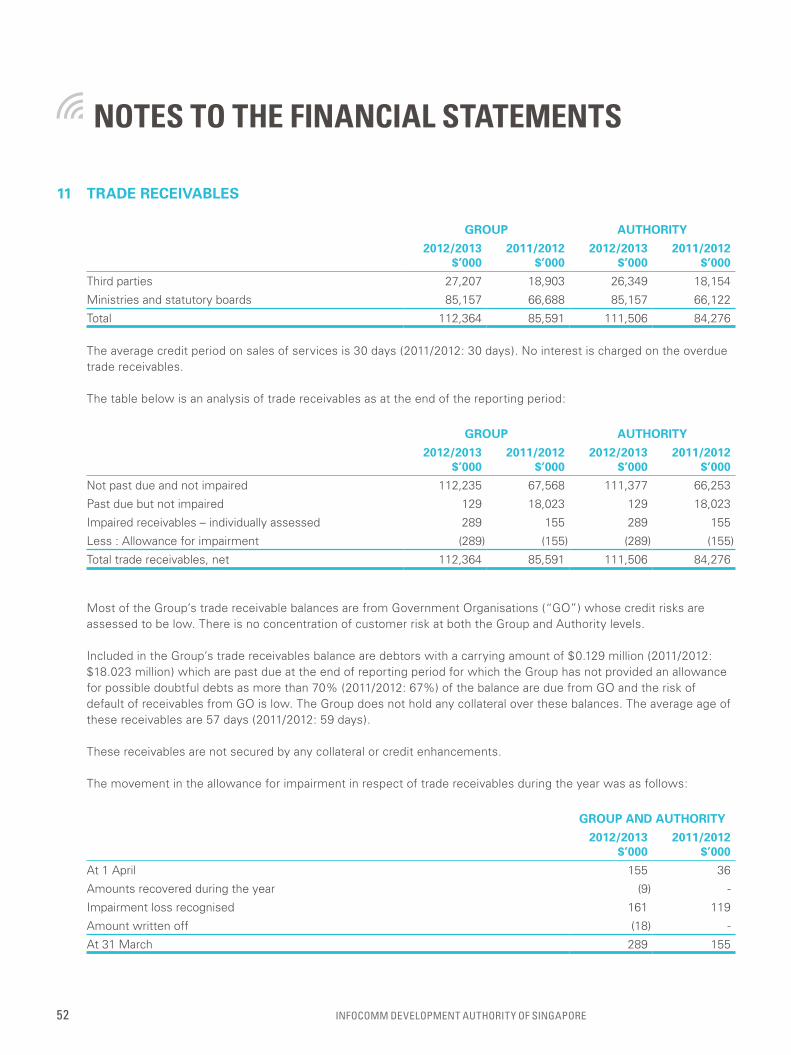
11 trade receIvables
group authorIty
2012/2013$’000
2011/2012$’000
2012/2013$’000
2011/2012$’000
Third parties 27,207 18,903 26,349 18,154
Ministries and statutory boards 85,157 66,688 85,157 66,122
Total 112,364 85,591 111,506 84,276
The average credit period on sales of services is 30 days (2011/2012: 30 days). no interest is charged on the overdue trade receivables.
The table below is an analysis of trade receivables as at the end of the reporting period:
group authorIty
2012/2013$’000
2011/2012$’000
2012/2013$’000
2011/2012$’000
not past due and not impaired 112,235 67,568 111,377 66,253
past due but not impaired 129 18,023 129 18,023
Impaired receivables – individually assessed 289 155 289 155
less : Allowance for impairment (289) (155) (289) (155)
Total trade receivables, net 112,364 85,591 111,506 84,276
Most of the Group’s trade receivable balances are from Government Organisations (“GO”) whose credit risks are assessed to be low. There is no concentration of customer risk at both the Group and Authority levels.
Included in the Group’s trade receivables balance are debtors with a carrying amount of $0.129 million (2011/2012: $18.023 million) which are past due at the end of reporting period for which the Group has not provided an allowance for possible doubtful debts as more than 70% (2011/2012: 67%) of the balance are due from GO and the risk of default of receivables from GO is low. The Group does not hold any collateral over these balances. The average age of these receivables are 57 days (2011/2012: 59 days).
These receivables are not secured by any collateral or credit enhancements.
The movement in the allowance for impairment in respect of trade receivables during the year was as follows:
group and authorIty
2012/2013$’000
2011/2012$’000
At 1 April 155 36
Amounts recovered during the year (9) -
Impairment loss recognised 161 119
Amount written off (18) -
At 31 March 289 155
noteS to the fInanCIal StatementS
Infocomm Development AuthorIty of SIngApore52
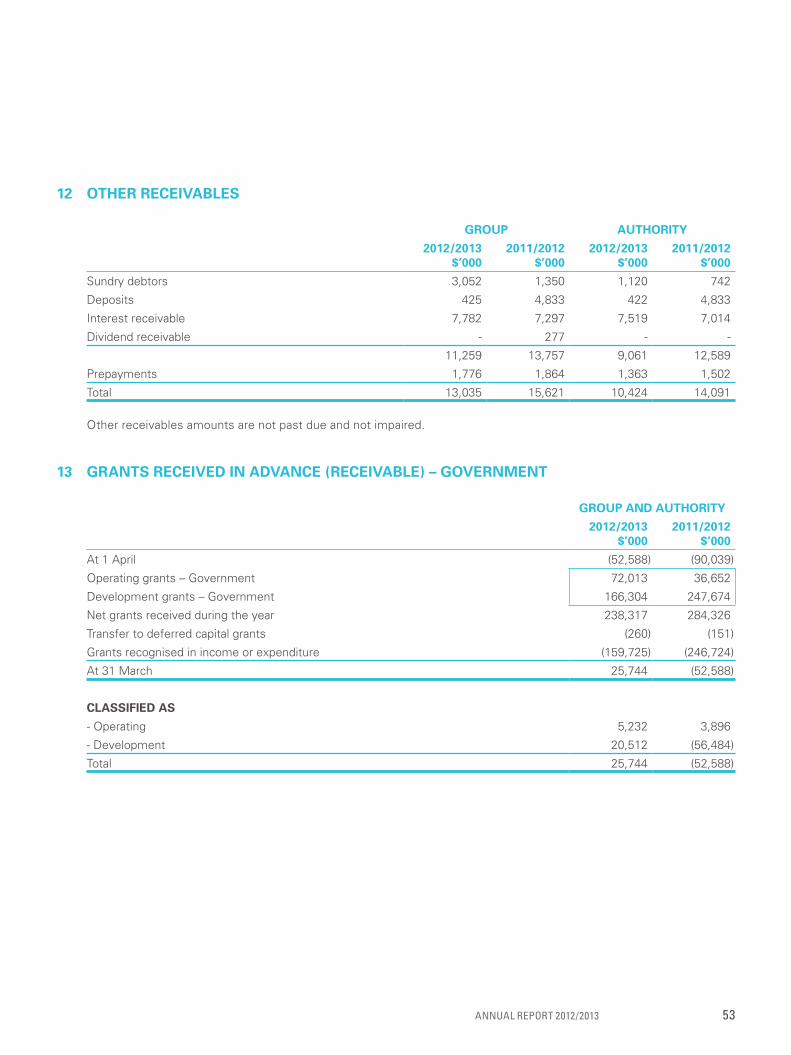
12 other receIvables
group authorIty
2012/2013$’000
2011/2012$’000
2012/2013$’000
2011/2012$’000
Sundry debtors 3,052 1,350 1,120 742
Deposits 425 4,833 422 4,833
Interest receivable 7,782 7,297 7,519 7,014
Dividend receivable - 277 - -
11,259 13,757 9,061 12,589
prepayments 1,776 1,864 1,363 1,502
Total 13,035 15,621 10,424 14,091
Other receivables amounts are not past due and not impaired.
13 grants receIved In advance (receIvable) – government
group and authorIty
2012/2013$’000
2011/2012$’000
At 1 April (52,588) (90,039)
Operating grants – Government 72,013 36,652
Development grants – Government 166,304 247,674
net grants received during the year 238,317 284,326
Transfer to deferred capital grants (260) (151)
Grants recognised in income or expenditure (159,725) (246,724)
At 31 March 25,744 (52,588)
classIfIed as
- Operating 5,232 3,896
- Development 20,512 (56,484)
Total 25,744 (52,588)
AnnuAl RepoRt 2012/2013 53

14 staff loans receIvables
group and authorIty
2012/2013$’000
2011/2012$’000
Other loans – current 3 3
Other loans which include loans to employees for purchase of computers and renovation purposes, are repayable by monthly instalments at nil% interest (2011/2012: nil%) and 5% (2011/2012: 5%) interest per annum respectively, over a period of 2 to 7 years (2011/2012: 2 to 7 years).
15 Income tax expense(a) The Authority is a tax exempted institution under the provision of the Income Tax Act (Cap.134, 2004 Revised Edition). The subsidiaries of the Authority are subject to tax under Singapore income tax legislation.
group
2012/2013$’000
2011/2012$’000
current tax expense
Current year 288 290
Over provision in prior years (13) (22)
275 268
deferred tax expense
Deferred taxation 6 7
Total tax expense 281 275
Surplus before contribution to consolidated fund and income tax 52,520 38,769
Add: Dividend from subsidiaries 2,777 577
less: Impairment on investment in subsidiary (7,560) (9,400)
less: Surplus of the Authority subject to contribution to consolidated fund (52,455) (31,290)
(loss) profit before income tax of the subsidiaries (4,718) (1,344)
Income tax expense (benefit) at Singapore tax rate of 17% (2011/2012: 17%) (802) (228)
Effect of concessionary tax rate (229) (84)
non-deductible item 378 293
Tax incentive (37) (42)
Income not subject to tax (136) (207)
Effect of previously unrecognised deferred tax benefits (83) (689)
Over provision in prior years (13) (22)
Effect of deferred tax benefits not recognised 1,172 1,185
Others 31 69
281 275
noteS to the fInanCIal StatementS
Infocomm Development AuthorIty of SIngApore54
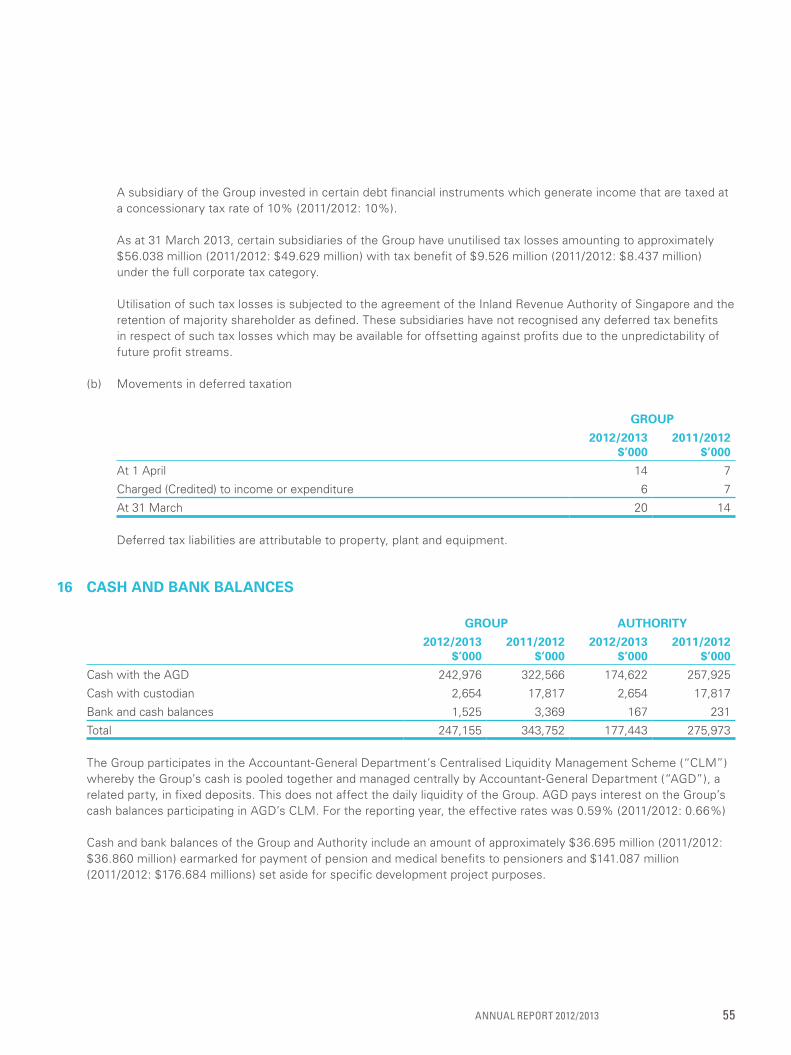
A subsidiary of the Group invested in certain debt financial instruments which generate income that are taxed at a concessionary tax rate of 10% (2011/2012: 10%).
As at 31 March 2013, certain subsidiaries of the Group have unutilised tax losses amounting to approximately $56.038 million (2011/2012: $49.629 million) with tax benefit of $9.526 million (2011/2012: $8.437 million) under the full corporate tax category.
utilisation of such tax losses is subjected to the agreement of the Inland Revenue Authority of Singapore and the retention of majority shareholder as defined. These subsidiaries have not recognised any deferred tax benefits in respect of such tax losses which may be available for offsetting against profits due to the unpredictability of future profit streams.
(b) Movements in deferred taxation
group
2012/2013$’000
2011/2012$’000
At 1 April 14 7
Charged (Credited) to income or expenditure 6 7
At 31 March 20 14
Deferred tax liabilities are attributable to property, plant and equipment.
16 cash and banK balances
group authorIty
2012/2013$’000
2011/2012$’000
2012/2013$’000
2011/2012$’000
Cash with the AGD 242,976 322,566 174,622 257,925
Cash with custodian 2,654 17,817 2,654 17,817
Bank and cash balances 1,525 3,369 167 231
Total 247,155 343,752 177,443 275,973
The Group participates in the Accountant-General Department’s Centralised liquidity Management Scheme (“ClM”) whereby the Group’s cash is pooled together and managed centrally by Accountant-General Department (“AGD”), a related party, in fixed deposits. This does not affect the daily liquidity of the Group. AGD pays interest on the Group’s cash balances participating in AGD’s ClM. For the reporting year, the effective rates was 0.59% (2011/2012: 0.66%)
Cash and bank balances of the Group and Authority include an amount of approximately $36.695 million (2011/2012: $36.860 million) earmarked for payment of pension and medical benefits to pensioners and $141.087 million (2011/2012: $176.684 millions) set aside for specific development project purposes.
AnnuAl RepoRt 2012/2013 55

noteS to the fInanCIal StatementS
17 equIty
group and authorIty
2012/2013no. of shares
2011/2012no. of shares
2012/2013$’000
2011/2012$’000
Issued and fully paId up:
At beginning of year 11,001,001 1,001,001 11,001 1,001
Issuance of shares 7,000,000 10,000,000 7,000 10,000
At end of year 18,001,001 11,001,001 18,001 11,001
In 2012/2013, the Authority issued an additional 7,000,000 shares (2011/2012: 10,000,000) shares to Minister for Finance, a body corporate incorporated by the Minister for Finance (Incorporation) Act (Chapter 183) for $7,000,000 (2011/2012: $10,000,000). The additional fully paid up shares rank pari passu in all respect with the existing shares.
The holders of these shares are entitled to receive dividends as and when declared by the Authority. The shares carry no voting rights nor have a par value.
Capital accountGovernment grants for the establishment of the Authority and investments in subsidiaries and in other investments are recorded in the capital account.
Fair value reserveThe fair value reserve comprises the cumulative net change in the fair value of available-for-sale financial assets until the investments are derecognised or impaired.
Translation reserveThe translation reserve comprises foreign currency differences arising from the translation of the financial statements of foreign operations.
Statutory reserveThe statutory reserve relates to the subsidiary incorporated in Kingdom of Bahrain (note 6).
In accordance with the Bahrain Commercial Companies law and the subsidiary’s Articles of Association, 10% of the subsidiary’s profit for the year is required to be transferred to a statutory reserve until it reaches 50% of the issued share capital. The subsidiary may resolve to discontinue such annual transfers when the reserve equals 50% of the issued share capital. The reserve is not available for distribution, except in the circumstances stipulated in the Bahrain Commercial Companies law.
18 deferred IncomeDeferred income mainly comprises licence and related fees that will be recognised in income or expenditure over the remaining period of the licence, which occurs subsequent to the year end.
Infocomm Development AuthorIty of SIngApore56
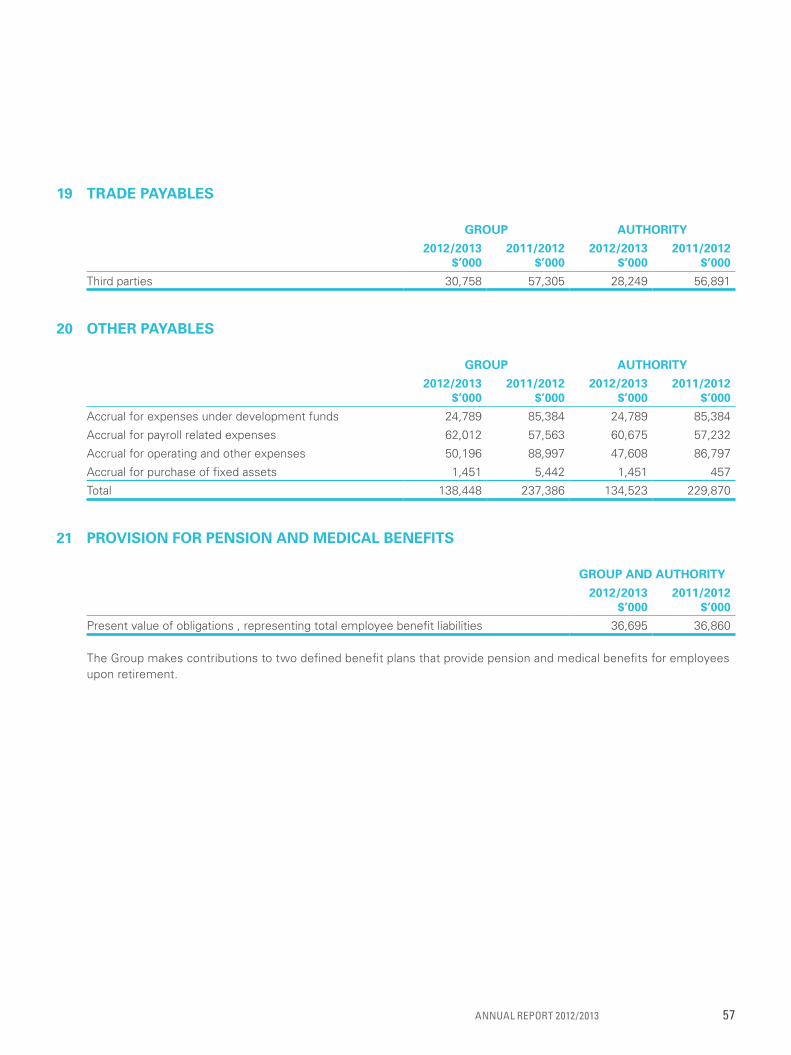
19 trade payables
group authorIty
2012/2013$’000
2011/2012$’000
2012/2013$’000
2011/2012$’000
Third parties 30,758 57,305 28,249 56,891
20 other payables
group authorIty
2012/2013$’000
2011/2012$’000
2012/2013$’000
2011/2012$’000
Accrual for expenses under development funds 24,789 85,384 24,789 85,384
Accrual for payroll related expenses 62,012 57,563 60,675 57,232
Accrual for operating and other expenses 50,196 88,997 47,608 86,797
Accrual for purchase of fixed assets 1,451 5,442 1,451 457
Total 138,448 237,386 134,523 229,870
21 provIsIon for pensIon and medIcal benefIts
group and authorIty
2012/2013$’000
2011/2012$’000
present value of obligations , representing total employee benefit liabilities 36,695 36,860
The Group makes contributions to two defined benefit plans that provide pension and medical benefits for employees upon retirement.
AnnuAl RepoRt 2012/2013 57
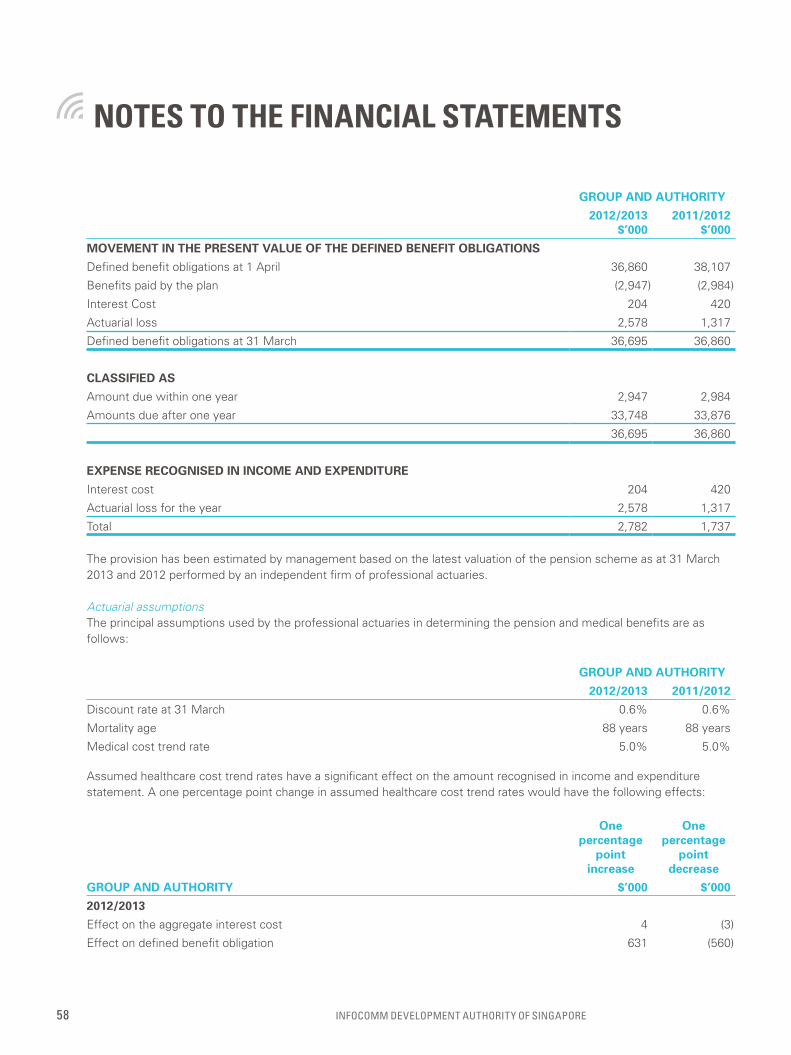
group and authorIty
2012/2013$’000
2011/2012$’000
movement In the present value of the defIned benefIt oblIgatIons
Defined benefit obligations at 1 April 36,860 38,107
Benefits paid by the plan (2,947) (2,984)
Interest Cost 204 420
Actuarial loss 2,578 1,317
Defined benefit obligations at 31 March 36,695 36,860
classIfIed as
Amount due within one year 2,947 2,984
Amounts due after one year 33,748 33,876
36,695 36,860
expense recognIsed In Income and expendIture
Interest cost 204 420
Actuarial loss for the year 2,578 1,317
Total 2,782 1,737
The provision has been estimated by management based on the latest valuation of the pension scheme as at 31 March 2013 and 2012 performed by an independent firm of professional actuaries.
Actuarial assumptionsThe principal assumptions used by the professional actuaries in determining the pension and medical benefits are as follows:
group and authorIty
2012/2013 2011/2012
Discount rate at 31 March 0.6% 0.6%
Mortality age 88 years 88 years
Medical cost trend rate 5.0% 5.0%
Assumed healthcare cost trend rates have a significant effect on the amount recognised in income and expenditure statement. A one percentage point change in assumed healthcare cost trend rates would have the following effects:
one percentage
point increase
one percentage
point decrease
group and authorIty $’000 $’000
2012/2013
Effect on the aggregate interest cost 4 (3)
Effect on defined benefit obligation 631 (560)
noteS to the fInanCIal StatementS
Infocomm Development AuthorIty of SIngApore58

Historical information
2012/2013$’000
2011/2012$’000
2010/2011$’000
2009/2010$’000
2008/2009$’000
present value of the defined benefit obligation 36,695 36,860 38,107 40,612 41,549
Experience adjustments rising on plan liabilities (28) 1,274 77 1,256 (617)
As at 31 March 2013, the Group expects $3.025 million (2011/2012: $2.951 million) in contributions to be paid to its defined benefit plans in 2013/2014.
22 contrIbutIon payable to consolIdated fundThe Authority is required to make contributions to the Consolidated Fund in accordance with the Statutory Corporations (Contributions to Consolidated Fund) Act (Cap 319A, 2004 Revised Edition) and in accordance with the Finance Circular Minute no. M5/2005 with effect from 2004/2005. The contribution is based on a percentage, as decided by Ministry of Finance, of the net surplus of the Authority (before donations) for the financial year.
The total contribution for the year can be reconciled to the net surplus as follows:
group and authorIty
2012/2013$’000
2011/2012$’000
Surplus of the Authority before contribution to consolidated fund 52,455 31,290
Contribution payable at 17% (2011/2012: 17%) 8,917 5,319
Additional contribution paid during the financial year 650 2,751
Total 9,567 8,070
In 2012/2013, there was an additional contribution to the consolidated fund amounting to $0.650 million (2011/2012: $2.751 million) which arose from the recovery of upfront services fees from the service provider implementing the Standard Information Communications Technology Operating System.
23 due to a subsIdIary – non-tradeThe amount due to subsidiaries comprise of (i) deferred payment arrangement with a subsidiary, and (ii) fixed deposit arrangements with two subsidiaries. The deferred payment arrangement arose from a sale of investment in equity and debt securities by a subsidiary to the Authority in FY2011/2012 at fair market value on the date of sale. The settlement is made via a deferred payment arrangement whereby the outstanding payment will be repaid at amounts to be determined by the subsidiary over a period of up to 5 years.
The outstanding amount is unsecured and bears interest at a fixed rate of 2.2% per annum. As at the end of the reporting period, the outstanding payment is not expected to be made within the next 12 months.
The Authority enters into fixed deposit arrangements with two of its subsidiaries in FY2012/2013. under the fixed deposit arrangements, the Authority manages the subsidiaries’ funds by investing in debt securities on a pooled basis for up to 3 years and pays a fixed rate interest of 1% per annum to the subsidiaries. The amounts due to subsidiaries are unsecured and are not expected to be withdrawn within the next 12 months.
AnnuAl RepoRt 2012/2013 59
24 fInancIal Instruments
(a) financial risk managementOverviewThe Group has exposure to the following risks from its use of financial instruments:• marketrisk• creditrisk• liquidityrisk
This note presents information about the Group’s exposure to each of the above risks, the Group’s objectives, policies and processes for measuring and managing risk, and the Group’s management of capital.
Risk management frameworkThe Group has documented financial risk management policies. These policies set out the Group’s overall business strategies and its risk management philosophy. The Group’s overall financial risk management objective seeks to minimise potential adverse effects on its financial performance. It is the Group’s policy not to hold derivative financial instruments for speculative purposes although such instruments may be used for hedging exposure. The Board provides written principles for overall financial risk management, which covers specifically on market risk (including price risk, foreign exchange risk, and interest rate risk), credit risk and liquidity risk. Such written policies are reviewed periodically by the Board and periodic reviews are undertaken to ensure that the Group’s policy are relevant and complied with.
The Group monitors its risk exposure regularly. There has been no change to the Group’s exposure to these financial risks or the manner in which it manages and measures the risk.
The Authority has established a governance, risk and compliance framework which sets out, amongst other things, the governance oversight, risk measurement and monitoring processes, to enhance its overall risk management for the investments at fair value through profit or loss. As part of the risk management process, the management of the Group also conducts ongoing review of its financial assets held in the investment portfolio.
(b) market riskMarket risk refers to the risk arising from uncertainty in the future values of the financial instruments, resulting from movements in factors such as as equity prices, foreign exchange rates and market interest rates. The Group and the Authority’s exposure to each of these factors are presented in the following paragraphs.
(i) price riskRisk management policyprice risk is the risk that the fair value or future cash flows of a financial instrument will fluctuate arising from changes in market prices (other than those arising from interest rate risk or currency risk, which are further discussed below), whether those changes are caused by factors specific to the individual financial instrument or its issuer, or factors affecting similar financial instruments traded in the market.
The Group is exposed to price risk arising from its investments in equity and debt securities, and fund investments comprised within available-for-sale investments and the investments at fair value through profit or loss. The Group’s equity securities comprised both quoted and unquoted equity securities. The Group’s debt securities comprised unquoted debt securities that are exposed to price risk. The management monitors the price fluctuations of the investments and assessed the valuation regularly.
noteS to the fInanCIal StatementS
Infocomm Development AuthorIty of SIngApore60

The Authority is exposed to price risk arising from its investments in quoted equity securities comprised within the investments at fair value through profit or loss. The management monitors the price fluctuations of the investments and assessed the valuation on a daily basis. In accordance with its governance, risk and compliance framework, the management will report significant price movements to the Investment Committee.
Sensitivity analysisAvailable-for-sale investmentsAt 31 March 2013, if prices of equity and fund investments had been 10% higher with all other variables held constant, the fair value increase of these investments and the corresponding increase in fair value changes reserves would have been $1.173 million (2011/2012: $0.880 million). Correspondingly, if prices of equity had been 10% lower with all other variables held constant, the fair value of these investments and the fair value changes reserves would have decreased by an equal amount.
The Authority does not hold any available-for-sale investments.
Investments at fair value through profit or loss
GroupAt 31 March 2013, if prices of equity and debt securities had been 10% higher with all other variables held constant, the Group’s fair value of these financial instruments would have been higher by $14.871 million (2011/2012: $14.360 million) and $0.097 million (2011/2012: $2.040 million) respectively. Correspondingly, the Group’s surplus for the year would have been higher by $14.968 million (2011/2012: $16.400 million).
Conversely, if prices of equity and debt securities had been 10% lower with all other variables held constant, the Group’s fair value of the financial instruments would have been lower by $14.871 million (2011/2012: $14.360 million) and $0.097 million (2011/2012: $2.040 million) respectively. Correspondingly, the Group’s surplus for the year would have been lower by $14.968 million (2011/2012: $16.400 million).
AuthorityAt 31 March 2013, if prices of equity had been 10% higher with all other variables held constant, the Authority’s fair value of these financial instruments would have been higher by $14.660 million (2011/2012: $13.630 million). Correspondingly, the increase in the Authority’s surplus for the year would have been $14.660 million (2011/2012: $13.630 million).
Conversely, if prices of equity had been 10% lower with all other variables held constant, the Authority’s fair value of the financial instruments would have been lower by $14.660 million (2011/2012: $13.630 million). Correspondingly, the decrease in the Authority’s surplus for the year would have been $14.660 million (2011/2012: $13.630 million).
The 10% represents management’s assessment of the possible change in market prices. The sensitivity analysis is for illustrative purposes only. In reality, prices rarely change in isolation and are likely to be interdependent with other market variables.
AnnuAl RepoRt 2012/2013 61
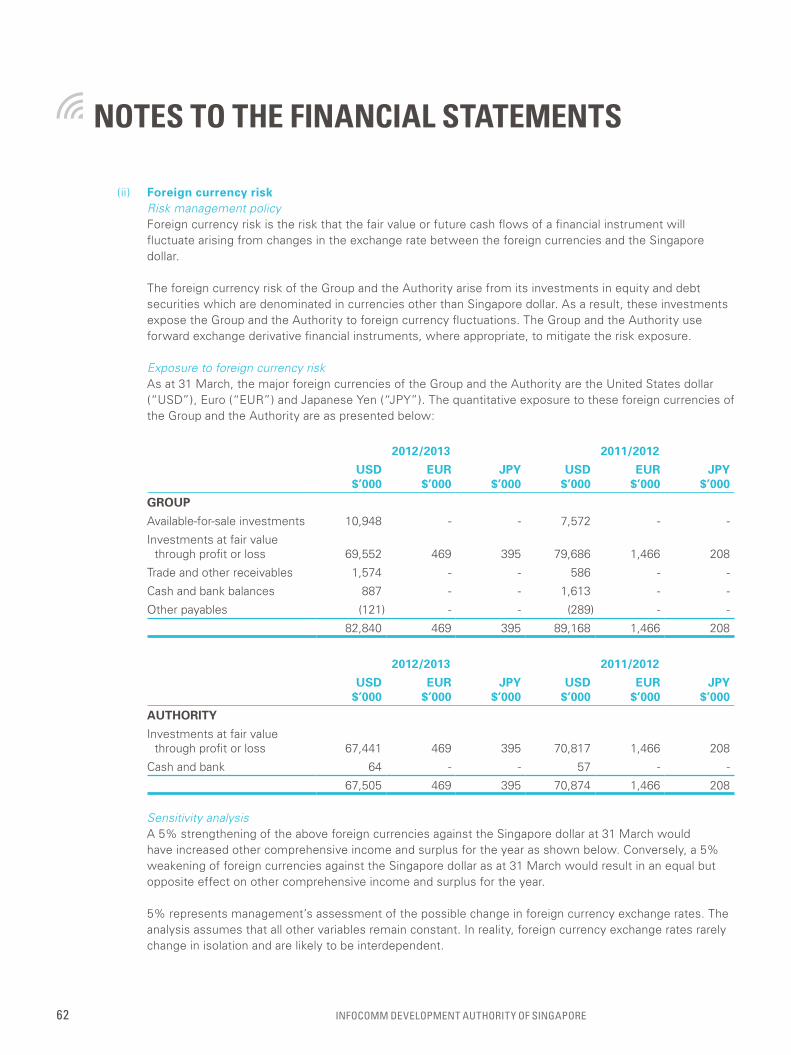
(ii) foreign currency riskRisk management policyForeign currency risk is the risk that the fair value or future cash flows of a financial instrument will fluctuate arising from changes in the exchange rate between the foreign currencies and the Singapore dollar.
The foreign currency risk of the Group and the Authority arise from its investments in equity and debt securities which are denominated in currencies other than Singapore dollar. As a result, these investments expose the Group and the Authority to foreign currency fluctuations. The Group and the Authority use forward exchange derivative financial instruments, where appropriate, to mitigate the risk exposure.
Exposure to foreign currency riskAs at 31 March, the major foreign currencies of the Group and the Authority are the united States dollar (“uSD”), Euro (“EuR”) and Japanese Yen (“JpY”). The quantitative exposure to these foreign currencies of the Group and the Authority are as presented below:
2012/2013 2011/2012
usd$’000
eur$’000
jpy$’000
usd$’000
eur$’000
jpy$’000
group
Available-for-sale investments 10,948 - - 7,572 - -
Investments at fair value through profit or loss 69,552 469 395 79,686 1,466 208
Trade and other receivables 1,574 - - 586 - -
Cash and bank balances 887 - - 1,613 - -
Other payables (121) - - (289) - -
82,840 469 395 89,168 1,466 208
2012/2013 2011/2012
usd$’000
eur$’000
jpy$’000
usd$’000
eur$’000
jpy$’000
authorIty
Investments at fair value through profit or loss 67,441 469 395 70,817 1,466 208
Cash and bank 64 - - 57 - -
67,505 469 395 70,874 1,466 208
Sensitivity analysisA 5% strengthening of the above foreign currencies against the Singapore dollar at 31 March would have increased other comprehensive income and surplus for the year as shown below. Conversely, a 5% weakening of foreign currencies against the Singapore dollar as at 31 March would result in an equal but opposite effect on other comprehensive income and surplus for the year.
5% represents management’s assessment of the possible change in foreign currency exchange rates. The analysis assumes that all other variables remain constant. In reality, foreign currency exchange rates rarely change in isolation and are likely to be interdependent.
noteS to the fInanCIal StatementS
Infocomm Development AuthorIty of SIngApore62

group authorIty
surplus forthe year
other comprehensive
incomesurplus for
the year
other comprehensive
income
2012/2013
uSD 3,595 547 3,375 -
EuR 23 - 23 -
JpY 20 - 20 -
2011/2012
uSD 4,080 379 3,544 -
EuR 73 - 73 -
JpY 10 - 10 -
(iii) Interest rate riskInterest rate risk is the risk that the fair value or future cash flows of a financial instrument will fluctuate arising from changes in interest rates.
The Group and the Authority have exposure to interest rate risks arising from investments in debt securities as well as cash deposits, including the cash participation in AGD’s ClM. The Group deploy duration positioning, where appropriate, to mitigate interest rate risk on debt securities. In addition, management monitors the fair value of the investments daily. In accordance with its governance, risk and compliance framework, the management will report significant fair value movements to the Investment Committee. Interest rate risks on cash deposits are managed through AGD’s cash scheme.
Sensitivity analysisThe sensitivity analysis has been determined based on the exposure to interest rates for debt securities and cash and bank balances at the end of the reporting period. A 100 basis points for debt securities and 25 basis points increase or decrease for cash and bank balances represent management’s assessment of the possible change in interest rates.
Cash and bank balancesIf interest rates had been 25 basis points higher or lower and all other variables were held constant, the Group’s surplus for the year ended 31 March 2013 would increase or decrease by $0.618 million (2011/2012: $0.859 million).
If interest rates had been 25 basis points higher or lower and all other variables were held constant, the Authority’s surplus for the year ended 31 March 2013 would increase or decrease by $0.444 million (2011/2012: $0.690 million).
AnnuAl RepoRt 2012/2013 63
Investment at fair value through profit or lossIf interest rates had been 100 basis points higher and all other variables were held constant, the Group’s fair value of the investments at fair value through profit or loss and surplus for the year ended 31 March 2013 would decrease by $28.260 million (2011/2012: $26.860 million). Conversely, a reduction in interest rates by 100 basis points would increase the Group’s fair value of the investments at fair value through profit or loss and surplus for the year by $30.400 million (2011/2012: $28.760 million).
If interest rates had been 100 basis points higher and all other variables were held constant, the Authority’s fair value of the investments at fair value through profit or loss and surplus for the year ended 31 March 2013 would decrease by $27.630 million (2011/2012: $26.520 million). Conversely, a reduction in interest rates by 100 basis points would increase the Authority’s fair value of the investments at fair value through profit or loss and surplus for the year by $29.750 million (2011/2012: $28.410 million).
(c) credit riskCredit risk is the risk of default of counterparties which will affect the fair value or future cash flows of a financial instrument.
The Group and the Authority’s exposure to credit risk arise from its financial assets. The carrying amounts of financial assets in the statement of financial position represent the maximum exposure to credit risk, before taking into account any collateral held. As at the end of reporting period, the Group and the Authority do not hold any collateral in respect of its financial assets.
The Group and the Authority mitigate credit risk exposure through regular monitoring of the recoverability of the financial assets. In respect of its investments in debt securities, it is the policy of the Group and the Authority to invest only in securities which meet the credit criteria approved by its Investment Committee. As at the end of the reporting period, the Group’s and the Authority’s investments in debt securities are not impaired. The carrying amounts of these debt securities as comprised within investments at fair value through profit or loss represent the fair value of these investments.
(d) liquidity riskliquidity risk is the risk of not being able to meet financial obligations arising from fluctuations in cashflow of financial assets.
The Group and the Authority are not subject to regulatory requirement to maintain minimum cash level. It is the policy of the Group and the Authority to maintain a level of cash deemed adequate by the management to finance its operations and mitigate the effects of fluctuations in cash flows.
The financial liabilities of the Group and the Authority are presented in the statement of financial position. The current liabilities are non-interest bearing and repayable within one year from the end of the reporting period. The financial assets of the Group and the Authority are able to meet these financial obligations.
The undiscounted cash flow of the Group’s and Authority’s financial liabilities (including trade payables, other payables, advances and deposits, grants received in advance and contribution payable to consolidated fund) at the reporting date approximate the carrying amounts and are expected to be settled within the next 12 months and are classified as other financial liabilities.
noteS to the fInanCIal StatementS
Infocomm Development AuthorIty of SIngApore64
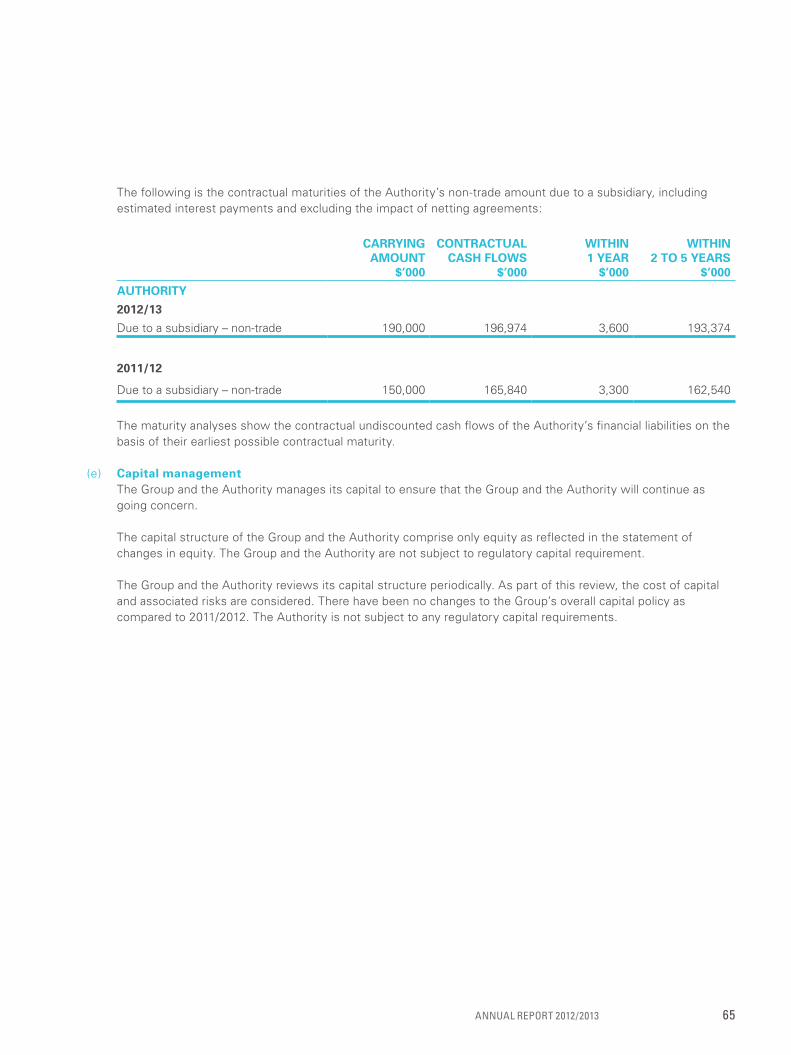
The following is the contractual maturities of the Authority’s non-trade amount due to a subsidiary, including estimated interest payments and excluding the impact of netting agreements:
carryIng amount
$’000
contractual cash flows
$’000
wIthIn1 year
$’000
wIthIn2 to 5 years
$’000
authorIty
2012/13
Due to a subsidiary – non-trade 190,000 196,974 3,600 193,374
2011/12
Due to a subsidiary – non-trade 150,000 165,840 3,300 162,540
The maturity analyses show the contractual undiscounted cash flows of the Authority’s financial liabilities on the basis of their earliest possible contractual maturity.
(e) capital managementThe Group and the Authority manages its capital to ensure that the Group and the Authority will continue as going concern.
The capital structure of the Group and the Authority comprise only equity as reflected in the statement of changes in equity. The Group and the Authority are not subject to regulatory capital requirement.
The Group and the Authority reviews its capital structure periodically. As part of this review, the cost of capital and associated risks are considered. There have been no changes to the Group’s overall capital policy as compared to 2011/2012. The Authority is not subject to any regulatory capital requirements.
AnnuAl RepoRt 2012/2013 65
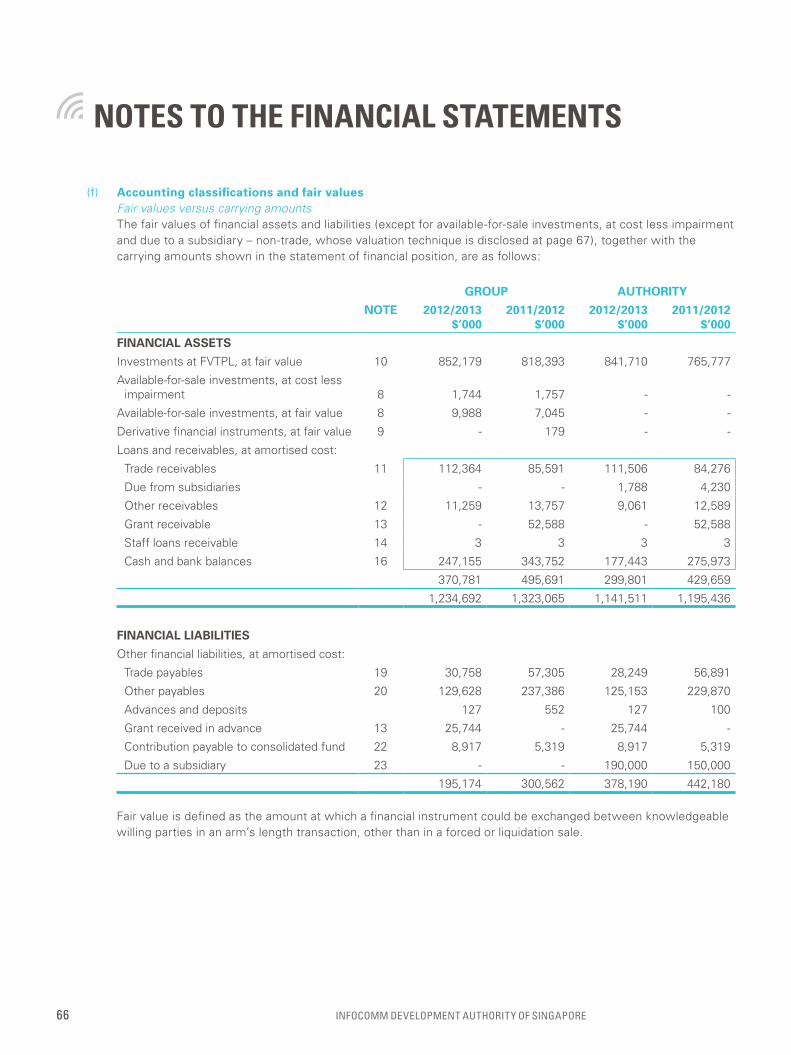
(f) accounting classifications and fair valuesFair values versus carrying amountsThe fair values of financial assets and liabilities (except for available-for-sale investments, at cost less impairment and due to a subsidiary – non-trade, whose valuation technique is disclosed at page 67), together with the carrying amounts shown in the statement of financial position, are as follows:
group authorIty
note 2012/2013$’000
2011/2012$’000
2012/2013$’000
2011/2012$’000
fInancIal assets
Investments at FvTpl, at fair value 10 852,179 818,393 841,710 765,777
Available-for-sale investments, at cost less impairment 8 1,744 1,757 - -
Available-for-sale investments, at fair value 8 9,988 7,045 - -
Derivative financial instruments, at fair value 9 - 179 - -
loans and receivables, at amortised cost:
Trade receivables 11 112,364 85,591 111,506 84,276
Due from subsidiaries - - 1,788 4,230
Other receivables 12 11,259 13,757 9,061 12,589
Grant receivable 13 - 52,588 - 52,588
Staff loans receivable 14 3 3 3 3
Cash and bank balances 16 247,155 343,752 177,443 275,973
370,781 495,691 299,801 429,659
1,234,692 1,323,065 1,141,511 1,195,436
fInancIal lIabIlItIes
Other financial liabilities, at amortised cost:
Trade payables 19 30,758 57,305 28,249 56,891
Other payables 20 129,628 237,386 125,153 229,870
Advances and deposits 127 552 127 100
Grant received in advance 13 25,744 - 25,744 -
Contribution payable to consolidated fund 22 8,917 5,319 8,917 5,319
Due to a subsidiary 23 - - 190,000 150,000
195,174 300,562 378,190 442,180
Fair value is defined as the amount at which a financial instrument could be exchanged between knowledgeable willing parties in an arm’s length transaction, other than in a forced or liquidation sale.
noteS to the fInanCIal StatementS
Infocomm Development AuthorIty of SIngApore66
The following methods and assumptions are made to estimate the fair value of each class of financial instruments (where it is practicable to estimate that value).
The carrying amounts of trade receivables, due from subsidiaries, other receivables, grant receivable, staff loan receivables, cash and bank balances, trade payables, other payables, advances and deposits, grant received in advance and contribution payable to a consolidated fund approximate their respective fair values due to the relatively short-term maturity of these financial instruments.
The fair values of the amount due to subsidiaries – non-trade cannot be reliably estimated as there are no repayment terms and it is not possible to estimate the timing of future cash flows. The carrying amounts of the amount due to subsidiaries – non-trade are carried at cost.
Available-for-sale investments, investments at fair value through profit or loss and derivatives are stated on the statement of financial position at their fair values, except that certain available-for-sale investments are carried at cost less allowance for impairment loss as their values cannot be reliably measured by alternative valuation methods.
Investments at fair value through profit or lossThe fair value of the quoted equity securities is based on the quoted closing market prices (bid prices) on the last day of the financial year.
The fair value of the quoted debts securities are based on the quotes readily and regularly available from an exchange, dealers, brokers, industry group, pricing service or regulatory agency on the last day of the financial year.
The fair values of the embedded credit derivatives, the unquoted debt securities and the unquoted equity securities are based on the prices quoted by the banks, independent external valuers based on their proprietary valuation models and the Group’s in-house valuation model.
For investments at fair value through profit or loss, standalone derivatives and derivatives embedded in available-for-sale host contracts which are not closely related and are bifurcated, the Group estimates the fair value of investments at fair value through profit or loss and derivatives that do not have an active market by using suitable valuation techniques and/or obtain price quotes from third parties. The valuation techniques attempt to establish what the transaction price would have been on the measurement date for which the financial instruments could be exchanged or settled between knowledgeable, willing parties in an arm’s length transaction.
Available-for-sale investmentsThe fair value of the funds is based on the latest available unaudited net asset values of the underlying funds provided by the administrator of those funds. The unaudited net asset values may differ from the audited net asset values when the audit of the underlying fund is completed.
AnnuAl RepoRt 2012/2013 67

The fair values of the unquoted equity investments are based on the prices computed by independent external valuers based on their proprietary valuation models and the Group’s in-house valuation model. The valuation models attempt to establish what the transaction price would have been on the measurement date for which the financial instruments could be exchanged or settled between knowledgeable, willing parties in an arm’s length transaction.
When an unquoted available-for-sale equity investment has progressed to a sufficiently matured stage of its business life cycle, the Group will endeavour to determine its fair value using valuation techniques. The Group uses valuation methodology which involves the formulation of assumptions and estimates. Such assumptions and estimates are based on market conditions existing at the end of the reporting period. The valuation methodology involves references to multiple financial ratios, e.g. price-earnings ratio, book-to-price ratio, of comparable companies that operate in similar industries as the investee entities, with adjustments when deemed appropriate and necessary by management for any difference in operational scale and other disparities. There is an inherent limitation to this valuation technique as no two enterprises are identical in size, product mix, stage of business life cycle, management team, to name a few. To the extent that the actual considerations taken into by market participants deviate from the assumptions and estimates made by the management at end of the reporting period, there exists the risk that the recorded value derived using the said methodology will not be reflective of the fair value.
Investments in equity instruments that do not have a quoted market price in an active market and whose fair value cannot be reliably measured are measured at cost.
Derivative financial instrumentsThe Group uses widely recognised valuation models for determining the fair value of financial instruments such as forward foreign exchange contracts, that use only observable market data and require little management judgement and estimation. Observable price and model inputs are usually available in the market for listed debt and equity securities, exchange trade derivatives and simple over the counter derivatives like forward foreign exchange contracts. Availability of observable market prices and model inputs reduces the need for management judgement and estimation and also reduces the uncertainty associated with determination of fair values. Availability of observable market prices and inputs varies depending on the products and markets and is prone to changes based on specific events and general conditions in the financial markets.
Fair value hierarchyThe Group classifies fair value measurements using a fair value hierarchy that reflects the significance of the inputs used in making the measurements. The fair value hierarchy has the following levels:
(a) quoted prices (unadjusted) in active markets for identical assets or liabilities (level 1);(b) inputs other than quoted prices included within level 1 that are observable for the asset or liability, either directly (i.e., as prices) or indirectly (i.e. derived from prices) (level 2); and(c) inputs for the assets or liability that are not based on observable market data (unobservable inputs) (level 3).
noteS to the fInanCIal StatementS
Infocomm Development AuthorIty of SIngApore68
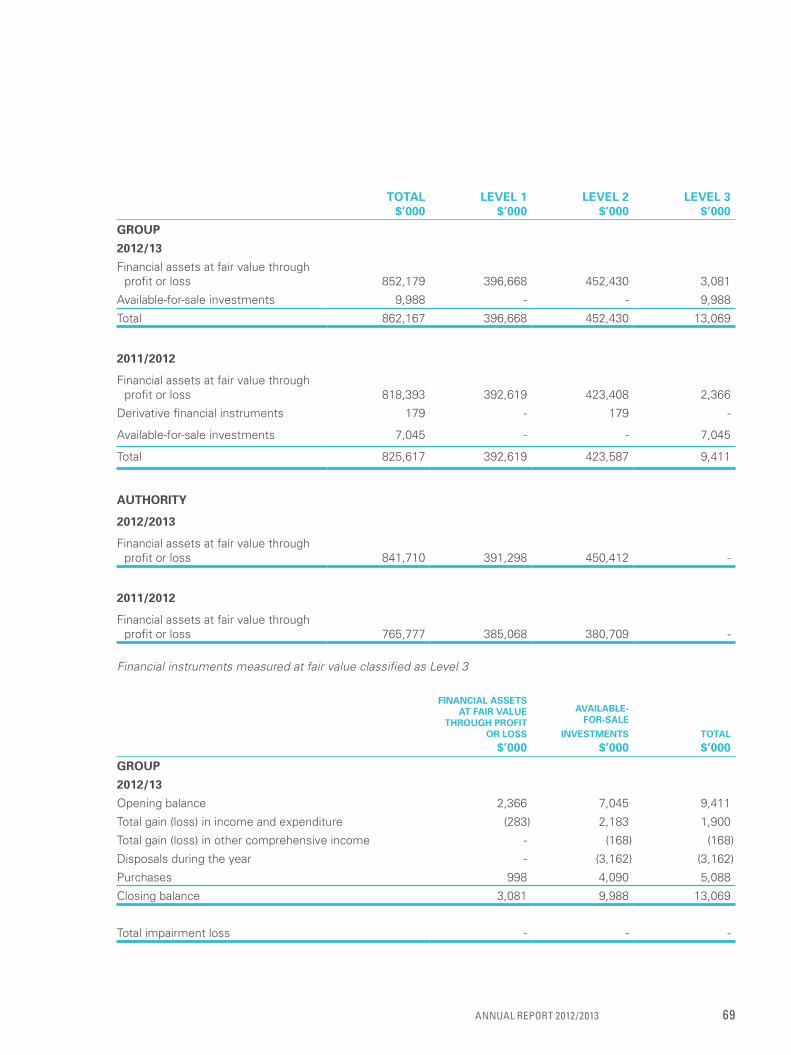
total$’000
level 1$’000
level 2$’000
level 3$’000
group
2012/13
Financial assets at fair value through profit or loss 852,179 396,668 452,430 3,081
Available-for-sale investments 9,988 - - 9,988
Total 862,167 396,668 452,430 13,069
2011/2012
Financial assets at fair value through profit or loss 818,393 392,619 423,408 2,366
Derivative financial instruments 179 - 179 -
Available-for-sale investments 7,045 - - 7,045
Total 825,617 392,619 423,587 9,411
authorIty
2012/2013
Financial assets at fair value through profit or loss 841,710 391,298 450,412 -
2011/2012
Financial assets at fair value through profit or loss 765,777 385,068 380,709 -
Financial instruments measured at fair value classified as Level 3
fInancIal assets at faIr value
through profIt or loss
$’000
avaIlable-for-sale
Investments
$’000total
$’000
group
2012/13
Opening balance 2,366 7,045 9,411
Total gain (loss) in income and expenditure (283) 2,183 1,900
Total gain (loss) in other comprehensive income - (168) (168)
Disposals during the year - (3,162) (3,162)
purchases 998 4,090 5,088
Closing balance 3,081 9,988 13,069
Total impairment loss - - -
AnnuAl RepoRt 2012/2013 69

noteS to the fInanCIal StatementS
fInancIal assets at faIr value
through profIt or loss
$’000
avaIlable-for-sale
Investments
$’000total
$’000
group
2011/2012
Opening balance 3,164 12,840 16,004
Total gain in income and expenditure 1,302 2,820 4,122
Impairment loss - (1,230) (1,230)
Total gain (loss) in other comprehensive income - (3,863) (3,863)
Disposals during the year (2,200) (5,613) (7,813)
purchases 100 2,091 2,191
Closing balance 2,366 7,045 9,411
Total impairment loss - (1,230) (1,230)
Although the Group believes that its estimates of fair value are appropriate, the use of different methodologies or assumptions could lead to different measurements of fair value.
For fair value measurements of an investment in level 3, measured using the dividend discount model, changing the market risk premium by ±10% would have the following effect:
Income and expendIture other comprehensIve Income
favourable$
(unfavourable)$
favourable$
(unfavourable)$
unquoted equity securities 92 (79) - -
The favourable and unfavourable effects of using reasonably possible alternative assumptions have been calculated by recalibrating the model values using alternative estimates of risk adjusted discount rates that might reasonably have been considered by a market participant for the purpose of pricing the instruments at the reporting date.
The fair value of the investment is calculated by using expected dividends and risk-adjusted discount rates.
Key inputs and assumptions used in the models at 31 March 2013 include:
Discount rateThe discount rate applied is based on the risk free rate for the 10 year bonds issued by the government in the relevant markets, adjusted for a risk premium to reflect the increased risks of investing in equities.
DividendsThe dividend applied is the average of the past three year’s actual dividend that is expected to grow at zero percent.
Infocomm Development AuthorIty of SIngApore70

25 net assets of trust and agency fundsDetails of the trust and agency funds are set out below and have been prepared from the records of these funds and reflect only transactions handled by the Group and the Authority:
group and authorIty
2012/2013$’000
2011/2012$’000
Receipts 187,319 166,053
Interest income 92 17
Expenditures (184,405) (166,453)
net surplus (deficit) for the year 3,006 (383)
Accumulated surplus at 1 April 3,513 3,896
Accumulated surplus at 31 March 6,519 3,513
Represented by:
Fixed deposit 8,157 5,530
Interest receivable 49 11
Trade and other payables (1,687) (2,028)
net assets 6,519 3,513
26 Interest Incomegroup authorIty
2012/2013$’000
2011/2012$’000
2012/2013$’000
2011/2012$’000
Cash and bank balances 1,025 1,352 707 984
Interest income on financial asset designated at fair value through profit or loss 17,470 11,346 17,430 11,266
Others - 14 - 2
Total 18,495 12,712 18,137 12,252
27 other Incomegroup authorIty
2012/2013$’000
2011/2012$’000
2012/2013$’000
2011/2012$’000
Reactivation fees 5 4 - -
Other service income 3,416 8,537 4,405 10,331
Others 4,936 2,207 4,858 2,141
Total 8,357 10,748 9,263 12,472
AnnuAl RepoRt 2012/2013 71

group authorIty
2012/2013$’000
2011/2012$’000
2012/2013$’000
2011/2012$’000
net gaIns (losses)
Investments at fair value through profit or loss 51,739 34,842 51,335 28,058
Available-for-sale investments 2,183 1,776 - -
loans and receivables 864 1,233 546 865
Financial liabilities measured at amortised cost - - (3,367) (667)
Total 54,786 37,851 48,514 28,256
28 net development expensesgroup authorIty
2012/2013$’000
2011/2012$’000
2012/2013$’000
2011/2012$’000
Development expenses:
Cluster Development Fund project - 186 - 186
Infocomm 21 Fund project (40) 156 (40) 156
Infocomm Security Masterplan 2 2,296 3,046 2,296 3,046
Youth Olympic Games - 995 - 995
Wired with Wireless project 223 3,754 223 3,754
Connected Singapore Blueprint 2,784 5,164 2,784 5,164
in2015 Masterplan 23,826 24,329 26,934 29,105
Enhanced CITREp: Critical Infocomm Technology Resources program (694) 6,652 (694) 6,652
Silver Infocomm hotspot 117 28 117 28
SGIX Grant: Establishment of the Singapore Internet Exchange 567 1,655 567 1,655
Green ICT programme 481 165 481 165
next Generation national Broadband network 83,661 201,087 83,661 201,087
MICA Core Innovation Fund project 144 119 144 119
i-Singapore@work 130 - 130 -
i-Best 77 - 77 -
113,572 247,336 116,680 252,112
noteS to the fInanCIal StatementS
Infocomm Development AuthorIty of SIngApore72

group authorIty
2012/2013$’000
2011/2012$’000
2012/2013$’000
2011/2012$’000
less: Development project income/funding
Infocomm Security Masterplan 2 - 39 - 39
Wire with Wireless project 223 3,754 223 3,754
Connected Singapore Blueprint 197 316 197 316
in2015 Masterplan 9,995 10,907 9,995 10,907
MICA Core Innovation Fund 15 - 15 -
10,430 15,016 10,430 15,016
net development fund expenses 103,142 232,320 106,250 237,096
The development activities relate to project income and expenses to develop Singapore Info-communications industry.
(a) cluster development fund projectThe Cluster Development Fund was established in 1995 to accelerate the realisation of the IT2000 Masterplan and to nurture a vibrant IT industry. Its objectives are to provide seed funding for IT2000 flagship projects, to encourage industry initiatives by sharing risks, to co-invest in strategic projects and companies, and to support the development or critical IT skills.
(b) Infocomm 21 fund projectThe Infocomm 21 Fund was established in 2000 to facilitate the implementation of the Infocomm 21 Strategic plan to develop Singapore into a premier info-communications capital in the Asia-pacific.
(c) Infocomm security masterplan 2The Infocomm Security Masterplan 2 aims to ensure the high resilience and availability of Singapore’s national infocomm infrastructure and entrench the nation’s reputation as a secure and trusted hub so as to attract high value-added and critical business operations into Singapore.
(d) youth olympic games (“yog”)under this initiative, the Authority developed a virtual world to engage youth around the world to form virtual communities and interact with one another. The Youth Olympic village, key YOG sports venues were modelled in the virtual world. The Authority also established new media platform for participants, youths and spectators through mobile and online channels to reach out to the large YOG community.
(e) wire with wireless projectTo position Singapore as a living lab and business catalyst for wireless development in Asia, the “Wired with Wireless” programme promotes the development of mobile infrastructure, products and services. The three main areas of focus are location-based services, mobile commerce and wireless multimedia.
(f) connected singapore blueprintThe blueprint aims to develop a vibrant info-communications industry, create advanced info-communications users in all sectors, and create a conductive environment.
AnnuAl RepoRt 2012/2013 73

(g) in2015 masterplanThe Intelligent nation 2015 (“in2015”) Masterplan is Singapore’s long-term strategic info-communications master plan to further enhance quality of life and create new national competitive advantage through info-communications. The plan seeks to enrich the lives of the people, enhance Singapore’s economic competitiveness and increase the growth of the info-communications industry.
(h) enhanced cItrep: critical Infocomm technology resources programCritical Infocomm Technology Resources program (“CITREp”) is a training incentive programme to equip Singapore Infocomm professionals with critical and emerging skills, thus enabling them to enhance their employability and to improve their organisations’ competitive edge.
(i) silver Infocomm hotspotsThe Silver Infocomm Initiative aims to bridge the digital divide among senior citizens aged 50 and above through addressing their differences in educational background, language and infocomm competencies. Senior citizens can obtain training in digital lifestyle skills and get engaged in the digital age.
(j) sgIx grant: establishment of the singapore Internet exchangeSGIX seeks to promote efficient interconnectivity for the Internet in Singapore by being a central point of traffic exchange. It will also seek to improve connectivity to Singapore by attracting regional and international carriers to use Singapore as a hub for Internet traffic. Additional, SGIX aims to increase content hosting by encouraging content providers to host their content in Singapore and hence encourage the growth of data centres.
(k) green Ict programmeThe Green ICT programme aims to create more awareness of the positive impact info-communications technology can make in reducing the carbon footprint and energy costs of organisations.
(l) next generation national broadband networkThe next Generation national Broadband network (“next Gen nBn”) is a next generation national digital communication network. The next Gen nBn will entrench Singapore’s Infocomm hub status and open the doors to new economic opportunities, business growth and social vibrancy for the country. The next Gen nBn will offer pervasive, competitively priced, ultra-high broadband speeds of 1 Gbps and beyond.
(m) mIca core Innovation fund projectMICA Core Innovation Fund (“CIF”) aims to develop new products or services that would improve public service delivery through the creation and implementation of innovation.
(n) i-singapore @workImage of Singapore (“i-Singapore”) aims to encourage companies to develop and adopt enterprise geospatial applications to create new business opportunities, improve workforce productivity and enable better decision-making, using public and private sector data.
(o) Infocomm business & engineering start-up programmeInfocomm Business & Engineering Start-up programme (“iBEST”) is to promote Singapore as a key entrepreneurial and innovation hub for global vC-backed infocomm start-ups, as well as a launch pad for them to gain market traction in Asia.
noteS to the fInanCIal StatementS
Infocomm Development AuthorIty of SIngApore74
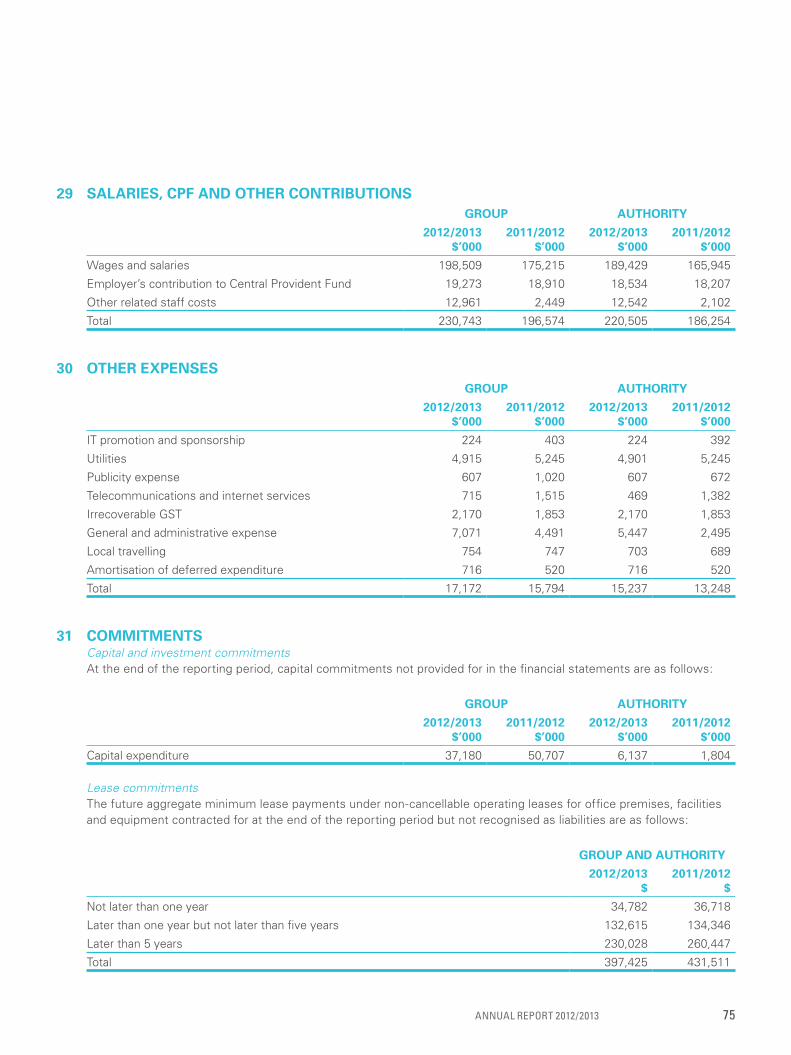
29 salarIes, cpf and other contrIbutIonsgroup authorIty
2012/2013$’000
2011/2012$’000
2012/2013$’000
2011/2012$’000
Wages and salaries 198,509 175,215 189,429 165,945
Employer’s contribution to Central provident Fund 19,273 18,910 18,534 18,207
Other related staff costs 12,961 2,449 12,542 2,102
Total 230,743 196,574 220,505 186,254
30 other expensesgroup authorIty
2012/2013$’000
2011/2012$’000
2012/2013$’000
2011/2012$’000
IT promotion and sponsorship 224 403 224 392
utilities 4,915 5,245 4,901 5,245
publicity expense 607 1,020 607 672
Telecommunications and internet services 715 1,515 469 1,382
Irrecoverable GST 2,170 1,853 2,170 1,853
General and administrative expense 7,071 4,491 5,447 2,495
local travelling 754 747 703 689
Amortisation of deferred expenditure 716 520 716 520
Total 17,172 15,794 15,237 13,248
31 commItmentsCapital and investment commitmentsAt the end of the reporting period, capital commitments not provided for in the financial statements are as follows:
group authorIty
2012/2013$’000
2011/2012$’000
2012/2013$’000
2011/2012$’000
Capital expenditure 37,180 50,707 6,137 1,804
Lease commitmentsThe future aggregate minimum lease payments under non-cancellable operating leases for office premises, facilities and equipment contracted for at the end of the reporting period but not recognised as liabilities are as follows:
group and authorIty
2012/2013$
2011/2012$
not later than one year 34,782 36,718
later than one year but not later than five years 132,615 134,346
later than 5 years 230,028 260,447
Total 397,425 431,511
AnnuAl RepoRt 2012/2013 75

noteS to the fInanCIal StatementS
Operating lease payments represent rentals payable by the Group for certain of its office properties and office equipment. leases are recognised for an average terms of 1 to 10 years and rentals are fixed for the duration of the lease except for the lease payments of data centre facilities which are based on the actual number of units used.
Development expense commitmentsAs at the end of the reporting period, the development expenses committed amounted to approximately $0.496 billion (2011/2012: $0.840 billion).
Other commitmentsunder the Scholarship programme, the Authority has an obligation to fund the scholars’ educational expenses. At the end of the reporting period, the total committed expenditure is estimated to be $5.226 million (2011/2012: $5.702 million).
32 related partIesFor the purpose of these financial statements, parties are considered to be related to the Authority if the Authority has the ability, directly or indirectly, to control the party or exercise significant influence over the party in making financial and operating decisions, or vice versa, or where the Authority and the party are subject to common control or common significant influence. Related parties may be individuals or other entities. In accordance with SB-FRS paragraph 27A, the Group and the Authority is exempted from disclosing transactions with government-related entities other than Ministries, Organs of State and other Statutory Boards, unless there are circumstances to indicate that these transactions are unusual and their disclosure would be of interest to readers of the financial statements.
Key management personnel compensation comprises:
group authorIty
2012/2013$’000
2011/2012$’000
2012/2013$’000
2011/2012$’000
Short term benefits 8,277 7,298 4,909 4,141
post employment benefits 231 192 122 104
Total 8,508 7,490 5,031 4,245
The Group adopts the guidelines set by public Service Division (“pSD”) and takes into consideration the reporting officers’ assessment of individual officers in determining the remuneration of key management.
Infocomm Development AuthorIty of SIngApore76
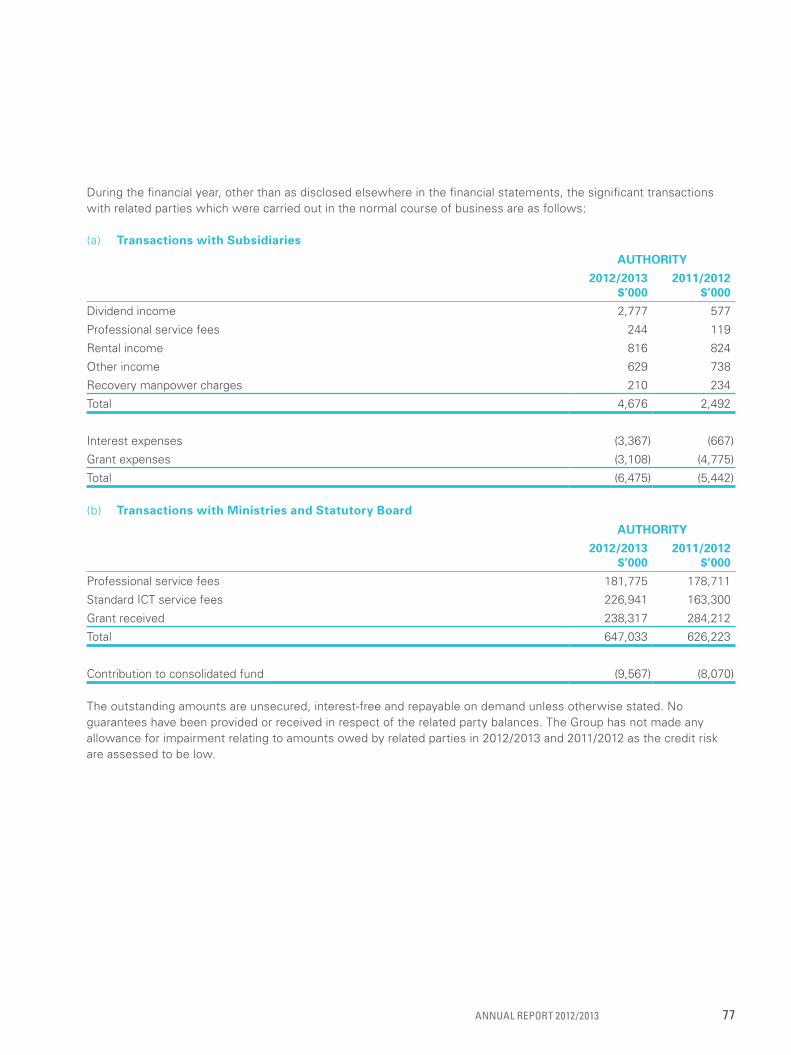
During the financial year, other than as disclosed elsewhere in the financial statements, the significant transactions with related parties which were carried out in the normal course of business are as follows:
(a) transactions with subsidiaries
authorIty
2012/2013$’000
2011/2012$’000
Dividend income 2,777 577
professional service fees 244 119
Rental income 816 824
Other income 629 738
Recovery manpower charges 210 234
Total 4,676 2,492
Interest expenses (3,367) (667)
Grant expenses (3,108) (4,775)
Total (6,475) (5,442)
(b) transactions with ministries and statutory board
authorIty
2012/2013$’000
2011/2012$’000
professional service fees 181,775 178,711
Standard ICT service fees 226,941 163,300
Grant received 238,317 284,212
Total 647,033 626,223
Contribution to consolidated fund (9,567) (8,070)
The outstanding amounts are unsecured, interest-free and repayable on demand unless otherwise stated. no guarantees have been provided or received in respect of the related party balances. The Group has not made any allowance for impairment relating to amounts owed by related parties in 2012/2013 and 2011/2012 as the credit risk are assessed to be low.
AnnuAl RepoRt 2012/2013 77
33 dIvIdendsDuring the financial year ended 31 March 2013, the Authority declared and paid a dividend of $0.4185 per share (total dividend: $7.533 million) on the ordinary shares issued to the Minister for Finance in respect of the financial year ended 31 March 2013. In 2011/2012, the dividend paid was $0.5443 per share (total dividend: $5.988 million).
34 comparatIve InformatIonThe comparative information presented as comparative financial statements were audited by another auditor.
noteS to the fInanCIal StatementS
Infocomm Development AuthorIty of SIngApore78


HeAD oFFICe10 Pasir Panjang Road #10-01Mapletree Business CitySingapore 117438
TeL +65 6211 0888FAx +65 6211 2222eMAIL [email protected] www.ida.gov.sg
Singapore • China • India • Qatar • USA
The Infocomm Development Authority of Singapore (IDA) is commited to growing Singapore into a dynamic global infocomm hub. IDA uses an integrated approach to developing info-communications in Singapore. This involves nurturing a competitive telecoms market as well as a conducive business environment with programmes and schemes for both local and international companies.