financial statements demystified. p 24 summary of the three financial statements cash flow statement...
TRANSCRIPT

financial statements demystified

financial statements demystifiedp 24
Summary of the Three Financial Statements
Cash Flow Statement
Formula P = R - E
where: R is revenue E is expenses
Formula Cash: In (Out)
History of revenueless expenses over
a year
Snapshot atbalance
sheet date
History of cash inless cash out over
a year
Formula L + E = Aor E = A - Lwhere: A is assets L is liabilities E is equity
IncomeStatement
Balance Sheet

financial statements demystified

financial statements demystified
The Accounting Information Flow
Source documents
Journals
General ledger
Trial balance
Y/e adjustments
Reports
Subsidiaryledgers

financial statements demystified

financial statements demystified
Reporting Principles
Top down
Less is more
Eg – A4 overview,
summary level financial statements
Exception reporting,
eg – current ratio reported when under 1.2
(have to trust system)

financial statements demystified
Reporting Principles
Top down
A4 overview includes:
info from 3 financial statements
crucial KPIs

financial statements demystified
Reporting Principles
Top down
Performance dashboard is an automated version
Limit info to key performance elements updated daily
Automate – link to robust, reliable, integrated systems

financial statements demystified
Reporting Principles
Future and Past
Reporting enhanced when:
In context of strategy
5 year corporate plan
Annual financial budget
Actual YTD (& month) IS – also CF forecast, BS, ratios, KPIs
5 year review IS, CF, BS & ratios
Same format for budgets & historic reporting

financial statements demystified
Reporting Principles
Future and Past
Why five years:
Analysts recommend 5 years, 3 minimum
We think better in context
Review budgets in context:
Consider having 3 prior years instead of just last year’s actual
Obtaining more comprehensive reporting:
Add historic YTD cash flow statement reporting
Add views generated through Excel spreadsheets
Obtain assurance
financial statements demystified
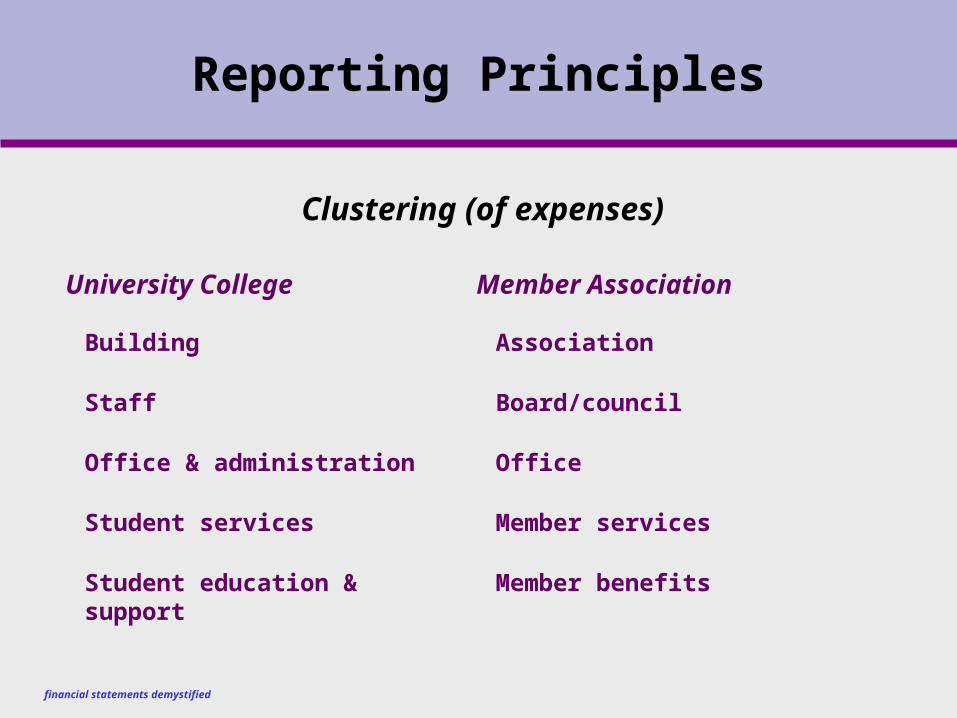
Reporting Principles
Clustering (of expenses)
University College Member Association
Building Association
Staff Board/council
Office & administration Office
Student services Member services
Student education & support Member benefits

financial statements demystified
NFP Example
Annual Budget Regular Reporting
2 pages --- overall explanation / recommendations
3 pages of financial statements --- IS, BS & CF
1 page --- income statement
same format -----
3 pages --- specific commentary on actual variances to budget
11 pages --- explanation of each revenue & expense line
2 pages --- membership generation, surplus history and ratios (graphical form)

financial statements demystified

financial statements demystified
Analysing Financial Statements
Stages of analysis:
1 Review annual report
2 Enter numbers in spreadsheet
3 Analyse performance over time
financial statements demystified
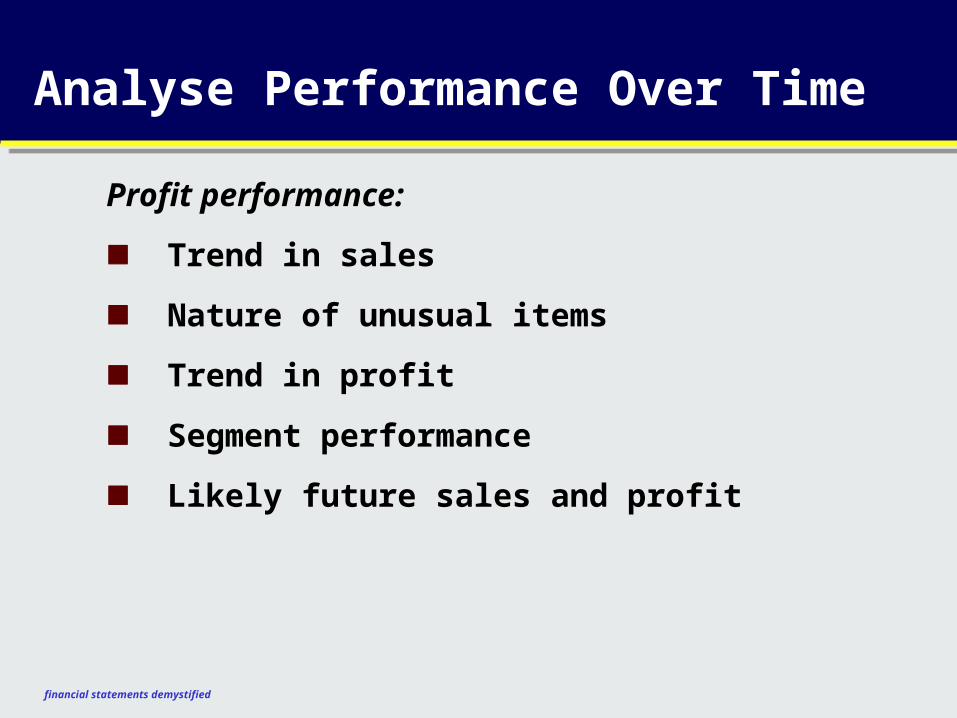
Analyse Performance Over Time
Profit performance:
Trend in sales
Nature of unusual items
Trend in profit
Segment performance
Likely future sales and profit

financial statements demystified
Smith Family - Income StatementYears 2008
$m2009$m
2010$m
2011$m
2012$m
Revenue
Sales 32 29 15 15 16
Government grants 9 9 12 17 17
Fund raising 38 36 37 43 44
Other 7 7 6 7 7
Total revenue 86 81 70 82 84
Expenses
Community programs (37) (38) (41) (51) (54)
Commercial (30) (28) (12) (13) (16)
Fund raising (8) (7) (8) (9) (10)
Positioning (3) (3) (2) (2) (3)
Other (7) (8) (7) (7) (6)
Total expenses (85) (84) (70) (82) (89)
Surplus 1 (3) - - (5)

financial statements demystified
Analyse Performance Over Time
Cash flow performance:
Strength of net operating cash flows
Evidence of self generation: op CF pays for dividends and fixed assets
Financing of expansions and acquisitions
Extent of borrowings and their repayment
Likely future operating cash inflows, self-generation, borrowings and/or cash change
financial statements demystified
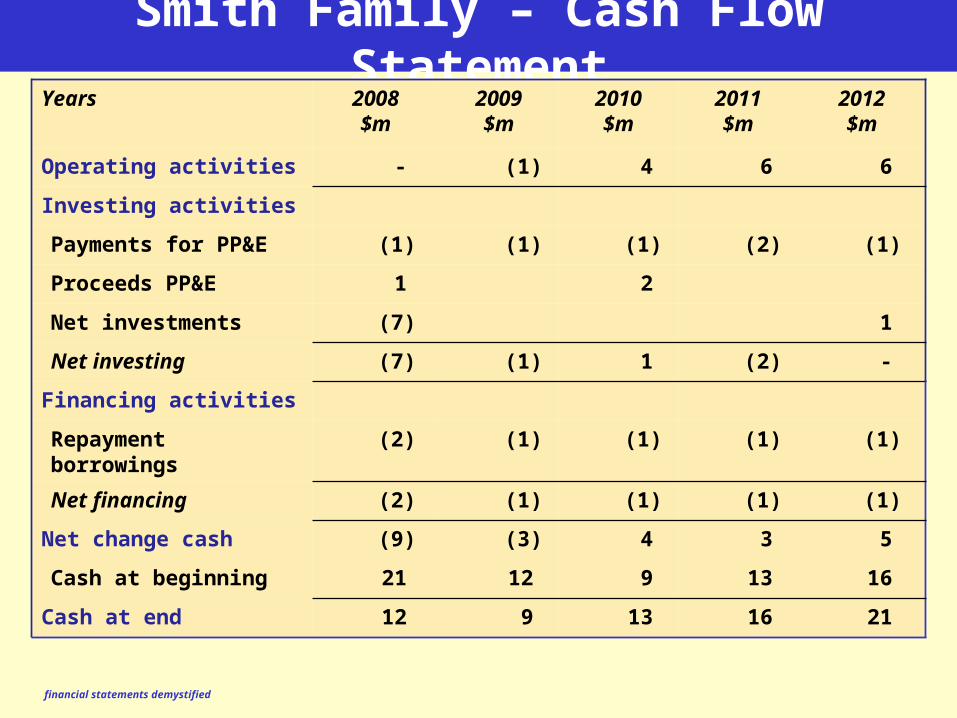
Smith Family – Cash Flow StatementYears 2008
$m2009$m
2010$m
2011$m
2012$m
Operating activities - (1) 4 6 6
Investing activities
Payments for PP&E (1) (1) (1) (2) (1)
Proceeds PP&E 1 2
Net investments (7) 1
Net investing (7) (1) 1 (2) -
Financing activities
Repayment borrowings (2) (1) (1) (1) (1)
Net financing (2) (1) (1) (1) (1)
Net change cash (9) (3) 4 3 5
Cash at beginning 21 12 9 13 16
Cash at end 12 9 13 16 21

financial statements demystified
Analyse Performance Over Time
Balance sheet performance:
Trend in total assets - which assets cause it?
Trend in total liabilities - which liabilities cause it?
Trend in level and elements of equity

financial statements demystified
Smith Family – Balance Sheet
Years 2008$m
2009$m
2010$m
2011$m
2012$m
Assets
Current 23 18 23 26 24
Non-current 23 22 24 19 20
Total assets 46 40 47 45 44
Liabilities
Current 13 12 17 20 23
Non-current 3 2 1 1 1
Total liabilities 16 14 18 21 24
Net assets 30 26 29 24 20
Equity 30 26 29 24 20

financial statements demystified

financial statements demystified
Analyse Performance Over Time
Analysis of ratios - trends in:
Liquidity
Management efficiency
Financing
Profitability
financial statements demystified
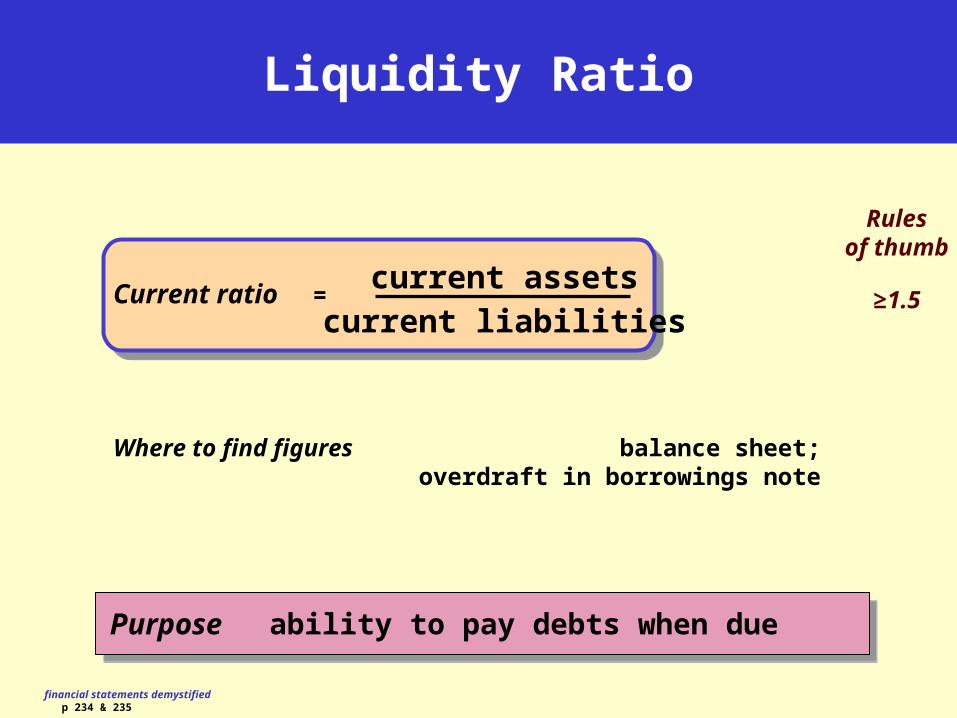
Liquidity Ratio
p 234 & 235
current assetscurrent liabilities
Purpose ability to pay debts when due
Where to find figures balance sheet;overdraft in borrowings note
Current ratio =
Rulesof thumb
≥1.5

financial statements demystified
Liquidity Ratios - Smith Family
Years 2008 2009 2010 2011 2012
Current ratio 1.7 1.5 1.4 1.3 1.0
Years 2008 2009 2010 2011 2012
Current ratio 1.7 1.5 1.4 1.3 1.0
Ruleof thumb
≥1.5

financial statements demystified
Management Efficiency Ratio
p 237, 239, 241, 243
Purpose revenue from assets
Where to find figures balance sheet or notes, and income statement or notes
Asset utilisation =revenueassets
Ruleof thumb
2 for retailer1 for manufacturer

financial statements demystified
Management Efficiency - Smith Family
Ruleof thumb
2 - retailer1 - manuf.
Years 2008 2009 2010 2011 2012
Asset utilisn 1.9 2.0 1.5 1.8 1.9
Years 2008 2009 2010 2011 2012
Asset utilisn 1.9 2.0 1.5 1.8 1.9

financial statements demystified
Financing Ratios
p 244, 247, 248
Interest cover =EBIT
interest expense
Purpose profit to interest, proportions of funding
Where to find figures balance sheet or notes, and income statement or notes
Debt to equity =total liabilities
equity
Interest-bearing debt to equity
interest bearing debtsequity
=
Rulesof thumb
≥3
≤1
≤0.5

financial statements demystified
Financing Ratios – Smith Family
Rulesof thumb
≥3.0
≤1.0
≤0.5
Years 2008 2009 2010 2011 2012
Int cover NM NM NM NM NM
Debt/equity 0.5 0.6 0.6 0.8 1.3
Int bear debt 0.1 0.1 0.1 0.0 0.0
Years 2008 2009 2010 2011 2012
Int cover NM NM NM NM NM
Debt/equity 0.5 0.6 0.6 0.8 1.3
Int bear debt 0.1 0.1 0.1 0.0 0.0
financial statements demystified
Profitability Ratios
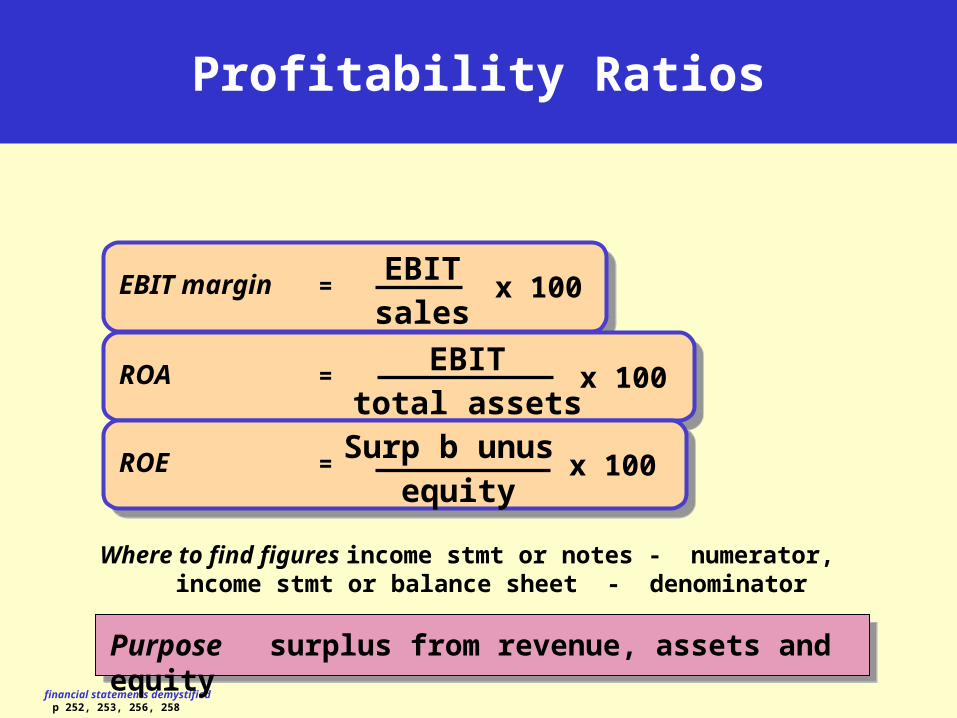
p 252, 253, 256, 258
Purpose surplus from revenue, assets and equity
Where to find figures income stmt or notes - numerator,income stmt or balance sheet - denominator
EBIT margin =EBITsales
x 100
EBITtotal assets
ROA = x 100
ROE =Surp b unus
equityx 100

financial statements demystified
Profitability Ratios - Smith Family
Years 2008 2009 2010 2011 2012
EBIT mgn 1.1% -3.1% 1.1% -0.2% -5.7%
ROA 2.1% -6.2% 1.6% -0.3% -11.0%
ROE 2.4% -10.7% 1.9% -1.1% -25.0%
Years 2008 2009 2010 2011 2012
EBIT mgn 1.1% -3.1% 1.1% -0.2% -5.7%
ROA 2.1% -6.2% 1.6% -0.3% -11.0%
ROE 2.4% -10.7% 1.9% -1.1% -25.0%

financial statements demystified
Size Ratios - Smith Family
Years 2008 2009 2010 2011 2012
Revenue change -5.1% -13.7% 16.2% 3.2%
Assets change -13.1% 18.2% -4.5% -3.2%
Years 2008 2009 2010 2011 2012
Revenue change -5.1% -13.7% 16.2% 3.2%
Assets change -13.1% 18.2% -4.5% -3.2%

financial statements demystified

financial statements demystifiedp 24
Summary of the Three Financial Statements
Cash Flow Statement
Formula P = R - E
where: R is revenue E is expenses
Formula Cash: In (Out)
History of revenueless expenses over
a year
Snapshot atbalance
sheet date
History of cash inless cash out over
a year
Formula L + E = Aor E = A - Lwhere: A is assets L is liabilities E is equity
IncomeStatement
Balance Sheet

financial statements demystified