financial system in russia as compared to other...
TRANSCRIPT
FINANCIAL SYSTEM IN RUSSIA AS COMPARED TO OTHER TRANSITION ECONOMIES: ANGLO-AMERICAN VERSUS GERMAN-JAPANESE MODEL
Vladimir Popov*
ABSTRACT
The type of financial system that emerges in transition economies is a result of path dependent development with an outcome determined primarily by two factors: the chosen model of privatisation and the degree of concentration of the banking system. Due to the specifically transitionary nature of former communist economies, in particular, due to wide scale privatisation that was carried out in these countries during relatively short period of time, chances to develop an American type financial system were generally even worse than in other emerging market economies (i.e. those without communist past).
The only significant exception may be Russia which seems to be drifting in the direction of securities-based financial system due to unique combination of "securities friendly" nature of privatisation (give away of property to work collectives and distribution of vouchers), very decentralised banking system, and the period of very high inflation (1992-95) that undermined bank financing and virtually wiped out long term bank credits.
Cross country comparisons and cross industry comparisons for Russia seem to suggest that bank credit and stock market, contribute to higher investment independently of each other; there is no evidence that bank-based financial system is superior for investment than the market based. Moreover, it appears that Russian banks redistribute funds from strong to weak enterprises, from relatively better off to poorly performing industries and hence do not really contribute to restructuring.
----------------------------------------------------------------------------------------------------* World Institute for Development Economics Research, United Nations University, [email protected]
FINANCIAL SYSTEM IN RUSSIA AS COMPARED TO OTHER TRANSITION ECONOMIES: ANGLO-AMERICAN VERSUS GERMAN-JAPANESE MODEL
Most economists seem to agree that (1) the financial system best suited to the current needs of transition economies is bank-based (i.e. of German-Japanese type), not market-based (Anglo-American type) and that (2) it is exactly this type of a system that emerges in post-communist countries, including Russia (Aoki, 1994; Belyanova, Rozinsky, 1995; Berglof, 1995; Blasi, Kroumova, Kruse, 1996; Filatochev, 1997; Gros and Steinherr, 1997; Kozul-Wright and Rayment, 1997; Litwack, 1995; Sutela, 1996).
The arguments in favour of the bank-based system are usually based on the assumption that it takes a much longer time to develop efficient stock markets than to create a sound banking system (after all, banks existed under socialism, while securities markets did not even in the embryonic form) and that in the absence of well developed stock market banks are in a better position than any other existing institutions to ensure appropriate monitoring of managers and good corporate governance.
There is a different view, however, held by some scholars. Kornai (1990) predicted that institutional investors in former socialist economies will become bureaucratic rather than entrepreneurial. Rostowski (1995) suggests that there is little scope for the development of German style universal banks in transition economies because state owned banks with poor skills to allocate long term credit would fail to exercise tight financial control over borrowers and because bank-based system requires very low rates of inflation which are unlikely to be achieved in transition economies for as much as a decade. Grosfeld (1997) argues that close links between banks and industry in a bank-dominated financial system do not serve well particular needs of transition economies since they do not create appropriate incentives for generation of information about different investment opportunities, and thus hinder rather than facilitate much needed industrial restructuring.
Johnson (1997) states that financial-industrial groups (FIGs) in Russia have yet to prove that they can provide money and leadership for the effective restructuring policies and that it may well be that they have bitten off more than they can chew. Åslund (1998) claims that FIGs control a much smaller part of Russian economy than usually believed, that even new bank-led FIGs are likely to face more problems than fortunes and that more large FIGs will go down soon as market competition gains strength.
It is argued in this article that the type of financial system that emerges in transition economies is not a matter of conscious choice of policy makers based on advantages and disadvantages of respective models. Rather, it is a result of path dependent development with an outcome determined primarily by two factors: the chosen model of privatisation and the degree of concentration of the banking system. Due to the specifically transitionary nature of
2
former communist economies, in particular, due to wide scale privatisation that was carried out in these countries during relatively short period of time, chances to develop an American type financial system were generally even worse than in other emerging market economies (i.e. those without communist past).
The only significant exception may be Russia which seems to be drifting in the direction of securities-based financial system due to unique combination of three factors - "securities friendly" nature of privatisation (give away of property to work collectives and distribution of vouchers), very decentralised banking system, and the period of very high inflation (1992-95) that undermined bank financing and virtually wiped out long term bank credits.
The impact of the financial system on investment is being examined by comparing the performance of different transition economies and by looking at performance of Russian enterprises using bank credit. No evidence is found to support the claim that bank-based system provides better opportunities for investment and output expansion than the market-based system.
Two types of financial systems: pros and cons
Though in recent decades two systems of corporate financing and control were converging rather than diverging, substantial differences still persist.
First, in Japan, Germany and other continental European countries several major shareholders, normally banks, typically hold a substantial portion of total equity, whereas in Britain, U.S. and Canada stock ownership is much more dispersed. In a sense large shareholders, i.e. stakeholders, in the German-Japanese system have a more secure and stronger control over companies: hostile takeovers and leveraged buy-outs reflect the absence of the insiders control on management and are common in the U.S. , but not in continental Europe and Japan (Pohl, Jedrzejczak, and Anderson, 1995).
Japanese (European) model implies that several major banks ("big three", "big five", whatever) control the major part of total credits and are in a position to influence investment decisions of non-financial companies. While in the U.S. 50% of common stock are owned by individuals, in Japan and Germany only 22% and 17% respectively belong to individuals1, while companies/institutions control 73% and 64% of all stocks (banks alone control 19% and 10% respectively) (Blasi, Kroumova, Kruse, 1996, p. 211). Commercial banking is separated from investment banking in the market-based model (in the United States until recently banks were prohibited by law to invest into stocks).
Second, in Anglo-American system corporations rely more on internal sources of funds, and hence are more independent from large banks: in 1970-85 these sources accounted
1 In Britain, Italy, France the share of individual shareholders is less than 20% (Economist, Dec. 2, 1995).
3
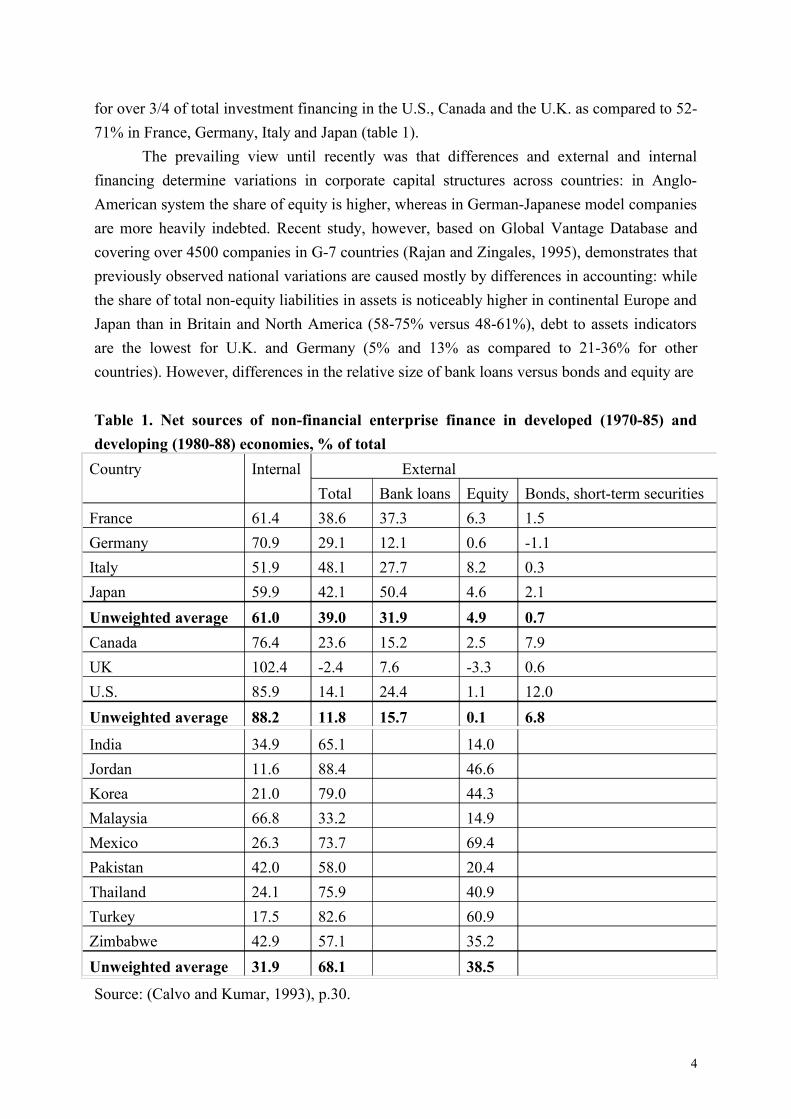
for over 3/4 of total investment financing in the U.S., Canada and the U.K. as compared to 52-71% in France, Germany, Italy and Japan (table 1).
The prevailing view until recently was that differences and external and internal financing determine variations in corporate capital structures across countries: in Anglo-American system the share of equity is higher, whereas in German-Japanese model companies are more heavily indebted. Recent study, however, based on Global Vantage Database and covering over 4500 companies in G-7 countries (Rajan and Zingales, 1995), demonstrates that previously observed national variations are caused mostly by differences in accounting: while the share of total non-equity liabilities in assets is noticeably higher in continental Europe and Japan than in Britain and North America (58-75% versus 48-61%), debt to assets indicators are the lowest for U.K. and Germany (5% and 13% as compared to 21-36% for other countries). However, differences in the relative size of bank loans versus bonds and equity are
Table 1. Net sources of non-financial enterprise finance in developed (1970-85) and developing (1980-88) economies, % of total
Country Internal ExternalTotal Bank loans Equity Bonds, short-term securities
France 61.4 38.6 37.3 6.3 1.5Germany 70.9 29.1 12.1 0.6 -1.1Italy 51.9 48.1 27.7 8.2 0.3Japan 59.9 42.1 50.4 4.6 2.1Unweighted average 61.0 39.0 31.9 4.9 0.7Canada 76.4 23.6 15.2 2.5 7.9UK 102.4 -2.4 7.6 -3.3 0.6U.S. 85.9 14.1 24.4 1.1 12.0Unweighted average 88.2 11.8 15.7 0.1 6.8
India 34.9 65.1 14.0Jordan 11.6 88.4 46.6Korea 21.0 79.0 44.3Malaysia 66.8 33.2 14.9Mexico 26.3 73.7 69.4Pakistan 42.0 58.0 20.4Thailand 24.1 75.9 40.9Turkey 17.5 82.6 60.9Zimbabwe 42.9 57.1 35.2Unweighted average 31.9 68.1 38.5
Source: (Calvo and Kumar, 1993), p.30.
4
well pronounced: the study concludes that the difference between bank oriented countries and market oriented countries is reflected more in the choice of public (stocks and bonds) and private financing (bank loans) than in the amount of leverage.
Hence, the third difference between the two types of financial system - the share of external financing provided by banks is usually greater in continental Europe and Japan, whereas American companies derive more funds from sales of securities. In the U.S. and Canada bonds, short term securities and shares provide funds equivalent to 50-75% of sums borrowed from banks, in Japan and continental Europe - less than 30% (table 1).
It is also argued that countries with English common law system that provides the best protection of individual shareholders rights (Britain and its former colonies, including U.S. , Canada, Australia, Hong Kong and Singapore) have deeper and more liquid stock markets than civil law countries (especially those with French civil law system, including Indonesia, Mexico and Spain). Market capitalisation in the common law countries in 1994 stood at 60% of GDP, there were 35 listed companies and 2.2 initial public offerings (IPOs) of new shares per 1 million inhabitants as compared to 21% of GDP, 10 listed companies and 0.19 IPOs in French civil law states (La Porta, Lopez-de-Silanes, Shleifer and Vishny cited in Economist, April 19, 1997).
Finally, fourth, banking system in the U.S. is much less concentrated than in all other Western countries, where it is dominated by "big three" or "big five" largest banks.
The net outcome of these differences is not so easy to summarise. Normally financial system based on strong securities market is considered to be more flexible and better suited for risky projects. Banks do not enjoy the position of strength vis-à-vis non-financial corporations, which rely mostly on internal sources of financing (undistributed profits + depreciation), whereas external sources are less important and include mostly sales of securities, not bank credits. The result is that there is no bank monopoly on financing: even when banks refuse to finance particular project, it may still be carried out.
On the contrary, the Japanese (European) model implies that banks and financial institutions are in a position to influence investment decisions of non-financial companies. Both models have their advantages and limitations: American model is usually perceived as a more competitive one, whereas Euro-Japanese model - as the one that allows to reduce risk, bankruptcies and instability (but at a price of not undertaking risky projects at all).
Basically the difference between the bank-based and the security-based financial system is the difference between the centralised and decentralised one. The centralised institution-based system is superior for mobilising financing for large scale long term projects that will yield results only some time in the future, but is not so well suited for the evaluation and financing of millions of short and medium term risky projects. The decentralised securities-based system puts a price tag on every project (through pricing them in the stock
5

market), but the risk is being born by investors themselves, not by intermediaries (banks).American managers used to envy their Japanese counterparts that were able to get the
steady financing of the projects from banks and to ignore the minority shareholders by not paying high dividends for long periods of time. However Japanese investors were envious about greater variety of opportunities provided by the American system. While in the securities based system risk is priced by the market itself, in the institution based system investment projects are evaluated by banks, which have usually more conservative attitude towards risk taking. The probability and costs of failure are greater in the American system, but prospects for and benefits of carrying out risky profitable projects are greater as well.
To obtain equity capital a company should not necessarily possess an equivalent base of assets as security or a history of past dividend payment. Hence, newly emerging enterprises and industries tend to rely to a greater extent on equity financing rather than on debt. As Thomas (1978) shows, in Britain in between the two world wars new industries, like oil, vehicles and aviation, tended to use equity finance, whereas traditional heavy industries, such as iron and steel and shipbuilding, relied more heavily on debt borrowing.
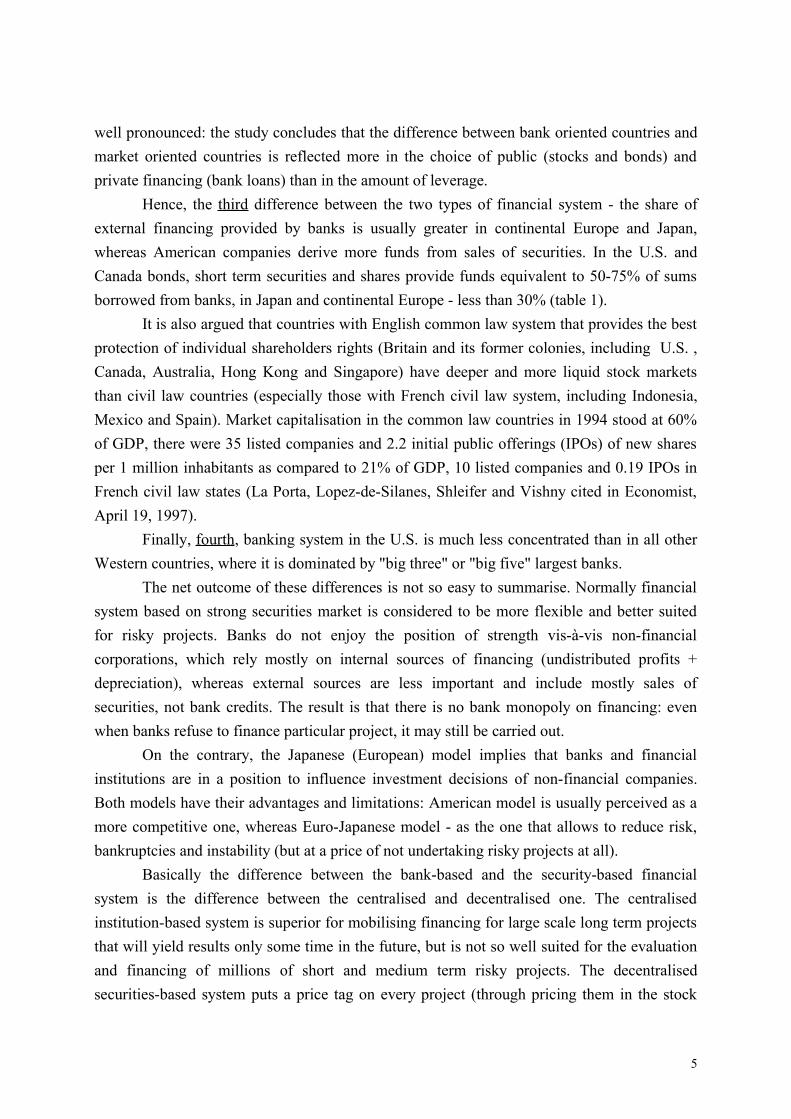
In market economies bank credits and equity financing compliment rather than substitute each other: normally, the larger bank credits, the higher the market capitalisation (fig. 1). It was shown that both - greater stock market liquidity and deeper banking system -contribute to higher rates of capital accumulation and economic growth independently of each other2. Moreover, in developing countries greater stock market liquidity is linked to a rise in the amount of capital raised through bonds and bank loans, so that corporate debt-equity ratios rise with market liquidity (Levine, 1996).
Nevertheless, it is meaningful that in Japan and in most West European countries market capitalisation is two and more times lower than total bank credits, whereas in the U.S., UK, Netherlands and Switzerland, as well as in some developing countries (Malaysia, Singapore, South Africa, Chile, Philippines) market capitalisation is roughly comparable with total domestic credit provided by the banking sector (fig. 1).
In emerging market economies without communist past the share of external financing is typically very high - over 50% or much higher than in mature market economies. The share of equity financing in total external financing is also high - over half of external financing, or over 1/3 of the total financing, which again is much higher than in Western countries. For instance, in Jordan, Korea, Mexico, Thailand, Turkey the share of equity financing alone in 1980-88 was in the range of 40 to 70%, and in India, Malaysia, Pakistan and Zimbabwe - in the range of 14 to 35% (table 1). In contrast, in transition economies the share of external sources (excluding government financing) seem to be quite low, while internal sources and government funds account from 2/3 to over 100% (EBRD, 1995, p. 93-95).
2 Some studies seem to suggest that stock market turnover (but not market capitalisation) is a more important variable in explaining better berformance of firms than bank credit/GDP ratio (Demirguc-Kunt, Maksimovic, 1996).
6
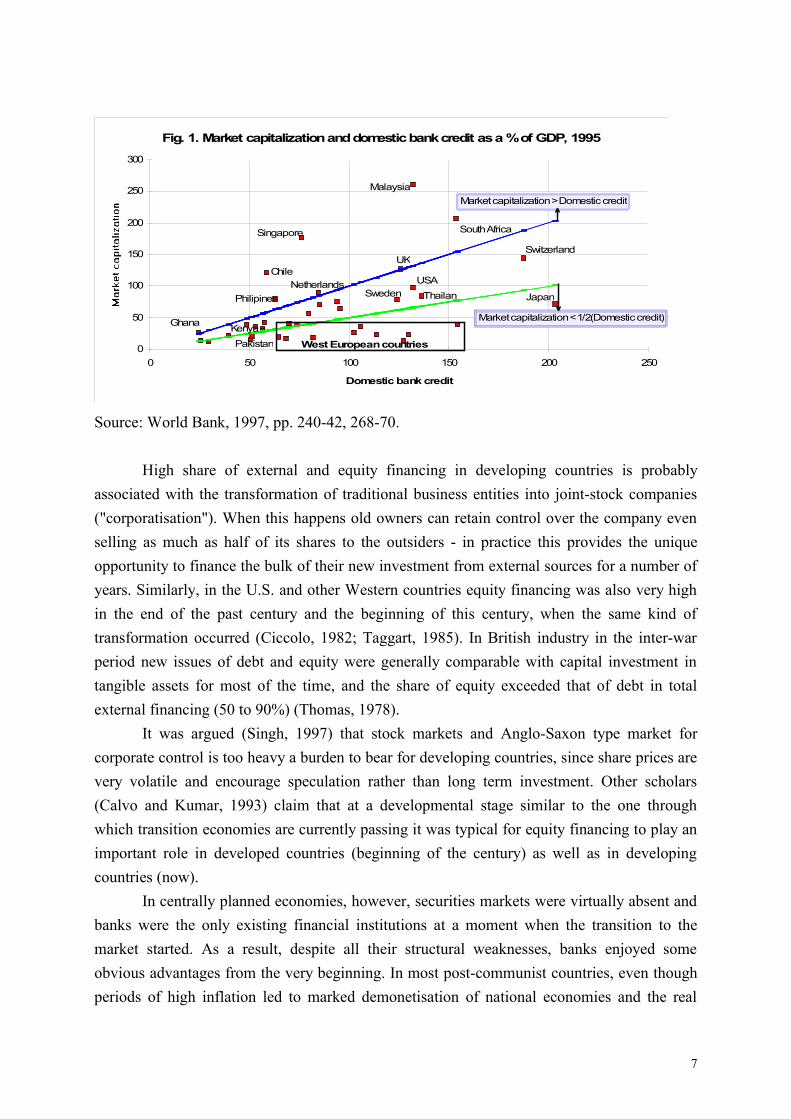
Fig. 1. Market capitalization and domestic bank credit as a % of GDP, 1995
0
50
100
150
200
250
300
0 50 100 150 200 250
Domestic bank credit
Malaysia
South AfricaSingapore
ChileUK
USANetherlands
Ghana
Philipines
Switzerland
Japan
West European countriesKenyaPakistan
Sweden Thailand
Market capitalization > Domestic credit
Market capitalization < 1/2(Domestic credit)
Source: World Bank, 1997, pp. 240-42, 268-70.
High share of external and equity financing in developing countries is probably associated with the transformation of traditional business entities into joint-stock companies ("corporatisation"). When this happens old owners can retain control over the company even selling as much as half of its shares to the outsiders - in practice this provides the unique opportunity to finance the bulk of their new investment from external sources for a number of years. Similarly, in the U.S. and other Western countries equity financing was also very high in the end of the past century and the beginning of this century, when the same kind of transformation occurred (Ciccolo, 1982; Taggart, 1985). In British industry in the inter-war period new issues of debt and equity were generally comparable with capital investment in tangible assets for most of the time, and the share of equity exceeded that of debt in total external financing (50 to 90%) (Thomas, 1978).
It was argued (Singh, 1997) that stock markets and Anglo-Saxon type market for corporate control is too heavy a burden to bear for developing countries, since share prices are very volatile and encourage speculation rather than long term investment. Other scholars (Calvo and Kumar, 1993) claim that at a developmental stage similar to the one through which transition economies are currently passing it was typical for equity financing to play an important role in developed countries (beginning of the century) as well as in developing countries (now).
In centrally planned economies, however, securities markets were virtually absent and banks were the only existing financial institutions at a moment when the transition to the market started. As a result, despite all their structural weaknesses, banks enjoyed some obvious advantages from the very beginning. In most post-communist countries, even though periods of high inflation led to marked demonetisation of national economies and the real
7
volume of bank credits fell drastically (fig. 4), banks remained a relatively more important source of capital financing (as compared to securities markets). Market capitalisation currently stays at a level of below 10% of GDP, whereas bank credits amount to several dozen percent of GDP (table 4, 8).
The World Bank is more inclined to support the bank-based financial system for transition economies on the grounds that securities markets in these countries are weak and do not operate properly (World Bank, 1996, p. 104; Stiglitz, 1995). Banks, however, do not perform their functions properly as well. Many transition countries from the Baltic states to Bulgaria and from Russia to Czech Republic went through banking crises in recent years and the share of overdue loans in their assets is high. Russian banking in particular is especially different from Western style banking - the bulk of the Russian banking activity until recently was concentrated in processing payments, not in attracting deposits and issuing credits. Even after the creation of bank-based FIGs in recent years, it does not appear that banks are becoming long-term strategic stockholders of non-financial companies.
Privatisation schemes and financial system
The drama of privatisation in post-communist economies is driven by the huge gap between the demand for and the supply of assets. The approximate supply of assets - the book value of property to be privatised, however uncertain the estimates of the book value are, - is comparable to the size of annual GDP; the approximate domestic demand for assets is equal at best several percent of GDP because it is financed from the limited pool of national savings, which altogether usually amount to 20-30% of GDP and are mostly absorbed by investment, government budget deficit, and current account surplus.
Theoretically, proceeds from sales of state property may be used to replace tax revenues of the state: by lowering taxes the government may yield room for private investors to increase savings and to spend more on acquiring shares of state enterprises. In practice, however, savings and taxes are not substitutes and the abilities of the government to boost savings rate through lowering taxes are at best limited (Schmidt-Hebbel, Serven, Solimano, 1996).
It is only the inflow of foreign capital that can make a difference and contribute substantially to the higher demand for assets, especially in small countries. Until now it was significant only in China and Hungary (accumulated FDI by 1997 equivalent to 30% of GDP) and, perhaps, in Czech Republic and Estonia (16% and 18% of GDP respectively), but not significant enough to compensate for the low domestic demand for assets in other countries.
Due to this discrepancy between the supply of and the demand for property, under all fast privatisation programs (carried out in several years) assets are generally underpriced - their market value tend to be significantly lower than their book value. Since book value in
8
economies in transition cannot be measured properly (because it is based on prices established by the planners, which do not reflect replacement costs) market value of privatised companies is usually compared with annual sales, production capacities, stocks of mineral deposits, etc. In all cases, however, the result is pretty much the same: relative (unit) capitalisation of companies in transition economies was usually lower than that of their Western counterparts. This is hardly surprising since even privatisation of large state companies in Western countries may disrupt the stock market if carried out too quickly.
Privatisation revenues in transition economies in the first half of the 1990s, during the massive sell-out of state property, were of the magnitude of several percent of GDP - quite comparable with the revenues from privatisation in major developing countries, where the share of state property sold to private investors was nowhere near to that in post-communist countries (fig. 2).
HungarySlovakia (1993-95)
Czech Rep.(1993-95)Bulgaria (1993-95)
PolandEstonia (1993-95)
Lithuania (1994-95)China (1991-95)
Russia (1991-93, 1995)Zimbabwe (1994-95)
MalaysiaArgentina
MexicoPhilippines (1991-95)
TurkeyEgypt (1993-95)
PakistanNigeria
BrazilIndonesia (1991-95)
India (1991-95)
0 0.5 1 1.5 2 2.5 3 3.5
% of GDP
F ig . 2 . P riva t isa t ion re ve n ue s in de ve lop ing a ndtra nsit ion e co nom ie s, % o f G D P (1 9 9 0 -9 5 a nnua l
a ve ra ge s)
DEVELOPING COUNTRIES
TRANSIT ION ECONOMIES
Source: Global Development Finance 1997. Vol. 1. Analysis and Summary Tables. World Bank, Wash. D.C., 1997, pp. 116-120; Emerging Stock Markets Factbook 1997. IFC, Wash., D.C., 1997; Sutela, 1996.
9
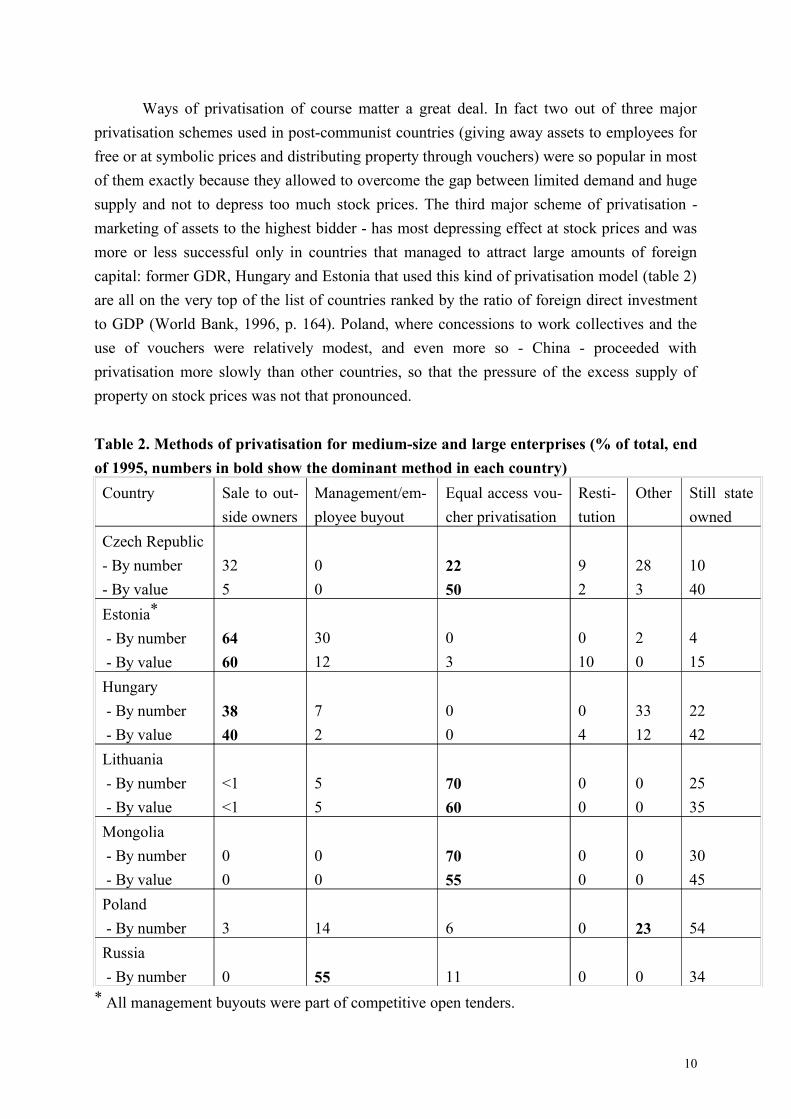
Ways of privatisation of course matter a great deal. In fact two out of three major privatisation schemes used in post-communist countries (giving away assets to employees for free or at symbolic prices and distributing property through vouchers) were so popular in most of them exactly because they allowed to overcome the gap between limited demand and huge supply and not to depress too much stock prices. The third major scheme of privatisation - marketing of assets to the highest bidder - has most depressing effect at stock prices and was more or less successful only in countries that managed to attract large amounts of foreign capital: former GDR, Hungary and Estonia that used this kind of privatisation model (table 2) are all on the very top of the list of countries ranked by the ratio of foreign direct investment to GDP (World Bank, 1996, p. 164). Poland, where concessions to work collectives and the use of vouchers were relatively modest, and even more so - China - proceeded with privatisation more slowly than other countries, so that the pressure of the excess supply of property on stock prices was not that pronounced.
Table 2. Methods of privatisation for medium-size and large enterprises (% of total, end of 1995, numbers in bold show the dominant method in each country)Country Sale to out-
side ownersManagement/em-ployee buyout
Equal access vou-cher privatisation
Resti-tution
Other Still state owned
Czech Republic- By number- By value
325
00
2250
92
283
1040
Estonia*
- By number - By value
6460
3012
03
010
20
415
Hungary - By number - By value
3840
72
00
04
3312
2242
Lithuania - By number - By value
<1<1
55
7060
00
00
2535
Mongolia - By number - By value
00
00
7055
00
00
3045
Poland - By number 3 14 6 0 23 54Russia - By number 0 55 11 0 0 34
* All management buyouts were part of competitive open tenders.
10
Source: From Plan to Market. World Development Report. World Bank, 1996, p.53.
It is quite meaningful that state revenues from privatisation in Slovakia and in Czech Republic, where the bulk of total state property was "voucherised" and only a very minor part was actually sold for cash (table 2), were nearly as high as in Hungary (3% of GDP annually in the first half of the 1990s), which sold nearly all assets at auctions and enjoyed the highest inflow of foreign capital and several times higher than in Poland, selling state assets at market prices and relatively slowly (fig. 2). Similarly, direct privatisation income in Lithuania that used the voucher scheme on a widest scale and Estonia that followed the German model and carried out the Treuhand-type privatisation (table 2) was roughly the same (0.4% of GDP annually in 1993-95) (Sutela, 1996).
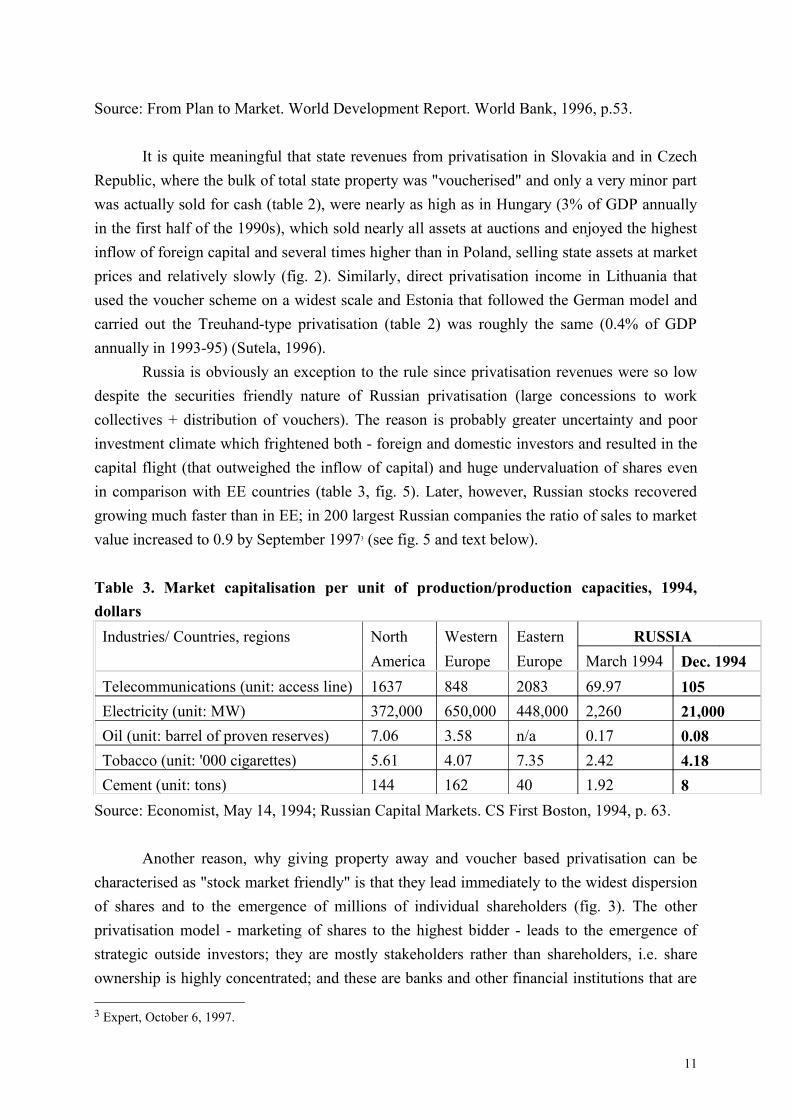
Russia is obviously an exception to the rule since privatisation revenues were so low despite the securities friendly nature of Russian privatisation (large concessions to work collectives + distribution of vouchers). The reason is probably greater uncertainty and poor investment climate which frightened both - foreign and domestic investors and resulted in the capital flight (that outweighed the inflow of capital) and huge undervaluation of shares even in comparison with EE countries (table 3, fig. 5). Later, however, Russian stocks recovered growing much faster than in EE; in 200 largest Russian companies the ratio of sales to market value increased to 0.9 by September 19973 (see fig. 5 and text below).
Table 3. Market capitalisation per unit of production/production capacities, 1994, dollars Industries/ Countries, regions North Western Eastern RUSSIA
America Europe Europe March 1994 Dec. 1994Telecommunications (unit: access line) 1637 848 2083 69.97 105Electricity (unit: MW) 372,000 650,000 448,000 2,260 21,000Oil (unit: barrel of proven reserves) 7.06 3.58 n/a 0.17 0.08Tobacco (unit: '000 cigarettes) 5.61 4.07 7.35 2.42 4.18Cement (unit: tons) 144 162 40 1.92 8
Source: Economist, May 14, 1994; Russian Capital Markets. CS First Boston, 1994, p. 63.
Another reason, why giving property away and voucher based privatisation can be characterised as "stock market friendly" is that they lead immediately to the widest dispersion of shares and to the emergence of millions of individual shareholders (fig. 3). The other privatisation model - marketing of shares to the highest bidder - leads to the emergence of strategic outside investors; they are mostly stakeholders rather than shareholders, i.e. share ownership is highly concentrated; and these are banks and other financial institutions that are
3 Expert, October 6, 1997.
11
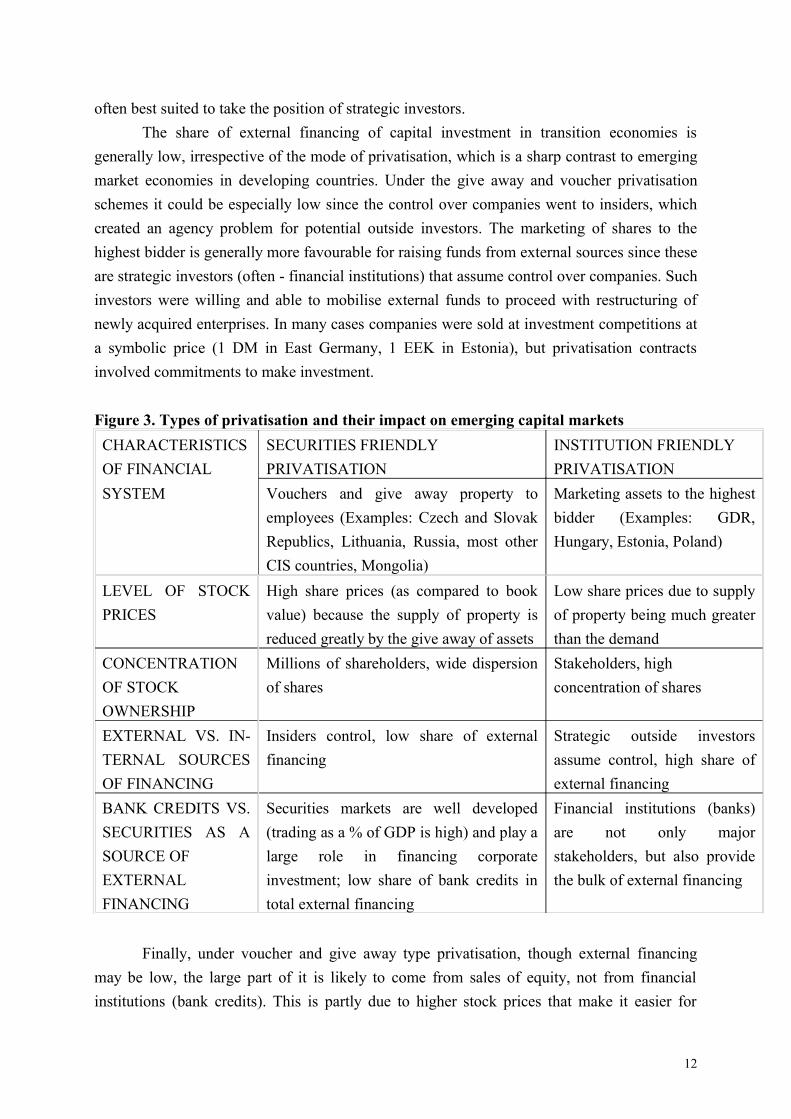
often best suited to take the position of strategic investors. The share of external financing of capital investment in transition economies is
generally low, irrespective of the mode of privatisation, which is a sharp contrast to emerging market economies in developing countries. Under the give away and voucher privatisation schemes it could be especially low since the control over companies went to insiders, which created an agency problem for potential outside investors. The marketing of shares to the highest bidder is generally more favourable for raising funds from external sources since these are strategic investors (often - financial institutions) that assume control over companies. Such investors were willing and able to mobilise external funds to proceed with restructuring of newly acquired enterprises. In many cases companies were sold at investment competitions at a symbolic price (1 DM in East Germany, 1 EEK in Estonia), but privatisation contracts involved commitments to make investment.
Figure 3. Types of privatisation and their impact on emerging capital markets CHARACTERISTICS OF FINANCIAL
SECURITIES FRIENDLY PRIVATISATION
INSTITUTION FRIENDLY PRIVATISATION
SYSTEM Vouchers and give away property to employees (Examples: Czech and Slovak Republics, Lithuania, Russia, most other CIS countries, Mongolia)
Marketing assets to the highest bidder (Examples: GDR, Hungary, Estonia, Poland)
LEVEL OF STOCK PRICES
High share prices (as compared to book value) because the supply of property is reduced greatly by the give away of assets
Low share prices due to supply of property being much greater than the demand
CONCENTRATION OF STOCK OWNERSHIP
Millions of shareholders, wide dispersion of shares
Stakeholders, high concentration of shares
EXTERNAL VS. IN-TERNAL SOURCES OF FINANCING
Insiders control, low share of external financing
Strategic outside investors assume control, high share of external financing
BANK CREDITS VS. SECURITIES AS A SOURCE OF EXTERNAL FINANCING
Securities markets are well developed (trading as a % of GDP is high) and play a large role in financing corporate investment; low share of bank credits in total external financing
Financial institutions (banks) are not only major stakeholders, but also provide the bulk of external financing
Finally, under voucher and give away type privatisation, though external financing may be low, the large part of it is likely to come from sales of equity, not from financial institutions (bank credits). This is partly due to higher stock prices that make it easier for
12
companies to proceed with secondary issues of shares. Another explanation may be the faster emergence of securities markets due to widely dispersed share ownership. On the contrary, marketing of assets to the highest bidder creates problems with raising funds through equity financing: stock prices get depressed due to excess supply of assets, and the development of stock markets is also held back by the domination of stakeholders.
To sum up, voucher and give away type of privatisation may be tentatively characterised as being "securities markets friendly" (Anglo-American type of financial system), whereas direct marketing of assets to the highest bidder, other conditions being equal, favours the emergence of the institution-based financial system of German-Japanese type (fig. 3).
The pattern of actual developments is nevertheless somewhat different: virtually in all countries, including those that followed securities friendly privatisation schemes (with the only possible exception of Russia) the emerging financial systems tend to gravitate to the German-Japanese model. This suggests that there are other important factors shaping the development of financial markets. Among those the strength and the concentration of the banking system seem to be a crucial one and is discussed in the next section.
Banking system
In most post-communist countries banks remained a relatively more important source of capital financing (as compared to securities markets) during transition: market capitalisation normally stays at a level of below 10% of GDP, whereas bank credits amount to several dozen percent of GDP (table 4, 8, fig. 4).
The Russian banking sector, however, seems to be the weakest among all those in economies in transition. Back in Soviet times total bank credit to enterprises exceeded half of GDP, with long term credits alone amounting to 12% of GDP. After deregulation of prices in 1992 the demonetisation of the economy proceeded surprisingly quickly: total bank credits outstanding fell to about 10% of GDP by the end of 1996, while the long term credits shrank to less than 1% of GDP (fig. 4)4. When the possibility of the bank crisis was discussed in summer 1996 the frequently made argument was that the total bank assets are so small as compared to the size of the economy that even the collapse of major banks will not become a disaster.
True, in Russia, as well as in other post-communist economies banking very early became one of the few growing sectors - they expanded even in the midst of the transformational recession, hiring new employees and opening new offices. The GDP created in banking, finance and insurance grew by 57% in 1991-94, while the total GDP decreased by
4 Total assets of Russian banks may be as much as two times lower than the official statistics suggests, if international accounting standards (excluding double count) are applied (Finansoviye Izvestiya, November 18, 1997).
13
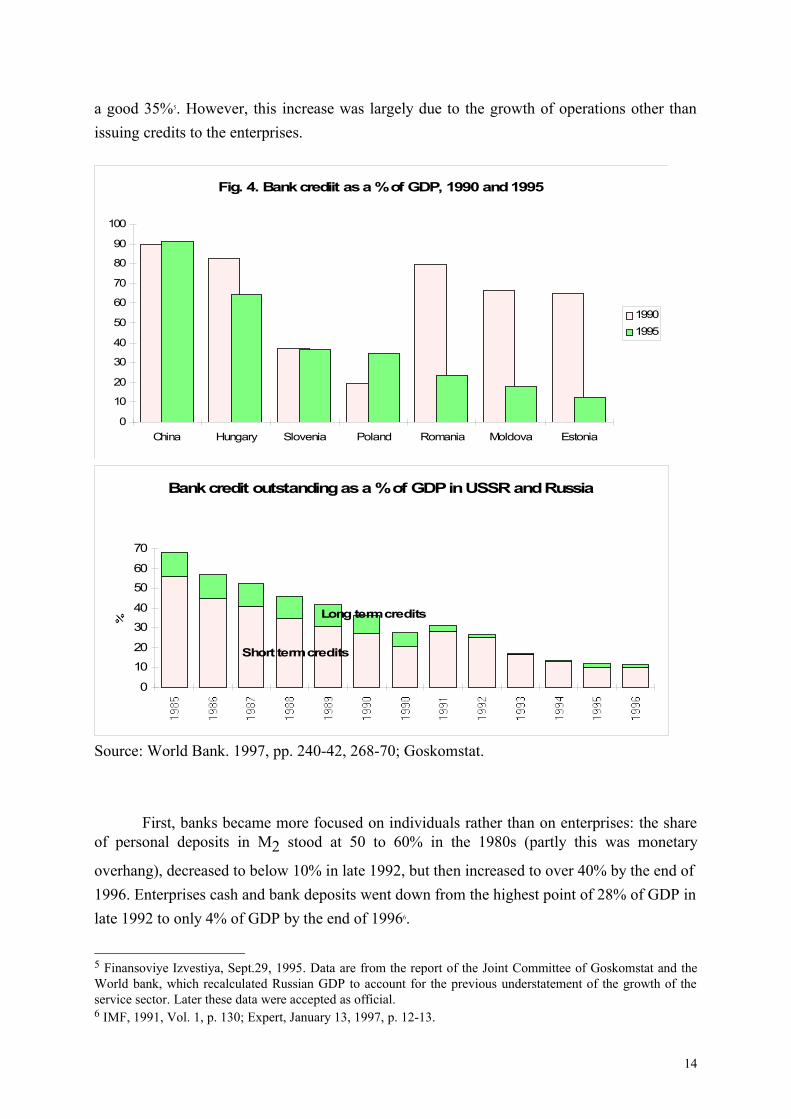
a good 35%5. However, this increase was largely due to the growth of operations other than issuing credits to the enterprises.
Fig. 4. Bank crediit as a % of GDP, 1990 and 1995
0
10
20
30
40
50
60
70
80
90
100
China Hungary Slovenia Poland Romania Moldova Estonia
19901995
Bank credit outstanding as a % of GDP in USSR and Russia
0
10
20
30
40
50
60
70
Long term credits
Short term credits
Source: World Bank. 1997, pp. 240-42, 268-70; Goskomstat.
First, banks became more focused on individuals rather than on enterprises: the share of personal deposits in M2 stood at 50 to 60% in the 1980s (partly this was monetary
overhang), decreased to below 10% in late 1992, but then increased to over 40% by the end of 1996. Enterprises cash and bank deposits went down from the highest point of 28% of GDP in late 1992 to only 4% of GDP by the end of 19966.
5 Finansoviye Izvestiya, Sept.29, 1995. Data are from the report of the Joint Committee of Goskomstat and the World bank, which recalculated Russian GDP to account for the previous understatement of the growth of the service sector. Later these data were accepted as official.6 IMF, 1991, Vol. 1, p. 130; Expert, January 13, 1997, p. 12-13.
14
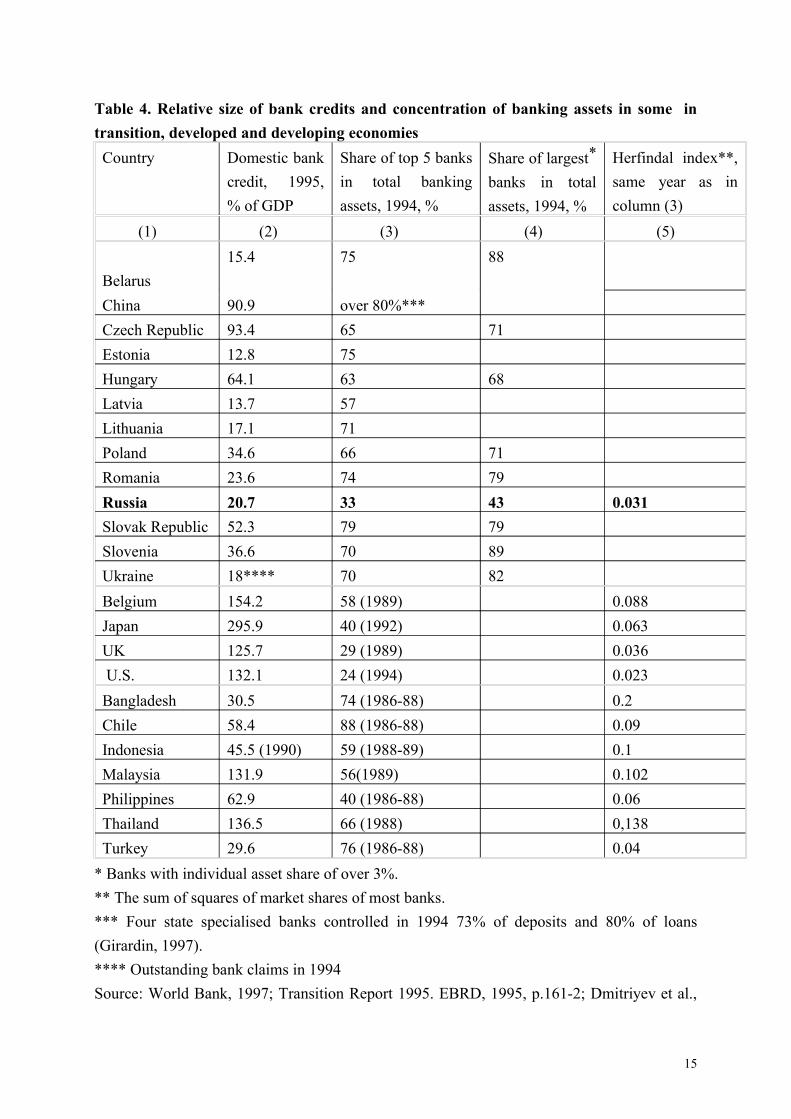
Table 4. Relative size of bank credits and concentration of banking assets in some in transition, developed and developing economiesCountry Domestic bank
credit, 1995, % of GDP
Share of top 5 banks in total banking assets, 1994, %
Share of largest*
banks in total assets, 1994, %
Herfindal index**, same year as in column (3)
(1) (2) (3) (4) (5)
Belarus15.4 75 88
China 90.9 over 80%*** Czech Republic 93.4 65 71Estonia 12.8 75Hungary 64.1 63 68Latvia 13.7 57Lithuania 17.1 71Poland 34.6 66 71Romania 23.6 74 79Russia 20.7 33 43 0.031Slovak Republic 52.3 79 79Slovenia 36.6 70 89Ukraine 18**** 70 82Belgium 154.2 58 (1989) 0.088Japan 295.9 40 (1992) 0.063UK 125.7 29 (1989) 0.036 U.S. 132.1 24 (1994) 0.023Bangladesh 30.5 74 (1986-88) 0.2Chile 58.4 88 (1986-88) 0.09Indonesia 45.5 (1990) 59 (1988-89) 0.1Malaysia 131.9 56(1989) 0.102Philippines 62.9 40 (1986-88) 0.06Thailand 136.5 66 (1988) 0,138Turkey 29.6 76 (1986-88) 0.04
* Banks with individual asset share of over 3%.** The sum of squares of market shares of most banks.*** Four state specialised banks controlled in 1994 73% of deposits and 80% of loans (Girardin, 1997).**** Outstanding bank claims in 1994 Source: World Bank, 1997; Transition Report 1995. EBRD, 1995, p.161-2; Dmitriyev et al.,
15

1996; Data for Baltic states on banking concentration are from: Hansson and Tombak, 1996. Table 5. Balance sheet of commercial banks in 1992, billion roublesASSETS Jan. 1 May 1Credits: short-term 395 850Credits: long-term 40 50Inter-bank credits 15 25Cash 5 7Correspondents account 130 110Foreign currency 5 445Precious metals 0 10Others 40 168Total 630 1665LIABILITIESFounding capital 43 76Deposits (roubles) 315 475Deposits (foreign currency) 3 390Loans from banksa 190 460Government loansb 45 110Others 34 154Total 630 1665
a Mainly from CBR and Sberbank. b From republican and local authorities.Source: Economist, July 18, 1992.
Second, currently bank operations with enterprises are focused mostly on processing payments, not on issuing credits. Initially, in 1992-94, newly created weak banks survived only because they were able to get huge credits from the CBR - Central Bank of Russia (table 5). Commercial banks formed out of regional branches of specialised banks acted in fact as "channel banks": a good part of their liabilities were credits from CBR intended for specific industrial enterprises. To be eligible for such a centralised (CBR's) credit an enterprise was supposed to apply to the respective industrial department that in its turn applied to Inter-Agency Commission on Credits. If the application was approved, the CBR issued credit to the commercial bank from which the enterprise was willing to get this credit. Normally these were ex-specialised banks providing services to that particular enterprise before transition and continuing to do so afterwards.
In late 1992, CBR's credits to commercial banks amounted to 30-40% of total credits outstanding to enterprises, and, perhaps, to over 50% of total credits of "channel banks". For "channel banks" these CBR credits were more important sources of funds than deposits of
16
enterprises and households and inter-bank credits.On the asset side of the balance sheet, the most striking disproportion was the high
share of total assets invested into hard currency (at that time the rapidly growing exchange rate of the dollar in roubles provided greater real returns than interest charged on rouble credits). Unlike Western banks, Russian commercial banks were mostly borrowing long-term and lending short-term: long-term loans constituted only a very small portion of their total assets (table 5).
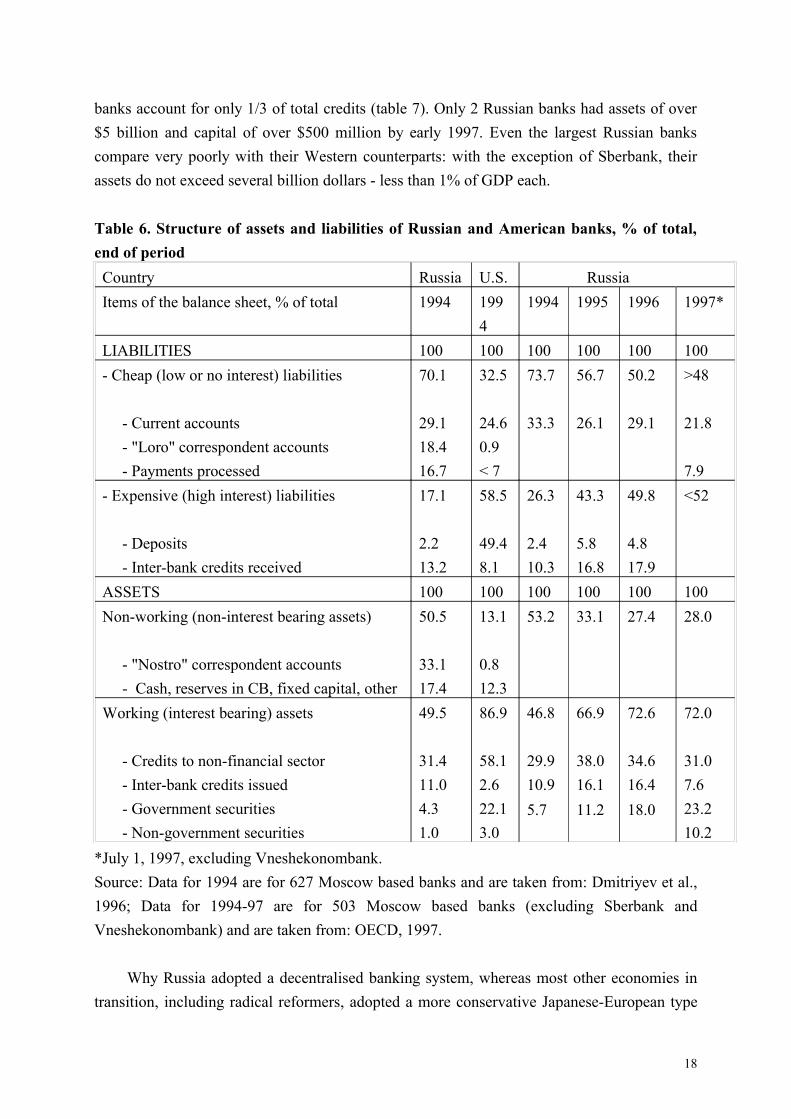
Later the CBR stopped issuing credits to enterprises through commercial banks, inflation slowed down and the share of assets invested in hard currency decreased7. However, these changes only revealed the real structural weaknesses of the Russian banking sector. It turned out that bank services to enterprises are more centred not on accepting deposits and issuing credits, but on processing payments. As table 6 suggests, the lion's share of activity of Russian banks has to do with processing payments, which is a sharp contrast to the operations of the Western banks.
Correspondent accounts, which in American banks constitute only less than 1% of total assets/liabilities, in Russia in 1994 amounted to 18% of liabilities and 33% of assets (the latter was largely due to the requirements of correspondent Western banks which did not trust much their Russian counterparts); the share of liabilities in the form of processed payments in Russian banks was over two times higher. Banking operations per se - accumulating deposits and issuing credits - was only a small visible part of the iceberg, whereas about 70% of total liabilities and about 50% of assets were engaged in auxiliary operations of clearing payments.
In 1995-97, when inflation finally was brought down to reasonable levels, part of the banking activity associated with processing payments decreased markedly, though still remained more substantial than in the U.S. banks. The other major change was the sharp rise of the share of government securities in total bank assets (over 20% of total assets in mid 1997) - partly at the expense of the reduction of the share of bank credits to businesses. The share of bad loans, meanwhile, rose from 32% in 1994 to 37% in 1995 and to 45% in the first quarter of 19968.
Last, but not least, the concentration in the Russian banking sector is much lower than in other economies in transition. As table 3 suggests, in all economies, except Russia, the share of the largest 5 banks in total banking assets is within the range of 57-79%, whereas in Russia it is only 33%. By the beginning of 1997 the average bank had only 2 branches (if Sberbank with over 30,000 branches all across Russia is excluded) and the registered capital (equity) of less than $500,000. There are no "big three" or "big four" nation-wide banks. The largest Russian bank - Sberbank (former state Savings bank still controlled by the CBR) accounts for 13% of total credit outstanding (and its share is falling rapidly), while ten largest
7 Even by the end of 1994 the share of hard currency in total bank assets stood at 40%. It declined to 20% by the end of 1995 and to 12% by the end of 1996 (OECD, 1997, p.87).8 Belousov, (1996); Finansoviye Izvestiya, June 14, 1996.
17
banks account for only 1/3 of total credits (table 7). Only 2 Russian banks had assets of over $5 billion and capital of over $500 million by early 1997. Even the largest Russian banks compare very poorly with their Western counterparts: with the exception of Sberbank, their assets do not exceed several billion dollars - less than 1% of GDP each.
Table 6. Structure of assets and liabilities of Russian and American banks, % of total, end of periodCountry Russia U.S. RussiaItems of the balance sheet, % of total 1994 199
41994 1995 1996 1997*
LIABILITIES 100 100 100 100 100 100- Cheap (low or no interest) liabilities - Current accounts - "Loro" correspondent accounts - Payments processed
70.1
29.118.416.7
32.5
24.60.9< 7
73.7
33.3
56.7
26.1
50.2
29.1
>48
21.8
7.9- Expensive (high interest) liabilities - Deposits - Inter-bank credits received
17.1
2.213.2
58.5
49.48.1
26.3
2.410.3
43.3
5.816.8
49.8
4.817.9
<52
ASSETS 100 100 100 100 100 100Non-working (non-interest bearing assets) - "Nostro" correspondent accounts - Cash, reserves in CB, fixed capital, other
50.5
33.117.4
13.1
0.812.3
53.2 33.1 27.4 28.0
Working (interest bearing) assets - Credits to non-financial sector - Inter-bank credits issued - Government securities - Non-government securities
49.5
31.411.04.31.0
86.9
58.12.622.13.0
46.8
29.910.95.7
66.9
38.016.111.2
72.6
34.616.418.0
72.0
31.07.623.210.2
*July 1, 1997, excluding Vneshekonombank.Source: Data for 1994 are for 627 Moscow based banks and are taken from: Dmitriyev et al., 1996; Data for 1994-97 are for 503 Moscow based banks (excluding Sberbank and Vneshekonombank) and are taken from: OECD, 1997.
Why Russia adopted a decentralised banking system, whereas most other economies in transition, including radical reformers, adopted a more conservative Japanese-European type
18
highly concentrated model of the banking sector? The immediate reasons are well known and are associated with the fight between Russian and all-union government (between Yeltsin and Gorbachev) for the distribution of powers in 1991: banking was chosen to be one of the battlegrounds, when the Russian government declared all branches of all-union banks at Russian territory independent from Gosbank, with the result that nearly a thousand of new banks emerged overnight.
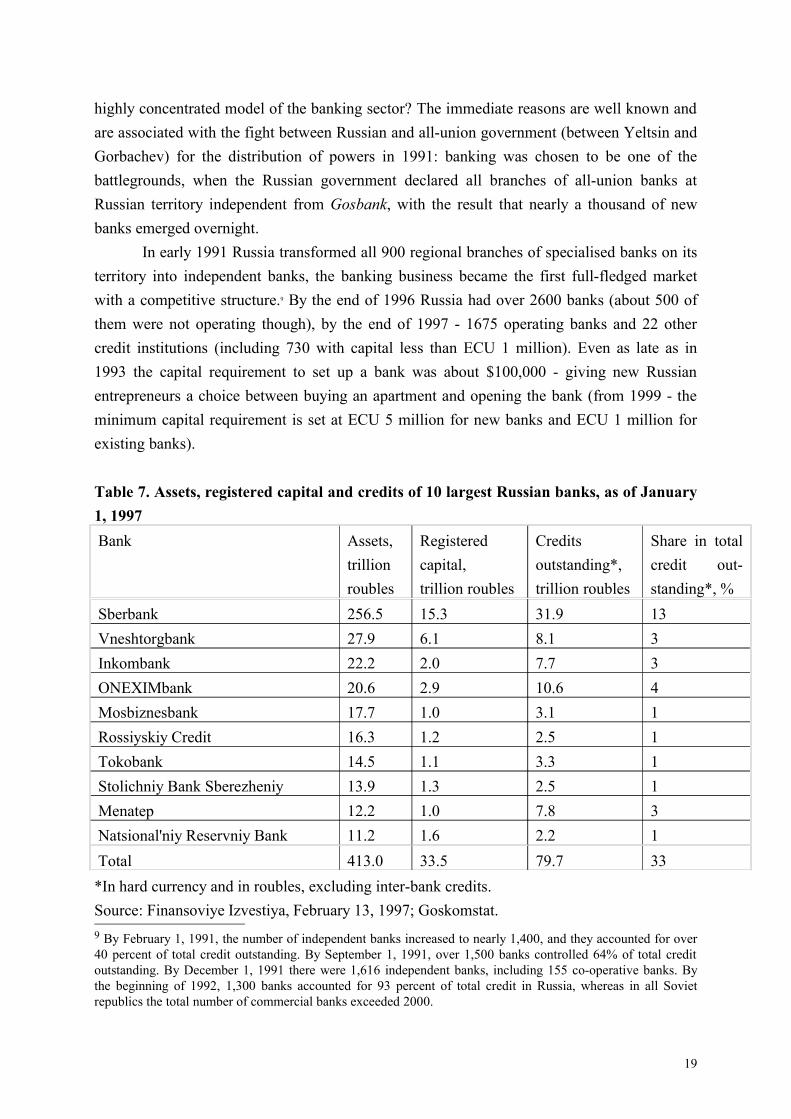
In early 1991 Russia transformed all 900 regional branches of specialised banks on its territory into independent banks, the banking business became the first full-fledged market with a competitive structure.9 By the end of 1996 Russia had over 2600 banks (about 500 of them were not operating though), by the end of 1997 - 1675 operating banks and 22 other credit institutions (including 730 with capital less than ECU 1 million). Even as late as in 1993 the capital requirement to set up a bank was about $100,000 - giving new Russian entrepreneurs a choice between buying an apartment and opening the bank (from 1999 - the minimum capital requirement is set at ECU 5 million for new banks and ECU 1 million for existing banks).
Table 7. Assets, registered capital and credits of 10 largest Russian banks, as of January 1, 1997 Bank Assets,
trillionroubles
Registeredcapital,trillion roubles
Credits outstanding*,trillion roubles
Share in total credit out-standing*, %
Sberbank 256.5 15.3 31.9 13Vneshtorgbank 27.9 6.1 8.1 3Inkombank 22.2 2.0 7.7 3ONEXIMbank 20.6 2.9 10.6 4Mosbiznesbank 17.7 1.0 3.1 1Rossiyskiy Credit 16.3 1.2 2.5 1Tokobank 14.5 1.1 3.3 1Stolichniy Bank Sberezheniy 13.9 1.3 2.5 1Menatep 12.2 1.0 7.8 3Natsional'niy Reservniy Bank 11.2 1.6 2.2 1Total 413.0 33.5 79.7 33*In hard currency and in roubles, excluding inter-bank credits.Source: Finansoviye Izvestiya, February 13, 1997; Goskomstat.9 By February 1, 1991, the number of independent banks increased to nearly 1,400, and they accounted for over 40 percent of total credit outstanding. By September 1, 1991, over 1,500 banks controlled 64% of total credit outstanding. By December 1, 1991 there were 1,616 independent banks, including 155 co-operative banks. By the beginning of 1992, 1,300 banks accounted for 93 percent of total credit in Russia, whereas in all Soviet republics the total number of commercial banks exceeded 2000.
19
Nevertheless, it is difficult to say whether these immediate reasons represent a particular fundamental pattern or should be viewed as a mere coincidence of events. Other former Soviet republics were also leading "banking wars" against the Union, but seem to have adopted a more European type banking system afterwards.
Corporate financing and control
With respect to corporate financing and control, the outcomes of the Russian transition, perhaps surprisingly, seem to be more in line with the liberal (shock therapy) approach than in East European countries.
In the transitional economies with poorly developed capital markets most industrial companies are not really able to sell their shares and bonds, which is an argument in favour of the Japanese model ("only large banks can mobilise resources for capital investment"). Indeed, so far capital markets in most ex-socialist countries have been developing in the direction of Japanese (European) model.
Banking system in EE economies is highly concentrated and banks (often not yet privatised10) are major stakeholders in non-financial enterprises. In Czech Republic, for instance, banks control Investment Privatisation Funds, whereas several investment funds manage about one half of the shares of individual investors. Hungary, where banks ties with enterprises are the weakest, both in terms of debtor relations and equity investment (Bartlett, 1996), seems to be exactly the kind of the exception that proves the rule: during privatisation banks were pushed aside by foreigners which finally assumed the role of strategic investors in major companies and 8 out of 10 largest banks are controlled by foreigners themselves11.
Countries that used the voucher method of privatisation are, on average, more advanced in building their securities markets than those (like Hungary) which opted for classical direct sales of property (Samonis and Bondar, 1997)12. However, even in those former socialist economies that managed to avoid high inflation (China and EE countries), 5-7 years after the start of transition market capitalisation was normally at a level of several percent of GDP, whereas bank credits amounted to several dozen percent of GDP (table 4, 8). In Czech Republic nearly 80% of total capital investment in 1993-94 was financed by bank credit to enterprises (EBRD, 1995, p. 94), in China banks provided funds for over 25% of investment of state owned and collective enterprises, or over 80% of total external financing (Girardin,
10 In 1993-94 the share of state owned banks in total assets was over 70% in Albania, Bulgaria, Czech Republic, Hungary, Kazakhstan, Poland, Slovakia and over 50% in Slovenia (Finance and Development, September 1995, p.24; Borish, Ding, Noel, 1997).11 Expert, August 25, 1997.12 Other authors, however, warn that although in countries engaged in mass privatisation (e.g. Czech and Slovak Republics), the stock market capitalisation is high relative to the size of the economy, the liquidity of stock markets (ratio of trading to capitalisation) is low, lower than in countries where privatisation has been selective (e.g. Poland), which may present problems for future restructuring, for the development of a market for corporate control, and for the ability of firms to raise capital through securities issues (Johnson, Neave, Pazderka, 1997).
20
1997; Qian, 1995).
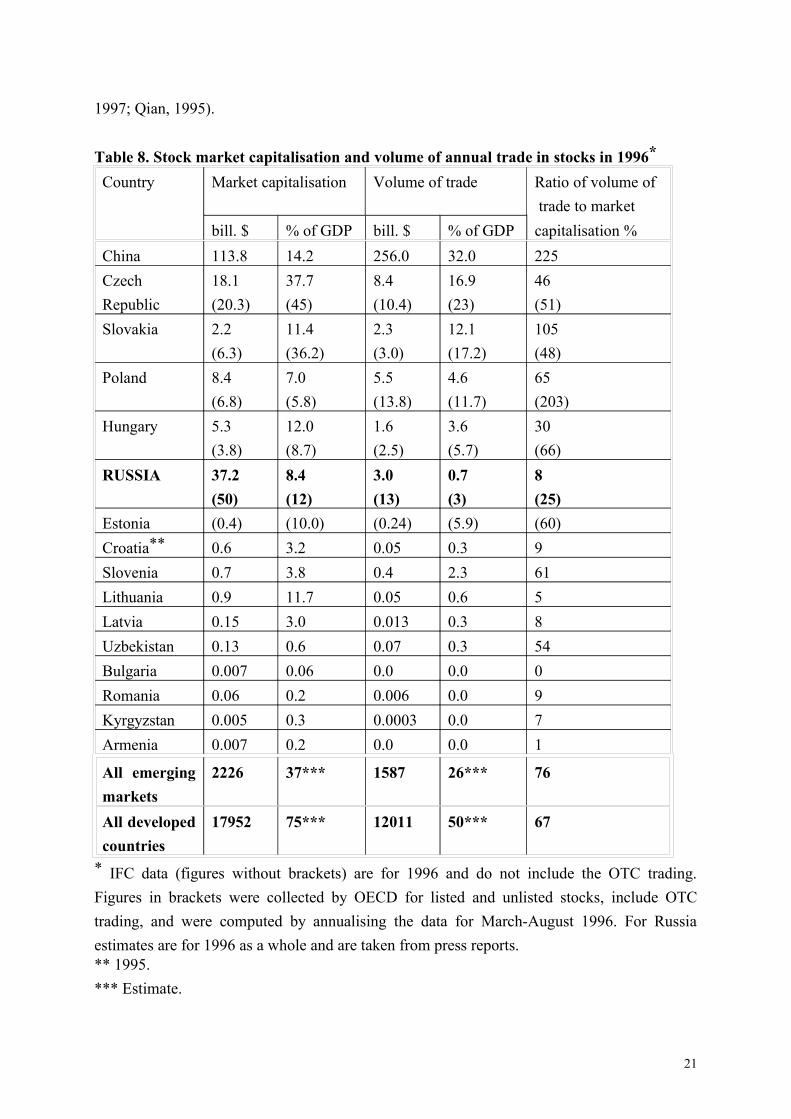
Table 8. Stock market capitalisation and volume of annual trade in stocks in 1996*
Country Market capitalisation Volume of trade Ratio of volume of trade to market
bill. $ % of GDP bill. $ % of GDP capitalisation %China 113.8 14.2 256.0 32.0 225Czech Republic
18.1(20.3)
37.7(45)
8.4(10.4)
16.9(23)
46(51)
Slovakia 2.2(6.3)
11.4(36.2)
2.3(3.0)
12.1(17.2)
105(48)
Poland 8.4(6.8)
7.0(5.8)
5.5(13.8)
4.6(11.7)
65(203)
Hungary 5.3(3.8)
12.0(8.7)
1.6(2.5)
3.6(5.7)
30(66)
RUSSIA 37.2(50)
8.4(12)
3.0(13)
0.7 (3)
8(25)
Estonia (0.4) (10.0) (0.24) (5.9) (60)Croatia** 0.6 3.2 0.05 0.3 9Slovenia 0.7 3.8 0.4 2.3 61Lithuania 0.9 11.7 0.05 0.6 5Latvia 0.15 3.0 0.013 0.3 8Uzbekistan 0.13 0.6 0.07 0.3 54Bulgaria 0.007 0.06 0.0 0.0 0Romania 0.06 0.2 0.006 0.0 9Kyrgyzstan 0.005 0.3 0.0003 0.0 7Armenia 0.007 0.2 0.0 0.0 1
All emerging markets
2226 37*** 1587 26*** 76
All developed countries
17952 75*** 12011 50*** 67
* IFC data (figures without brackets) are for 1996 and do not include the OTC trading. Figures in brackets were collected by OECD for listed and unlisted stocks, include OTC trading, and were computed by annualising the data for March-August 1996. For Russia estimates are for 1996 as a whole and are taken from press reports. ** 1995.*** Estimate.
21
Source: IFC, 1997; World Bank, 1997; Johnson, Neave, Pazderka, 1997, p.15.
On the other hand in FSU countries that had to survive through several years of very high inflation the depth of the financial system decreased dramatically. Even though it is sometimes assumed that more risky equity financing is better suited for inflationary environment than bank credits (Rostowski, 1995), stock market in transition economies with high inflation never gained any major significance as a source of capital financing. Russia is not an exception in this respect, though has a potential of becoming an exception.
In Russia banks virtually stopped the financing of capital investment. Total bank credits outstanding in relation to GDP declined steadily; in 1992 they ensured the financing of only 10% of total capital investment, in 1993 - less - 6% (EBRD, 1995, p.94) in 1995-96 - less than 1% , i.e. an amount comparable with equity financing (table 10)13. No less important, long term credits (over 1 year term) amount to only 5% of total bank credits and do not play any significant role in the financing of capital investment. In late 1996, when inflation was already under control, interest rates on bank credits to industry still stood at a level of about 100%, higher than the rates on inter-bank credits, the CBR rate (about 50%), the returns on GKOs - government treasury bills (30%), and much higher than the rates of return in industry itself (10-20%)14.
Markets for corporate securities are only emerging, and it is only large companies that can resort to equity and bond financing. Nevertheless, it seems like these sources of investment financing for large companies are already more important than bank credits. Total volume of trade in shares in 1995 (mostly OTC) was estimated at about $5 billion - 1-2% of GDP or 25% of market capitalisation.15 And market capitalisation as well as the volume of trading increased threefold in the second quarter of 1996 after stock prices soared on the eve of presidential elections, and twofold - in late 1996 - early 1997 after Yeltsin recovered from heart surgery (fig. 5). Estimates for 1996 put the total market capitalisation at $50-55 billion (13% of GDP) and the volume of trade in shares - at 40-70 millions a day, or $13 billion annually (3-4% of GDP)16. By mid 1997 market capitalisation was presumably at a level of $100 billion (above Indonesia and at par with China), about 25% of GDP, whereas the volume of trading - over 5% of GDP, which made Russia one of the leaders of stock market development together with China and Central European countries (table 8); by the beginning of 1998 the stock market, however, lost half of its value and capitalisation and volume of trade indicators returned to their 1996 levels. The institutional framework of the Russian stock market based on the self governing association of stock market participants (PAUFOR, later
13 Relatively high share of bank credit in total financing in 1992-93 is due to subsidised CBR credits to enterprises (in fact - government subsidies) distributed through commercial banks.14 Expert, January 13, 1997, p. 14-15.15 Finansoviye Izvestiya, February 2, 1996; . World Bank, 1996, p.108.16 Expert, January 13, 1997, p.21.
22
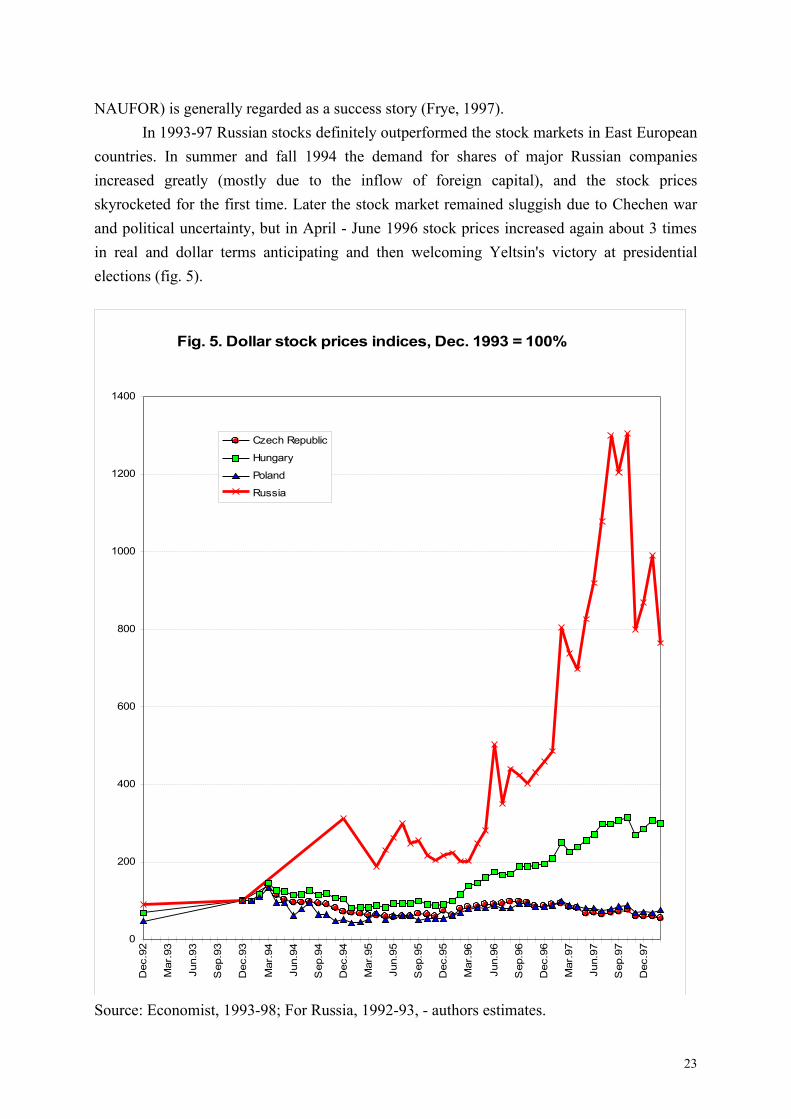
NAUFOR) is generally regarded as a success story (Frye, 1997).In 1993-97 Russian stocks definitely outperformed the stock markets in East European
countries. In summer and fall 1994 the demand for shares of major Russian companies increased greatly (mostly due to the inflow of foreign capital), and the stock prices skyrocketed for the first time. Later the stock market remained sluggish due to Chechen war and political uncertainty, but in April - June 1996 stock prices increased again about 3 times in real and dollar terms anticipating and then welcoming Yeltsin's victory at presidential elections (fig. 5).
0
200
400
600
800
1000
1200
1400
Dec
.92
Mar
.93
Jun.
93
Sep
.93
Dec
.93
Mar
.94
Jun.
94
Sep
.94
Dec
.94
Mar
.95
Jun.
95
Sep
.95
Dec
.95
Mar
.96
Jun.
96
Sep
.96
Dec
.96
Mar
.97
Jun.
97
Sep
.97
Dec
.97
Czech Republic
Hungary
Poland
Russia
Fig. 5. Dollar stock prices indices, Dec. 1993 = 100%
Source: Economist, 1993-98; For Russia, 1992-93, - authors estimates.
23
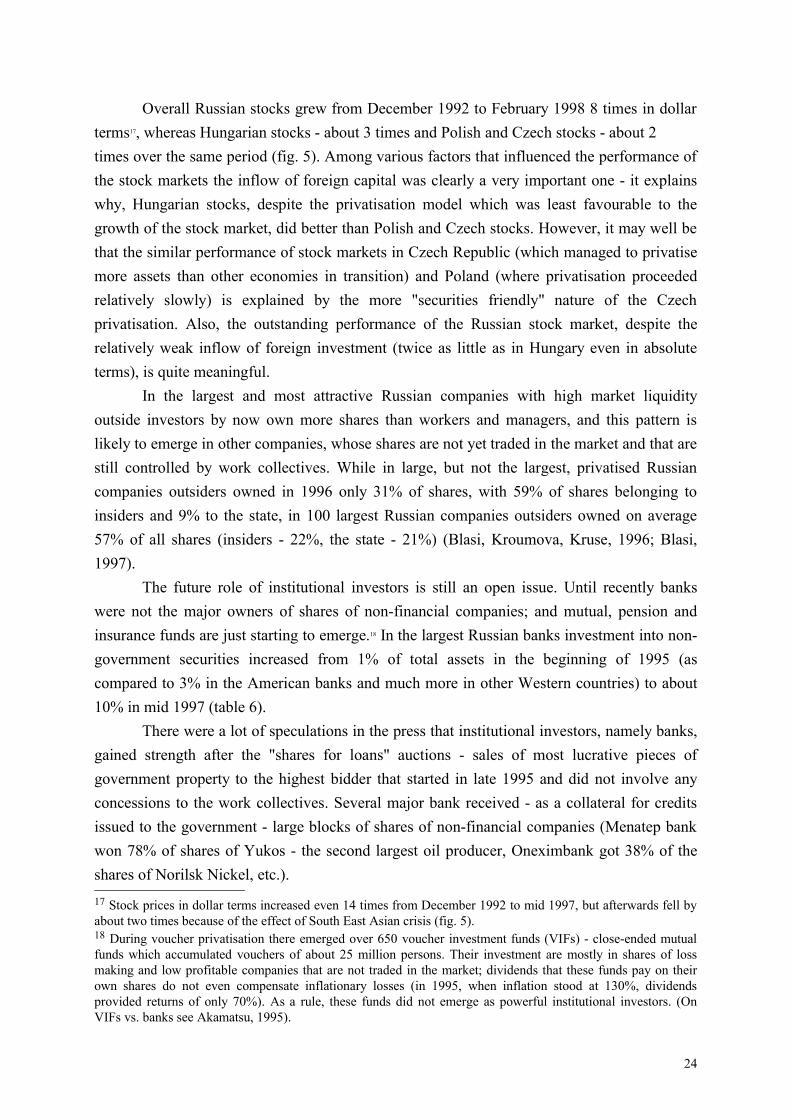
Overall Russian stocks grew from December 1992 to February 1998 8 times in dollar terms17, whereas Hungarian stocks - about 3 times and Polish and Czech stocks - about 2 times over the same period (fig. 5). Among various factors that influenced the performance of the stock markets the inflow of foreign capital was clearly a very important one - it explains why, Hungarian stocks, despite the privatisation model which was least favourable to the growth of the stock market, did better than Polish and Czech stocks. However, it may well be that the similar performance of stock markets in Czech Republic (which managed to privatise more assets than other economies in transition) and Poland (where privatisation proceeded relatively slowly) is explained by the more "securities friendly" nature of the Czech privatisation. Also, the outstanding performance of the Russian stock market, despite the relatively weak inflow of foreign investment (twice as little as in Hungary even in absolute terms), is quite meaningful.
In the largest and most attractive Russian companies with high market liquidity outside investors by now own more shares than workers and managers, and this pattern is likely to emerge in other companies, whose shares are not yet traded in the market and that are still controlled by work collectives. While in large, but not the largest, privatised Russian companies outsiders owned in 1996 only 31% of shares, with 59% of shares belonging to insiders and 9% to the state, in 100 largest Russian companies outsiders owned on average 57% of all shares (insiders - 22%, the state - 21%) (Blasi, Kroumova, Kruse, 1996; Blasi, 1997).
The future role of institutional investors is still an open issue. Until recently banks were not the major owners of shares of non-financial companies; and mutual, pension and insurance funds are just starting to emerge.18 In the largest Russian banks investment into non-government securities increased from 1% of total assets in the beginning of 1995 (as compared to 3% in the American banks and much more in other Western countries) to about 10% in mid 1997 (table 6).
There were a lot of speculations in the press that institutional investors, namely banks, gained strength after the "shares for loans" auctions - sales of most lucrative pieces of government property to the highest bidder that started in late 1995 and did not involve any concessions to the work collectives. Several major bank received - as a collateral for credits issued to the government - large blocks of shares of non-financial companies (Menatep bank won 78% of shares of Yukos - the second largest oil producer, Oneximbank got 38% of the shares of Norilsk Nickel, etc.). 17 Stock prices in dollar terms increased even 14 times from December 1992 to mid 1997, but afterwards fell by about two times because of the effect of South East Asian crisis (fig. 5).18 During voucher privatisation there emerged over 650 voucher investment funds (VIFs) - close-ended mutual funds which accumulated vouchers of about 25 million persons. Their investment are mostly in shares of loss making and low profitable companies that are not traded in the market; dividends that these funds pay on their own shares do not even compensate inflationary losses (in 1995, when inflation stood at 130%, dividends provided returns of only 70%). As a rule, these funds did not emerge as powerful institutional investors. (On VIFs vs. banks see Akamatsu, 1995).
24
By the end of 1996 the newspapers were writing about the group of five - seven banks that control a good half of the Russian economy19. The largest group, Oneximbank, reportedly controlled in 1996 banks with assets of some $ 5 billion and industrial enterprises with sales of about $ 9 billion; the second largest, Menatep, had banking assets of about $2 billion and held control over enterprises with sales of about $ 6 billion20. This is obviously a significant proportion of national economy (1995 GDP was $ 364 billion), but still just about several percent.
Moreover, as recent survey shows (Blasi, 1997) in large privatised state enterprises financial institutions (holding companies and financial-industrial groups, investment funds and banks) control only 10% of all shares. In 100 largest Russian corporations the share of stocks owned by financial institutions is somewhat higher - 18%, but the proportion of stocks belonging to outsiders is also higher, so that the share of financial institutions in total outsiders ownership is approximately the same for large and largest companies - about 1/3. Besides, industrial companies control banks more often than banks control industrial companies: Gazprom alone by early 1998 was the major shareholder in three large banks (Promstroybank, Natsionalniy Reservniy Bank, Imperial) and was going to buy Inkombank21.
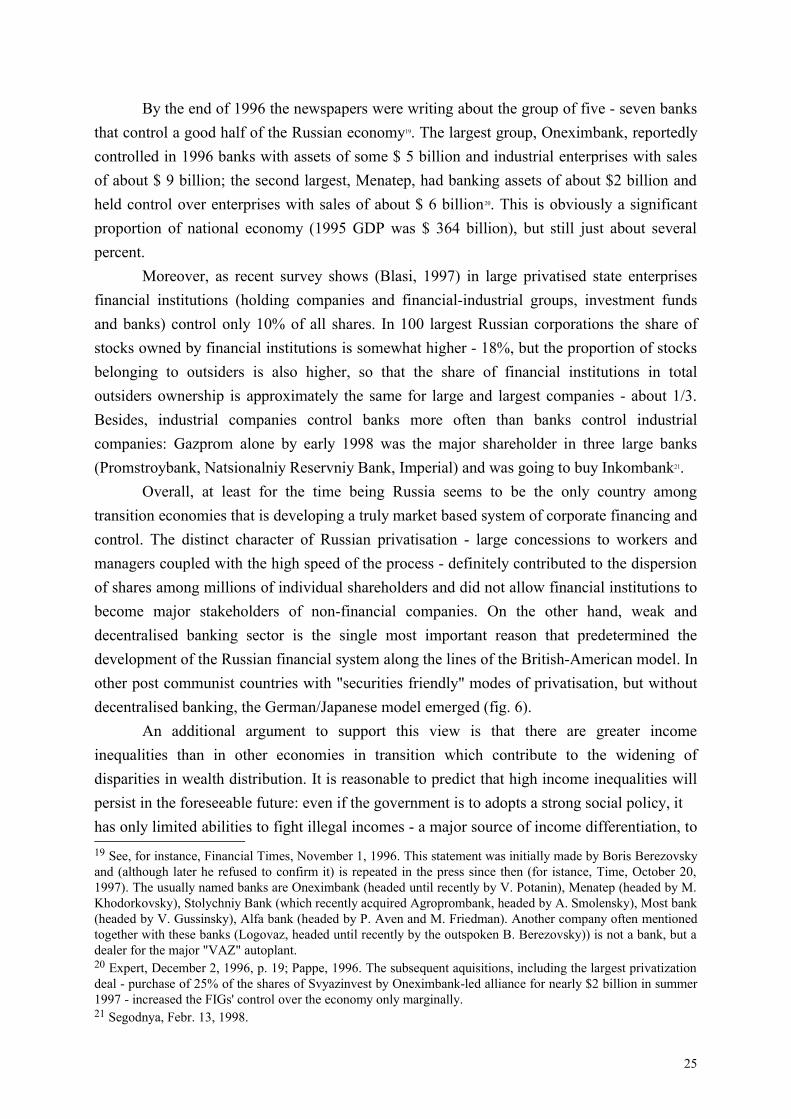
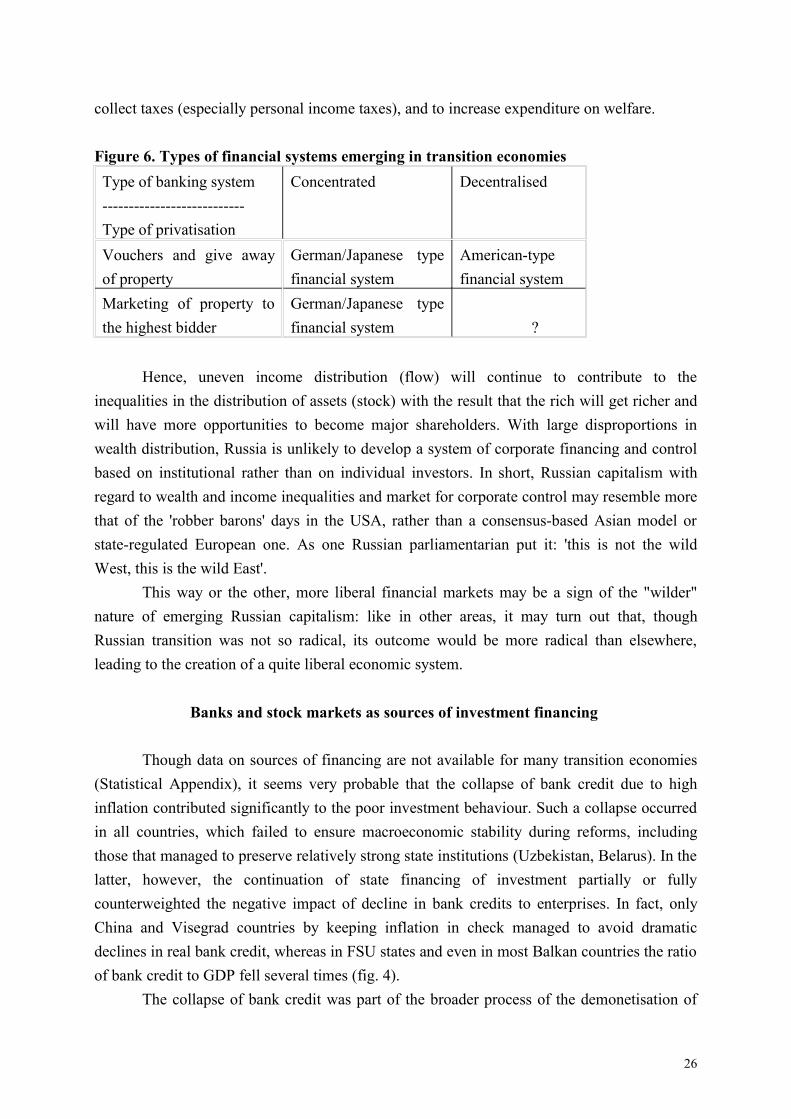
Overall, at least for the time being Russia seems to be the only country among transition economies that is developing a truly market based system of corporate financing and control. The distinct character of Russian privatisation - large concessions to workers and managers coupled with the high speed of the process - definitely contributed to the dispersion of shares among millions of individual shareholders and did not allow financial institutions to become major stakeholders of non-financial companies. On the other hand, weak and decentralised banking sector is the single most important reason that predetermined the development of the Russian financial system along the lines of the British-American model. In other post communist countries with "securities friendly" modes of privatisation, but without decentralised banking, the German/Japanese model emerged (fig. 6).
An additional argument to support this view is that there are greater income inequalities than in other economies in transition which contribute to the widening of disparities in wealth distribution. It is reasonable to predict that high income inequalities will persist in the foreseeable future: even if the government is to adopts a strong social policy, it has only limited abilities to fight illegal incomes - a major source of income differentiation, to 19 See, for instance, Financial Times, November 1, 1996. This statement was initially made by Boris Berezovsky and (although later he refused to confirm it) is repeated in the press since then (for istance, Time, October 20, 1997). The usually named banks are Oneximbank (headed until recently by V. Potanin), Menatep (headed by M. Khodorkovsky), Stolychniy Bank (which recently acquired Agroprombank, headed by A. Smolensky), Most bank (headed by V. Gussinsky), Alfa bank (headed by P. Aven and M. Friedman). Another company often mentioned together with these banks (Logovaz, headed until recently by the outspoken B. Berezovsky)) is not a bank, but a dealer for the major "VAZ" autoplant.20 Expert, December 2, 1996, p. 19; Pappe, 1996. The subsequent aquisitions, including the largest privatization deal - purchase of 25% of the shares of Svyazinvest by Oneximbank-led alliance for nearly $2 billion in summer 1997 - increased the FIGs' control over the economy only marginally.21 Segodnya, Febr. 13, 1998.
25
collect taxes (especially personal income taxes), and to increase expenditure on welfare.
Figure 6. Types of financial systems emerging in transition economies Type of banking system ---------------------------Type of privatisation
Concentrated Decentralised
Vouchers and give away of property
German/Japanese type financial system
American-type financial system
Marketing of property to the highest bidder
German/Japanese type financial system
?
Hence, uneven income distribution (flow) will continue to contribute to the inequalities in the distribution of assets (stock) with the result that the rich will get richer and will have more opportunities to become major shareholders. With large disproportions in wealth distribution, Russia is unlikely to develop a system of corporate financing and control based on institutional rather than on individual investors. In short, Russian capitalism with regard to wealth and income inequalities and market for corporate control may resemble more that of the 'robber barons' days in the USA, rather than a consensus-based Asian model or state-regulated European one. As one Russian parliamentarian put it: 'this is not the wild West, this is the wild East'.
This way or the other, more liberal financial markets may be a sign of the "wilder" nature of emerging Russian capitalism: like in other areas, it may turn out that, though Russian transition was not so radical, its outcome would be more radical than elsewhere, leading to the creation of a quite liberal economic system.
Banks and stock markets as sources of investment financing
Though data on sources of financing are not available for many transition economies (Statistical Appendix), it seems very probable that the collapse of bank credit due to high inflation contributed significantly to the poor investment behaviour. Such a collapse occurred in all countries, which failed to ensure macroeconomic stability during reforms, including those that managed to preserve relatively strong state institutions (Uzbekistan, Belarus). In the latter, however, the continuation of state financing of investment partially or fully counterweighted the negative impact of decline in bank credits to enterprises. In fact, only China and Visegrad countries by keeping inflation in check managed to avoid dramatic declines in real bank credit, whereas in FSU states and even in most Balkan countries the ratio of bank credit to GDP fell several times (fig. 4).
The collapse of bank credit was part of the broader process of the demonetisation of
26
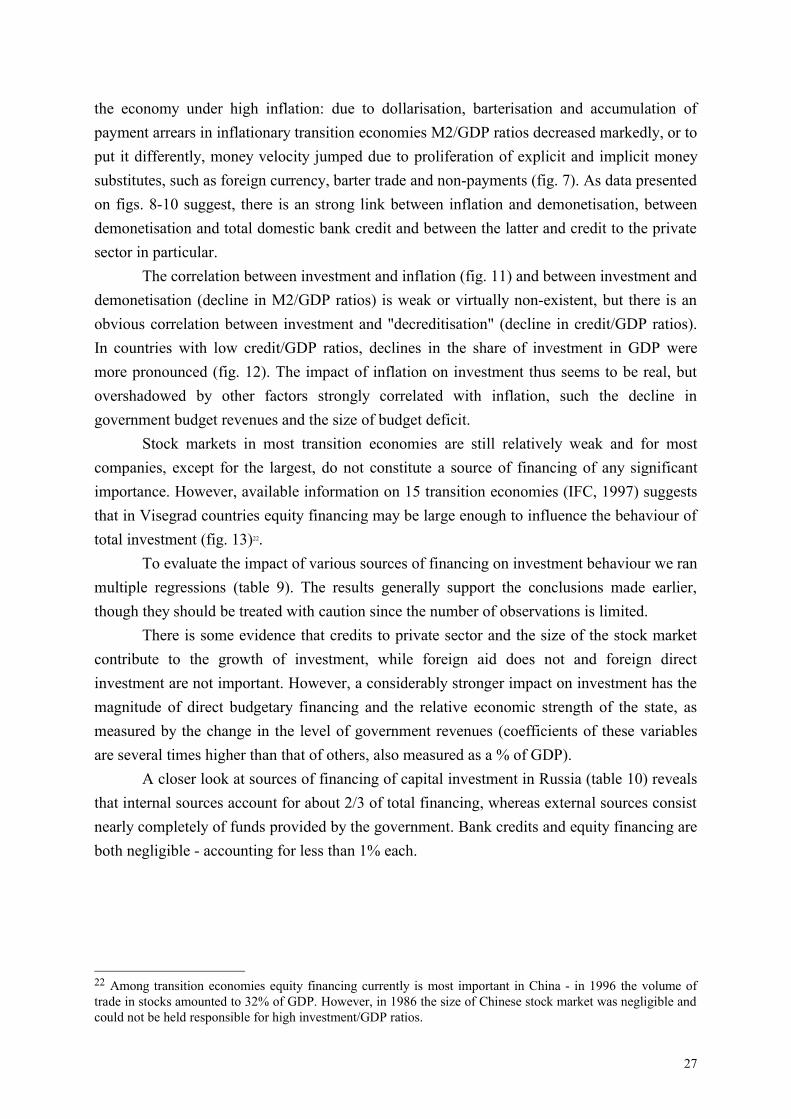
the economy under high inflation: due to dollarisation, barterisation and accumulation of payment arrears in inflationary transition economies M2/GDP ratios decreased markedly, or to put it differently, money velocity jumped due to proliferation of explicit and implicit money substitutes, such as foreign currency, barter trade and non-payments (fig. 7). As data presented on figs. 8-10 suggest, there is an strong link between inflation and demonetisation, between demonetisation and total domestic bank credit and between the latter and credit to the private sector in particular.
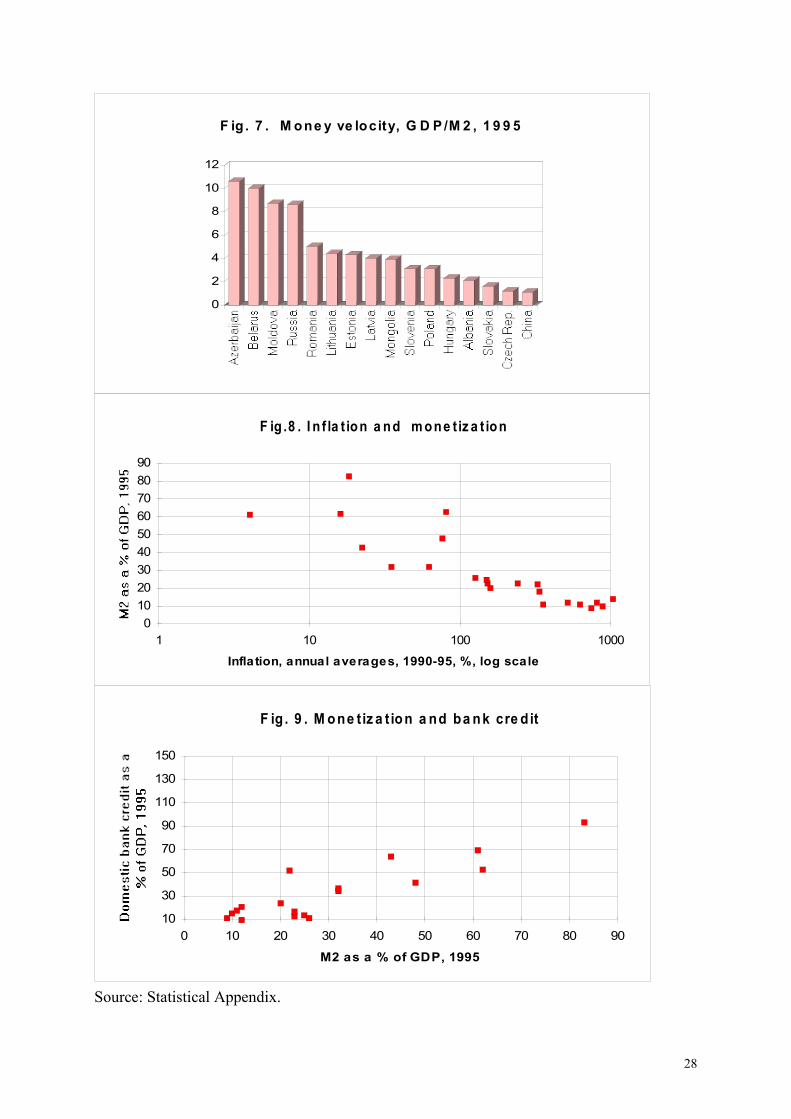
The correlation between investment and inflation (fig. 11) and between investment and demonetisation (decline in M2/GDP ratios) is weak or virtually non-existent, but there is an obvious correlation between investment and "decreditisation" (decline in credit/GDP ratios). In countries with low credit/GDP ratios, declines in the share of investment in GDP were more pronounced (fig. 12). The impact of inflation on investment thus seems to be real, but overshadowed by other factors strongly correlated with inflation, such the decline in government budget revenues and the size of budget deficit.
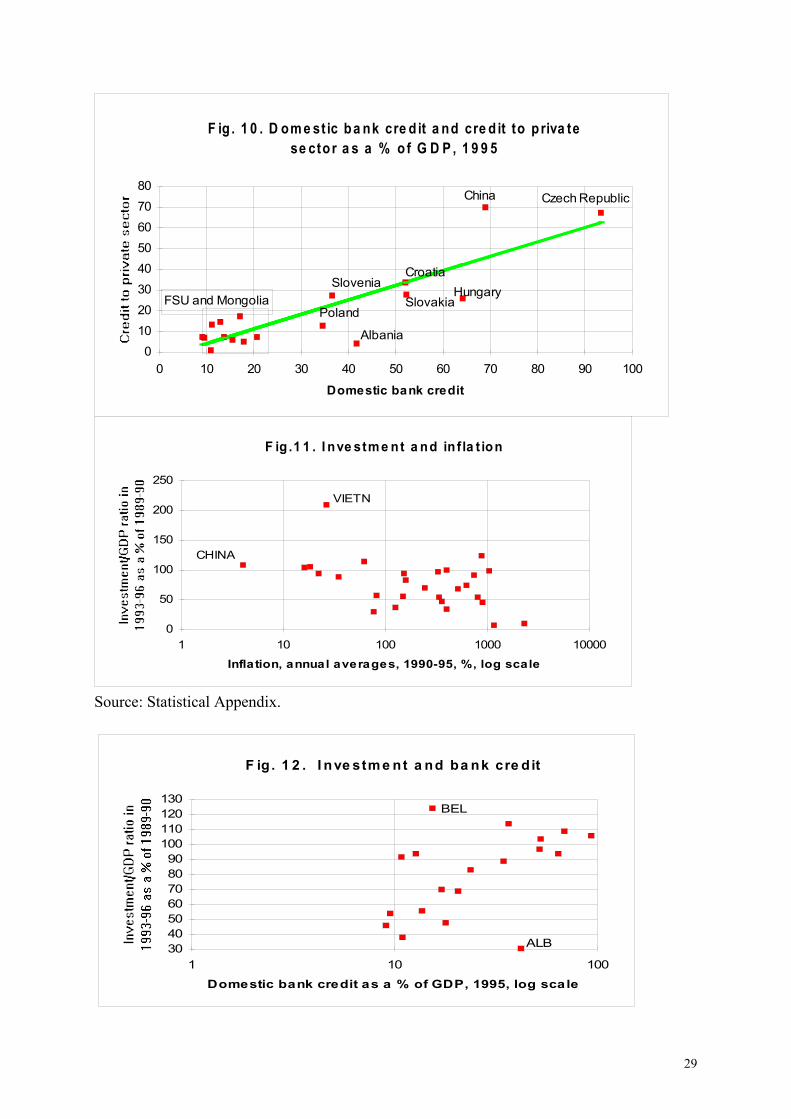
Stock markets in most transition economies are still relatively weak and for most companies, except for the largest, do not constitute a source of financing of any significant importance. However, available information on 15 transition economies (IFC, 1997) suggests that in Visegrad countries equity financing may be large enough to influence the behaviour of total investment (fig. 13)22.
To evaluate the impact of various sources of financing on investment behaviour we ran multiple regressions (table 9). The results generally support the conclusions made earlier, though they should be treated with caution since the number of observations is limited.
There is some evidence that credits to private sector and the size of the stock market contribute to the growth of investment, while foreign aid does not and foreign direct investment are not important. However, a considerably stronger impact on investment has the magnitude of direct budgetary financing and the relative economic strength of the state, as measured by the change in the level of government revenues (coefficients of these variables are several times higher than that of others, also measured as a % of GDP).
A closer look at sources of financing of capital investment in Russia (table 10) reveals that internal sources account for about 2/3 of total financing, whereas external sources consist nearly completely of funds provided by the government. Bank credits and equity financing are both negligible - accounting for less than 1% each.
22 Among transition economies equity financing currently is most important in China - in 1996 the volume of trade in stocks amounted to 32% of GDP. However, in 1986 the size of Chinese stock market was negligible and could not be held responsible for high investment/GDP ratios.
27
0
2
4
6
8
10
12
F ig . 7 . M one y ve locity, G D P /M 2 , 1 9 9 5
F ig .8 . I n f la t ion a nd m one tiz a t ion
Inflation, annual averages, 1990-95, %, log scale
0102030405060708090
1 10 100 1000
F ig . 9 . M one tiz a t ion a nd ba nk cre d it
M2 as a % of GDP, 1995
10
30
50
70
90
110
130
150
0 10 20 30 40 50 60 70 80 90
Source: Statistical Appendix.
28
F ig . 1 0 . D om e st ic ba nk cre d it a nd cre d it to p riva tese ctor a s a % o f G D P , 1 9 9 5
Domestic bank credit
01020304050607080
0 10 20 30 40 50 60 70 80 90 100
FSU and MongoliaSlovenia
Poland
Albania
Croatia
SlovakiaHungary
China Czech Republic
F ig .1 1 . I nve stm e nt a nd in f la t ion
Inflation, annual averages, 1990-95, %, log scale
0
50
100
150
200
250
1 10 100 1000 10000
CHINA
VIETN
Source: Statistical Appendix.
F ig . 1 2 . I nve stm e nt a nd ba nk cre d it
Domestic bank credit as a % of GDP, 1995, log scale
30405060708090
100110120130
1 10 100
BEL
ALB
29
Credit to priva te sector as a % of GDP, 1995, logscale
10
30
50
70
90
110
130
150
1 10 100
AZERB
BEL
F ig . 1 3 . I nve stm e nt a nd stock ma rke ts
Volume of trade in stocks in 1996 as a % of GDP, log scale
40
60
80
100
120
0.001 0.01 0.1 1 10 100
CZECHSLOVAK
POLHUNG EST
RUS
SLOVENIA
LITHCROATIA
LAT
UZBEK
ROM
KYRGYZ
CHINA
BULG
ARM
* For China - indicators are for the period 10 years earlier.Source: Statistical Appendix.
The evidence from the surveys of Russian enterprises on the relations between banks and non-financial companies unambiguously suggests that banks' participation in privatisation was much less significant than expected, that their representation on enterprises' boards is very limited and that their role in financing capital investment is hardly visible (Belyanova, Rozinsky, 1995; Litwack, 1995). Even bank-based FIGs are often expected to sell shares of the industrial enterprises acquired at "shares for loans" auctions after more or less cosmetic "investmentless" restructuring23. Recent studies by Dun and Bradstreet of the Oneksimbank
23 The general feeling in early 1998, over two years after "shares for loans" auctions, was that major banks do not invest enough into the restructuring of enterprises under their control. As Yeltsin put it in his state of the nation address, Russia "can count on the investment activities of banks, above all large banks, that bought important industrial enterprises during the course of privatization. To this end the state promoted the
30
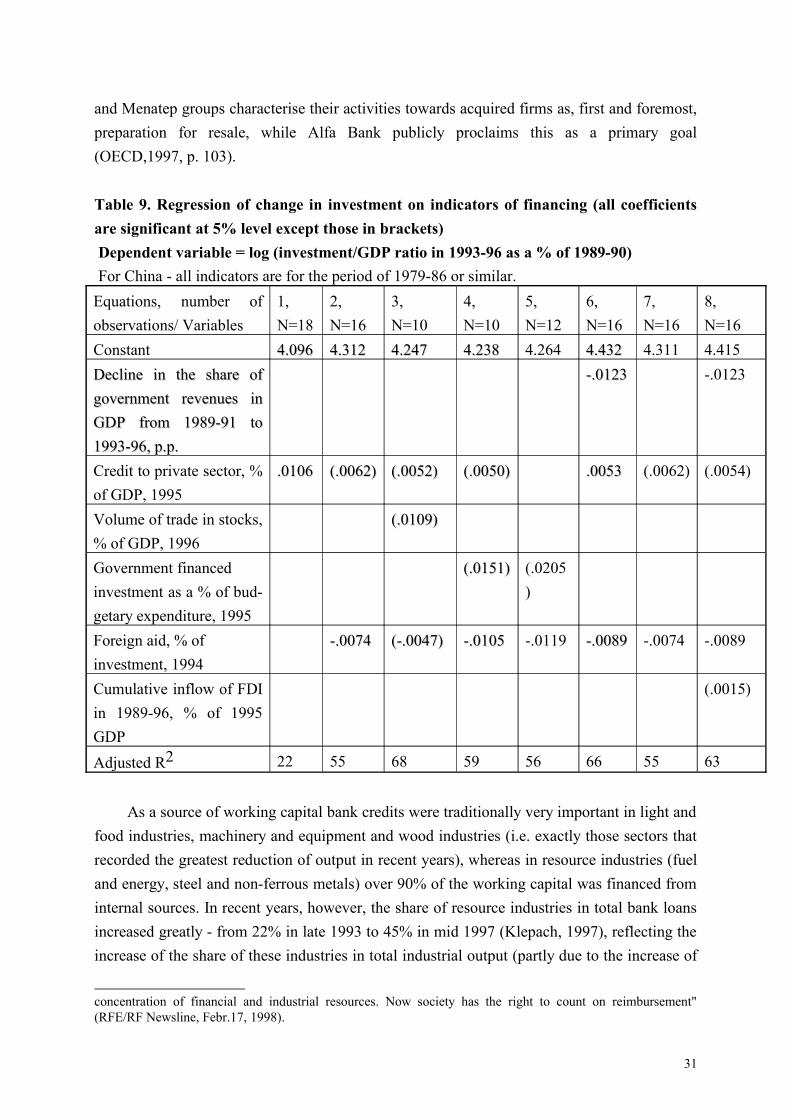
and Menatep groups characterise their activities towards acquired firms as, first and foremost, preparation for resale, while Alfa Bank publicly proclaims this as a primary goal (OECD,1997, p. 103). Table 9. Regression of change in investment on indicators of financing (all coefficients are significant at 5% level except those in brackets) Dependent variable = log (investment/GDP ratio in 1993-96 as a % of 1989-90) For China - all indicators are for the period of 1979-86 or similar.Equations, number of observations/ Variables
1, N=18
2, N=16
3, N=10
4, N=10
5, N=12
6, N=16
7, N=16
8,N=16
Constant 4.0964.096 4.3124.312 4.2474.247 4.2384.238 4.264 4.4324.432 4.311 4.415Decline in the share ofDecline in the share of government revenues ingovernment revenues in GDP from 1989-91 toGDP from 1989-91 to 1993-96, p.p.1993-96, p.p.
-.0123-.0123 -.0123
Credit to private sector, % of GDP, 1995
.0106.0106 (.0062)(.0062) (.0052)(.0052) (.0050)(.0050) .0053.0053 (.0062) (.0054)
Volume of trade in stocks, % of GDP, 1996
(.0109)(.0109)
Government financed investment as a % of bud-getary expenditure, 1995
(.0151)(.0151) (.0205)
Foreign aid, % of investment, 1994
-.0074-.0074 (-.0047)(-.0047) -.0105-.0105 -.0119 -.0089-.0089 -.0074 -.0089
Cumulative inflow of FDI in 1989-96, % of 1995 GDP
(.0015)
Adjusted R2 22 55 68 59 56 66 55 63
As a source of working capital bank credits were traditionally very important in light and food industries, machinery and equipment and wood industries (i.e. exactly those sectors that recorded the greatest reduction of output in recent years), whereas in resource industries (fuel and energy, steel and non-ferrous metals) over 90% of the working capital was financed from internal sources. In recent years, however, the share of resource industries in total bank loans increased greatly - from 22% in late 1993 to 45% in mid 1997 (Klepach, 1997), reflecting the increase of the share of these industries in total industrial output (partly due to the increase of
concentration of financial and industrial resources. Now society has the right to count on reimbursement" (RFE/RF Newsline, Febr.17, 1998).
31

relative prices, partly because of the lesser reduction of output). Ailing non-resource industries found themselves deprived of credits and replaced disappearing bank financing with trade and tax arrears.
It is nevertheless weak companies in declining non-resource industries that use bank credit most intensively. There is an obvious negative relationship between the exposure of particular industries to bank credit and the growth employment and real wages (Fan and Schaffer, 1994): the more exposed industries are normally poorly performing machinery and equipment and light industry, while the less exposed are fuel and electric energy, steel and non-ferrous metals. The share of Russian industrial enterprises not using bank credits at all increased from 22% in 1994 to 32% in 1996 (37% in resource industries); paradoxically, the performance of these enterprises in terms of output, employment and investment change, capacity utilisation, wages, financial conditions, orders and inventories was superior to those that used bank credits (Aukutsionek, 1996). To put in differently, it was mostly poorly performing companies that borrowed from banks, while bank credits were regarded as the financial source of last resort and were used not for the expansion of output (and even less so - for capital investment), but for survival.
Table 10. Sources of investment financing in Russia, % of totalSources 1992 1993 1994 1995 1996 1997Centralised investment funds 29.8 37.6 31.8 32.0 26.3 - Federal budget 16.6 19.2 13.4 11.5 9.2 7.0 - Local budgets 10.3 15.1 10.6 10.3 9.6 7.9 - State off-budget funds 2.9 3.3 5.8 10.2 7.5 - Priority sector support funds 2.0Enterprises' own funds 69.3 57.4 64.2 62.5 66.3Households 0.9 2.6 2.3 3.0 3.2Foreign direct investment ... 2.4 1.7 2.8 0.3Bank credits 0.8 0.8Equity financing 0.5 0.5Memo:- Gross investment as a % of GDP (national accounts)- Fixed investment as a % of GDP (national accounts statistics)- Fixed investment as a % of GDP (capital investment statistics)
35.7
24.7
14.0
31.4
22.8
15.8
28.3
24
17.8
28
22
15.1
23.8
20?
16.4 15.3Source: Goskomstat.
32
In a sense such strategy of Russian enterprises is not surprising: other surveys suggest that most of them are controlled by insiders and are not aimed at profit as their Western counterparts, but at maintaining financial stability, output and employment. It is only natural that under these circumstances 71% of Russian managers considered the lack of financial resources, not profitability or uncertainty, the major obstacle to capital investment as compared to 25% in Netherlands (Aukutsionek, 1997)24.
Distribution of long term bank credits across industries follows a similar pattern: it is mostly enterprises in non-resource industries that borrow from banks to finance capital investment, while better performing resource industries rely mostly on internal sources. As fig. 14 suggests, there is a strong negative correlation between bank financing on the one hand and investment and output on the other. It may well be that larger credits to declining industries are issued under pressure from regional governments and thus in fact boil down to government subsidies, or that, alternatively, these credits are issued by enterprises "pocket" banks who care more about the survival of enterprises, not about profits25. Whatever the case, however, Russian banking system redistributes funds not from ailing to growing industries, as it normally happens in mature market economies, but vice versa, in favour of declining industries. In a sense it performs the role more appropriate for the government social protection agency than for the banks26.
24 The alternative explanation may be the absense of strong ties to a main bank, which is believed to make firms sensitive to liquidity constraints because of information problems. Recent study, however, found no evidence that banks help to overcome the liquidity constrains better than capital markets (Hayashi, 1997). Another study (Kang, Stultz, 1997) revealed that Japanese firms with stronger ties to main bank underinvested in 1990-93, when Japanese banks had to face severe financing constraints, as compared to less bank-dependent companies.25 According to the survey of over 400 Russian firms in 1994, companies were more often shareholders in the lending banks (about 40% of cases) than vice versa (6% of cases); over half of all enterprises failed to repay or to service bank debt on time in 1992-94; and bank debt was concentrated mostly in large financially distressed firms. Shareholding in the lending bank was not correlated, however, neither with ease in obtaining bank credit, nor with holding of total and overdue bank debt (Fan, Lee, and Schaffer, 1996).26 The adverse selection (more bank credits to poorly performing enterprises and industries) is a problem also in East European countries as documented by Bonin and Schaffer (1995), Desai (1996), and Gomulka (1994).
33
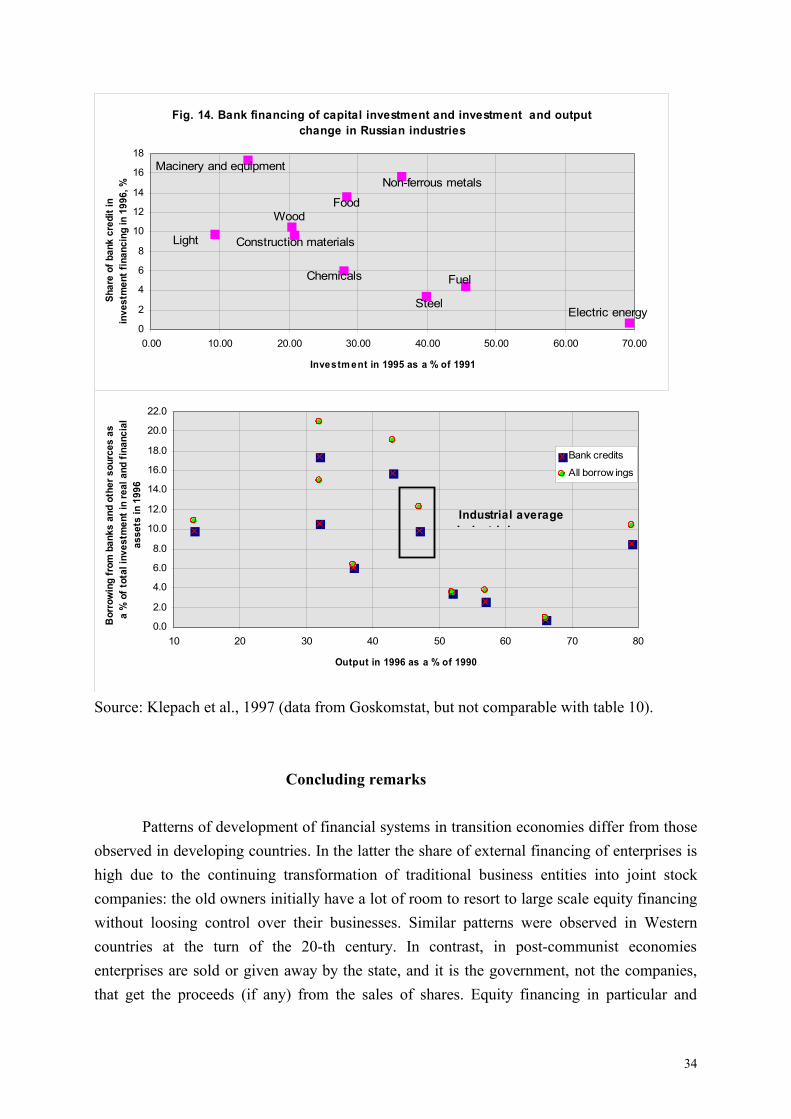
Fig. 14. Bank financing of capital investment and investment and output change in Russian industries
0
2
4
6
8
10
12
14
16
18
0.00 10.00 20.00 30.00 40.00 50.00 60.00 70.00
Investm ent in 1995 as a % of 1991
Shar
e of
ban
k cr
edit
in
inve
stm
ent f
inan
cing
in 1
996,
%
Electric energy
Fuel
Steel
Non-ferrous metals
Chemicals
Macinery and equipment
Wood
Construction materialsLight
Food
0.0
2.0
4.0
6.0
8.0
10.0
12.0
14.0
16.0
18.0
20.0
22.0
10 20 30 40 50 60 70 80
Output in 1996 as a % of 1990
Bor
row
ing
from
ban
ks a
nd o
ther
sou
rces
as
a %
of t
otal
inve
stm
ent i
n re
al a
nd fi
nanc
ial
asse
ts in
199
6
Bank credits
All borrow ings
Industrial averageIndustrial average
Source: Klepach et al., 1997 (data from Goskomstat, but not comparable with table 10).
Concluding remarks
Patterns of development of financial systems in transition economies differ from those observed in developing countries. In the latter the share of external financing of enterprises is high due to the continuing transformation of traditional business entities into joint stock companies: the old owners initially have a lot of room to resort to large scale equity financing without loosing control over their businesses. Similar patterns were observed in Western countries at the turn of the 20-th century. In contrast, in post-communist economies enterprises are sold or given away by the state, and it is the government, not the companies, that get the proceeds (if any) from the sales of shares. Equity financing in particular and
34

external financing in general is thus low, unless there are direct government subsidies.Further, characteristics of the financial systems depend on the privatisation model.
Voucher method and give away of property to employees are most favourable for the development of the securities markets: stock markets are not depressed since shares are given away for free or sold at a discount or for vouchers; stock ownership is widely dispersed; companies are controlled by insiders, which financial institutions are reluctant to finance, so they have to rely on internal financing or on securities markets.
On the contrary, direct sales of property to the highest bidder is a privatisation option less favourable for the development of the securities markets and more favourable for the emergence of institution-based financial system. This options disrupts stock markets due to excess supply of (insufficient demand for) assets, though the inflow of foreign investment may partly neutralise this negative effect; it leads to the concentration of stock ownership and to the emergence of stakeholders - strategic investors (financial institutions), which provide considerable external financing.
For immediate restructuring purposes direct sales of assets at market prices leading to the control of financial institutions over the non-financial companies may be the preferable option. However, for long term development of the securities markets (which may contribute to restructuring in the longer run) the give away of property to employees and especially the distribution of property through vouchers may be a more promising way to go.
Another crucial factor shaping the type of emerging financial system in economies in transition is the strength and the concentration of the banking sector. It is probably more important than the mode of privatisation since in countries with the concentrated banking systems neither voucher method (Czech and Slovak Republics, Lithuania), nor give away of property (most CIS countries) produced a truly market-based financial system. Only in Russia where employees-management buyouts and distribution of vouchers as dominant vehicles of privatisation were supplemented by the extreme weakness and decentralisation of the banking sector there still seem to be chances for the emergence of the liberal Anglo-American financial model.
Cross country comparisons seem to suggest that bank credit and stock market, contribute to higher investment independently of each other; there is no evidence that bank-based financial system is superior for investment than the market-based. In this respect transition economies are no different from developed and emerging markets. However, it appears that Russian banks redistribute funds from strong to weak enterprises, from relatively better off to poorly performing industries and hence do not really contribute to restructuring.
Despite recent emergence of bank-based FIGs Russian financial system does not have much chances to evolve in the direction of the bank-based model. FIGs still control a very small portion of the economy, are not able to provide the funds needed for restructuring and do not yet look like strategic long-term investors. Banks in particular and institutional
35
investors in general appear to be just one of the groups of important players fighting for the control over Russian companies, the other groups being foreign investors, Russian non-financial companies (such as Gazprom, UES, Lukoil, etc.), and individual shareholders.
The role of institutional investors will probably decline further once the "primary accumulation" period is over, like it declined in major Western countries after the "Great Depression" of the 1930s. With the initial distribution of property largely coming to an end, the ability to retain control over industrial companies will largely depend on the capacities to ensure financing for restructuring, which is not the strongest point of the Russian banks at least for the time being.
REFERENCES
Akamatsu N. Enterprise Governance and Investment Funds in Russian Privatisation. - In: Corporate Governance in Transitional Economies. Insider Control and the Role of Banks. Ed. by M. Aoki, H.-K. Kim. EDI, World Bank, 1995; pp. 121-83.
Aoki M. (1994) Monitoring Characteristics of the Main Bank System: An Analytical and Developmental View. - In: M. Aoki and H. Patrick (eds.), The Japanese Main Bank System: Its Relevance for Developing and Transforming Economies. Oxford, Oxford University Press, 1994.
Åslund A. 1998. The Myth of Oligarchy. - Moscow Times, January 29, 1998.
Aukutsionek S. (1997) Rol' Bankovskogo Kredita v Rossiyskoy Promyshlennosty. - In: Kurierov V. et al. Russian Economy in 1997. Forecast. Survey of 1996. Academy of National Economy, Moscow, 1997 (in Russian).
Aukutsionek S. 1997. Motiv Prybyly v Perekhodnoy Ekonomike. - In: Kurierov V. et al. Russian Economy in 1997. Forecast. Survey of January-June 1997. Academy of National Economy, Moscow, 1996 (in Russian).
Bartlett D. Commercial Banks and Corporate Governance in the Czech Republic and Hungary. - Post Soviet Geography and Economics, Vol. 37, No. 8, October 1996, pp. 503-10.
Belousov A. et al. 1996. Ekonomicheskiy Monitoring Rossii: Global'niye Tendentsii i Konyunktura v Otraslyakh Promyshlennosty. Institute of Economic Forecasting, Moscow, 1996 (in Russian).
36
Belyanova E., Rozinsky I. Evolution of Commercial Banking in Russia and Implications for Corporate Governance. - In: Corporate Governance in Transitional Economies. Insider Control and the Role of Banks. Ed. by M. Aoki, H.-K. Kim. EDI, World Bank, 1995, pp. 185-214.
Berglöf E. Corporate Governance in transition Economies: The Theory and Its Policy Implications. - - In: Corporate Governance in Transitional Economies. Insider Control and the Role of Banks. Ed. by M. Aoki, H.-K. Kim. EDI, World Bank, 1995, pp. 59-98.
Blasi J., Kroumova M., Kruse D. 1996. Kremlin Capitalism. Privatising the Russian Economy. Cornell University Press, Ithaca, NY, 1996.
Blasi J. 1997. Russian Research Project, Rutgers University, New Brunswick, NJ, 1997.
Bonin J., Schaffer M. Banks, Firms, Bad Debts and Bankruptcy in Hungary 1991-94. CEP Discussion paper No. 234, London School of Economics.
Borish M., Ding W., Noel M. A Review of Bank Performance during Transition in Central Europe. - Communist Economies & Economic Transformation, Vol. 9, No. 3, September 1997, pp. 337-57.
Calvo G. and Kumar M. Financial Markets and Intermediation. - In: Financial Sector Reforms and Exchange Arrangements in Eastern Europe. Occasional paper No. 102, IMF, Wash., 1993.
Ciccolo J.H. Jr. Changing Balance Sheet Relationships in the U.S. Manufacturing Sector, 1926-77. - In: The Changing Roles of Debt and Equity in Financing of U.S. Capital Formation. Ed. by B. Friedman, Chicago, 1982.
Demirguc-Kunt A., Maksimovic V. Financial Constraints, Uses of Funds, and Firm Growth. An International Comparison. Policy Research Working Paper No. 1671, World Bank, 1996.
Desai R. Reformed Banks and Corporate Governance in the Czech Republic, 1991-1996. - Post Soviet Geography and Economics, Vol. 37, No. 8, October 1996, pp. 463-94.
Dmitriyev M., Matovnikov M., Mikhailov L., Sycheva L., Timofeev Ye., Warner A. Rossiyskiye Banky Nakanune Finansovoy Stabilizatsii. Norma, St.Petersburg, 1996 (in Russian).
37
European Bank for Reconstruction and Development. 1995. Transition Report 1995. EBRD, 1995, London.
European Bank for Reconstruction and Development. 1996. Transition Report 1996. EBRD, 1996, London.
European Bank for Reconstruction and Development. 1997. Transition Report 1997. EBRD, 1997, London.
Fan Q., Schaffer M. Government Financial Transfers and Enterprise Adjustments in Russia, with Comparisons to Central and Eastern Europe. - Economics of Transition, 2 (2), June 1994.
Fan Q., Lee U., and Schaffer M. Firms, Banks and Credit in Russia. - In: Enterprise Restructuring and Economic Policy in Russia. Ed. by S. Commander, Q. Fan, M. Schaffer. EDI, World Bank, 1996, pp. 140-65.
Filatochev I. Privatisation and Corporate Governance in Transitional Economies. - The World Economy, 20, 4, July 1997, pp. 497-510.
Frye T. Governing the Russian Equities Market. - Post Soviet Affairs, 1997, 13, 4, pp. 366-95.
Girardin E. Banking Sector Reform and Credit Control in China. Development Centre Studies, OECD, 1997.
Gomulka S. The Financial Situation of Enterprises and Its Impact on Monetary and Fiscal Policies, Poland 1992-93. - Economics of Transition 2 (2), June 1994, pp. 189-208.
Goskomstat: Narodnoye Khozyaistvo SSSR (National Economy of the USSR), Rossiysky Statistichesky Yezhegodnik (Russian Statistical Yearbook) and monthly publications for various years. Moscow.
Gros D. and Steinherr A. Winds of Change. Economic Transition in central and Eastern Europe. Longman, London, 1997.
Grosfeld I. (1997). Financial System in Transition: The Role of Banks in Corporate Governance. - In: Experiences with Financial Liberalization. Ed. by K. Gupta. Kluwer Academic Publishers, Boston, 1997, pp. 131-54.
38
Hansson A.H. and Tombak T. Banking Crises in the Baltic States: Causes, Solutions and Lessons. - Paper prepared for the Second Dubrovnik Conference on Transition Economies, June 1996, Dubrovnik, Croatia.
Hayashi F. 1997. The Main Bank System and Corporate Investment: An Empirical Reassessment. NBER Working Paper 6172, Cambridge, MA, 1997.
IFC (1997), Emerging Stock Markets Factbook, Washington, DC.
IMF (1997), International Financial Statistics, Washington, DC.
IMF, World Bank, OECD, EBRD. 1991. A Study of the Soviet Economy. 1991. Vol. 1-3.
Johnson J. (1997). Russia's Emerging Financial-Industrial Groups. - Post Soviet Affairs, 1997, 13, 4, pp. 333-65.
Johnson L.D., Pazderka B. (1995). It's No Gamble. The Economic & Social Benefits of Stock Markets. Fraser Institute, 1995.
Johnson L.D., Neave E.H., Pazderka B. (1997). Financial Systems in Transition Economies. Paper for the European Public Choice Society Annual Meeting, Prague, Spring 1997.
Kang J-K., Stultz R. Is Bank-Centered Corporate Governance Worth It? A Cross-Sectional Analysis of Japanese Firms During the Asset Price Deflation. NBER Working Paper No. 6328, 1997.
Klepatch A. et al. 1997. Monitoring Sostoyaniya i Povedeniya Predpriyatiy. Ministerstvo Ekonomiki, Moscow, 1997.
Kornai J. The Road to a Free Economy. New York, W. Norton, 1990.
Kozul-Wright R. and Rayment P. The Institutional Hiatus in Economies in Transition and Its Policy Consequences. - Cambridge Journal of Economics, 1997, 21, pp. 641-61.
La Porta R., Lopez-de-Silanes F., Shleifer A., Vishni R. Legal Determinants of External Finance. - Journal of Finance (forthcoming).
39
Levine R. Stock Markets: A Spur to Economic Growth. - Finance and Development, March 1996, pp. 7-10.
Litwack J. Corporate Governance, Banks, and Fiscal Reform in Russia. - In: Corporate Governance in Transitional Economies. Insider Control and the Role of Banks. Ed. by M. Aoki, H.-K. Kim. EDI, World Bank, 1995, pp. 99-120.
OECD Economic Surveys 1997-98. Russian Federation 1997. OECD, 1997.
Pappe Ya. Institutsional'niye Izmeneniya v TEK Rossii i ikh Vosproizvodstvenniye Osnovaniya (1992-96 gg.). - Moscow, 1996.
Pohl G., Jedrzejczak G.T., and Anderson R.E. Creating Capital Markets in Central and Eastern Europe. - World Bank, Wash., D.C., 1995.
Popov V. A Russian Puzzle. What Makes Russian Economic Transformation a Special Case. WIDER/UNU, RFA 29, 1996.
Qian Y. Reforming Corporate Governance and Finance in China. - In: Corporate Governance in Transitional Economies. Insider Control and the Role of Banks. Ed. by M. Aoki, H.-K. Kim. EDI, World Bank, 1995, pp. 215-52.
Rajan R. and Zingales L. What Do We Know About Capital Strucrure ? Some Evidence from International Data. - The Journal of Finance, Vol. L, No. 5, December 1995, pp. 1421-60.
Rostowsi J. The Banking System, Credit and the Real Sector in Tansition Eonomies. - Banking Reform in Central Europe and the Former Soviet Union. Ed. by J. Rostowski, Central European University Press, Budapest, 1995, pp. 16-41.
Samonis V., Bondar O. Developing Financial Markets in Russia: Russian Security Industry in Comparative Perspective (With Special Reference to Derivatives). University of Toronto, 1997.
Schmidt-Hebbel, Klaus, Serven, Luis, Solimano, Andres (1996), Saving and Investment: Paradigms, Puzzles, Policies. - The World Bank Research Observer, Vol. 11, No. 1, pp. 87-117.
Singh, A. Financial Liberalisation, Stock Markets and Economic Development. - Economic Journal, May, 1997, pp.
40
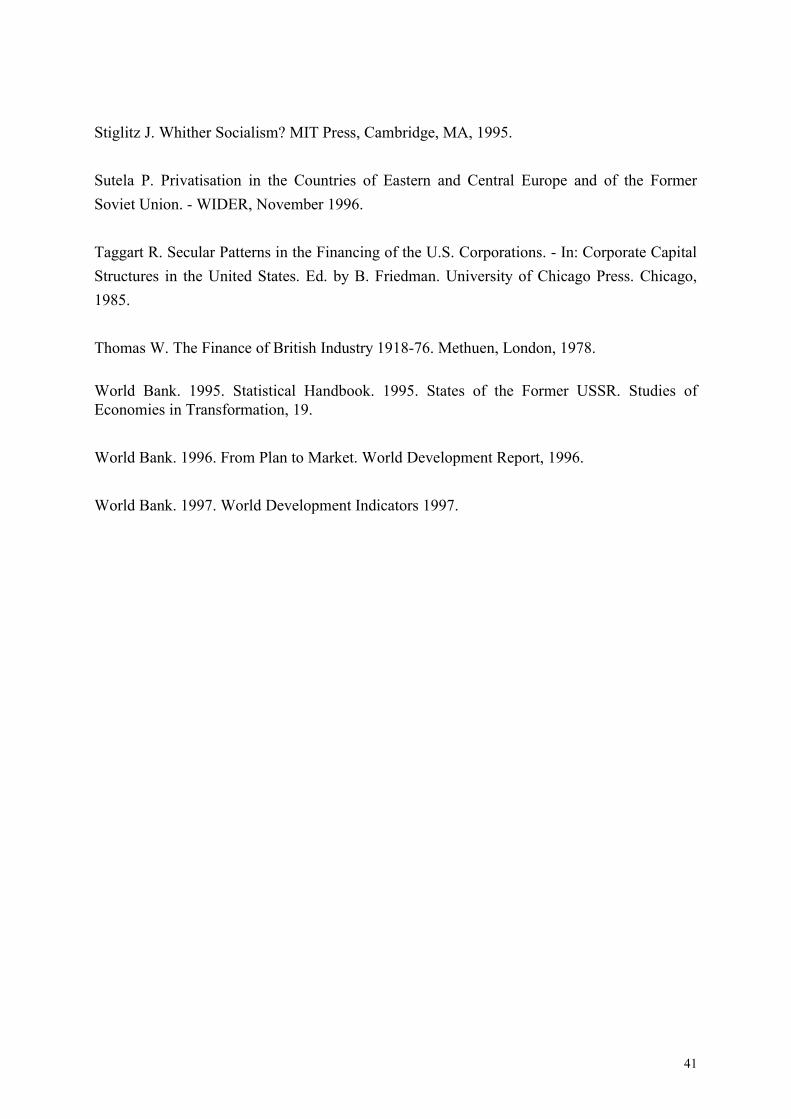
Stiglitz J. Whither Socialism? MIT Press, Cambridge, MA, 1995.
Sutela P. Privatisation in the Countries of Eastern and Central Europe and of the Former Soviet Union. - WIDER, November 1996.
Taggart R. Secular Patterns in the Financing of the U.S. Corporations. - In: Corporate Capital Structures in the United States. Ed. by B. Friedman. University of Chicago Press. Chicago, 1985.
Thomas W. The Finance of British Industry 1918-76. Methuen, London, 1978.
World Bank. 1995. Statistical Handbook. 1995. States of the Former USSR. Studies of Economies in Transformation, 19.
World Bank. 1996. From Plan to Market. World Development Report, 1996.
World Bank. 1997. World Development Indicators 1997.
41
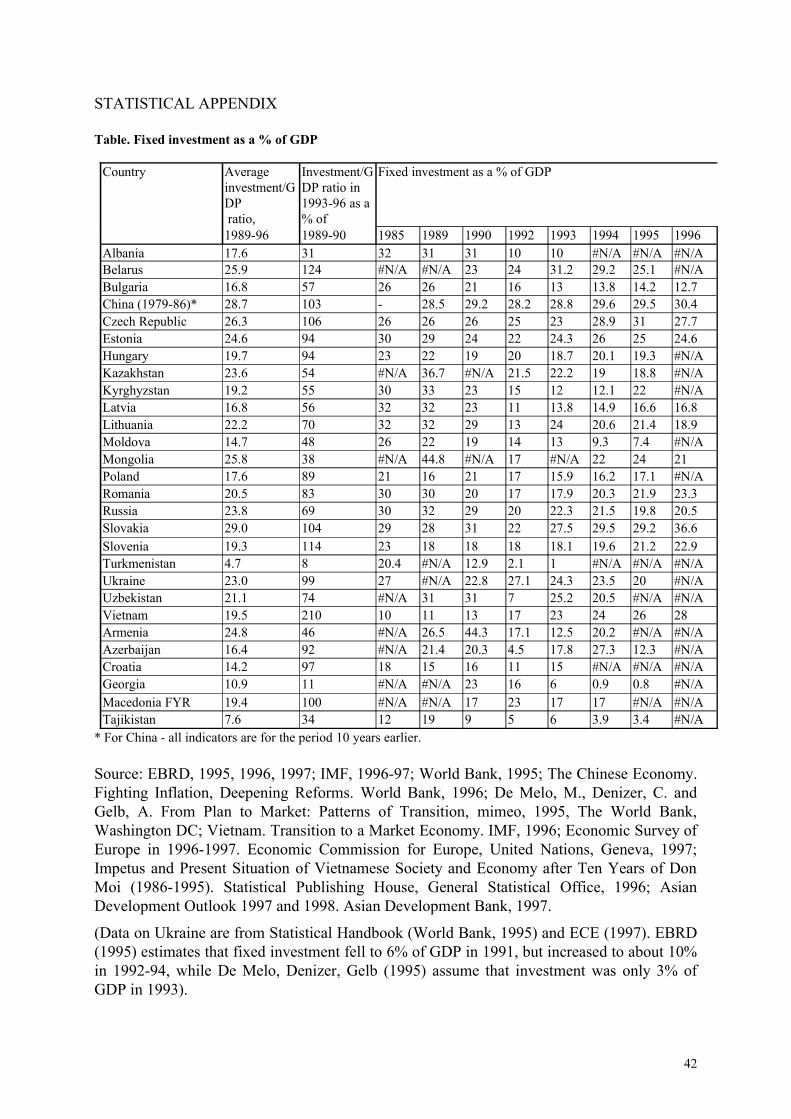
STATISTICAL APPENDIX
Table. Fixed investment as a % of GDP
Country Average investment/GDP ratio,
Investment/GDP ratio in 1993-96 as a % of
Fixed investment as a % of GDP
1989-96 1989-90 1985 1989 1990 1992 1993 1994 1995 1996Albania 17.6 31 32 31 31 10 10 #N/A #N/A #N/ABelarus 25.9 124 #N/A #N/A 23 24 31.2 29.2 25.1 #N/ABulgaria 16.8 57 26 26 21 16 13 13.8 14.2 12.7China (1979-86)* 28.7 103 - 28.5 29.2 28.2 28.8 29.6 29.5 30.4Czech Republic 26.3 106 26 26 26 25 23 28.9 31 27.7Estonia 24.6 94 30 29 24 22 24.3 26 25 24.6Hungary 19.7 94 23 22 19 20 18.7 20.1 19.3 #N/AKazakhstan 23.6 54 #N/A 36.7 #N/A 21.5 22.2 19 18.8 #N/AKyrghyzstan 19.2 55 30 33 23 15 12 12.1 22 #N/ALatvia 16.8 56 32 32 23 11 13.8 14.9 16.6 16.8Lithuania 22.2 70 32 32 29 13 24 20.6 21.4 18.9Moldova 14.7 48 26 22 19 14 13 9.3 7.4 #N/AMongolia 25.8 38 #N/A 44.8 #N/A 17 #N/A 22 24 21Poland 17.6 89 21 16 21 17 15.9 16.2 17.1 #N/ARomania 20.5 83 30 30 20 17 17.9 20.3 21.9 23.3Russia 23.8 69 30 32 29 20 22.3 21.5 19.8 20.5Slovakia 29.0 104 29 28 31 22 27.5 29.5 29.2 36.6Slovenia 19.3 114 23 18 18 18 18.1 19.6 21.2 22.9Turkmenistan 4.7 8 20.4 #N/A 12.9 2.1 1 #N/A #N/A #N/AUkraine 23.0 99 27 #N/A 22.8 27.1 24.3 23.5 20 #N/AUzbekistan 21.1 74 #N/A 31 31 7 25.2 20.5 #N/A #N/AVietnam 19.5 210 10 11 13 17 23 24 26 28Armenia 24.8 46 #N/A 26.5 44.3 17.1 12.5 20.2 #N/A #N/AAzerbaijan 16.4 92 #N/A 21.4 20.3 4.5 17.8 27.3 12.3 #N/ACroatia 14.2 97 18 15 16 11 15 #N/A #N/A #N/AGeorgia 10.9 11 #N/A #N/A 23 16 6 0.9 0.8 #N/AMacedonia FYR 19.4 100 #N/A #N/A 17 23 17 17 #N/A #N/ATajikistan 7.6 34 12 19 9 5 6 3.9 3.4 #N/A
* For China - all indicators are for the period 10 years earlier.
Source: EBRD, 1995, 1996, , 1997; IMF, 1996-97; World Bank, 1995; The Chinese Economy. Fighting Inflation, Deepening Reforms. World Bank, 1996; De Melo, M., Denizer, C. and Gelb, A. From Plan to Market: Patterns of Transition, mimeo, 1995, The World Bank, Washington DC; Vietnam. Transition to a Market Economy. IMF, 1996; Economic Survey of Europe in 1996-1997. Economic Commission for Europe, United Nations, Geneva, 1997; Impetus and Present Situation of Vietnamese Society and Economy after Ten Years of Don Moi (1986-1995). Statistical Publishing House, General Statistical Office, 1996; Asian Development Outlook 1997 and 1998. Asian Development Bank, 1997.
(Data on Ukraine are from Statistical Handbook (World Bank, 1995) and ECE (1997). EBRD (1995) estimates that fixed investment fell to 6% of GDP in 1991, but increased to about 10% in 1992-94, while De Melo, Denizer, Gelb (1995) assume that investment was only 3% of GDP in 1993).
42
Table . Financing of investment and related indicators*M2 as a % of GDP**
Domestic bank credit as a % of GDP
Credit to private sector in
Volume of trade in stocks
Central government capital
Inflation, in 1990-95, geo-
Country 1995 level
change from 1990 to 1995, p.p.
1995 level
change from 1990 to 1995, p.p.
1995, % of GDP
in 1996, % of GDP**
expenditure as a % of total outlays, 1991-95
metric average, % a year
Albania 48 -6 41.8 4.1 17.8 76.4Belarus 10 -64 15.4 -74.9 6.2 15.5 878.8Bulgaria 63 -37 0.001 2.9 81.2China*** 61 16 69 13 70.2 0.001 7.2 4Czech Republic 83 16 93.4 67.5 23 10.6 18.3Estonia 23 -51 12.8 -52.2 14.6 5.9 7.5 151.4Hungary 43 6 64.1 -18.5 26.2 5.7 22.3Kazakhstan 12 -62 9.5 -80.8 7.1 805.5Kyrghyzstan 18 -56 0.018 337.3Latvia 25 -49 13.7 -76.6 7.4 0.3 4.2 149.1Lithuania 23 -51 17.1 -73.2 17.2 0.6 12.2 241.4Moldova 11 -65 17.8 -48.9 5 355Mongolia 26 -3 11 -57.5 13.3 17.7 126.7Poland 32 8 34.6 15.1 12.8 11.7 3.5 34.9Romania 20 -36 23.6 -56.1 0.0018 10.8 158.4Russia 12 -62 20.7 -69.6 7.6 3 4.6 517Slovakia 62 -4 52.3 27.7 17.2 16Slovenia 32 13 36.6 -0.2 27.3 2.3**** 62.1Turkmenistan 0 1167Ukraine 14 -60 1040.5Uzbekistan 11 -63 0.3 628.4Vietnam 26.3Armenia 9.1 -53.1 7.3 0.001 896.6Azerbaijan 9 -65 10.8 -52.5 1 747.6Croatia 22 52.1 33.8 0.3 6.2 328Georgia 2280.2Macedonia FYR 397.9Tajikistan 399.1
* Figures were collected by OECD for listed and unlisted stocks, include OTC trading, and were computed by annualising the data for March-August 1996 which are compared to 1995 dollar GDP. For Russia estimates are for 1996 as a whole and are taken from press reports. For Armenia, Bulgaria, China, Croatia, Lithuania, Slovenia - OTC trading not included. ** It is assumed that for all former Soviet republics the M2/GDP ratio in 1990 was at the same level as in the USSR - 74%.*** For China - all indicators are for the period 10 years earlier.**** 1995.Source: EBRD, 1995, 1996, 1997; , 1997; The Chinese Economy. Fighting Inflation, Deepening Reforms. World Bank, 1996; World Bank, 1997; 1997; Economic Reform in China - A New Phase. IMF, 1994; IMF, 1996-97; Asian Development Outlook 1997 and 1998. Asian Development Bank, 1997; IFC, 1997; Johnson L.D., Neave E.H., Pazderka B. Financial Systems in Transition Economies. Paper for the European Public Choice Society Annual Meeting, Prague, Spring 1997, p.15.
43