financial technologies monthly market update
TRANSCRIPT

Financial Technologies Monthly Market UpdateMarch 2019
1

Table of Contents
2
FinTech Summit 4
Market Valuations 13
M&A Trends 20
Capital Raising Trends 22
US IPO Market Update 27
Banks, Capital Markets and FinTech US Public Offerings 28
Index Performance 7
Vikas Shah – Institutional Investor’s Fintech Finance 40 (2018 & 2019)
Click here to read the full coverage
3

S A V E T H E D AT EThursday, May 23rd, 2019
11th Annual FinTech SummitConvene Conference Center I 730 Third Avenue, New York, NY 10017
4
If you're interested in attending our 11th Annual FinTech Summit, please click here to fill out a brief form.For further information, please contact your Rosenblatt representative or email [email protected]

Sample companies in our FinTech Summit history
5
Capital Markets
Payments
Lending & CreditPersonal Finance & Investment Mgmt.
InsurTechInst. SW Solutions
Blockchain AI / ML Cyber Security
Rosenblatt’s annual Financial Technology Summit has showcased more than 150 fast-growing FinTech companies in the past decade attracting senior executives from the financial services and the institutional investment community
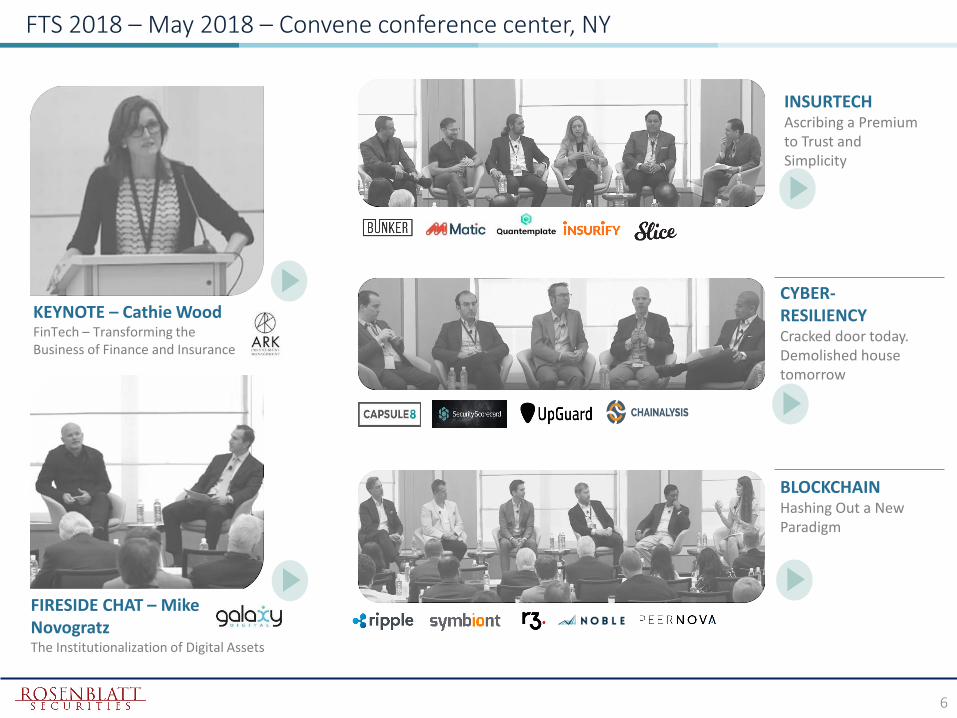
FTS 2018 – May 2018 – Convene conference center, NY
6
FIRESIDE CHAT – Mike NovogratzThe Institutionalization of Digital Assets
INSURTECHAscribing a Premium to Trust and Simplicity
BLOCKCHAINHashing Out a New Paradigm
CYBER-RESILIENCYCracked door today. Demolished house tomorrow
KEYNOTE – Cathie WoodFinTech – Transforming the Business of Finance and Insurance

Cap Weighted Price Return Index Performance – Payments (LTM)
7Source: Bloomberg, Capital IQ, Updated on 3/01/2019Note: The index is made up of companies mentioned under each of the above buckets in subsequent slides except, the index does not adjust for any new companies added and excludes old companies delisted in last twelve months
% ∆ YoY ↑ 4.7% 23.6% 28.4% 22.2%
% ∆ MoM ↑ 4.6% 9.1% 6.7% 6.4%
-30%
-20%
-10%
0%
10%
20%
30%
40%
3/1/18 4/1/18 5/1/18 6/1/18 7/1/18 8/1/18 9/1/18 10/1/18 11/1/18 12/1/18 1/1/19 2/1/19 3/1/19
^SPX Card Networks Payment Infrastructure P2P Transfer and Remittances

% ∆ YoY ↑ 4.7% -14.9% 7.7% -4.2% -5.9%
% ∆ MoM ↑ 4.6% 3.2% 3.5% 1.7% 4.0%
Cap Weighted Price Return Index Performance – Capital Markets (LTM)
8
-30%
-25%
-20%
-15%
-10%
-5%
0%
5%
10%
15%
3/1/18 4/1/18 5/1/18 6/1/18 7/1/18 8/1/18 9/1/18 10/1/18 11/1/18 12/1/18 1/1/19 2/1/19 3/1/19
^SPX Broker Dealers and Market Makers Large Exchanges Regional Exchanges Retail / e - Brokers
Source: Bloomberg, Capital IQ, Updated on 3/01/2019Note: The index is made up of companies mentioned under each of the above buckets in subsequent slides except, the index does not adjust for any new companies added and excludes old companies delisted in last twelve months

Cap Weighted Price Return Index Performance – Software and Technology (LTM)
9
% ∆ YoY ↑ 4.7% 15.1% -13.4% 5.6%
% ∆ MoM ↑ 4.6% 8.5% -1.3% 13.2%
-30%
-20%
-10%
0%
10%
20%
3/1/18 4/1/18 5/1/18 6/1/18 7/1/18 8/1/18 9/1/18 10/1/18 11/1/18 12/1/18 1/1/19 2/1/19 3/1/19
^SPX Financial Media Trading Technology Outsourced / Backend Solutions
Source: Bloomberg, Capital IQ, Updated on 3/01/2019Note: The index is made up of companies mentioned under each of the above buckets in subsequent slides except, the index does not adjust for any new companies added and excludes old companies delisted in last twelve months

-36%
-31%
-26%
-21%
-16%
-11%
-6%
-1%
4%
9%
3/1/18 4/1/18 5/1/18 6/1/18 7/1/18 8/1/18 9/1/18 10/1/18 11/1/18 12/1/18 1/1/19 2/1/19 3/1/19
^SPX Alternative Lending Global Diversified Banks
Cap Weighted Price Return Index Performance – Banks (LTM)
10
% ∆ YoY ↑ 4.7% -0.5% -11.9%
% ∆ MoM ↑ 4.6% 8.6% 0.6%
Source: Bloomberg, Capital IQ, Updated on 3/01/2019Note: The index is made up of companies mentioned under each of the above buckets in subsequent slides except, the index does not adjust for any new companies added and excludes old companies delisted in last twelve months

12.1 x
14.4 x
9.2 x
17.1 x
21.6 x
27.1 x
23.6 x
27.7 x
30.5 x
6.2 x
28.8 x
29.4 x
Global Diversified Banks
Alternative Lending
Broker Dealers and Market Makers
Regional Exchanges
Retail / E- Brokers
Global Exchanges
Trading Technology
Outsourced / Backend Solutions
Financial Data / Information Providers
P2P Transfer and Remittances
Payment Infrastructure
Card Networks
Ap
plic
atio
n
Soft
war
ePa
ymen
tsLe
nd
ers
Cap
ital
Mar
kets
2018 A/E 2019 EConsensus P / E
11
11.0 x
15.2 x
12.5 x
17.3 x
14.9 x
22.1 x
21.6 x
23.0 x
25.0 x
9.5 x
24.6 x
23.1 x
Global Diversified Banks
Alternative Lending
Broker Dealers and Market Makers
Regional Exchanges
Retail / E- Brokers
Global Exchanges
Trading Technology
Outsourced / Backend Solutions
Financial Data / Information Providers
P2P Transfer and Remittances
Payment Infrastructure
Card Networks
Source: Bloomberg, Capital IQ, Updated on 3/01/2019
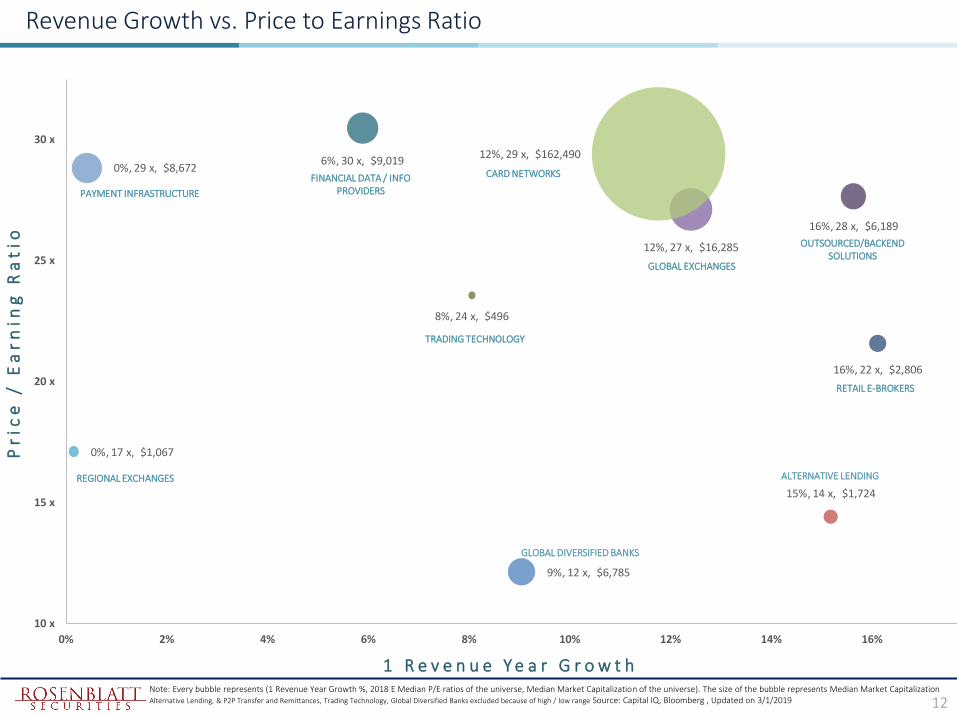
9%, 12 x, $6,785
15%, 14 x, $1,724
12%, 27 x, $16,285
0%, 17 x, $1,067
16%, 22 x, $2,806
8%, 24 x, $496
16%, 28 x, $6,189
6%, 30 x, $9,019 0%, 29 x, $8,672
12%, 29 x, $162,490
10 x
15 x
20 x
25 x
30 x
0% 2% 4% 6% 8% 10% 12% 14% 16% 18% 20%
Revenue Growth vs. Price to Earnings Ratio
REGIONAL EXCHANGES
RETAIL E-BROKERS
CARD NETWORKS
PAYMENT INFRASTRUCTURE
OUTSOURCED/BACKEND SOLUTIONS
FINANCIAL DATA / INFO PROVIDERS
Pr
ice
/ E
ar
nin
g R
at
io
1 R e v e n u e Y e a r G r o w t h Note: Every bubble represents (1 Revenue Year Growth %, 2018 E Median P/E ratios of the universe, Median Market Capitalization of the universe). The size of the bubble represents Median Market CapitalizationAlternative Lending, & P2P Transfer and Remittances, Trading Technology, Global Diversified Banks excluded because of high / low range Source: Capital IQ, Bloomberg , Updated on 3/1/2019 12
TRADING TECHNOLOGY
ALTERNATIVE LENDING
GLOBAL DIVERSIFIED BANKS
GLOBAL EXCHANGES

LTM 2018 A/E 2019 E LTM 2018 A/E 2019 E LTM 2018 A/E 2019 E LTM P/BDebt /
EquityROE 1 Year
5 Year
CAGR
Banks n/a n/a n/a n/a n/a n/a 11.8x 15.1x 11.8x 1.3x 81% 12% 10% 5%
CapitalMarkets n/a n/a n/a n/a n/a n/a 19.4 21.9 17.4 2.7 20% 15% 13% 9%
ApplicationSoftware 5.0 4.8 4.7 17.9 18.3 17.6 26.4 29.2 23.8 5.1 21% 21% 11% 9%
Payments 5.1 5.8 5.3 n/a 18.2 17.4 29.0 28.3 24.4 5.8 84% 16% 7% 7%
Sub - Sector LTM 2018 A/E 2019 E LTM 2018 A/E 2019 E LTM 2018 A/E 2019 E LTM P/BDebt /
EquityROE 1 Year
5 Year
CAGR
Global Diversified Banks 2.8x 3.8x 3.7x 5.3x 9.8x 11.2x 11.6x 12.1x 11.0x 1.0x 139% 10% 9% 1%
Alternative Lending 3.5x 4.9x 4.3x 12.7x 31.2x 14.8x 15.9x 14.4x 15.2x 1.5x 170% 12% 15% 41%
Global Exchanges 9.2x 10.1x 9.3x 15.4x 17.0x 15.4x 26.7x 27.1x 22.1x 3.7x 23% 14% 12% 9%
Regional Exchanges 6.4x 6.6x 6.3x 12.9x 11.9x 11.4x 17.3x 17.1x 17.3x 3.2x 0% 20% 0% 2%
Broker Dealers and Market Makers 1.4x 1.5x 1.3x 9.5x 9.9x 7.0x 10.8x 9.2x 12.5x 2.3x 53% 17% 15% 12%
Retail / E- Brokers 4.5x 5.3x 4.6x 10.0x 13.1x 9.4x 16.8x 21.6x 14.9x 2.4x 33% 16% 16% 9%
Trading Technology 2.3x 2.6x 2.3x 13.4x 15.7x 13.3x 30.3x 23.6x 21.6x 3.2x n/a 16% 8% 9%
Outsourced / Backend Solutions 6.6x 6.5x 6.5x 16.5x 23.9x 20.0x 26.8x 27.7x 23.0x 7.0x 4% 17% 16% 12%
Financial Data / Information Providers 4.9x 6.2x 5.0x 19.8x 18.5x 17.5x 25.8x 30.5x 25.0x 6.2x 35% 23% 6% 8%
Payment Infrastructure 5.2x 6.0x 5.5x 16.7x 17.2x 16.8x 30.1x 28.8x 24.6x 5.8x 87% 12% 0% 7%
P2P Transfer and Remittances 1.9x 1.9x 1.8x 11.4x 7.6x 7.4x 9.6x 6.2x 9.5x 7.5x n/a 13% 1% 0%
Card Networks 8.7x 10.1x 9.0x 16.1x 27.6x 23.4x 21.0x 29.4x 23.1x 7.3x 175% 36% 12% 9%
Growth %
Growth %
TEV / EBITDA Price / EarningsTEV / Sales
TEV / Sales TEV / EBITDA Price / Earnings
Market Valuations
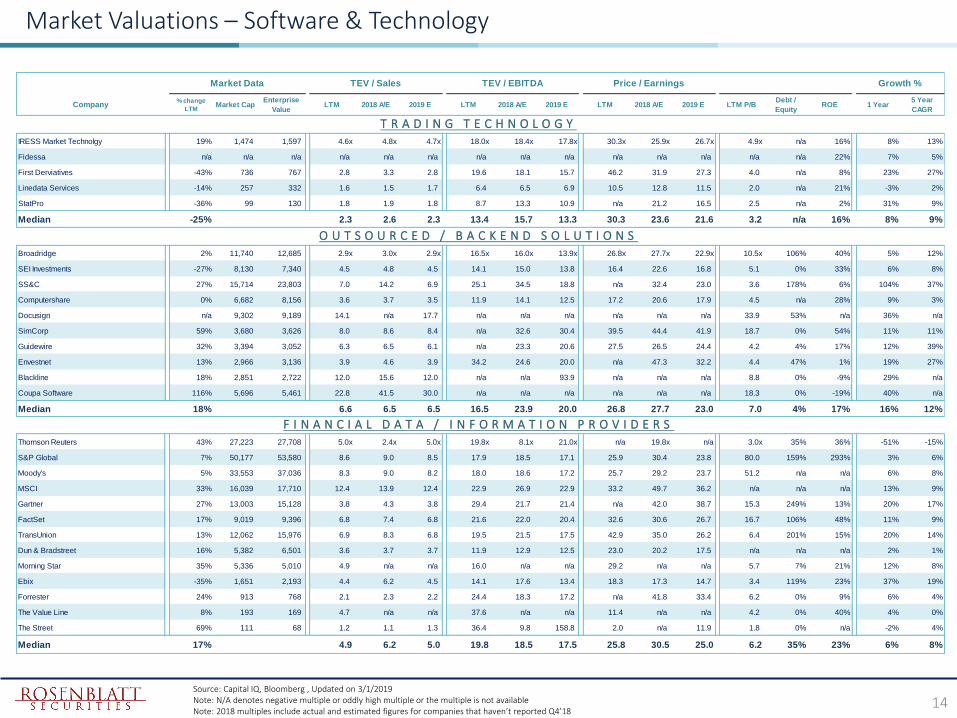
Source: Capital IQ, Bloomberg , Updated on 3/1/2019Note: N/A denotes negative multiple or oddly high multiple or the multiple is not availableNote: 2018 multiples include actual and estimated figures for companies that haven’t reported Q4’18
13
Banks
Application Software
Payments
Capital Markets
Company% change
LTMMarket Cap
Enterprise
ValueLTM 2018 A/E 2019 E LTM 2018 A/E 2019 E LTM 2018 A/E 2019 E LTM P/B
Debt /
EquityROE 1 Year
5 Year
CAGR
IRESS Market Technolgy 19% 1,474 1,597 4.6x 4.8x 4.7x 18.0x 18.4x 17.8x 30.3x 25.9x 26.7x 4.9x n/a 16% 8% 13%
Fidessa n/a n/a n/a n/a n/a n/a n/a n/a n/a n/a n/a n/a n/a n/a 22% 7% 5%
First Derviatives -43% 736 767 2.8 3.3 2.8 19.6 18.1 15.7 46.2 31.9 27.3 4.0 n/a 8% 23% 27%
Linedata Services -14% 257 332 1.6 1.5 1.7 6.4 6.5 6.9 10.5 12.8 11.5 2.0 n/a 21% -3% 2%
StatPro -36% 99 130 1.8 1.9 1.8 8.7 13.3 10.9 n/a 21.2 16.5 2.5 n/a 2% 31% 9%
Median -25% 2.3 2.6 2.3 13.4 15.7 13.3 30.3 23.6 21.6 3.2 n/a 16% 8% 9%
Broadridge 2% 11,740 12,685 2.9x 3.0x 2.9x 16.5x 16.0x 13.9x 26.8x 27.7x 22.9x 10.5x 106% 40% 5% 12%
SEI Investments -27% 8,130 7,340 4.5 4.8 4.5 14.1 15.0 13.8 16.4 22.6 16.8 5.1 0% 33% 6% 8%
SS&C 27% 15,714 23,803 7.0 14.2 6.9 25.1 34.5 18.8 n/a 32.4 23.0 3.6 178% 6% 104% 37%
Computershare 0% 6,682 8,156 3.6 3.7 3.5 11.9 14.1 12.5 17.2 20.6 17.9 4.5 n/a 28% 9% 3%
Docusign n/a 9,302 9,189 14.1 n/a 17.7 n/a n/a n/a n/a n/a n/a 33.9 53% n/a 36% n/a
SimCorp 59% 3,680 3,626 8.0 8.6 8.4 n/a 32.6 30.4 39.5 44.4 41.9 18.7 0% 54% 11% 11%
Guidewire 32% 3,394 3,052 6.3 6.5 6.1 n/a 23.3 20.6 27.5 26.5 24.4 4.2 4% 17% 12% 39%
Envestnet 13% 2,966 3,136 3.9 4.6 3.9 34.2 24.6 20.0 n/a 47.3 32.2 4.4 47% 1% 19% 27%
Blackline 18% 2,851 2,722 12.0 15.6 12.0 n/a n/a 93.9 n/a n/a n/a 8.8 0% -9% 29% n/a
Coupa Software 116% 5,696 5,461 22.8 41.5 30.0 n/a n/a n/a n/a n/a n/a 18.3 0% -19% 40% n/a
Median 18% 6.6 6.5 6.5 16.5 23.9 20.0 26.8 27.7 23.0 7.0 4% 17% 16% 12%
Growth %Market Data TEV / Sales TEV / EBITDA Price / Earnings
Market Valuations – Software & Technology
T R A D I N G T E C H N O L O G Y
O U T S O U R C E D / B A C K E N D S O L U T I O N S
14
Thomson Reuters 43% 27,223 27,708 5.0x 2.4x 5.0x 19.8x 8.1x 21.0x n/a 19.8x n/a 3.0x 35% 36% -51% -15%
S&P Global 7% 50,177 53,580 8.6 9.0 8.5 17.9 18.5 17.1 25.9 30.4 23.8 80.0 159% 293% 3% 6%
Moody's 5% 33,553 37,036 8.3 9.0 8.2 18.0 18.6 17.2 25.7 29.2 23.7 51.2 n/a n/a 6% 8%
MSCI 33% 16,039 17,710 12.4 13.9 12.4 22.9 26.9 22.9 33.2 49.7 36.2 n/a n/a n/a 13% 9%
Gartner 27% 13,003 15,128 3.8 4.3 3.8 29.4 21.7 21.4 n/a 42.0 38.7 15.3 249% 13% 20% 17%
FactSet 17% 9,019 9,396 6.8 7.4 6.8 21.6 22.0 20.4 32.6 30.6 26.7 16.7 106% 48% 11% 9%
TransUnion 13% 12,062 15,976 6.9 8.3 6.8 19.5 21.5 17.5 42.9 35.0 26.2 6.4 201% 15% 20% 14%
Dun & Bradstreet 16% 5,382 6,501 3.6 3.7 3.7 11.9 12.9 12.5 23.0 20.2 17.5 n/a n/a n/a 2% 1%
Morning Star 35% 5,336 5,010 4.9 n/a n/a 16.0 n/a n/a 29.2 n/a n/a 5.7 7% 21% 12% 8%
Ebix -35% 1,651 2,193 4.4 6.2 4.5 14.1 17.6 13.4 18.3 17.3 14.7 3.4 119% 23% 37% 19%
Forrester 24% 913 768 2.1 2.3 2.2 24.4 18.3 17.2 n/a 41.8 33.4 6.2 0% 9% 6% 4%
The Value Line 8% 193 169 4.7 n/a n/a 37.6 n/a n/a 11.4 n/a n/a 4.2 0% 40% 4% 0%
The Street 69% 111 68 1.2 1.1 1.3 36.4 9.8 158.8 2.0 n/a 11.9 1.8 0% n/a -2% 4%
Median 17% 4.9 6.2 5.0 19.8 18.5 17.5 25.8 30.5 25.0 6.2 35% 23% 6% 8%
F I N A N C I A L D A T A / I N F O R M A T I O N P R O V I D E R S
Source: Capital IQ, Bloomberg , Updated on 3/1/2019Note: N/A denotes negative multiple or oddly high multiple or the multiple is not availableNote: 2018 multiples include actual and estimated figures for companies that haven’t reported Q4’18

Company% change
LTMMarket Cap
Enterprise
ValueLTM 2018 A/E 2019 E LTM 2018 A/E 2019 E LTM 2018 A/E 2019 E LTM P/B
Debt /
EquityROE 1 Year
5 Year
CAGR
Visa 24% 300,043 306,258 14.4x 16.3x 14.5x 21.9x 23.4x 20.7x 28.3x 40.2x 31.4x 10.5x 49% 38% 12% 12%
MasterCard 31% 233,138 231,188 15.5 18.6 15.5 29.9 31.8 26.0 40.4 49.7 35.2 43.4 106% 108% 20% 12%
American Express 14% 91,843 125,921 2.9 3.8 3.1 10.2 n/a n/a 13.7 18.6 14.7 4.1 276% 34% 11% 4%
Discover Financial -4% 23,591 38,090 3.0 3.9 3.6 6.2 n/a n/a 9.2 12.1 9.2 2.3 245% 26% 11% 7%
Median 19% 8.7 10.1 9.0 16.1 27.6 23.4 21.0 29.4 23.1 7.3 175% 36% 12% 9%
PayPal 26% 115,913 108,802 7.0x 8.4x 7.0x 36.6x 32.0x 27.0x n/a n/a 41.2x 7.5x n/a 13% 18% 18%
Western Union -7% 7,938 10,398 1.9 1.9 1.8 7.5 7.6 7.4 9.6 10.0 9.5 n/a n/a n/a 1% 0%
Moneygram International Inc. -76% 138 1,078 0.7 0.7 0.7 11.4 3.9 4.5 n/a 2.4 3.4 n/a n/a n/a -10% 0%
Median -7% 1.9 1.9 1.8 11.4 7.6 7.4 9.6 6.2 9.5 7.5 n/a 13% 1% 0%
Fidelity National Information 13% 35,001 43,290 5.1x 4.7x 5.1x 15.0x 14.2x 13.7x 42.0x 24.6x 20.8x 3.5x 87% 8% -3% 7%
Fiserv 22% 33,829 39,373 6.8 6.9 6.8 17.1 19.2 17.9 29.7 34.0 27.7 14.8 260% 47% 2% 4%
WorldPay 20% 30,362 38,420 9.8 18.1 9.8 26.8 37.9 20.4 n/a 29.2 24.4 3.1 75% 0% -3% 13%
Square, Inc 68% 32,510 32,293 9.8 33.4 20.5 n/a 236.9 127.5 n/a n/a n/a 28.8 81% -4% 49% 43%
Global Payments 18% 20,723 25,538 7.6 6.7 6.0 20.3 19.6 16.8 46.0 28.1 23.2 5.2 120% 12% -15% 7%
First Data 67% 24,164 41,285 4.3 5.6 4.8 13.8 13.6 12.6 23.9 17.1 18.4 5.8 233% 27% -21% -3%
Total System 9% 16,849 20,251 5.0 4.4 5.0 16.4 17.0 15.0 30.1 28.5 21.3 6.7 149% 24% -18% 14%
Jack Henry 14% 10,323 10,297 6.5 7.0 6.7 18.6 19.8 19.3 33.4 39.4 37.2 7.4 0% 24% 7% 6%
Euronet 63% 7,022 6,609 2.6 2.9 2.6 14.2 15.9 13.4 31.1 29.7 24.7 5.7 49% 19% 13% 12%
ACI Worldwide 43% 3,841 4,364 4.3 4.3 4.1 19.5 17.2 16.2 n/a 47.0 40.3 3.7 62% 8% -1% 3%
Bottomline Technologies 36% 2,196 2,204 5.3 6.0 5.5 45.8 26.8 23.0 n/a 46.9 40.3 5.7 30% 5% 13% 9%
Evo Payments n/a 2,183 2,762 n/a n/a 4.8 n/a n/a 18.8 n/a n/a 48.4 47.8 380% n/a n/a n/a
Evertec 75% 2,063 2,535 5.6 6.4 5.6 13.5 14.6 12.0 23.9 19.6 15.4 9.8 243% 49% 11% 5%
Cardtronics 34% 1,403 2,202 1.6 1.5 1.6 8.8 6.6 7.7 n/a 10.5 15.2 3.7 217% 1% -11% 9%
Cass Information 6% 762 582 3.9 n/a n/a 11.3 n/a n/a 25.5 n/a n/a 3.4 0% 13% 8% 5%
I3 Verticals n/a 555 682 n/a n/a 6.2 n/a n/a 22.7 n/a n/a 37.6 13.7 43% n/a 22% n/a
Median 28% 5.2 6.0 5.3 16.7 17.2 16.5 30.1 28.8 24.4 5.7 100% 12% -1% 7%
Growth %Market Data TEV / Sales TEV / EBITDA Price / Earnings
C A R D N E T W O R K S
Market Valuations – Payments
15
P 2 P T R A N S F E R S A N D R E M I T T A N C E S
P A Y M E N T I N F R A S T R U C T U R E
Source: Capital IQ, Bloomberg , Updated on 3/1/2019Note: N/A denotes negative multiple or oddly high multiple or the multiple is not availableNote: 2018 multiples include actual and estimated figures for companies that haven’t reported Q4’18

Company% change
LTMMarket Cap
Enterprise
ValueLTM 2018 A/E 2019 E LTM 2018 A/E 2019 E LTM 2018 A/E 2019 E LTM P/B
Debt /
EquityROE 1 Year
5 Year
CAGR
CME 14% 65,330 68,330 15.9x 18.8x 16.0x 23.9x 27.3x 22.2x 31.8x 38.4x 27.0x 2.5x 17% 8% 18% 8%
ICE 7% 43,882 50,700 10.2 11.0 10.2 16.0 17.2 15.9 22.3 26.2 21.6 2.6 43% 12% 7% 26%
Hong Kong Exch. & Clearing Ltd. -4% 43,883 30,723 16.9 18.4 15.3 20.5 25.4 20.3 36.7 45.9 36.5 8.5 5% 24% 23% 12%
Deutsche Boerse 4% 24,401 26,040 8.0 8.5 8.5 15.4 14.5 14.1 24.4 22.5 21.0 4.3 46% 19% 13% 8%
London Stock Exchange 19% 21,586 22,854 8.0 8.5 8.4 16.4 17.6 16.7 33.6 30.2 27.5 4.9 n/a 15% 9% 20%
Nasdaq 16% 15,217 18,235 7.2 7.5 7.2 14.7 14.7 13.9 33.3 22.0 19.0 2.8 70% 8% 5% 6%
BM&F Bovespa SA 25% 17,354 16,264 12.2 13.3 12.5 17.7 23.2 18.1 30.0 28.0 25.3 2.6 11% 8% 32% 18%
CBOE -14% 10,736 11,650 9.6 10.8 9.7 14.5 17.9 14.2 25.5 28.2 19.8 3.3 28% 13% 22% 16%
Japan Exchange Group 10% 9,523 8,661 7.7 8.0 7.8 11.6 13.3 12.2 20.3 21.9 20.9 3.9 19% 19% 12% 11%
Australian Stock Exchange 21% 9,617 6,748 10.7 11.2 11.1 14.2 14.6 14.8 27.9 28.3 28.0 3.5 n/a 12% 8% 6%
Singapore Exchange 5% 6,231 5,731 8.9 9.4 9.0 15.5 16.8 15.9 22.6 23.6 22.5 8.8 0% 39% 5% 3%
Euronext -4% 4,344 4,216 5.8 6.3 6.1 10.8 11.5 10.5 16.9 16.9 16.0 4.8 63% 29% 16% 5%
Median 8% 9.2 10.1 9.3 15.4 17.0 15.4 26.7 27.1 22.1 3.7 23% 14% 12% 9%
TEV / Sales TEV / EBITDA Price / Earnings Growth %Market Data
Market Valuations – Capital Markets
L A R G E E X C H A N G E S
R E G I O N A L E X C H A N G E S
16Source: Capital IQ, Bloomberg , Updated on 3/1/2019Note: N/A denotes negative multiple or oddly high multiple or the multiple is not availableNote: 2018 multiples include actual and estimated figures for companies that haven’t reported Q4’18

Company% change
LTMMarket Cap
Enterprise
ValueLTM 2018 A/E 2019 E LTM P/B
Debt /
EquityROE 1 Year
5 Year
CAGR
Charles Schwab -10% 62,393 46,014 19.0x 28.9x 19.2x 3.5x 33% 20% 23% 15%
TD Ameritrade 0% 32,198 32,863 18.3 27.3 16.5 3.9x 42% 23% 48% 14%
Interactive Brokers -16% 23,072 26,809 24.0 33.4 26.1 3.3x 0% 14% 23% 16%
E*Trade -1% 12,444 13,168 12.9 21.8 13.1 2.1x 21% 17% 24% 9%
MarketAxess 18% 9,866 9,379 n/a n/a n/a 15.1x 0% 31% 11% 13%
IG Group -28% 2,815 2,361 10.0 10.8 11.0 2.6x n/a 27% 14% 8%
LPL Financial 22% 6,477 8,635 15.4 34.6 14.7 6.7x 243% 45% 21% 5%
Matsui Securities 18% 2,806 3,822 26.3 n/a n/a 3.3x 123% 12% 16% 9%
Comdirect Bank -12% 1,621 n/a 33.7 19.1 17.4 2.2x 0% 8% -33% -6%
Monex 21% 1,062 2,351 24.7 21.4 21.5 1.5x 185% 6% 14% 6%
Swissquote Group 1% 742 n/a 14.3 19.0 14.9 2.2x n/a 16% 28% 12%
Gain 1% 312 91 10.6 n/a 9.7 0.9x 38% 29% n/a n/a
VIEL et Cie -6% 442 578 10.4 12.5 12.4 1.1x n/a 10% -2% -3%
Bourse Direct -30% 74 n/a 24.9 n/a n/a 1.0x n/a 5% n/a n/a
Median -1% 16.8 21.6 14.9 2.4x 33% 16% 16% 9%
Market Data Price / Earnings Growth %
Market Valuations – Capital Markets
R E T A I L / e - B R O K E R S
17
B R O K E R D E A L E R S & M A R K E T M A K E R S
Raymond James -8% 11,912 10,777 12.4x 15.6x 12.5x 1.9x 44% 17% 15% 10%
TP ICAP -39% 2,402 2,339 40.9x 9.2x 10.0x 1.0x n/a 2% 97% 16%
BGC Partners -26% 3,134 4,447 10.8x 5.9x 5.2x 2.7x 89% 28% -42% 3%
Virtu Financial -13% 4,843 8,068 8.5x n/a 13.3x 3.2x 62% 25% 83% 23%
INTL FCStone 9% 840 2,065 10.3x n/a n/a 1.6x 83% 17% 24% 16%
ITG 54% 1,000 1,016 n/a n/a 29.9x 2.8x 15% 0% 3% -1%
Ladenburg Thalmann -10% 437 785 n/a n/a n/a n/a 0% n/a 15% 14%
Median -10% 10.8x 9.2x 12.5x 2.3x 53% 17% 15% 12%
Source: Capital IQ, Bloomberg , Updated on 3/1/2019Note: N/A denotes negative multiple or oddly high multiple or the multiple is not availableNote: 2018 multiples include actual and estimated figures for companies that haven’t reported Q4’18

Company% change
LTMMarket Cap
Enterprise
ValueLTM 2018 A/E 2019 E LTM P/B
Debt /
EquityROE 1 Year
5 Year
CAGR
JP Morgan Chase -8% 341,929 n/a 11.6x 15.2x 11.3x 1.5x 145% 13% 14% 4%
Wells Fargo -13% 227,608 n/a 11.6x 12.3x 11.5x 1.3x 116% 12% 0 3%
Bank of America -7% 283,098 n/a 11.1x 16.2x 11.5x 1.2x 86% 11% 10% 2%
Citigroup -12% 151,603 n/a 9.6x 12.3x 9.8x 0.9x 134% 9% 9% 1%
Goldman Sachs -23% 75,886 n/a 7.8x 10.5x 8.2x 0.9x 330% 13% 22% 5%
U.S, Bancorp -3% 82,784 n/a 12.5x 15.1x 12.6x 1.9x 80% 15% 9% 4%
Morgan Stanley -22% 72,623 n/a 8.9x 12.1x 8.8x 1.0x 245% 12% 15% 6%
Capital One -13% 39,424 n/a 7.1x 10.8x 7.3x 0.8x 113% 12% 8% 6%
US Banks Median -13% 9.6x 12.3x 9.8x 1.0x 116% 12%n/a 9% 4%
HSBC -15% 162,600 n/a 13.2x 12.1x 10.7x 1.0x 55% 8% 13% -2%
Commonwealth Bank of Australia -2% 93,146 n/a 13.7x 12.6x 13.6x 1.9x n/a 14% 3% 0%
Royal Bank of Canada 3% 111,802 n/a 11.8x 13.1x 12.1x 2.0x 11% 18% 14% 8%
Lloyds -8% 59,206 n/a 11.9x 7.4x 8.2x 1.0x 209% 9% -9% -7%
BNP Paribas -31% 63,769 n/a 7.4x 6.5x 7.4x 0.6x 212% 8% -10% 0%
Royal Bank of Scotland -1% 41,892 n/a 19.3x 9.6x 9.5x 0.7x 27% 4% 4% -7%
UBS -25% 49,051 n/a 9.5x 9.5x 9.2x 0.9x 267% 9% 10% 2%
Barclays -23% 36,771 n/a 17.9x 10.1x 7.9x 0.5x 161% 3% 7% -5%
Deutsche Bank -36% 19,214 n/a n/a 10.7x 26.6x 0.3x 226% -3% -40% -11%
Bank of Montreal 7% 49,572 n/a 11.2x 12.1x 11.4x 1.5x 14% 14% 15% 9%
Credit Suisse -27% 31,643 n/a 15.1x 16.0x 12.6x 0.7x 350% 5% 8% -2%
Standard Chartered -23% 26,714 n/a 40.5x 15.1x 11.3x 0.6x n/a 1% 13% -2%
Foreign Banks Median -19% 13.2 11.4 11.0 0.8 185% 8%n
/7% -2%
Market Data Price / Earnings Growth %
G L O B A L D I V E R S I F I E D I N V E S T M E N T B A N K S
Market Valuations – Banks
18Source: Capital IQ, Bloomberg , Updated on 3/1/2019Note: N/A denotes negative multiple or oddly high multiple or the multiple is not availableNote: 2018 multiples include actual and estimated figures for companies that haven’t reported Q4’18
19
A L T E R N A T I V E L E N D I N G
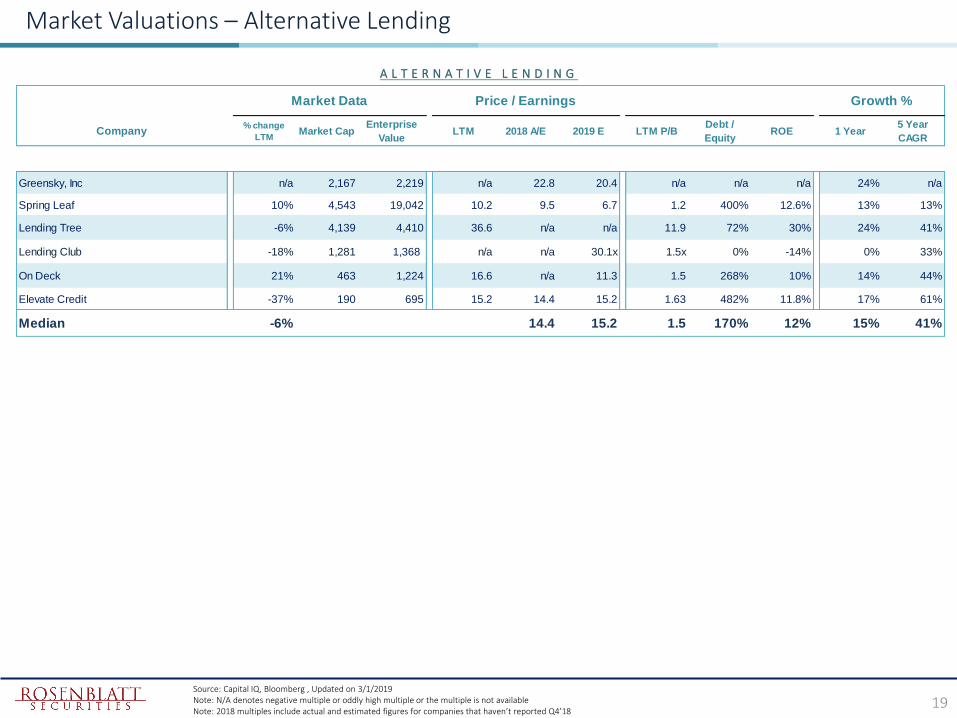
Market Valuations – Alternative Lending
Company% change
LTMMarket Cap
Enterprise
ValueLTM 2018 A/E 2019 E LTM P/B
Debt /
EquityROE 1 Year
5 Year
CAGR
Greensky, Inc n/a 2,167 2,219 n/a 22.8 20.4 n/a n/a n/a 24% n/a
Spring Leaf 10% 4,543 19,042 10.2 9.5 6.7 1.2 400% 12.6% 13% 13%
Lending Tree -6% 4,139 4,410 36.6 n/a n/a 11.9 72% 30% 24% 41%
Lending Club -18% 1,281 1,368 n/a n/a 30.1x 1.5x 0% -14% 0% 33%
On Deck 21% 463 1,224 16.6 n/a 11.3 1.5 268% 10% 14% 44%
Elevate Credit -37% 190 695 15.2 14.4 15.2 1.63 482% 11.8% 17% 61%
Median -6% 14.4 15.2 1.5 170% 12% 15% 41%
Market Data Price / Earnings Growth %
Source: Capital IQ, Bloomberg , Updated on 3/1/2019Note: N/A denotes negative multiple or oddly high multiple or the multiple is not availableNote: 2018 multiples include actual and estimated figures for companies that haven’t reported Q4’18

20
M&A Trends

1
3
6
2
4
6
1 1
6
1
4
2
1
4
5
2
1
22
3
1 1
3
2
5
8
1
CAPITAL MARKETS INSTITUTIONAL SOFTWARE SOLUTIONS FOR CORPORATES
INSURANCE TECH LENDING & CREDIT PAYMENTS PERSONAL FINANCE AND INVESTMENT MANAGEMENT
2018 - September 2018 - October 2018 - November 2018 - December 2019 - January 2019 - February
Select Last 6 Months - M&A Transactions Trend
Source: Capital IQ, Bloomberg, Crunchbase, Waters Technology, Nasdaq, Finextra Research, FinSME, Pitchbook
21All M&A transactions in this report are U.S. target companies and any foreign target companies with U.S. buyer(s)
COUNT OF M&A TRANSACTIONS BY CATEGORY17 29 2 7 17 6

22
Capital Raising Trends

3
9
8 8
6
8
7
8
7
9
10
99
22
11
13
8
10
9
4 4
2
11
8
4
8
7
8
5
8
7
14
1
12
7
9
CAPITAL MARKETS INSTITUTIONAL SOFTWARE SOLUTIONS FOR CORPORATES
INSURANCE TECH LENDING & CREDIT PAYMENTS PERSONAL FINANCE AND INVESTMENT MANAGEMENT
2018 - September 2018 - October 2018 - November
Select Last 6 Months Capital Raise Trends
23All capital raises in this report are U.S. companies and any foreign companies with U.S. investor(s)
Source: Capital IQ, Bloomberg, Crunchbase, Waters Technology, Nasdaq, Finextra Research, FinSMEs, Pitchbook
39 65 38 52 47 52
COUNT OF COMPANIES RAISING FUNDING BY CATEGORY

97
190
87
150
310
57
35
7
78
0
36
1
491
272
7091
1342
63
8
117
35
2
15
0
128
348
19
398
394
95
8
101
633
251
160
236
14
8
236
5
905
11
2
772
CAPITAL MARKETS INSTITUTIONAL SOFTWARE SOLUTIONS FOR CORPORATES
INSURANCE TECH LENDING & CREDIT PAYMENTS PERSONAL FINANCE AND INVESTMENT MANAGEMENT
2018 - September 2018 - October 2018 - November 2018 - December 2019 - January 2019 - February
Select Last 6 Months Capital Raise Trends
24All capital raises in this report are U.S. companies and any foreign companies with U.S. investor(s)
Source: Capital IQ, Bloomberg, Crunchbase, Waters Technology, Nasdaq, Finextra Research, FinSMEs, Pitchbook
FUNDING INVESTMENTS IN FINTECH COMPANIES BY CATEGORY$828 M $2,996 M $1,742 M $2,312 M $1,599 M $1,380 M

13
1
8
1 1
5
6
2
4
1
7
8
15
17
16
12
133
14
4
8
3
2
2
2
2
2
3
CAPITAL MARKETS INSTITUTIONAL SOFTWARE SOLUTIONS
INSURANCE TECH LENDING & CREDIT PAYMENTS PERSONAL FINANCE AND INVESTMENT MANAGEMENT
Undisclosed Angel | Seed Early Stage Late Stage PE Growth
Select Last 6 Months Capital Raise Trends
25All capital raises in this report are U.S. companies and any foreign companies with U.S. investor(s)
Source: Capital IQ, Bloomberg, Crunchbase, Waters Technology, Nasdaq, Finextra Research, FinSMEs, Pitchbook
19 39 26 30 24 27
FUNDING ROUND TYPE BY CATEGORY

26
US IPO Dynamics

State of Capital Markets – US IPO Market Update
Source: PWC, Renaissance Capital27
34
70
3432
8
34 3330
25
52
29
54
44
60
52
34
-30
-10
10
30
50
70
$0B
$2B
$4B
$6B
$8B
$10B
$12B
$14B
$16B
$18B
Q1'15 Q2'15 Q3'15 Q4'15 Q1'16 Q2'16 Q3'16 Q4'16 Q1'17 Q2'17 Q3'17 Q4'17 Q1'18 Q2'18 Q3'18 Q4'18
US IPO's # IPO's
Proceeds ($M) 2015 2016 2017 2018
US IPO’s $ 30,200 $ 18,800 $ 35,600 $ 46,800

Select FinTech US Public Offerings – 2017 - 2018
28*Amount raised excludes greenshoe option
Source: Capital IQ, Bloomberg, Crunchbase, Waters Technology, Nasdaq, Finextra Research
12/13/2018 360 Finance, Inc Lending & Credit NASDAQ: QFIN $ 51 16.50 - 18.50 $ 16.50 0.0%
10/25/2018 StoneCo Ltd Payments NASDAQ: STNE $ 1,400 21.00 - 23.00 $ 24.00 -4.1%
6/15/2018 AvalaraInstitutional Software &
SolutionsNYSE: AVLR $ 180 21.00 – 23.00 $ 35.00 10.4%
10/25/2018 Pintec Technology Lending & Credit NASDAQ: PT $ 44 10.00 - 12.00 $ 11.88 -6.7%
10/12/2018 Anaplan, IncInstitutional Software &
SolutionsNYSE: PLAN $ 264 15.00 - 17.00 $ 17.00 0.0%
6/24/2018 I3 Vertical. Payments NASDAQ: IIIV $ 87 11.00 - 13.00 $ 18.00 -17.8%
5/24/2018 Greensky, Inc Lending & Credit NASDAQ: GSKY $ 874 22.00 - 23.00 $ 23.00 14.7%
5/23/2018 EVO Payments Payments NASDAQ: EVOP $ 224 16.00 - 19.00 $ 16.00 11.2%
3/26/2018 Ceridian HCMInstitutional Software &
SolutionsNYSE: CDAY $ 462 19.00 - 21.00 $ 22.00 8.9%
4/27/2018 Docusign IncInstitutional Software &
SolutionsNYSE: DOCU $ 629 26.00 - 28.00 $ 29.00 3.4%
3/16/2018 Zuora, IncInstitutional Software &
SolutionsNYSE: ZUO $ 154 9.00 - 11.00 $ 14.00 -5.0%
2/9/2018 Cardlytics Payments NASDAQ: CDLX $ 70 13.00 - 15.00 $ 13.00 37.0%
11/10/2017 PPDAI Group Inc. Alternative lending NYSE: PPDF $ 221 16.00 - 19.00 $ 13.00 0.0%
12/26/2017 PagSeguro Digital Ltd Payments NYSE: PAGS $ 2,300 17.50 - 20.50 $ 21.50 -4.3%
10/17/2017 Qudian Inc. Alternative Lending NYSE: QD $ 900 19.00 - 22.00 $ 24.00 18.3%
4/6/2017 Elevate Credit Alternative Lending NYSE: ELVT $ 81 12.00 - 14.00 $ 6.50 18.5%
1 Week Return Amount Raised*
($ millions)Offering Date Company Sector Ticker Name
Offering Price
Range ($)Offering Price ($)

29
The Rosenblatt Difference

Our services
30
We provide conflict-free, agency-only equity execution service to many of the leading institutional investors across US and international markets
As the biggest broker on the NYSE floor, we provide clients access to unique advantages available to floor broker community
With one of the most experienced team of high-touch traders, we deliver best quality execution in any market conditions
Rosenblatt Securities helped pioneer the field of market-structure analysis more than 15 years ago
We give clients the conflict free intelligence they need to navigate and thrive in complex and fragmented capital markets
Rosenblatt launched FinTech-focused investment banking more than 10 years ago. Since then, we have come to be known as FinTech sector specialists
Featured in Institutional Investor's FinTech Finance 40 rankings, our team brings unequaled domain expertise and a laser focus on financial technology
As trusted advisers, we help private and public companies with capital raising, M&A and business development. We get past the industry hype by fostering education and networking within the FinTech community
As part of our practice, every year, we host annual FinTech Summit showcasing some of the most exciting FinTech companies
Our team of veteran equity research analysts provide expert insights and corporate-access opportunities for investors in the TMT and FinTech sectors
In addition to our inhouse research capabilities, we also have exclusive relationships with brokers from over a dozen emerging- and frontier-markets
Our analytics team, led by a veteran former buy-side quant, approaches execution with a practitioner’s perspective and applies world-class data science. Our visualization expert hasearned the designation of Alteryx ACE and was the first-ever Tableau Zen Master
Our team has developed tools that are used for pre-trade, trade and post-trade analysis by our internal trading team as well as by the largest investment banks and asset managers
TradingMarket Structure
Investment Banking
Fundamental Research
Technology Solutions
We started as an independent NYSE floor broker in 1979 with a simple goal: deliver conflict-free advice and execution. Since then, we have adapted, expanded and diversified to become a leading agency brokerage, investment-banking and research boutique. But we remain committed to our founding principles in everything we do

Our services
31
Rosenblatt launched FinTech-focused investment banking more than 10 years ago. Since then, we have come to be known as FinTech sector specialists
Featured in Institutional Investor's FinTech Finance 40 rankings, our team brings unequaled domain expertise and a laser focus on financial technology
As trusted advisers, we help private and public companies with capital raising, M&A and business development. We get past the industry hype by fostering education and networking within the FinTech community
As part of our practice, every year, we host annual FinTech Summit showcasing some of the most exciting FinTech companies
Investment Banking
We started as an independent NYSE floor broker in 1979 with a simple goal: deliver conflict-free advice and execution. Since then, we have adapted, expanded and diversified to become a leading agency brokerage, investment-banking and research boutique. But we remain committed to our founding principles in everything we do
Advisory Services
M&A Due Diligence
Divestitures Valuations
Restructuring Transaction Structuring
Fairness Opinions Negotiations
Capital Raising
Equity Capital Markets
Buybacks
Follow-On Offerings
Private Equity Private Debt
StrategicManagement
Consulting
Market Entry
Peer Group Benchmarking
Exit Strategies
Industry / Competitive Analysis
BusinessDevelopment
Product Validation
Channel Partner
Development
Customer Introduction
Full Service Advisory Offering

Strong value proposition
Our Market Structure Summit on panel with Virtu Financial, XTX Markets, Jane Street, and DRW Holdings
Our Market Structure Summit in conversation with SEC Chairman Jay Clayton
• We pride ourselves in creating solutions that address individual client's needs; always shying away from cookie-cutter solutions
32
• Focused coverage of capital markets and financial technology firms across asset classes to address their corporate finance needs
• Trusted advisers on dozens of deals and we go beyond just executing – with our annual Financial Technologies Summit (FTS) and Global Exchange Leader Conference /(GELC) we’re committed to advising and educating our clients
• Our deep domain expertise and attention to details uncovers often overlooked complexities and nuances
• Our investment banking, research, and consulting efforts have fostered deep ties with many of the largest financial services and private equity firms across North America, EMEA, and Asia-Pacific
• Our brokerage operations have allowed us to develop extensive relationships with leading institutional investors and portfolio managers
• Strong relationships with a roster of global bank partners for offerings that require balance sheet commitment and institutional underwriting
Unparalleled Domain Expertise
Deep Strategic & Financial Relationships
Tailored Execution Experience
Our FinTech Summit on panel with R3, Ripple, Noble, Symbiont, and PeerNova
Our FinTech Summit on panel with Virtu Financial, XTX Markets, Jane Street, and DRW Holdings
Rosenblatt’s, Vikas Shah named to FinTech Finance 40 list
Clients call on us for deep-domain expertise in FinTech, close dialogues with an extensive roster of institutional investors and proven execution experience. We have the track record of working on exclusive engagements as well co-managers with other well-respected industry underwriters

33
Contact:
V i ka s S h a hI n v e s t m e n t B a n k i n g
2 1 2 - 6 0 7 - 3 1 0 0v s h a h @ r b l t . c o m
Copyright 2019. Rosenblatt Securities Inc. All rights reserved.
Rosenblatt Securities Inc. seeks to provide and receive remuneration for Agency Brokerage, Market Structure Analysis, Macro and otherSector Analysis and Investment Banking Advisory Services. Rosenblatt Securities Inc. may, from time to time, provide these services tocompanies mentioned in this analysis. This material is not a research report and should not be construed as such, and does not containenough information to support an investment decision. Neither the information contained herein, nor any opinion expressed herein,constitutes the recommendation or solicitation of the purchase or sale of any securities or commodities. The information herein wasobtained from sources which Rosenblatt Securities Inc. believes reliable, but we do not guarantee its accuracy. No part of this material maybe duplicated in any form by any means. Member NYSE, FINRA, SIPC.