financial year 2010 results - capitaland limited |...
TRANSCRIPT

0 February 20110
CapitaLand Group Financial Year 2010 Results

1
Contents
Results Overview
Highlights for 2010
Financials & Capital Management
Going forward
CapitaLand Presentation *Feb 2011*

Results Overview
Liew Mun LeongGroup President & CEO

5th Consecutive Year of Above S$1b Net Profit
3
(S$ m)
PATMI1FY 20061,012.7
FY 2007 FY 2008FY 2010
2,759.3 1,260.1 1,273.1FY 20091,053.0
1Profit After Tax and Minority Interests
CapitaLand Presentation *Feb 2011*

4
FY 2010 Net Profit up 21% YoY
CapitaLand Presentation *Feb 2011*
FY2009 Change(S$ m)
14.4%
53.9%
20.9%
2,957.4
1,549.0
1,053.0
FY2010
3,382.7
2,384.2
1,273.1PATMI1
EBIT
Revenue
1Profit After Tax and Minority Interests
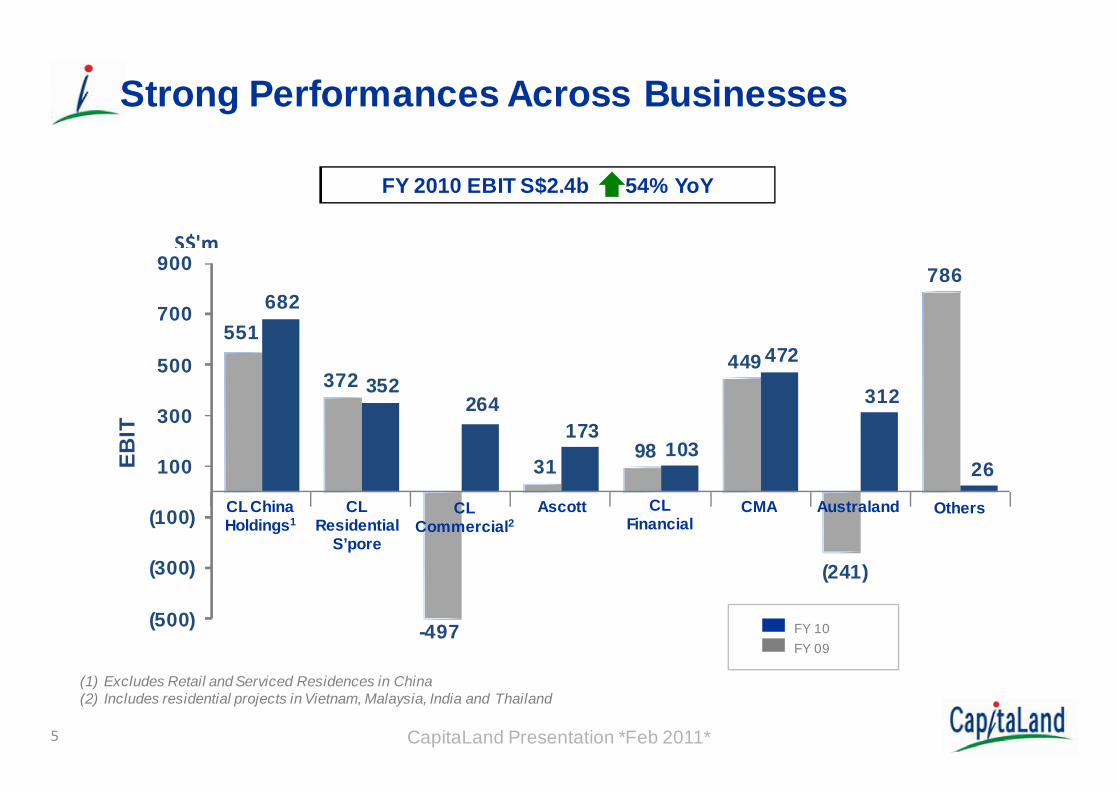
Strong Performances Across Businesses
(1) Excludes Retail and Serviced Residences in China(2) Includes residential projects in Vietnam, Malaysia, India and Thailand
551
372
-497
31 98
449
(241)
786 682
352 264
173 103
472
312
26
(500)
(300)
(100)
100
300
500
700
900
EBIT
S$'m
CL Residential
S’pore
CL Commercial2
CL China Holdings1
Ascott CMA OthersCL Financial
FY 2010 EBIT S$2.4b 54% YoY
5 CapitaLand Presentation *Feb 2011*
FY 10FY 09
Australand
6
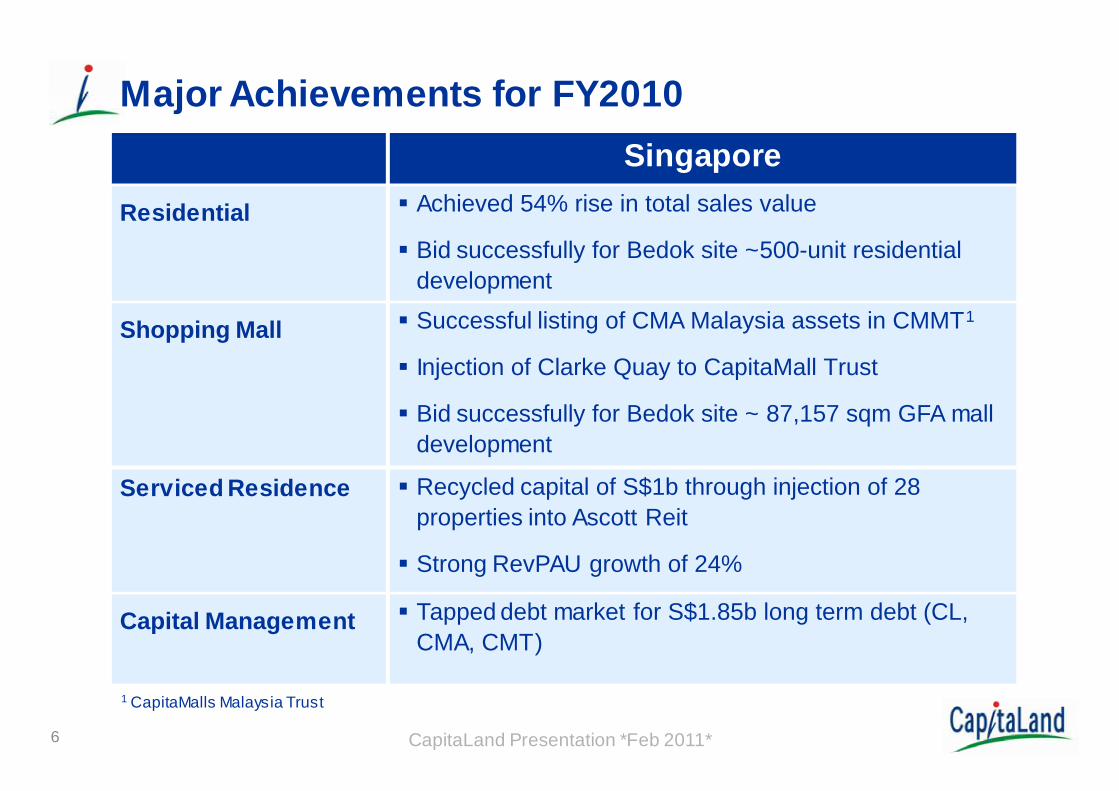
Major Achievements for FY2010
CapitaLand Presentation *Feb 2011*
SingaporeResidential Achieved 54% rise in total sales value
Bid successfully for Bedok site ~500-unit residential development
Shopping Mall Successful listing of CMA Malaysia assets in CMMT1
Injection of Clarke Quay to CapitaMall Trust
Bid successfully for Bedok site ~ 87,157 sqm GFA mall development
Serviced Residence Recycled capital of S$1b through injection of 28 properties into Ascott Reit
Strong RevPAU growth of 24%
Capital Management Tapped debt market for S$1.85b long term debt (CL, CMA, CMT)
1 CapitaMalls Malaysia Trust
7
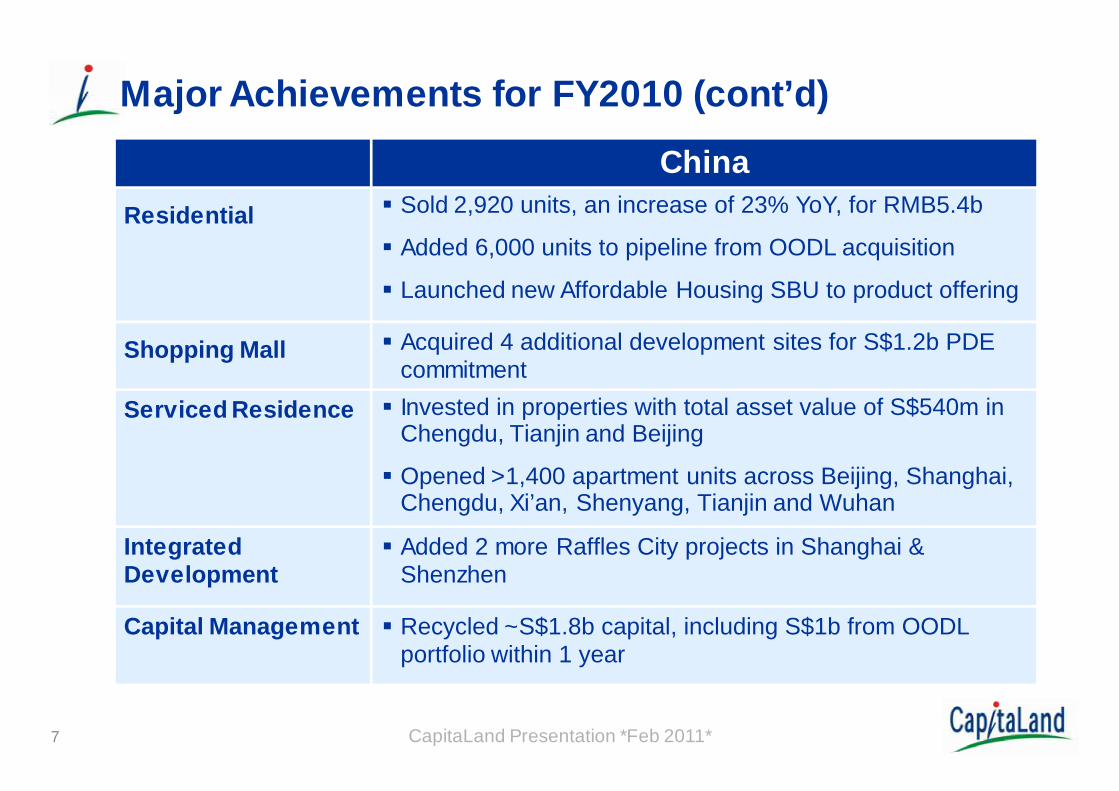
Major Achievements for FY2010 (cont’d)
ChinaResidential Sold 2,920 units, an increase of 23% YoY, for RMB5.4b
Added 6,000 units to pipeline from OODL acquisition
Launched new Affordable Housing SBU to product offering
Shopping Mall Acquired 4 additional development sites for S$1.2b PDE commitment
Serviced Residence Invested in properties with total asset value of S$540m in Chengdu, Tianjin and Beijing
Opened >1,400 apartment units across Beijing, Shanghai, Chengdu, Xi’an, Shenyang, Tianjin and Wuhan
Integrated Development
Added 2 more Raffles City projects in Shanghai &Shenzhen
Capital Management Recycled ~S$1.8b capital, including S$1b from OODL portfolio within 1 year
CapitaLand Presentation *Feb 2011*

8
3.0
6.3
3.4
7.2
0.0
1.0
2.0
3.0
4.0
5.0
6.0
7.0
8.0
FY2009 FY2010
Revenue Under Management
• Revenue Under Management : Revenue of all properties managed by the Group
Statutory Revenue Revenue Under Management
CapitaLand Presentation *Feb 2011*
S$b
14%
13%

Group Managed Real Estate Assets* of S$50.6b
9 CapitaLand Presentation *Feb 2011*
* Group managed Real Estate Assets is the value of all real estate managed by CapitaLand Group entities stated at 100% of the property carrying value.
** Others include 100% value of properties under management contracts.
Group Managed RE Assets 2010 (S$ b)
On Balance Sheet & JVs 18.3
Funds 10.6
REITs/Trusts 17.8
Others** 3.9
Total 50.6
Highlights
10
11
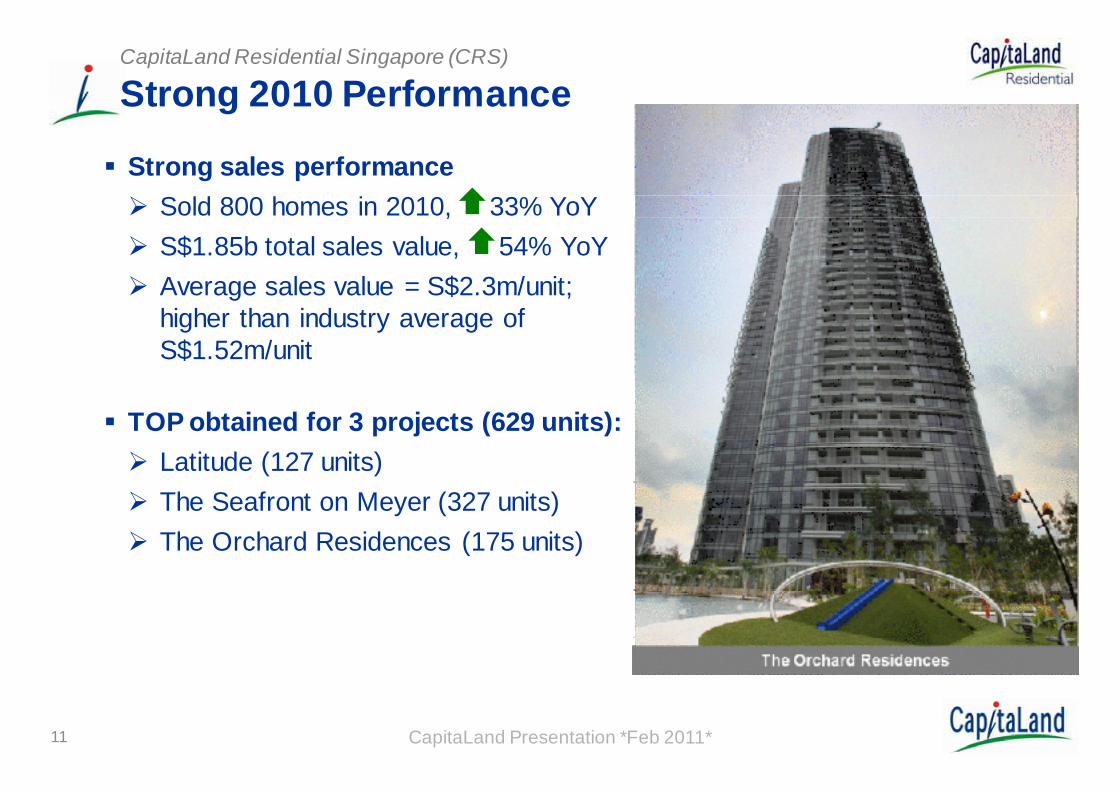
Strong 2010 Performance
Strong sales performanceSold 800 homes in 2010, 33% YoYS$1.85b total sales value, 54% YoYAverage sales value = S$2.3m/unit; higher than industry average of S$1.52m/unit
TOP obtained for 3 projects (629 units):Latitude (127 units)The Seafront on Meyer (327 units)The Orchard Residences (175 units)
CapitaLand Residential Singapore (CRS)
CapitaLand Presentation *Feb 2011*

Strong take-up by homebuyers/investorsd’Leedon (Sold 93% of 250 units released)The Interlace (Sold 94% of 650 units released)Urban Suites (Sold 99% of development)
Homes designed by internationally renowned architects Zaha Hadid ArchitectsOffice for Metropolitan Architecture (OMA)
Strong 2010 Performance (cont’d)
Urban Suites
CapitaLand Residential Singapore (CRS)
CapitaLand Presentation *Feb 2011* The Interlace
13
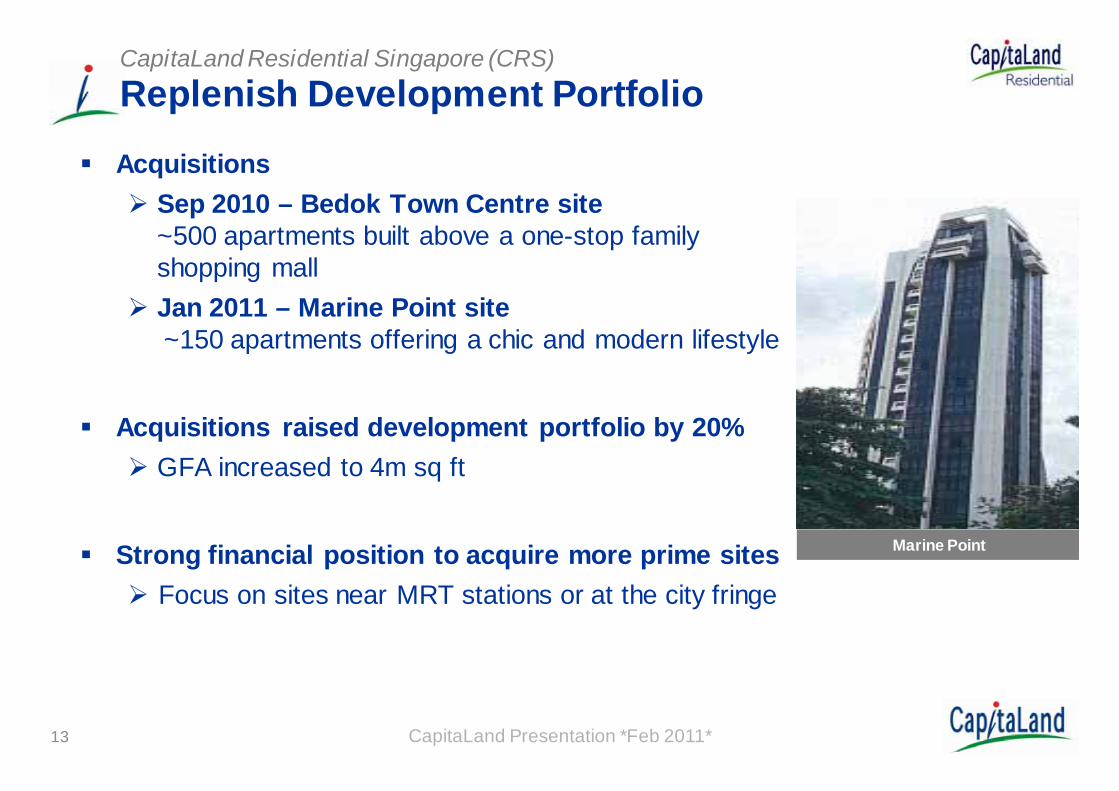
Replenish Development Portfolio
AcquisitionsSep 2010 – Bedok Town Centre site~500 apartments built above a one-stop family shopping mallJan 2011 – Marine Point site~150 apartments offering a chic and modern lifestyle
Acquisitions raised development portfolio by 20% GFA increased to 4m sq ft
Strong financial position to acquire more prime sitesFocus on sites near MRT stations or at the city fringe
Marine Point
CapitaLand Residential Singapore (CRS)
CapitaLand Presentation *Feb 2011*

14
Strong Pipeline for Homebuyers
Over 2,600 homes in the pipelineLocated at the city fringe or near MRT stations6 condominium developments
Plans to launch 1,700 homes Projects include The Interlace, d’Leedon, The Nassim, Urban Resort Condominium and Bedok Town Centre site
Extend market coverageMarket iconic developments overseas eg. in China and India
CapitaLand Residential Singapore (CRS)
The Nassim
d’Leedon
CapitaLand Presentation *Feb 2011*
15
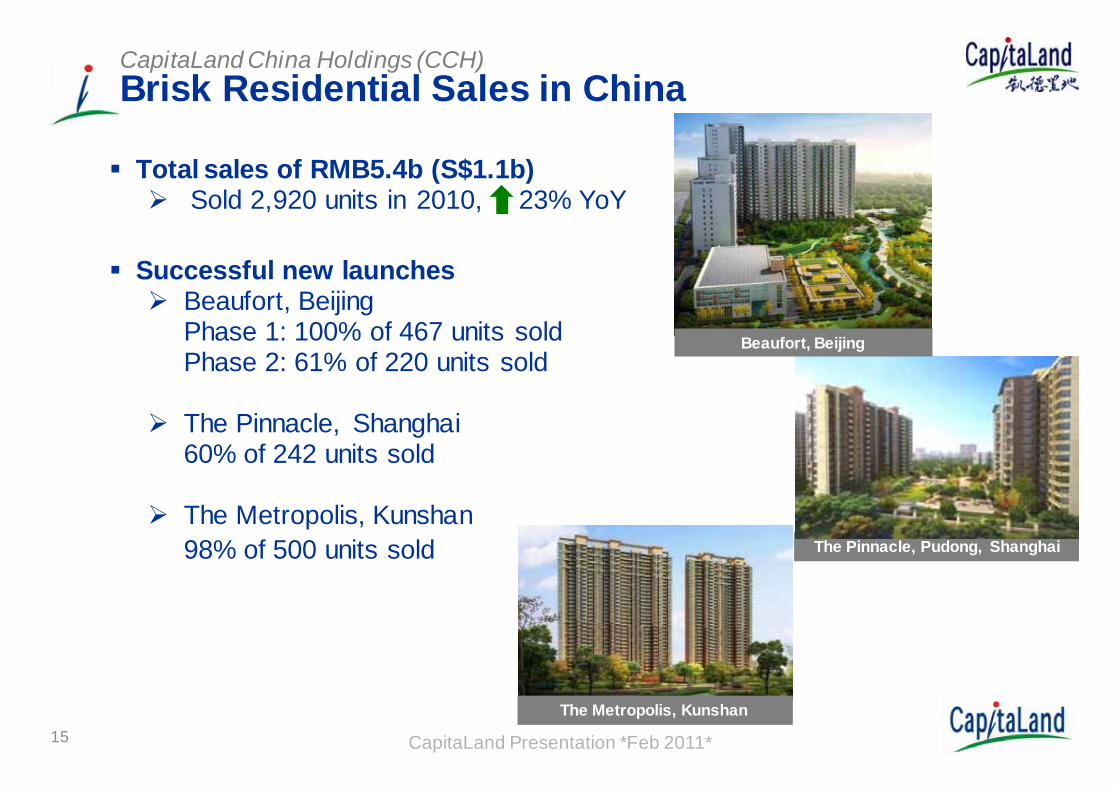
Brisk Residential Sales in ChinaCapitaLand China Holdings (CCH)
Total sales of RMB5.4b (S$1.1b)Sold 2,920 units in 2010, 23% YoY
Successful new launchesBeaufort, BeijingPhase 1: 100% of 467 units soldPhase 2: 61% of 220 units sold
The Pinnacle, Shanghai60% of 242 units sold
The Metropolis, Kunshan98% of 500 units sold The Pinnacle, Pudong, Shanghai
The Metropolis, Kunshan
Beaufort, Beijing
CapitaLand Presentation *Feb 2011*
Acquisition of OODL Portfolio in Feb 2010CapitaLand China Holdings (CCH)
Increase China property portfolio by approximately 1.4m sqm
Increase CL’s China’s assets from 28% to 36%
Quick time to market
Positive contribution within first year of acquisition
7 high quality sites located in Shanghai, Kunshan and Tianjin
Portfolio properties mainly in city centre near MRT stations
Diversified portfolio mix:
4 residential projects (67% of portfolio GFA)
2 integrated developments (30% of portfolio GFA)
1 hotel (3% of portfolio GFA)
Successfully recycled ~S$1b of the S$3.1b transaction
CapitaLand Presentation *Feb 2011* 16

OODL Portfolio GFA by GeographyCapitaLand China Holdings (CCH)
CapitaLand Presentation *Feb 2011*
86% of the portfolio in Greater Shanghai
36%50%
14%
Shanghai Kunshan Tianjin
17

Portfolio Acquired at Good Values CapitaLand China Holdings (CCH)
CapitaLand Presentation *Feb 2011*
City SiteEstimated Underlying Land /Property Value
RMB (m) % RMB psm
Shanghai Shanghai Luwan, Changle(The Paragon)
3,929 29% 27,000
Nanmatou (The Pinnacle) 1,258 9% 12,000
Raffles City Changning 4,317 32% 18,000
Shanghai Xuhui, Hengshan Lu 405 3% 27,000
Kunshan Kunshan Double Tree Hotel 422 3% 10,500
Kunshan Huaqiao(The Metropolis)
1,347 10% 2,000
Tianjin Tianjin International Trade Center
1,963 14% 10,000
TOTAL 13,641 100%
18
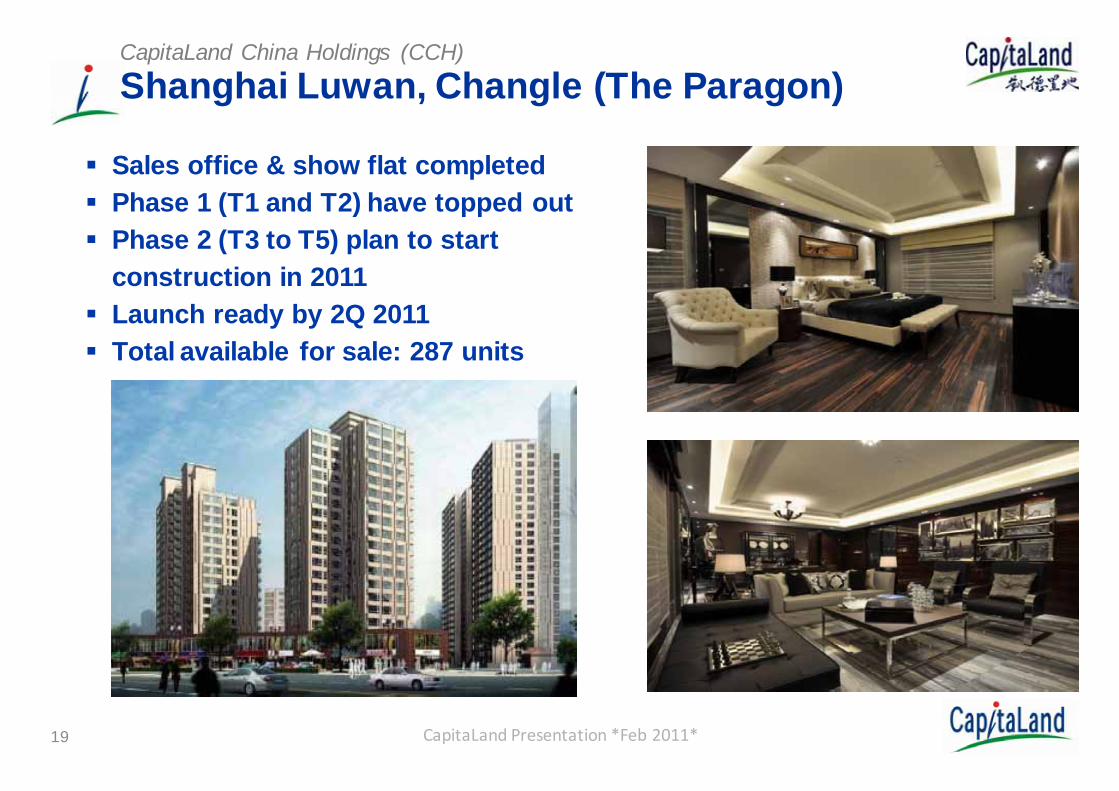
Shanghai Luwan, Changle (The Paragon)CapitaLand China Holdings (CCH)
CapitaLand Presentation *Feb 2011*
Sales office & show flat completedPhase 1 (T1 and T2) have topped outPhase 2 (T3 to T5) plan to start construction in 2011Launch ready by 2Q 2011Total available for sale: 287 units
19
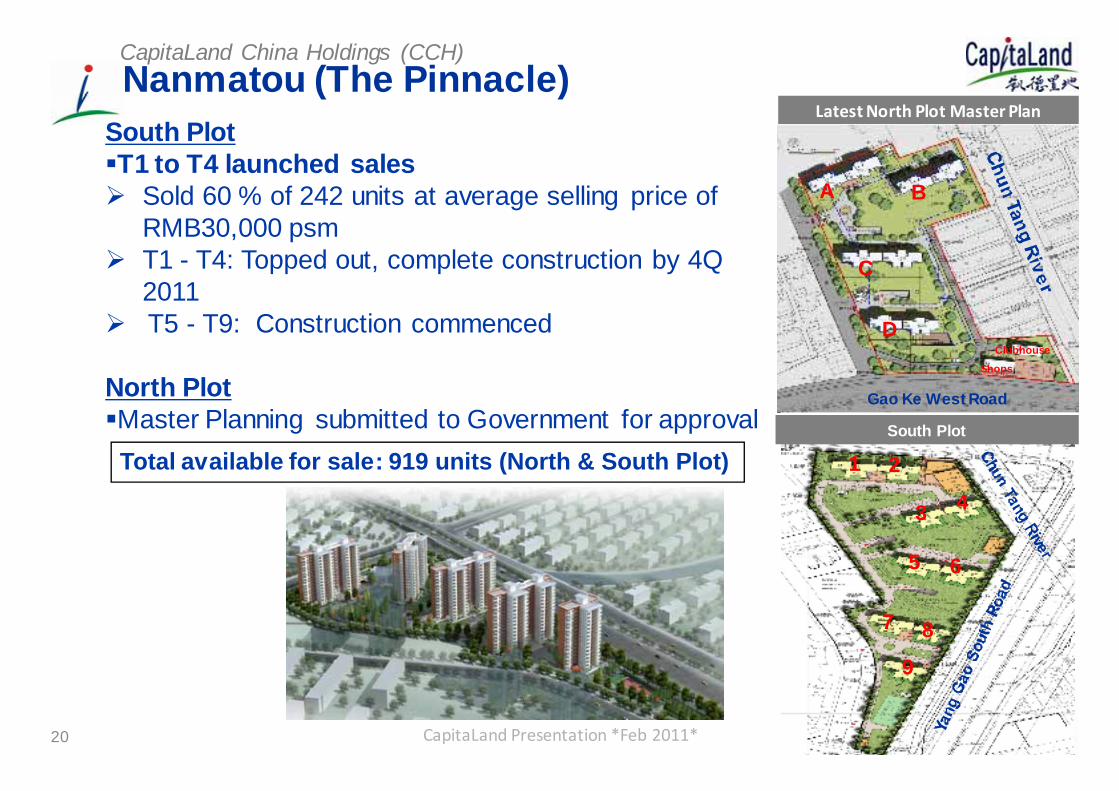
Latest North Plot Master PlanNanmatou (The Pinnacle)CapitaLand China Holdings (CCH)
CapitaLand Presentation *Feb 2011*
South PlotT1 to T4 launched sales
Sold 60 % of 242 units at average selling price of RMB30,000 psmT1 - T4: Topped out, complete construction by 4Q 2011T5 - T9: Construction commenced
North PlotMaster Planning submitted to Government for approvalTotal available for sale: 919 units (North & South Plot)
D
C
BA
Gao Ke West Road
Shops
Clubhouse
1
3
2
4
5 6
7 8
9
South Plot
20
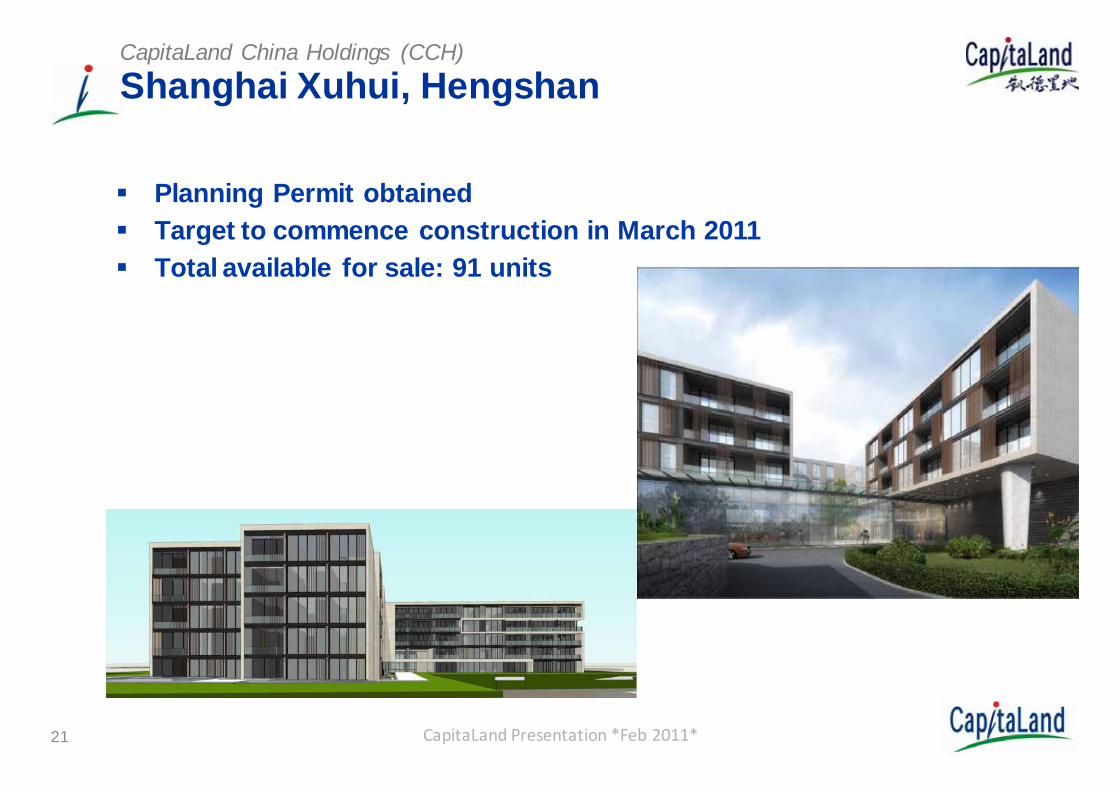
Shanghai Xuhui, HengshanCapitaLand China Holdings (CCH)
CapitaLand Presentation *Feb 2011*
Planning Permit obtainedTarget to commence construction in March 2011Total available for sale: 91 units
21

Kunshan Huaqiao (The Metropolis)CapitaLand China Holdings (CCH)
CapitaLand Presentation *Feb 2011*
Launched in June 2010 Sold 98% of 500 units at average selling price @RMB11,000 psmConstruction Progress
T20 and T21 have topped outT17 and T19 commenced construction
Total available for sale: 4,700 units
22

Raffles City ChangningCapitaLand China Holdings (CCH)
CapitaLand Presentation *Feb 2011*
Change from office development to mixed used developmentRepositioned as Raffles City Changning, the 7th Raffles City development in ChinaTarget to commence construction in 3Q 2011Formed JV fund with institutional investors
23

Kunshan Double Tree Hotel CapitaLand China Holdings (CCH)
CapitaLand Presentation *Feb 2011*
Cash flow positive
24

Tianjin International Trade CenterCapitaLand China Holdings (CCH)
CapitaLand Presentation *Feb 2011*
Design scheme submitted for approvalSales office expected to complete in May 2011Target to launch in 2Q 2011
25
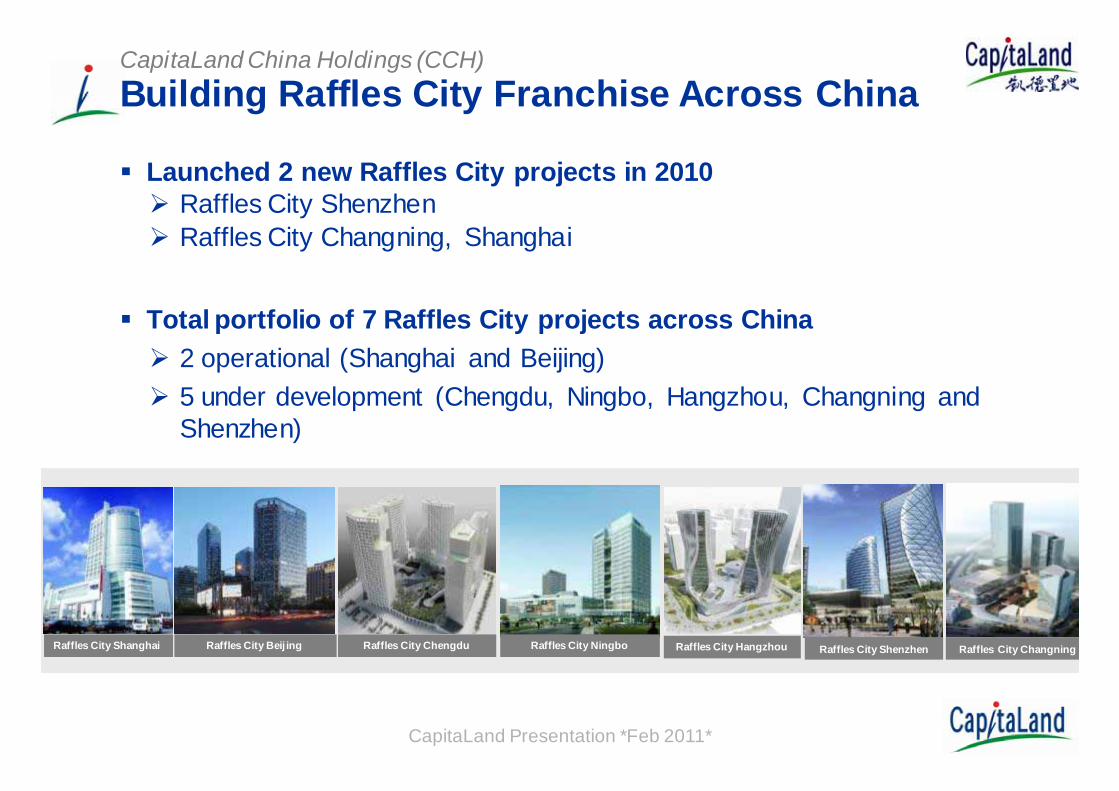
Building Raffles City Franchise Across ChinaCapitaLand China Holdings (CCH)
Launched 2 new Raffles City projects in 2010Raffles City ShenzhenRaffles City Changning, Shanghai
Total portfolio of 7 Raffles City projects across China2 operational (Shanghai and Beijing)5 under development (Chengdu, Ningbo, Hangzhou, Changning and Shenzhen)
Raffles City Shanghai Raffles City Beij ing Raffles City Chengdu Raffles City Hangzhou Raffles City ShenzhenRaffles City Ningbo Raffles City Changning
CapitaLand Presentation *Feb 2011*
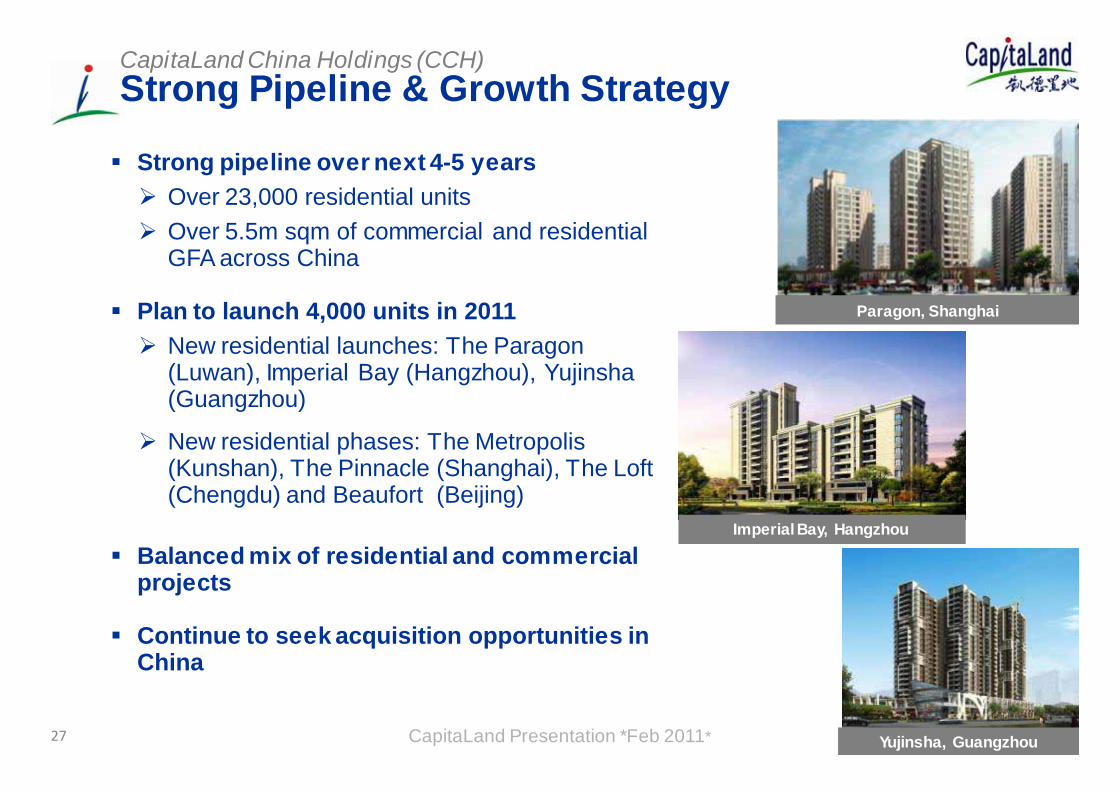
Strong Pipeline & Growth Strategy CapitaLand China Holdings (CCH)
27
Strong pipeline over next 4-5 yearsOver 23,000 residential unitsOver 5.5m sqm of commercial and residential GFA across China
Plan to launch 4,000 units in 2011New residential launches: The Paragon (Luwan), Imperial Bay (Hangzhou), Yujinsha (Guangzhou)
New residential phases: The Metropolis (Kunshan), The Pinnacle (Shanghai), The Loft (Chengdu) and Beaufort (Beijing)
Balanced mix of residential and commercial projects
Continue to seek acquisition opportunities in China
Paragon, Shanghai
Imperial Bay, Hangzhou
Yujinsha, GuangzhouCapitaLand Presentation *Feb 2011*

28
Strong Commercial Portfolio PerformanceCapitaLand Commercial Limited (CCL)
CCT achieved strong distributable income growth of 11.3% YoY on high portfolio occupancy of 99.3%
CCT divested 2 non-Grade A office properties for S$583m
Invested 62% stake in JV to acquire StorHub brand and 4 self-storage properties in Singapore
Divested non-core assets – 163 strata-titled units at The Adelphi* for S$218m
CapitaLand Presentation *Feb 2011*
CAGR - Compounded Annual Grow th Rate
CCT delivers strong distributable income
78.9
120.4153.0
198.5221.0
0
50
100
150
200
250
FY06 FY07 FY08 FY09 FY10
S$’m
StorHub - 615 Lorong 4 Toa Payoh* Divestment completed in Jan 2011

29
Favourable Conditions for Singapore Office MarketCapitaLand Commercial Limited (CCL)
Office market to continue improving Positive economic outlook for Singapore and Asia will spur office demandOffice market rents strengthened by 24% after bottoming out in 1Q 2010
Limited supplyNo new major office buildings scheduled for completion in the Central Area from 2013 to 2015
CapitaLand Presentation *Feb 2011*
$18.80
$8.00
$9.90
$16.10
$6.70
$8.30
6
9
12
15
18 Prime Office Average Market RentGrade A Office Average Market Rent
24%
Office rents projected to rise over the next few years
Source: CBRE
3Q 1Q 4Q’08 ’10 ’10
S$psf / mth

30
Positioned for GrowthCapitaLand Commercial Limited (CCL)
Redevelopment of Market Street Car ParkConducting feasibility study to redevelop Market Street Car Park into a Grade A office building
Double StorHub portfolio To acquire properties in Singapore and China in 2011
Seek opportunitiesContinue to seek accretive investments and development opportunities in Singapore and the region
CapitaLand Presentation *Feb 2011*
Preliminary concept design for Market Street Car Park by Toyo Ito

31
Strengthened Residential Portfolio in Vietnam
Achieved total sales value of ~S$433mThe Vista, Ho Chi Minh City - Topped out in Jun’10Mulberry Lane, Hanoi- Sold 75% of 768 units launched
Increased portfolio to over 4,000 units across 4 prime residential projects
Secured 2nd project in HanoiReady to launch 2nd project in Ho Chi Minh City: Beau Rivage
Formed US$200m joint venture fund with Mitsubishi Estate Asia and GIC Real Estate in Nov 2010
CapitaValue Homes Limited (CVH)
CapitaLand Presentation *Feb 2011*
Site at Mo Lao Ward, Hanoi
The Vista, Ho Chi Minh City

32
CapitaValue Homes Limited (CVH)
CapitaLand Presentation *Feb 2011*
CapitaValue Homes – New business unit formed in Oct 2010Pursue opportunities in affordable housingSecured pipeline of over 2,500 affordable homesi. Site in Wuhan, China: over 2,000 unitsii. Site in Ho Chi Minh City, Vietnam: over 500 units
StrategiesTarget mass market homebuyers with mortgage capacity of ~40%Standardise design to achieve • Effective cost management• Fast inventory turnover
Speed to market
Tap Strong Demand for Affordable Homes in Asia
33
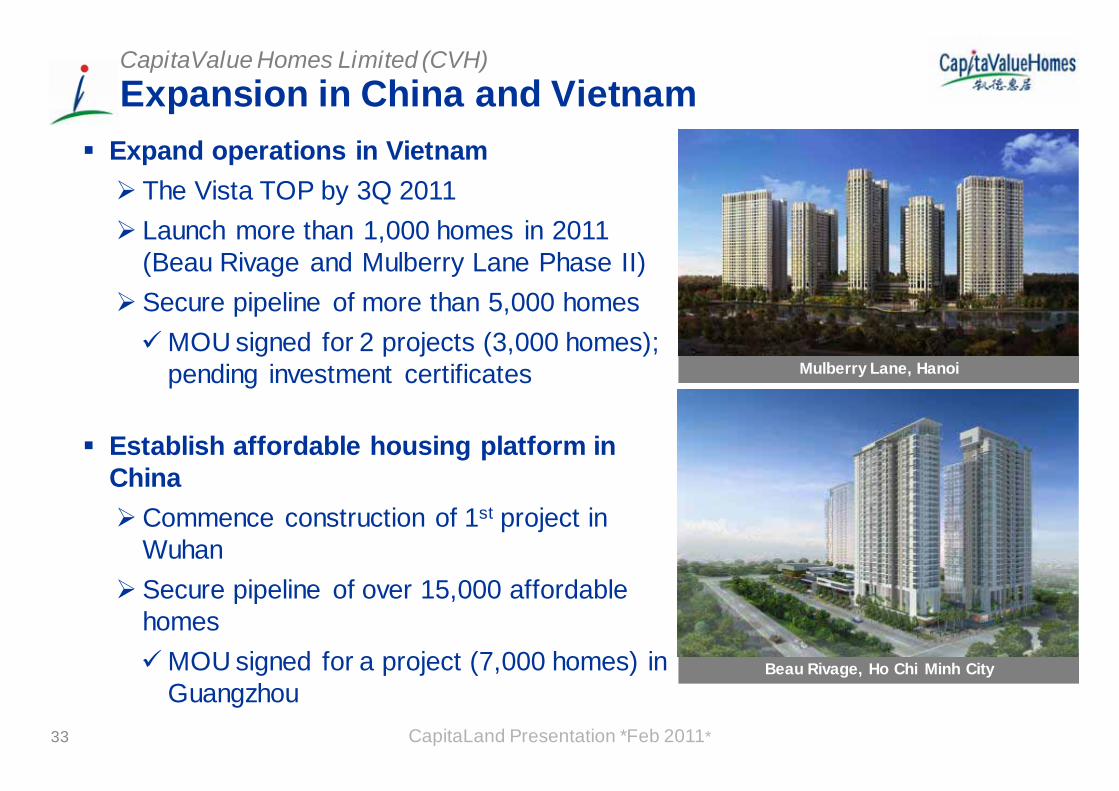
Expansion in China and VietnamCapitaValue Homes Limited (CVH)
Expand operations in VietnamThe Vista TOP by 3Q 2011Launch more than 1,000 homes in 2011 (Beau Rivage and Mulberry Lane Phase II) Secure pipeline of more than 5,000 homes
MOU signed for 2 projects (3,000 homes); pending investment certificates
Establish affordable housing platform in China
Commence construction of 1st project in WuhanSecure pipeline of over 15,000 affordable homes
MOU signed for a project (7,000 homes) in Guangzhou
CapitaLand Presentation *Feb 2011*
Mulberry Lane, Hanoi
Beau Rivage, Ho Chi Minh City

Extending the LeadEBIT growth of 4.5 times to S$173mBetter operating performance
Robust RevPAU growth from Singapore (+24%) and China (+9%)
Higher Real Estate ReturnHigher property incomeNet portfolio gains* of S$124m; Divestment proceeds of ~S$1b
Higher Hospitality Management Fee Hospitality Management Fee of S$115mOpened 14 properties (+2,800 units), increasing operational units to >21,000Secured 12 management contracts (+2,000 units)
The Ascott Limited (Ascott)
CapitaLand Presentation *Feb 2011* 34
Ascott Raffles City Hangzhou
* Includes fair value adjustments and impairment

Ascott Reit Now Larger and Stronger Platform
Has a total of 64 properties after acquisition
Acquired 28 Asian and European properties
Doubled Ascott Reit total asset value
Asset size increased from S$1.6b to S$2.7b after transaction
Increased distributable income by 28% to S$58m in 2010
The Ascott Limited (Ascott)
CapitaLand Presentation *Feb 2011* 35
CitadinesPrestige South Kensington London CitadinesMount Sophia Singapore

36
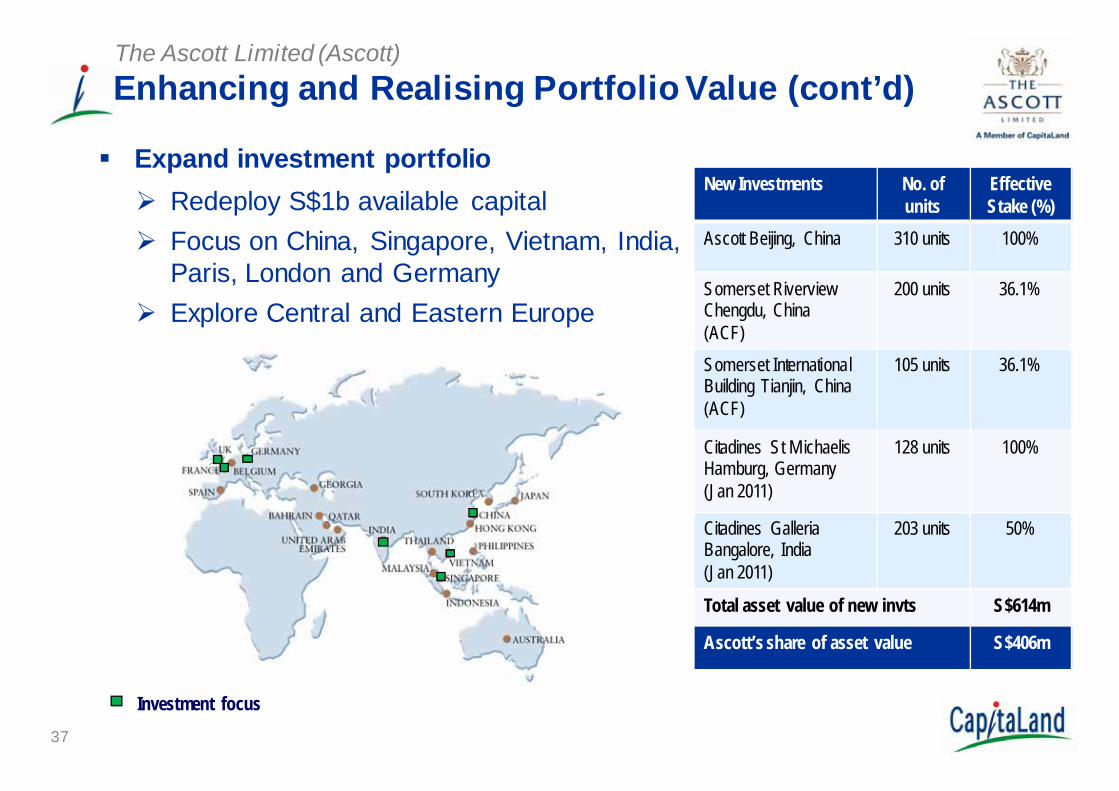
The Ascott Limited (Ascott)Enhancing and Realising Portfolio Value
Active management of real estate portfolio47.8% stake in Ascott Reit’s S$2.7b assets 36.1% stake in Ascott China Fund’s (ACF’s) US$0.6b portfolioAscott’s owned* assets of S$1.4b. Recycle stabilised properties to optimise portfolio returns
Enhance assetsContinue with S$70m refurbishment programmeacross 16 properties
CapitaLand Presentation *Feb 2011*
Ascott Louvre Paris
Citadines Louvre Paris will be
refurbished and relaunched as Ascott
Louvre Paris
Somerset International Building Tianjin
* Ascott’s share of asset values for properties ow ned directly. Includes properties which are 100% ow ned, majority owned and properties w hich Ascott has a minority stake in.
37
Expand investment portfolioRedeploy S$1b available capitalFocus on China, Singapore, Vietnam, India, Paris, London and GermanyExplore Central and Eastern Europe
The Ascott Limited (Ascott)
New Investments No. of units
Effective Stake (%)
Ascott Beijing, China 310 units 100%
Somerset Riverview Chengdu, China(ACF)
200 units 36.1%
Somerset International Building Tianjin, China(ACF)
105 units 36.1%
Citadines St M ichaelisHamburg, Germany (Jan 2011)
128 units 100%
Citadines Galleria Bangalore, India (Jan 2011)
203 units 50%
Total asset value of new invts S$614m
Ascott’s share of asset value S$406m
Investment focus
Enhancing and Realising Portfolio Value (cont’d)

38
The Ascott Limited (Ascott)Growing Brand and Management Network
Strengthen leadership position
Secured 7 management contracts in Jan 2011 (China, India, Germany, Malaysia, Philippines and Qatar), boosting portfolio to ~ 28,000 units
Add at least 12 new operating properties across China, Vietnam and India in 2011 (+2,000 units)
To secure more management contracts
Improve customer experience
Embark on customer centric initiatives through process redesign and enhanced global IT system
On track to achieve 40,000 units by 2015
CapitaLand Presentation *Feb 2011*
Ascott Guangzhou IFC
39
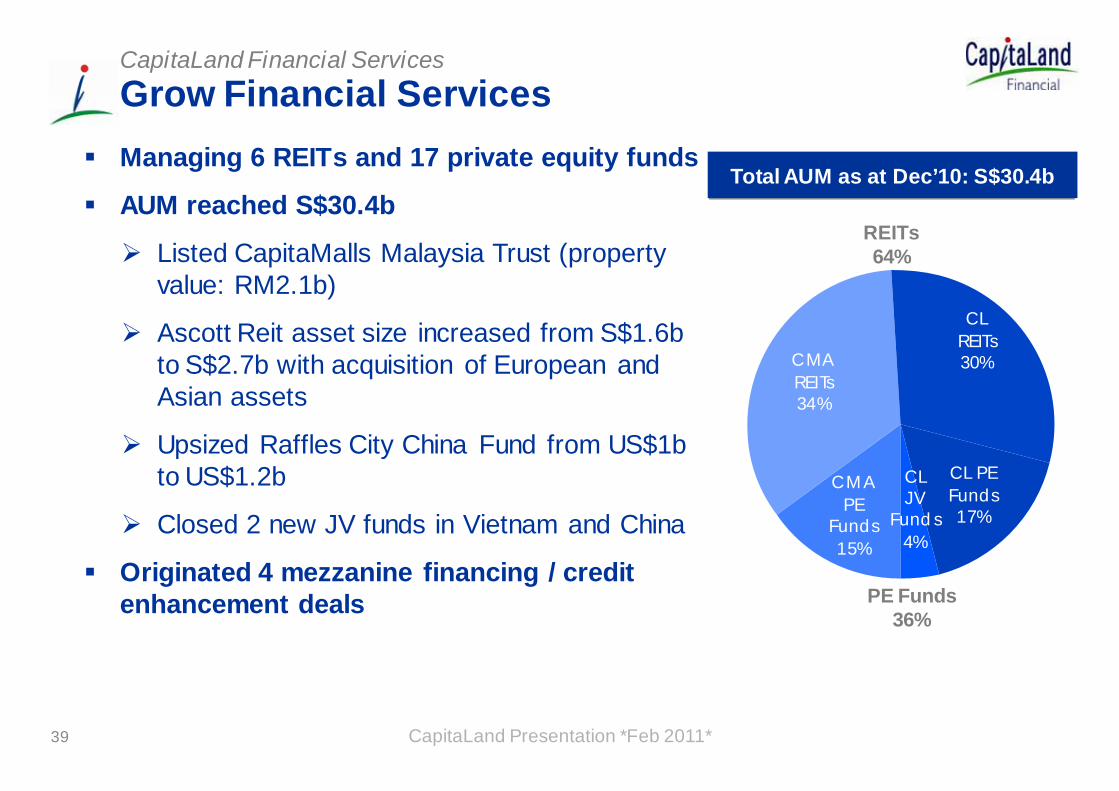
CMA PE
Funds15%
CMA REITs34%
CL REITs30%
CL PE Funds17%
CL JV
Funds4%
Grow Financial ServicesCapitaLand Financial Services
Managing 6 REITs and 17 private equity funds
AUM reached S$30.4b
Listed CapitaMalls Malaysia Trust (property value: RM2.1b)
Ascott Reit asset size increased from S$1.6b to S$2.7b with acquisition of European and Asian assets
Upsized Raffles City China Fund from US$1b to US$1.2b
Closed 2 new JV funds in Vietnam and China
Originated 4 mezzanine financing / credit enhancement deals
REITs 64%
PE Funds 36%
CapitaLand Presentation *Feb 2011*
Total AUM as at Dec’10: S$30.4b
40
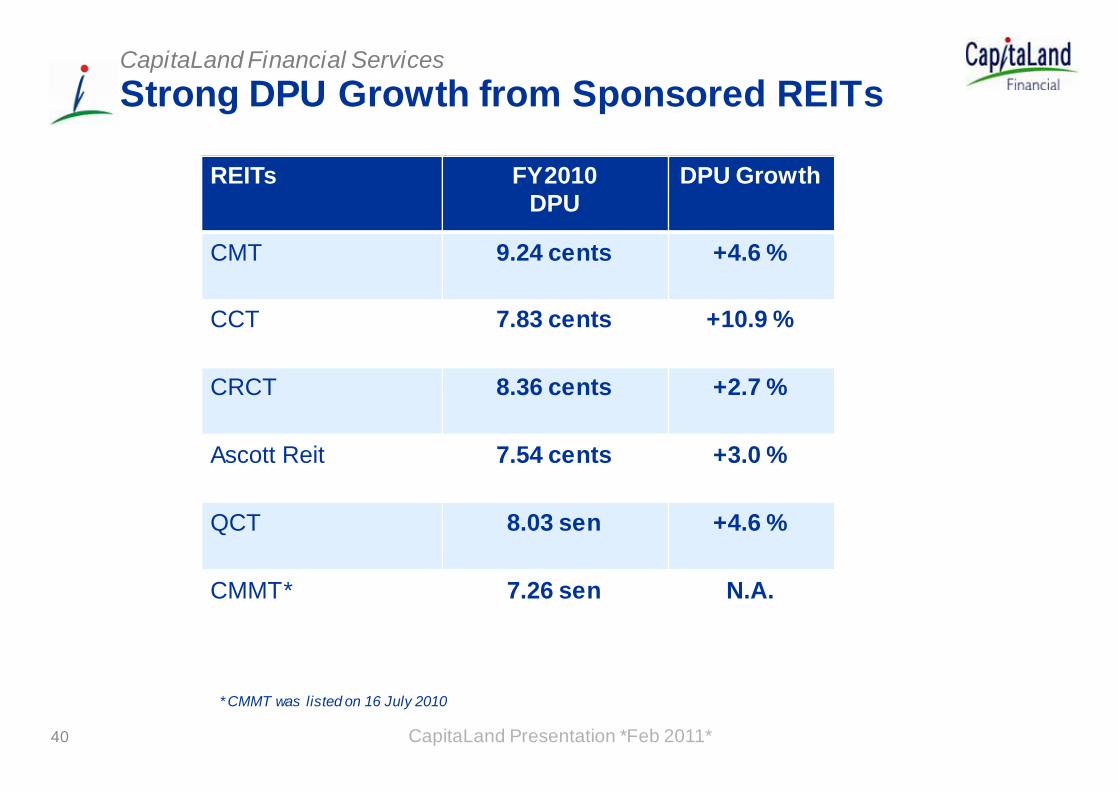
Strong DPU Growth from Sponsored REITsCapitaLand Financial Services
REITs FY2010DPU
DPU Growth
CMT 9.24 cents +4.6 %
CCT 7.83 cents +10.9 %
CRCT 8.36 cents +2.7 %
Ascott Reit 7.54 cents +3.0 %
QCT 8.03 sen +4.6 %
CMMT* 7.26 sen N.A.
* CMMT was listed on 16 July 2010
CapitaLand Presentation *Feb 2011*

Grow Financial ServicesCapitaLand Financial Services
Grow Assets Under Management REITs continue to seek accretive acquisitions and asset enhancements
Originate real estate private equity funds in Singapore, China, Vietnam and Malaysia
Originate structured financial productsMezzanine financingCredit enhancement
CapitaLand Presentation *Feb 2011*
25.5 25.6
30.4
222426283032
2008 2009 2010
Total Assets Under Management of over S$30b*S$b
* Includes AUM of REITs and PE Funds under CapitaMalls As ia
41

42
Robust 2010 PerformanceCapitaMalls Asia (CMA)
Underlying Growth Remains Strong
PATMI grew by 8.7% to $422m
Revaluation of $129.8m supported by growth in NPI
NPI from our malls registered 19% growth
Opened 5 malls in China
CapitaLand Presentation *Feb 2011*
ION Orchard

43
Performance of Operational Malls (opened for more than one year)
CapitaMalls Asia (CMA)
CapitaLand Presentation *Feb 2011*
FY 2010 FY 2009
NPI Yield based on
valuation as at 31 Dec 10(1)
NPI Yield based on
valuation as at 31 Dec 09(1)
Occupancy Rate as at 31
Dec 10 (2)
NPI Yield based on
valuation as at 31 Dec 09(1)
Occupancy Rate as at 31
Dec 09 (2)
Singapore 5.6% 5.8% 99.0% 5.5% 99.2%
China 5.0% 5.9% 96.1% 5.5% 95.6%
China (excl CRCT)
4.5% 5.5% 95.3% 4.5% 91.9 %
Malaysia 6.4% 6.8% 98.3% 6.5% 98.3%
Japan 3.3% 3.2% 95.1% 3.5% 79.3%
India 5.0% 5.4% 90.6% N.A. N.A.
Note: The table above excludes completed malls but were operational for less than a year as at Dec 10 and Dec 09 respectively. The above figures are on a 100% basis, where NPI yield and occupancy of each mall is taken in its entirety regardless of our interest.
(1) Refers to weighted average yield of our operational malls, computed by using the annualised net property income.(2) Refers to the weighted average committed occupancy rate.

44
Healthy Shopper Traffic & GTO UnderpinsRental Growth
CapitaMalls Asia (CMA)
CapitaLand Presentation *Feb 2011*
Country FY2010 vs FY2009 (%)
Shopper Traffic Gross Turnover (GTO)
Singapore(1) 3.8 6.4
China(2) 10.7 20.0
Malaysia(3) 18.5 -
Japan(4) 7.7 18.5
India(5) 32.0 73.0
(1) Excludes ION, Hougang Plaza, JCube & The Atrium@Orchard(2) Includes only those malls in operation since Jan 2009, while excluding 3 malls under CRCT in master
lease. GTO Sales not on same tenant basis, and excludes the GTO Sales from supermarket and department stores. GTO sales per sq ft is based on the Committed NLA as at 30 Jun 2009 and 2010,and excludes the committed NLA from supermarket and department stores.
(3) GTO figures unavailable(4) Excludes Ito Yokado for shopper traffic and GTO includes Vivit Square and Chitose Mall only(5) Forum Value Mall opened in Jun 2009. Hence, % change is 2H2010 vs 2H2009

45
CapitaMalls Asia (CMA)
CapitaLand Presentation *Feb 2011*
Opened 5 New Malls in China, 2010
Aidemengdun Mall, HarbinCuiwei Mall, Beijing
Anyang Mall, AnyangXinxiang Mall, Xinxiang
Jinshui Mall, Zhengzhou

46
Robust 2010 Performance (cont’d)Building strong platforms
Acquired 4 sites in China, 1 in Singapore & 1 in Malaysia for development
Monetisation of Clarke Quay to CMT
Listed CapitaMalls Malaysia Trust on Bursa Malaysia in July 2010
Luwan, ShanghaiQueensbay Mall, Penang
CapitaMalls Asia (CMA)
CapitaLand Presentation *Feb 2011*

47
Active Capital ManagementCapitaMalls Asia (CMA)
Extending debt maturity & diversification
Issued MTN of $350m at 3.95% for 7 years
Successfully refinanced ION Orchard
Expanding retail investors reach
Launched $200m 1-year and 3-year retail bonds
CapitaLand Presentation *Feb 2011*

48
CapitaMalls Asia (CMA)Positive Outlook for Retail in 2011Strong underlying fundamentals in Asia
GDP in China expected to grow robustly in 2011Tourism in Singapore forecast to register record figuresAsia is projected to be fastest growing region globally
Invest S$2bn in new investmentsFocus mainly on Singapore, China and MalaysiaTarget to increase malls in China from 53 to 100 over next 3-5 years
CapitaLand Presentation *Feb 2011* The Atrium@Orchard and Plaza Singapura

Strong Operating Performance in 2010Australand Property Group
49CapitaLand Presentation *Feb 2011*
Net operating profit of A$127.5m
Up 6% YoY
FY 2010 operating highlights :Investment property EBIT growth of
5% to A$161.4m
2,197 residential lots sold (apartments,
land and housing)
Solid performance from C&I Division
with 228,000 sqm of forward workload
Inclusion in the S&P/ASX 200
Australian-REIT and S&P/ASX 300
Australian-REIT indices
Port Coogee Residential, WA
KMart Eastern, NSW
48

Continued Progress on Stated Strategic ObjectivesAustraland Property Group
CapitaLand Presentation *Feb 2011*
Recurrent earnings in line with target range 60% - 70% (69% in FY2010)
Remain on track to improve development ROACE1 to at least 12% by FY2012
FY2010 Commercial & Industrial: 10.1%
FY2010 Residential: 8.3%
Gearing of 29.5% Within guidance of 25% - 35%
Simplified funding platform and extended debt maturity profile
Burleigh Heads, QLD
49
1 Return on Average Capital Employed

2011 Outlook - Fundamentals Remain PositiveAustraland Property Group
CapitaLand Presentation *Feb 2011*
Coles Parkinson, QLD
Valuations for quality assets have stabilised and expected to improve
$A39m revaluation gain in FY2010
Strong investment property portfolio metricsFY 2010 occupancy: 98%, WALE1: 5 years
A$7.5b residential pipelineRecord contracts on hand (up 122% YoY)
A$2.6b C&I pipelineStrong forward workload and improving market conditions to underpin growth
Burwood, VIC
1 Weighted Average Lease Expiry
50

2011 Outlook – Cautiously OptimisticAustraland Property Group
CapitaLand Presentation *Feb 2011*
Rental growth from investment propertiesStrong investment property portfolio metrics
High income visibility from property portfolioQuality income stream from the property portfolio underpins Australand’s distribution
Improved development contribution to drive continued growth
Increasing demand for office and logistics space
Targeting 25% growth in residential lot sales
357 Collins Street, VIC
CapitaLand Presentation *Feb 2011* 51

Financials & Capital Management
Olivier LimGroup CFO

54
Group Overview – FY 2010 PATMI AnalysisFinancials
1 Portfolio gains reflect divestments
FY2009 Better/(Worse)(S$ m)
(139.3)
(698.3)
697.6
983.9
FY2010
558.3
285.6Portfolio Gains1
Operating Profit
581.2(92.9) 488.3Revaluation (Losses) / Gains
PATMI 1,053.0 1,273.1 220.1
(535.6) (59.1) 476.5Impairments

55
PATMI excluding CMA & AustralandFinancials
(S$ m) FY2010
122.6
276.3CapitaMalls Asia
Australand
CapitaLand Group 1,273.1
CapitaLand Presentation *Feb 2011*
%
9.6
21.7
100.0
874.2CapitaLand ex.
CMA & ALZ 68.7
Contribution from:

56
FY2009 Change
EBIT by SBUsFinancials
53.9%
98.0
371.7
551.2
(497.4)
31.4
449.1
1,549.0
FY2010
351.5
682.4
264.2
103.0
173.0
472.4
2,384.2
CapitaLand Commercial2
CapitaMalls Asia
The Ascott Limited
CapitaLand Financial
TOTAL EBIT
CapitaLand China Holdings1
CapitaLand Residential S’pore
(S$ m)
785.8 25.8Others3
-5.4%
23.8%
N.M.
450.7%
5.2%
5.2%
-96.7%
1 Excludes Retail and Serviced Residences in China2 Includes residential businesses in Vietnam, Malaysia, India and Thailand3Includes Corporate Office and Others
CapitaLand Presentation *Feb 2011*
Australand (240.8) 311.9 N.M.

57
EBIT by GeographyFinancials
947 846
301
176 102
12
(300)
(100)
100
300
500
700
900
1,100
1,300
FY 2009 FY 2010
FY 2010: S$2.4b vs FY 2009: S$1.5b
Singapore China1
Other Asia2Australia
Europe
$ m
1China including Macau & Hong Kong2Exclude Singapore and China but include projects in GCC
Others
(13)
(219)
CapitaLand Presentation *Feb 2011*
(243)
32
680
1,312
412
Gai
ns fr
om li
stin
g of
CM
A900

58
Strong Balance Sheet & Liquidity PositionCapital Management
Change
Increased
Decreased
Increased
Improved
FY 2009
66%
16.9
8.7
1.6
FY 2010
18.0
7.2
3.2
72%
Net Debt (S$b)
% Fixed Rate Debt
Cash (S$b)
Equity (S$b)
Ave Debt Maturity(Yr)1 Improved3.5 3.7
Strong0.09 0.18Net Debt/Equity
CapitaLand Presentation *Feb 2011*
1Based on put dates of Convertible Bond holders
3.03 3.22 IncreasedNTA/share ($)

Going Forward
59
Liew Mun LeongGroup President & CEO

Global Economic Outlook in 2011Global economic recovery still on track
US economy gaining strengthRobust outlook for China, now the world’s 2nd largest economy
IMF expects world GDP to grow by 4.4%, while Developing Asia grows by 8.4% in 2011
Developing Asia leads the growth, underpinned by
Stronger fundamentalsGrowing domestic demand and rising income levelsGrowing intra-Asian trade
CapitaLand Presentation *Feb 2011*
9.2
8.3
7.0
6.2
5.1 5.0
4.3
3.1 3.2
1.51.2
0
1
2
3
4
5
6
7
8
9
10% 2011 Growth Forecast
Source: Consensus Forecast 10 Jan 2011. *India’s forecast for FY11 (Apr ‘11 to Mar ’12)
60

Global Economic Outlook – Key Risks
Key risksPolicy tightening as Emerging Asia combats inflation and asset bubbles
High and rising inflation in Emerging Asia, especially due to food and energy prices
Asset bubbles in Emerging Asia due to strong liquidity
Sovereign debt risk and fiscal sustainability in G3 (US, Eurozone, Japan)Middle East volatility and impact on oil price
CapitaLand Presentation *Feb 2011* 61

Executing the Strategy1. Increase Presence in Singapore
Greater focus on Singapore
Residential • Aim to be top three developer with 15%
market share (~2,000 units) in terms of units sold through capitalising on our strong financial position to replenish development portfolio with prime sites
Shopping Malls• Underlying growth remains strong with
high shopper traffic and GTO
62 CapitaLand Presentation *Feb 2011*
The Interlace
Bedok Town Centre Site

Executing the Strategy (cont’d)1. Increase Presence in Singapore
Greater focus on Singapore
Office• Expand office portfolio of 8
properties through acquisitions and evaluation of Market Street Car Park redevelopment
Serviced Residence• Increase market share through
acquisition of new sites and properties
63 CapitaLand Presentation *Feb 2011*
Ascott Raffles Place Singapore
Six Battery Road , Singapore

Executing the Strategy (cont’d)2. Grow China Business
Target 35 – 45% of CL’s business
Strong pipeline over next 4 – 5 yearsPipeline of 25,000 residential units in 1st / 2nd tier cities Secure pipeline of over 15,000 affordable homes in 2011Double serviced residence portfolio to 12,000 units by 2015Scaling up our China platform through strategic partnerships and Funds platform Leverage on our multi-sector capabilities
64 CapitaLand Presentation *Feb 2011*
Raffles City Changning, Shanghai
The Ascott Suzhou, Suzhou

Executing the Strategy (cont’d)2. Grow China Business
65 CapitaLand Presentation *Feb 2011*
Panyu
University Town
Haizhu
Tianhe
Zhujiang New Town
YuexiuBeau Monde
As ian Game Vi l lage
LFIE Panyu Project
4# Shiji station
LFIE Location Map
Low density
High rise
High rise
Retail & Facilities
PrimaryschoolMiddle
schoolKindergarden
Primaryschool
Yacht Club
Potential GFA: 1,108,455sqm
Residential: 1,075,560sqmHigh rise: 924,792 sqm
Low density: 150,768 sqm
Retail/Facilities: 32,895 sqm

Executing the Strategy (cont’d)
China Assets: S$10b (36%* of Group’s Balance Sheet)
* Excluding cash
CapitaLand Presentation *Feb 2011*
Commercial & Mixed
Development37%
Residential33%
Retail22%
Serviced Residences
8%
66
Balanced Portfolio in China

Executing the Strategy (cont’d)
CapitaLand Presentation *Feb 2011*67
3. Grow Vietnam Business
Continue to seek opportunities in prime
residential developments
Expansion in affordable housing
Explore presence in other real estate
segments, e.g. mixed developments
and shopping malls
Hai Phong
Hanoi
Danang
Ho Chi Minh City
HOMES
SERVICED RESIDENCES
FINANCIAL SERVICES
SCHOOLS/FACILITIES

4. Expand into Affordable Housing in China and Vietnam
Actively seek more sites to build affordable homes
Build 10,000 – 15,000 affordable homes annually in
China and Vietnam over the next 3 - 5 years
Focus on 2nd and 3rd tier cities in China
New dedicated management team focusing on
differentiated products and execution platform
Executing the Strategy (cont’d)
CapitaLand Presentation *Feb 2011*68

Executing the Strategy (cont’d)
5. Build Ascott’s Global Dominance
Deploy S$1b capital into new investments
Grow portfolio to 40,000 units by 2015
Enhance customer experience and brand image
Continual staff training, IT upgrade and consistent high service standards
S$70m refurbishment programme across 16 properties
69 CapitaLand Presentation *Feb 2011*
Ascott Huai Hai Road Shanghai
Ascott Raffles City Ningbo

Executing the Strategy (cont’d)
6. Grow Financial Services Franchise
To Grow Assets Under Management
Originate real estate private equity
funds in Singapore, China,
Vietnam and Malaysia
Originate structured financial
products
70 CapitaLand Presentation *Feb 2011*
6 REITs & 17 Private Equity Funds6 REITs & 17 Private Equity Funds
Executing the Strategy (cont’d)
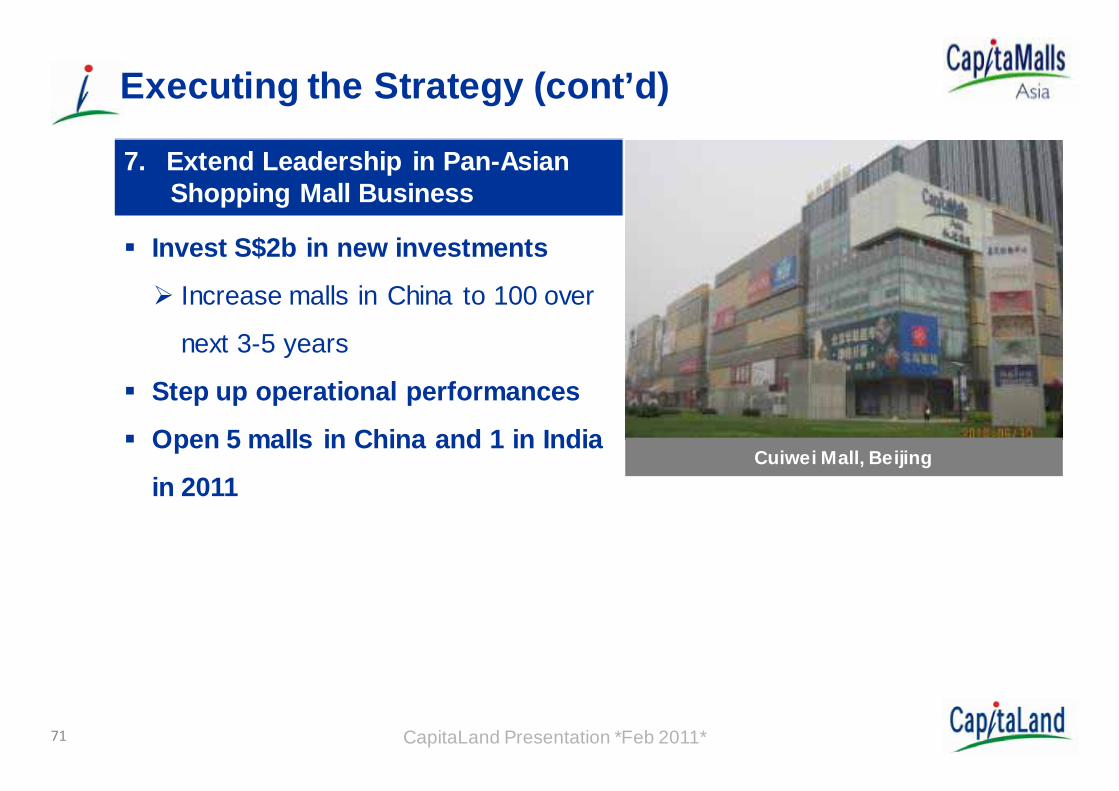
7. Extend Leadership in Pan-Asian Shopping Mall Business
Invest S$2b in new investments
Increase malls in China to 100 over
next 3-5 years
Step up operational performances
Open 5 malls in China and 1 in India
in 2011
71 CapitaLand Presentation *Feb 2011*
Cuiwei Mall, Beijing

Executing the Strategy (cont’d)
72 CapitaLand Presentation *Feb 2011*
Ximao Mall, BeijingXuefu Mall, Harbin Rizhao Mall, Rizhao
Minhang Plaza, ShanghaiHongkou Plaza, Shanghai
GFA of 96,635 sq m GFA of 77,458 sq m GFA of 72,649 sq m
GFA of 227,513 sq m GFA of 146,843 sq m
China: Expected Mall Openings in 2011
73
SummaryFifth consecutive year of above $1b PATMI
Aggregate PATMI of $7.4b over last 5 yearsPATMI registered 11% CAGR between 2005 – 2010
Active investmentsCommitted over $6b of new investments in 2010Investment outflow of $5.3b incurred in 2010, up 100% YoY
Financial flexibility & balance sheet strengthLow net D/E ratio of 0.18, $7.2b cash on balance sheetAdditional $6b of financial capacity assuming net D/E of 0.5
Strong fundamental recoveryEarnings improved across all property sectors, geographies and SBUs*
CapitaLand Presentation *Feb 2011*
* Excluding CRS’ share of revaluation gain of $71.6m from ION Orchard in FY09, EBIT for FY10 would be 17% higher YoY

74
ConclusionInvesting for sustainable growth
Portfolio ready for future growthSeeking $5-6b of new investments in 2011
Government cooling measures present opportunitiesWill stabilise markets in China and SingaporeSeek acquisitions when price expectations are moderated
Proxy to Asian growth momentumOur business is mainly in fast growing Emerging AsiaGreater opportunities with balanced multi-sector, multi-geography and complete real estate value chain approach, ieinvestor, developer, operator, asset manager and fund manager
CapitaLand Presentation *Feb 2011*

Thank You