financially constrained long-range transportation plan ... · financially constrained long-range...
TRANSCRIPT
FINANCIALLY CONSTRAINED
LONG-RANGE TRANSPORTATION PLAN
(CLRP) FOR THE NATIONAL
CAPITAL REGION 2016 CLRP Amendment Documentation
November 16, 2016
FINANCIALLY CONSTRAINED LONG-RANGE TRANSPORTATION PLAN (CLRP) FOR THE NATIONAL CAPITAL REGION: 2016 CLRP AMENDMENT DOCUMENTATION
Adopted by the TPB on November 16, 2016
ABOUT THE TPB
The National Capital Region Transportation Planning Board (TPB) is the federally designated
metropolitan planning organization (MPO) for metropolitan Washington. It is responsible for
developing and carrying out a continuing, cooperative, and comprehensive transportation planning
process in the metropolitan area. Members of the TPB include representatives of the transportation
agencies of the states of Maryland and Virginia and the District of Columbia, 22 local governments,
the Washington Metropolitan Area Transit Authority, the Maryland and Virginia General Assemblies,
and nonvoting members from the Metropolitan Washington Airports Authority and federal agencies.
The TPB is staffed by the Department of Transportation Planning at the Metropolitan Washington
Council of Governments (COG).
CREDITS
Technical Development and Analysis: Andrew Austin, Charlene Howard, Wendy Klancher, Erin
Morrow, Jinchul Park, Jane Posey, Eric Randall, Sergio Ritacco, Daniel Son, Dusan Vuksan, Feng Xie,
Lori Zeller
Contributing Authors: Andrew Austin, Ben Hampton, Wendy Klancher, Sergio Ritacco, Dan Sonenklar,
John Swanson, Lori Zeller
ACCOMMODATIONS
Alternative formats of this document are available upon request. Visit
www.mwcog.org/accommodations or call (202) 962-3300 or (202) 962-3213 (TDD).
TITLE VI NONDISCRIMINATION POLICY
The Metropolitan Washington Council of Governments (COG) fully complies with Title VI of the Civil
Rights Act of 1964 and related statutes and regulations prohibiting discrimination in all programs
and activities. For more information, to file a Title VI related complaint, or to obtain information in
another language, visit www.mwcog.org/nondiscrimination or call (202) 962-3300.
El Consejo de Gobiernos del Área Metropolitana de Washington (COG) cumple con el Título VI de la
Ley sobre los Derechos Civiles de 1964 y otras leyes y reglamentos en todos sus programas y
actividades. Para obtener más información, someter un pleito relacionado al Título VI, u obtener
información en otro idioma, visite www.mwcog.org/nondiscrimination o llame al (202) 962-3300.
Copyright © 2016 by the Metropolitan Washington Council of Governments
TABLE OF CONTENTS
OVERVIEW ......................................................................................................................................... 1
What is the TPB? ...................................................................................................................................................... 1
Overview of the CLRP ............................................................................................................................................... 1
THE CLRP PROCESS AND PLANNING CONTEXT ........................................................................... 4
Schedule for Developing and Adopting the Amendment ........................................................................................ 4
Regional Policy Framework ...................................................................................................................................... 4
Federal Requirements ............................................................................................................................................. 7
Regional Planning Activities ................................................................................................................................... 13
Public Involvement ................................................................................................................................................. 13
POPULATION AND JOB GROWTH FORECASTS ........................................................................... 15
Cooperative Land-Use Forecasting Process .......................................................................................................... 15
Latest Regional Growth Forecasts ......................................................................................................................... 15
PROJECTS AND PROGRAMS ........................................................................................................ 18
Major Highway Projects.......................................................................................................................................... 18
Major Transit Projects ............................................................................................................................................ 24
New Projects and Significant Changes .................................................................................................................. 26
Descriptions of New Projects and Major Project Changes .................................................................................... 30
FINANCIAL ANALYSIS.................................................................................................................... 39
CLRP Revenues ...................................................................................................................................................... 39
CLRP Expenditures ................................................................................................................................................. 40
PERFORMANCE ANALYSIS OF THE 2016 CLRP ........................................................................ 41
Performance Analysis Summary ............................................................................................................................ 41
Performance Analysis and the TPB’s Regional Transportation Priorities ............................................................. 45
Transit Improvements ............................................................................................................................................ 47
Targeted Congestion Relief .................................................................................................................................... 52
Access to Transit & Circulation in Activity Centers ................................................................................................ 58
Environmental Justice Considerations .................................................................................................................. 59
Air Quality and Climate ........................................................................................................................................... 59
Findings .................................................................................................................................................................. 62
LOOKING AHEAD: THE 2018 UPDATE ......................................................................................... 63
FIGURES AND TABLES
FIGURE 1: TPB PLANNING AREA ................................................................................................................................. 2 FIGURE 2: REGIONAL POPULATION AND JOB GROWTH .......................................................................................... 15 FIGURE 3: POPULATION GROWTH, 2016-2040 ....................................................................................................... 16 FIGURE 4: EMPLOYMENT GROWTH, 2016-2040 .................................................................................................... 17 FIGURE 5: MAJOR HIGHWAY PROJECTS ................................................................................................................... 21 FIGURE 6: MAJOR HOT, HOV, AND TOLL LANE PROJECTS ...................................................................................... 23 FIGURE 7: MAJOR TRANSIT PROJECTS ..................................................................................................................... 25 FIGURE 8: RTPP GOALS AND CORRESPONDING QUESTIONS IN THE CLRP CALL FOR PROJECTS ....................... 27 FIGURE 9: CLRP REVENUES, 2015-2040 ................................................................................................................ 39 FIGURE 10: CLRP EXPENDITURES, 2015-2040 ...................................................................................................... 40 FIGURE 11: 2016 CLRP PERFORMANCE ANALYSIS SUMMARY ............................................................................. 42 FIGURE 12: GROWTH IN ALL TRIPS AND WORK TRIPS BY MODE .......................................................................... 43 FIGURE 13: GROWTH IN ALL TRIPS AND WORK TRIPS BY MODE .......................................................................... 44 FIGURE 14: GEOGRAPHIC DIFFERENCES IN MODE SHARE FOR ALL TRIPS .......................................................... 44 FIGURE 15: GEOGRAPHIC DIFFERENCES IN MODE SHARE FOR WORK TRIPS ...................................................... 45 FIGURE 16: POPULATION AND JOBS IN PROXIMITY TO HIGH-CAPACITY TRANSIT ................................................. 47 FIGURE 17: ACTIVITY CENTERS WITH HIGH-CAPACITY TRANSIT ............................................................................. 49 FIGURE 18: METRORAIL CONSTRAINT ..................................................................................................................... 50 FIGURE 19: AVERAGE NUMBER OF JOBS ACCESSIBLE BY TRANSIT WITHIN 45-MINUTE COMMUTE .................. 50 FIGURE 20: CHANGE IN ACCESS TO JOBS BY TRANSIT (2016 – 2040) ................................................................ 51 FIGURE 21: CONGESTED LANE MILES ..................................................................................................................... 53 FIGURE 22: SHARE OF LANE MILES CONGESTED ................................................................................................... 53 FIGURE 23: 2016 MAJOR HIGHWAY CONGESTION MAP (AM PEAK) ...................................................................... 53 FIGURE 24: 2040 MAJOR HIGHWAY CONGESTION MAP (AM PEAK) ...................................................................... 54 FIGURE 25: CHANGE IN VEHICLE HOURS OF DELAY ............................................................................................... 55 FIGURE 26: CHANGE IN AVERAGE MINUTES OF DELAY PER VEHICLE TRIP........................................................... 55 FIGURE 27: VEHICLE MILES OF TRAVEL: TOTAL AND PER CAPITA ......................................................................... 55 FIGURE 28: AVERAGE NUMBER OF JOBS ACCESSIBLE BY AUTOMOBILE WITHIN 45-MINUTE COMMUTE .......... 56 FIGURE 29: CHANGE IN ACCESS TO JOBS BY AUTO (2016 – 2040) ...................................................................... 57 FIGURE 30: POPULATION AND JOB GROWTH INSIDE AND OUTSIDE OF REGIONAL ACTIVITY CENTERS (ACS) .... 59 FIGURE 31: VOLATILE ORGANIC COMPOUND (VOC) EMISSIONS ............................................................................ 60 FIGURE 32: PRECURSOR NITROGEN OXIDE (NOX) EMISSIONS .............................................................................. 61
FIGURE 33: CARBON DIOXIDE EQUIVALENT (CO2E) EMISSIONS ............................................................................ 61
TABLE 1: ROADWAY LANE MILES IN THE CLRP ........................................................................................................ 18 TABLE 2: TOLLED LANE MILES IN THE CLRP ......................................................................................................... 242 TABLE 3: HIGH-CAPACITY TRANSIT MILES IN THE CLRP ......................................................................................... 24 TABLE 4: 2016 CLRP PROJECT SUBMISSIONS AND RTPP GOALS ......................................................................... 28 TABLE 5: 2016 CLRP PROJECT SUBMISSIONS AND FEDERAL PLANNING FACTORS ............................................ 29

2016 CLRP Amendment Documentation I 1
OVERVIEW
What is the TPB?
The National Capital Region Transportation Planning Board (TPB) is the federally designated
Metropolitan Planning Organization (MPO) for the region, and plays an important role as the regional
forum for transportation planning. The TPB is responsible for carrying out a continuing, cooperative,
and comprehensive planning process for regional transportation planning in the District of Columbia,
Northern Virginia, and Suburban Maryland. The TPB prepares plans and programs that must receive
federal approval in order for federal-aid transportation funds to flow to the Washington region.
Members of the TPB include representatives of the transportation agencies of the states of Maryland
and Virginia, the District of Columbia, local governments, the Washington Metropolitan Area Transit
Authority, the Maryland and Virginia General Assemblies, and non-voting members from the
Metropolitan Washington Airports Authority and federal agencies
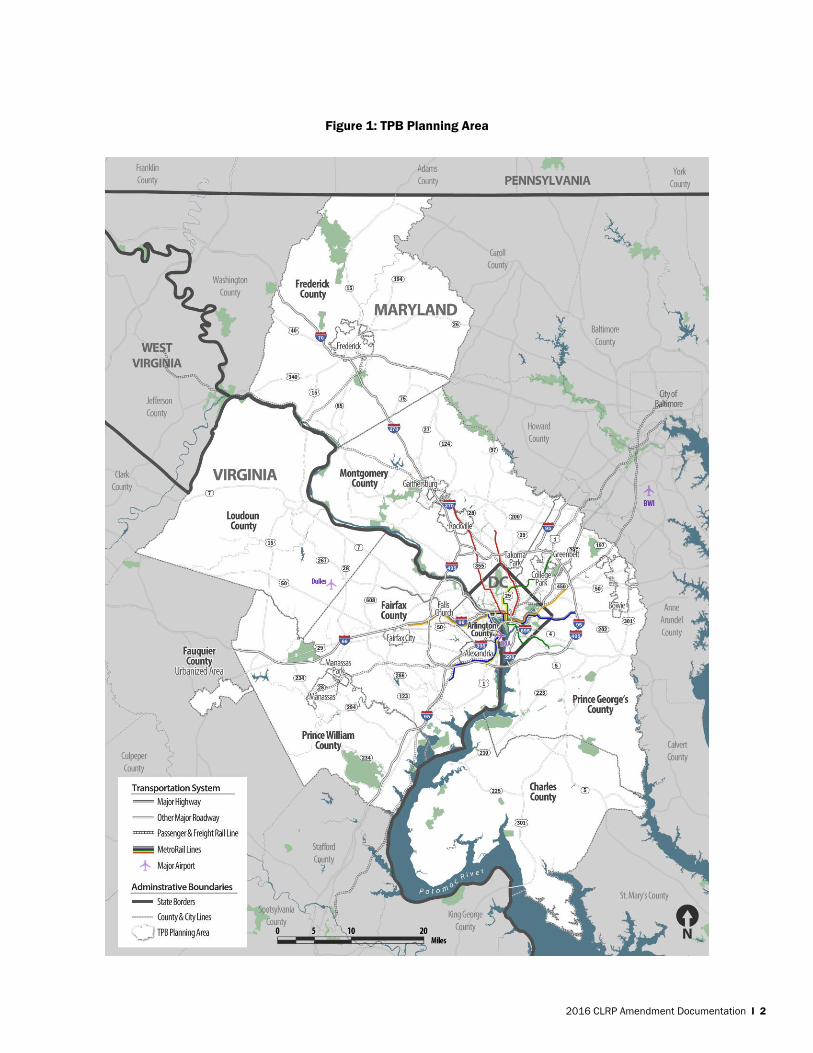
The CLRP includes projects and programs in jurisdictions that make up the TPB’s federally
designated planning area (Figure 1). This area, known as the National Capital Region, includes the
District of Columbia and 21 surrounding counties and cities in Suburban Maryland and Northern
Virginia.
Overview of the CLRP
The CLRP is a statement of the ways the region plans to invest in its transportation system over the
next 20 to 30 years. The plan includes regionally significant projects and programs that seek to
facilitate the efficient movement of people and goods using a variety of transportation modes. It also
outlines all anticipated spending on operations and maintenance of the current and future
transportation system over the same timeframe.
The TPB adopts a major update to the CLRP once every four years which includes the completion of
a comprehensive financial analysis indicating how the region expects to invest in the transportation
system. In addition, the TPB typically amends the CLRP every year to include new projects and
programs and to make changes to projects already in the plan as priorities at the local, state, and
regional levels change and as funding for new initiatives is identified. Any project that might affect
future air quality by adding or removing highway or transit capacity is considered to be “regionally
significant” and must be included in the plan, as must any project that will require federal funding or
federal approval during the timespan that the CLRP covers.
A regional policy framework, described in detail in the next chapter, is meant to guide the
development of projects to be included in the CLRP. The framework spells out regional goals,
priorities, and needs that the TPB asks agencies to consider when developing and submitting
projects for inclusion in the plan. The TPB Vision, adopted in 1998, serves at the policy element of
the CLRP and provides a comprehensive set of policy goals, objectives, and strategies to guide
2016 CLRP Amendment Documentation I 2
Figure 1: TPB Planning Area
2016 CLRP Amendment Documentation I 3
decision making. The Regional Transportation Priorities Plan, adopted in 2014, focuses attention on
a handful of strategies with the greatest potential to advance regional goals rooted in the Vision.
A host of federal planning regulations also guide the development of the CLRP. These requirements
are described in detail in the next chapter, but two requirements are particularly important –
financial constraint and air quality conformity.
According to federal law and regulation, the TPB must develop a long-range transportation plan that
is financially constrained. This means that the plan must demonstrate that projects can be
implemented using revenue sources that are already committed, available, or reasonably expected
to be available in the future. As such, the CLRP is not a comprehensive list of all improvements that
localities in the region desire to make between now and 2040. It does not include any planned
project for which funding has yet to be identified, nor does it include smaller-scale capital
improvements that are not considered regionally significant or that will not require federal funding.
The other key characteristic of the CLRP is that it must ensure that emissions resulting from
transportation investments are consistent, or “in conformity” with, emissions levels set forth in air
quality plans adopted by the states. Federal law requires such “conformity findings” in all
metropolitan regions that are currently not in attainment of certain federal air quality standards.
The CLRP pulls together in one place all of the regionally significant transportation investments that
are reasonably expected to be made in coming decades to accommodate anticipated changes in
demand for travel based upon anticipated growth in the region. The plan can be analyzed to see how
the region’s transportation future looks under existing planning and funding trajectories, helping
decision makers and the public better understand what changes to current plans and funding might
be needed in order to achieve different future outcomes.
2016 CLRP Amendment Documentation I 4
THE CLRP PROCESS AND PLANNING CONTEXT
Every four years the TPB completes a major update of the CLRP. The quadrennial update includes a
comprehensive record of the past four years of regional transportation planning and a financial
analysis that serves as a statement of the ways the region expects to invest in the transportation
system over the next 20-30 years. The last major update was approved in 2014, and the next one
will be complete in 2018.
In addition to the full updates every four years, the TPB typically completes an annual amendment to
the CLRP to include new projects and programs and make changes to those already in the plan.
From December 2015 to November 2016, the TPB oversaw a CLRP amendment process which
provides the content for this report.
Schedule for Developing and Adopting the Amendment
Development of the 2016 CLRP Amendment began in December 2015 when the TPB issued the Call
for Projects which invited area transportation agencies to submit new projects or changes to existing
projects to consider for inclusion in the plan. As described in the section “New Projects and
Significant Changes,” the Call for Projects for the first time asked agencies to explain how their
project submissions would serve the goals of the Regional Transportation Priorities Plan.
On February 11, 2016, the TPB released the project submissions for the first of two public comment
periods for the CLRP Amendment. After a 30-day comment period, the TPB on March 16 approved
the project submissions for inclusion in the Air Quality Conformity Analysis. This analysis, described
later in this section, is required to demonstrate that future vehicle-related emissions under the
proposed plan, including the proposed additions and changes, will remain below approved regional
limits. In the spring and summer of 2016, TPB staff conducted a regional analysis of the
transportation network in the CLRP, including the newly proposed projects. This analysis forecast
future travel demands and travel patterns, as well as air quality conformity.
On October 13, the TPB released the proposed 2016 CLRP amendment, the FY 2017-2022
Transportation Improvement Program (TIP), and the Air Quality Conformity Analysis for a second and
final 30-day public comment period. The TPB approved these documents on November 16, 2016.
Regional Policy Framework
The TPB Vision and the Regional Transportation Priorities Plan make up the regional policy
framework meant to help guide transportation planning and decision-making in the Washington
region. A small number of other TPB and COG policy documents and studies provide additional policy
context. The TPB strongly encourages agencies to consider this regional policy framework as they
develop and select projects to submit for inclusion in the CLRP and TIP.
THE TPB VISION
To guide the planning and implementation of transportation strategies, actions, and projects for the
National Capital Region the TPB adopted the Vision in October 1998 that includes a comprehensive
set of policy goals, objectives, and strategies. The TPB Vision incorporates the eight planning factors
2016 CLRP Amendment Documentation I 5
specified in current federal regulations; security is addressed implicitly. The full Vision document is
available on the TPB website.
Vision Statement In the 21st Century, the Washington metropolitan region remains a vibrant world capital, with a
transportation system that provides efficient movement of people and goods. This system promotes
the region's economy and environmental quality, and operates in an attractive and safe setting--it is
a system that serves everyone. The system is fiscally sustainable, promotes areas of concentrated
growth, manages both demand and capacity, employs the best technology, and joins rail, roadway,
bus, air, water, pedestrian, and bicycle facilities into a fully interconnected network.
The Vision Goals
1. The Washington metropolitan region's transportation system will provide reasonable access
at reasonable cost to everyone in the region.
2. The Washington metropolitan region will develop, implement, and maintain an
interconnected transportation system that enhances quality of life and promotes a strong
and growing economy throughout the entire region, including a healthy regional core and
dynamic regional activity centers with a mix of jobs, housing and services in a walkable
environment.
3. The Washington metropolitan region's transportation system will give priority
to management, performance, maintenance, and safety of all modes and facilities.
4. The Washington metropolitan region will use the best available technology to maximize
system effectiveness.
5. The Washington metropolitan region will plan and develop a transportation system that
enhances and protects the region's natural environmental quality, cultural and historic
resources, and communities.
6. The Washington metropolitan region will achieve better inter-jurisdictional coordination of
transportation and land use planning.
7. The Washington metropolitan region will achieve an enhanced funding mechanism(s) for
regional and local transportation system priorities that cannot be implemented with current
and forecasted federal, state, and local funding.
8. The Washington metropolitan region will support options for international and interregional
travel and commerce.
THE REGIONAL TRANSPORTATION PRIORITIES PLAN
Adopted by the TPB in January 2014, the Regional Transportation Priorities Plan, focuses attention
on a handful of transportation strategies with the greatest potential to advance regional goals rooted
in the TPB Vision. The Priorities Plan aims to identify those strategies that are “within reach” both
financially and politically. The Plan calls for maintaining the region’s existing system of roadways and
transit first, strengthening public confidence and ensuring fairness, and finding better, more efficient
ways to move people and goods.
The Priorities Plan serves as a policy guide to assist local, state, and regional leaders in “thinking
regionally and acting locally” - that is, in considering regional needs when identifying transportation
improvements to advance to implementation. Pursuing the priorities and strategies outlined in this
Plan will lead to greater economic vitality and a higher quality of life in the Washington region.
2016 CLRP Amendment Documentation I 6
Priorities Plan Goals
1. Provide a Comprehensive Range of Transportation Options
2. Promote a Strong Regional Economy, Including a Healthy Regional Core and Dynamic Activity
Centers
3. Ensure Adequate System Maintenance, Preservation, and Safety
4. Maximize Operational Effectiveness and Safety of the Transportation System
5. Enhance Environmental Quality, and Protect Natural and Cultural Resources
6. Support Inter-Regional and International Travel and Commerce
Priorities and Strategies Identified in the RTPP
1. Meet Our Existing Obligations: Funding for maintenance and state-of-good-repair needs
should continue to be prioritized over system expansion.
Strategies:
Ensure Maintenance of the Transit System
Ensure Maintenance of Roads and Bridges
2. Strengthen Public Confidence and Ensure Fairness: Efforts to increase accountability and
address the needs of historically transportation-disadvantaged populations should be
considered in all stages of project planning, design, and implementation.
Strategies:
Ensure Accessibility for Persons with Disabilities, Low Incomes, and Limited English
Proficiency
Engage and Communicate with the Public
Promote System Efficiency Through Management and Operations, and the Appropriate
Use of Technology
3. Move More People and Goods More Efficiently: Improvements to the transportation system
should seek to do more with less—to make more efficient use of existing infrastructure and
promote greater use of more efficient travel modes for both people and goods.
Strategies:
Improve Access to Transit Stops and Stations
Alleviate Roadway Bottlenecks
Support and Promote Electric Vehicles
Promote Commute Alternatives
Expand Pedestrian Infrastructure
Expand Bicycle Infrastructure
Apply Bus Priority Treatments
Increase Roadway Efficiency
Update and Enforce Traffic Laws
Provide Additional Capacity on the Existing Transit System
Concentrate Growth in Activity Centers
Enhance Circulation within Activity Centers
2016 CLRP Amendment Documentation I 7
Implement Bus Rapid Transit & Other Cost-Effective Transit Alternatives
Construct/implement Express Toll Lanes
Read more about the regional policy framework at mwcog.org/CLRP.
Federal Requirements
The following federal requirements govern activities that inform the development and content of the
CLRP, as well the overall regional transportation planning process.
CONSIDERATION OF THE FEDERAL PLANNING FACTORS In addition to considering regional policies when developing the CLRP, the TPB is required to
consider federal planning factors in developing its regional plan and program. The eight federal
planning factors are encompassed by the TPB Vision's policy goals as described below. Each
planning factor is included in one or more of the TPB Vision goals, objectives and strategies, except
for security, which is implicitly addressed in the TPB Vision. The new planning regulations
added safety and security as two separate planning factors, which are addressed by the TPB in on-
going planning activities.
A mapping of the eight Federal planning factors to the eight TPB Vision policy goals is provided
below.
1. Support the economic vitality of the metropolitan area, especially by enabling global
competitiveness, productivity, and efficiency
TPB policy goal #2 addresses this factor. Policy goal #8 also addresses this factor by
discussing options for promoting international and interregional travel and commerce. Global
competitiveness is encouraged through the Ground Access Element of the Regional Airport
System and the planned Metrorail to Dulles project.
2. Increase the safety of the transportation system for all motorized and non-motorized
users
TPB policy goal #3 addresses this factor and the CLRP includes a Transportation Safety
Element. Planning activities have resulted in many programs to promote safety including:
Street Smart campaign, operations and maintenance funds to keep existing network safe to
use, effective enforcement of all traffic laws and motor carrier safety regulations,
achievement of national targets for seatbelt use, appropriate safety features in facility
design.
3. Increase the ability of the transportation system to support homeland security and to
safeguard the personal security of all motorized and non-motorized users
TPB Policy goal #3 addresses safety and policy goal #4 speaks to technology that enhances
safety and security measures. Security has been a major focus since the 9/11 attacks. With
TPB member participation, regional transportation security activities are undertaken through
the homeland security committee structure of the Metropolitan Washington Council of
2016 CLRP Amendment Documentation I 8
Governments (COG), involving federal, state and local public safety and homeland security
stakeholders.
On October 19, 2005, the TPB added an initial multi-year Regional Transportation
Coordination Program to the CLRP and Transportation Improvement Program. The program, a
partnership of the region's major transportation agencies, is to coordinate and support
regional sharing of transportation systems condition and management information during
incidents.
4. Increase accessibility and mobility of people and freight
TPB policy goal #1 addresses this factor as well as the TPB scenario study, called the
Regional Mobility and Accessibility Study. The study is examining alternative land use and
transportation scenarios for 2030. The TPB is currently expanding its freight planning efforts.
5. Protect and enhance the environment, promote energy conservation, improve the quality
of life, and promote consistency between transportation improvements and State and local
planned growth and economic development patterns
TPB policy goal #5 addresses this factor. The TPB's environmental consultation and
mapping relates to this planning factor, as does the air quality conformity analysis. TPB policy
goal #6 addresses this factor as well, and many of the TPB's planning activities work towards
this goal, including the TPB's Transportation / Land-Use Connections program, the
development of the Regional Activity Centers and Clusters, the Regional Mobility and
Accessibility Study, and the Cooperative Forecasting program.
6. Enhance the integration and connectivity of the transportation system, across and
between modes, for people and freight
TPB policy goal #2 addresses this factor, calling for an interconnected transportation system,
multi-modal connections in the regional core and activity centers, ground access to airports.
Numerous improvements in the plan contribute to a web of multi-modal connections
between the core and activity centers, including transit and HOV (Dulles Rail, HOV/HOT, Bi-
County Transitway), highways (circumferential corridor improvements, US-301, Tri-County
Parkway) and goods movement.
7. Promote efficient system management and operation;
TPB policy goal #3 addresses this factor, specifying priority to management and maintenance
of existing facilities. TPB policy goal #4 addresses this factor, by stating the region will use
"the best available technology to maximize system effectiveness".
8. Emphasize the preservation of the existing transportation system.
TPB policy goal #3 addresses this factor. This is evidenced by the financial analysis of the
CLRP, where over 75% of allocated funding is for operating and maintaining transit and
highways.
2016 CLRP Amendment Documentation I 9
TRANSPORTATION IMPROVEMENT PROGRAM (TIP)
The Transportation Improvement Program (TIP) is a 6-year financial program that describes the
schedule for obligating federal funds to state and local projects. The TIP contains funding
information for all modes of transportation including highways and high occupancy vehicle (HOV)
facilities as well as transit capital and operating costs. The TIP represents an agency's intent to
construct or implement a specific project and the anticipated flow of federal funds and matching
state or local contributions. State, regional and local transportation agencies update the TIP each
year to reflect priority projects in the CLRP. A public forum was held during the course of the
development of the TIP on July 14, 2016. The FY 2017-2022 TIP is available online and in
a searchable database.
FINANCIAL CONSTRAINT
The financial plan for the CLRP demonstrates that the forecast revenues reasonably expected to be
available are equal to the estimated costs of expanding and adequately maintaining and operating
the highway and transit system in the region through 2040. The forecasts were prepared by the
transportation implementing agencies and jurisdictions, with technical integration and
documentation provided by consultants.
AIR QUALITY CONFORMITY
The TPB must make sure that the projects in the CLRP and TIP, taken collectively, support the
attainment of the federal health standards. This is a requirement of the federal Clean Air Act. The
plan's air quality conformity assessment included (1) comparing forecasted mobile source emissions
to emissions ceilings (called “mobile emissions budgets”) for volatile organic compounds (VOC) and
nitrogen oxides (NOx) established in the air quality plans for the region; and (2) comparing
forecasted mobile source emissions of fine particulate matter (PM2.5) and precursor NOx (vehicle
emissions which lead to additional PM2.5 formulation) with base year 2002 levels to ensure such
emissions do not increase through time . The conformity analysis found that forecasts of mobile
emissions for VOC and NOx are within required budgets for the forecast years of 2016, 2017, 2025,
2030, and 2040. The analysis also found that forecasts of PM2.5 emissions are significantly lower
than base year 2002 levels.
CONGESTION MANAGEMENT PROCESS
In 2007, the TPB established a Congestion Management Process (CMP) which provides information
on transportation system performance, and to consider alternative strategies to alleviate congestion
and enhance the mobility of persons and goods. The CMP has four main components: 1)
Congestion monitoring of major highways; 2) Identification and analysis of strategies to alleviate
congestion; 3) Implementation of reasonable strategies and an assessment of their effectiveness
and 4) Integration of strategies into major roadway construction projects. With the CMP, the TPB
aims to use existing and future transportation facilities efficiently and effectively, reducing the need
for highway capacity increases for single-occupant vehicles (SOVs).
SYSTEMS PERFORMANCE, OPERATIONS, AND TECHNOLOGY
Intelligent Transportation Systems (ITS) are the application of current and evolving computer and
communications technology to transportation systems. The benefits seen from ITS have uncovered
another key aspect of transportation systems—management and operations (M&O) – maximizing the
2016 CLRP Amendment Documentation I 10
efficiency and effectiveness of the transportation system. To address these issues, the TPB has
a Systems Performance, Operations, and Technology subcommittee and MOITS Technical
Subcommittee. Related programs include the Metropolitan Area Transportation Operations
Coordination (MATOC) Program, the Regional Intelligent Transportation Systems (ITS)
Architecture and the Traffic Signals Subcommittee.
FREIGHT PLANNING
On July 20, 2016, the TPB approved the National Capital Region Freight Plan. It defines the role of
freight in the region, provides information on current and forecasted conditions, identifies regional
freight concerns such as safety and security, and includes a National Capital Region Freight Project
Database.
The TPB's Freight Subcommittee has been active since 2008. The Subcommittee meets regularly to
exchange information among stakeholders and provide advice to the TPB on regional freight
issues. The Subcommittee also conducts occasional site visits such as to the CSX Transportation rail
facilities in Washington. TPB staff maintains contact with the freight community via a monthly e-
newsletter, Focus on Freight. Additional outreach efforts include attending nearby MPO meetings,
freight-related association meetings, and maintaining a TPB Freight Program Web Site. TPB staff also
expanded the content of the freight planning portion of the CLRP web site.
SECURITY AND EMERGENCY PREPAREDNESS PLANNING
Transportation plays multifaceted roles in incidents and emergencies. The need for coordination
among transportation agencies during incidents having multi-jurisdictional or regional impacts
fostered creation of the Metropolitan Area Transportation Operations Coordination (MATOC) Program.
The MATOC Program aims to advise agencies as they respond to major incidents, through improved
technological data sharing systems, coordinated operating and notification procedures, and better
availability of transportation information for the public.
In declared emergencies and major disasters, transportation becomes one of a number of support
functions to a public safety agency-led response. Regionally, public safety and emergency
management planning are addressed under the auspices of the Metropolitan Washington Council of
Governments (COG) Board of Directors and its group of public safety programs and committees. The
COG Board is advised by the National Capital Region Emergency Preparedness Council on regional
preparedness planning matters, as well as by a number of specialized public safety committees in
the Homeland Security Program. The TPB and its programs maintain liaison with the COG programs,
and provide technical transportation expertise as necessary.
TRANSPORTATION SAFETY PLANNING
The Transportation Safety Element of the CLRP integrates the important topic of safety in the
planning process, including tracking safety funding in the TIP, sharing best practices, regional traffic
safety data compilation and sharing, participation in the State Highway Safety planning process, and
coordination of the metropolitan planning aspects of state, regional, and local safety efforts,
especially education and enforcement. A Transportation Safety Subcommittee of the TPB advises
staff on the Safety Element and Safety programs. The TPB conducts a yearly "Street Smart"
campaign to raise awareness and promote safer behavior among drivers, pedestrians and bicyclists.
2016 CLRP Amendment Documentation I 11
CONSULTATION AND MITIGATION DISCUSSION
The TPB consulted with natural resource, conservation, environmental protection and historic
preservation agencies regarding the development of the CLRP. These agencies provided comments
on the plan, contacts for future engagement and environmental GIS data. This regional data was
used to create maps of environmentally and/or culturally sensitive areas for comparison with the
CLRP. The CLRP also includes an environmental mitigation discussion which identifies potential
activities to moderate the environmental impacts of the long-range transportation plan.
TRANSPORTATION FOR PERSONS WITH DISABILITIES, LOW-INCOME INDIVIDUALS, AND OLDER ADULTS
To ensure on-going participation from low-income and minority communities, persons with
disabilities and those with limited English skills, the TPB created the Access for All (AFA) Advisory
Committee in 2001 to advise the Board on transportation issues, programs, policies, and services
that are important to these communities and individuals. Each year, the AFA comments on the Draft
CLRP. In addition, the Coordinated Human Service Transportation Plan for the National Capital
Region, updated in November 2014, identifies unmet transportation needs for people with
disabilities, low-income individuals and older adults. The Coordinated Plan guides the selection of
projects to be funded by the TPB’s Enhanced Mobility of Seniors and Individuals with Disabilities
Program. The TPB also has a Language Assistance Plan and follows the COG accommodations
policy to provide access to documents, meetings or any other planning activities to limited English
proficiency populations and those with disabilities.
TITLE VI OF THE CIVIL RIGHTS ACT OF 1964
The Metropolitan Washington Council of Governments (COG), as the administrative agent for the
TPB, adopted the "Title VI Plan To Ensure Nondiscrimination in all Programs and Activities" which
includes a policy statement, Title VI assurances and nondiscrimination complaint procedures. The
Title VI Plan describes how COG and the TPB meet a number of Title VI requirements As part of the
TPB’s activities to ensure nondiscrimination, an Environmental Justice analysis of the CLRP is
conducted to ensure that low-income and minority populations are not disproportionately and
adversely affected.
HUMAN SERVICE TRANSPORTATION COORDINATION
The TPB approved an Update to the Coordinated Human Service Transportation Plan for the National
Capital Region in November 2014. The preparation of the Coordinated Human Services
Transportation Plan was a coordinated process and is consistent with the CLRP. The Coordinated
Plan guides the implementation of the Federal Transit Administration’s (FTA’s) Section
5310 Enhanced Mobility of Seniors and Individuals with Disabilities Program. COG is the designated
recipient for this program for the Washington DC-VA-MD Urbanized Area. The previous Coordinated
Plan was used to guide funding for FTA’s Job Access and Reverse Commute and New Freedom
Programs.
PUBLIC PARTICIPATION
A Participation Plan has been developed that articulates the TPB’s commitment to a transparent
interface with the public and with relevant public agencies to support the regional transportation
planning process, including the development of the CLRP. The long-range plan had two public
2016 CLRP Amendment Documentation I 12
comment periods during its development; the first was held from February 10 to March 12, 2011 on
the projects to be included in the air quality conformity analysis, and the second was held from
October 13 to November 12, 2011 on the draft 2011 CLRP and the draft air quality conformity
determination.
The TPB has two standing citizen committees: The Citizens Advisory Committee (CAC), the main
standing body for providing citizen input into the deliberations of the TPB; and the Access for All (AFA)
Advisory Committee which provides input to the TPB on concerns of low-income individuals, minority
individuals and persons with disabilities.
OTHER REQUIREMENTS
Annual Listing of Projects
With the assistance of and in cooperation with the transportation implementing agencies in
the region, the TPB has prepared an annual listing of projects for which federal funds have
been obligated each year since 2001.
Metropolitan Planning Agreement
In the Washington Metropolitan region, the roles and responsibilities involving the TPB, the
three state DOTs, the local government transportation agencies, WMATA and the state and
local government public transportation operators for cooperatively carrying out transportation
planning and programming have been established over several years. As required under the
final planning regulations, the TPB, the state DOTs and the public transportation operators
have documented their transportation planning roles and responsibilities in the Washington
Metropolitan Region in a Memorandum of Understanding (MOU) that was executed by all
parties on January 16, 2008.
Certification Review
The Federal Highway Administration (FHWA) and the Federal Transit Administration (FTA)
conducted a joint review of the TPB's planning process during an on-site visit in October of
2014. The Federal team also met with the Citizens Advisory Committee and the Access for All
Advisory Committee to discuss public involvement. Under Federal Planning regulations FHWA
and FTA must review and certify that the TPB's planning process meets the requirements of
the Metropolitan Transportation Rule at 23 CFR Part 450 Subpart C and 49 CFR part 613
every four years. In a report released on May 14, 2015, FHWA and FTA determined that the
TPB met the planning requirements.
Cycle and Updates
The TPB updates both the CLRP nearly every year and the Transportation Improvement
Program (TIP) every two years. Typically, projects are submitted for inclusion in the air quality
conformity analysis of the CLRP in the winter or spring, are released for public comment, and
then are approved by the TPB for air quality conformity testing. A travel demand and
emissions analysis is conducted, and then the Draft CLRP, TIP and air quality conformity
analysis are released for another public comment period in late summer or fall, after which
time the TPB is asked to approve the three documents.
2016 CLRP Amendment Documentation I 13
Unified Planning Work Program (UPWP)
Each year, the TPB adopts a Unified Planning Work Program that incorporates all federally-
assisted state, regional and local transportation planning activities proposed to be
undertaken in one document. The UPWP describes all work activities utilizing federal funding
and details the tasks and budgets that will be accomplished each year to meet the federal
planning requirements, such as preparing the TIP and updating the CLRP.
Regional Planning Activities
Development of the CLRP was also influenced by numerous regional planning activities carried out
by the TPB, mainly through more than a dozen committees and subcommittees. These planning
activities have led to the inclusion of specific new programs and projects in the plan, and indirectly
inform the plan development process by identifying critical transportation issues or needs facing the
region.
Airport Access
Air Quality Planning
Bicycle & Pedestrian Planning
Bus Planning
Climate Change
Congestion Management and Operations
Environmental Consultation
Freight Planning
Human Services Transportation Coordination
Transportation & Land-Use Coordination
Transportation Safety
Emergency Preparedness & Transportation Security
Transportation Demand Management
Scenario Planning
Get more detailed information on the Regional Planning Activities that influence the development of
the CLRP at www.mwcog.org/clrp/elements.
Public Involvement
Several public involvement avenues provided opportunities for the public to influence the
development of the CLRP. These included two formal comment periods during the annual
amendment process and feedback from two citizen-led advisory committees.
COMMENT PERIODS
During the 2016 CLRP amendment process, the TPB held two 30-day comment periods during which
the public and any TPB member or stakeholder could submit comments on the amendment process
via online submission form, email, phone, mail, or in-person at the beginning of the monthly TPB
meeting.
2016 CLRP Amendment Documentation I 14
Comment Period on Proposed Additions and Changes (February 11 – March 12, 2016)
During the first comment period, the TPB invited comment on the new projects and changes
to existing projects that agencies had submitted for inclusion in the CLRP. The comment
period took place before the projects were included in the federally required Air Quality
Conformity Analysis.
Comment Period on Draft CLRP and Results of Analysis (October 13 – November 12, 2016)
During the second comment period, the TPB invited comment on the draft CLRP, the results
of the federally required Air Quality Conformity Analysis, and any of the other analyses of the
plan, including the Performance Analysis.
CITIZEN-LED ADVISORY COMMITTEES
During the amendment process, the TPB was advised by two citizen-led advisory committees: The
Citizens Advisory Committee (CAC) and the Access for All Advisory Committee (AFA). Both reviewed
project submissions, made recommendations for ways that new projects and programs submitted for
inclusion in the CLRP could better address the needs of the region’s residents, and submitted
comments on other issues and needs that might affect decisions regarding the CLRP update.
LOCAL PROJECT DEVELOPMENT PROCESS
Effective public input also occurs during the local project development process, when ideas for
future improvements that might one day be included in the CLRP are first being conceived and
refined. Local public meetings, hearings, and comment periods are all opportunities to help shape
regionally significant projects that might eventually be included in the plan.
The TPB’s online Transportation Planning Information Hub (www.transportationplanninghub.org)
provides more information about local and state decision-making processes that feed the annual
CLRP update process, including opportunities to get involved at the local and state levels.
2016 CLRP Amendment Documentation I 15
POPULATION AND JOB GROWTH FORECASTS
The 2016 CLRP Amendment includes forecasts of how many people and jobs are expected in the
region in coming decades and where those people and jobs are expected to locate. These forecasts
allow regional planners to analyze future travel patterns and air quality impacts under the CLRP.
Cooperative Land-Use Forecasting Process
The Cooperative Forecasting Program, established in 1975 and administered by the Council of
Governments, enables local, regional, and federal agencies to coordinate planning decisions using
common assumptions about future growth and development in the region.
The Cooperative Forecast is a multi-stage, “top-down/bottom-up” process undertaken by COG’s
Planning Directors Technical Advisory Committee and the Cooperative Forecasting and Data
Subcommittee. It employs a regional econometric model and local jurisdictional forecasts. The
model projects employment, population, and households for the metropolitan Washington region
based on national economic trends and local demographic factors. Concurrently, local jurisdictions
develop independent projections of population, households, and employment based on pipeline
development, market conditions, planned transportation improvements, and adopted land use plans
and zoning, taking into account the preliminary regional projections. The forecasts are presented and
approved by the Planning Directors Technical Advisory Committee (PDTAC) and the COG Board of
Directors.
Latest Regional Growth Forecasts
Analysis conducted as part of the 2016 CLRP Amendment used Round 9.0 of the Cooperative
Forecasts, as adopted by the COG Board in November 2016. These forecasts are updated on a
regular basis through the Cooperative Land-Use Forecasting Program at COG which combines
regional data (based upon national economic trends and regional demographics) with local
projections of population, households and employment.
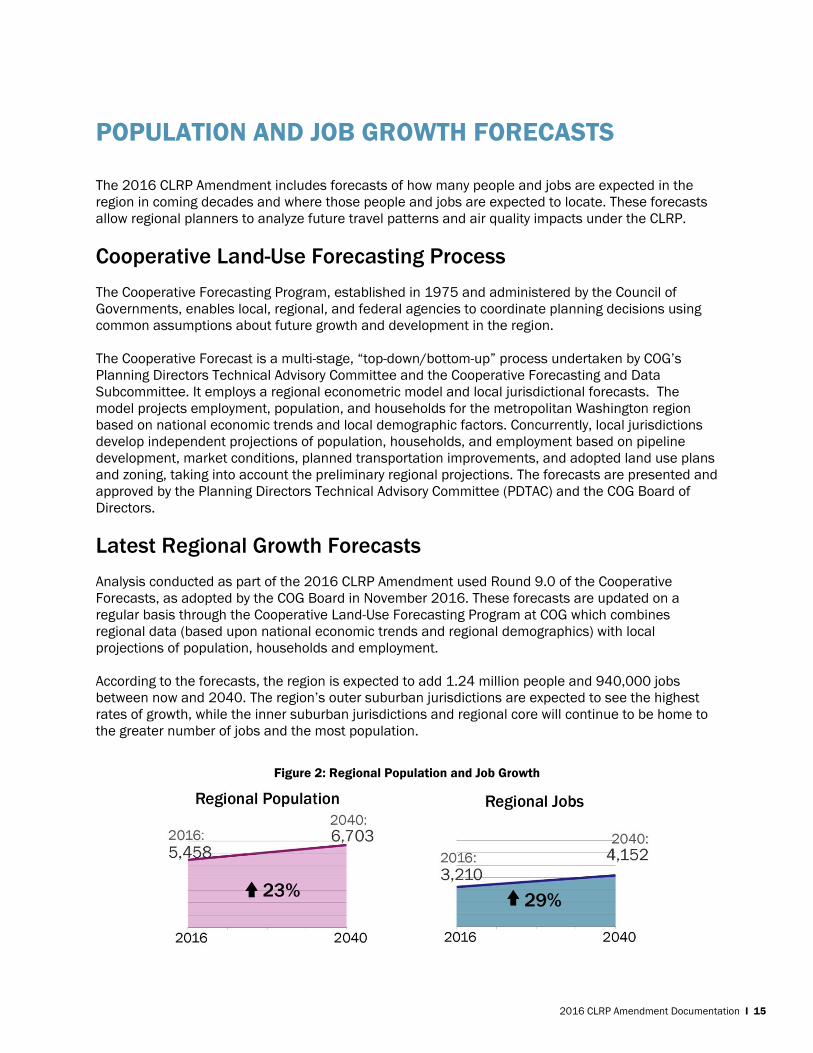
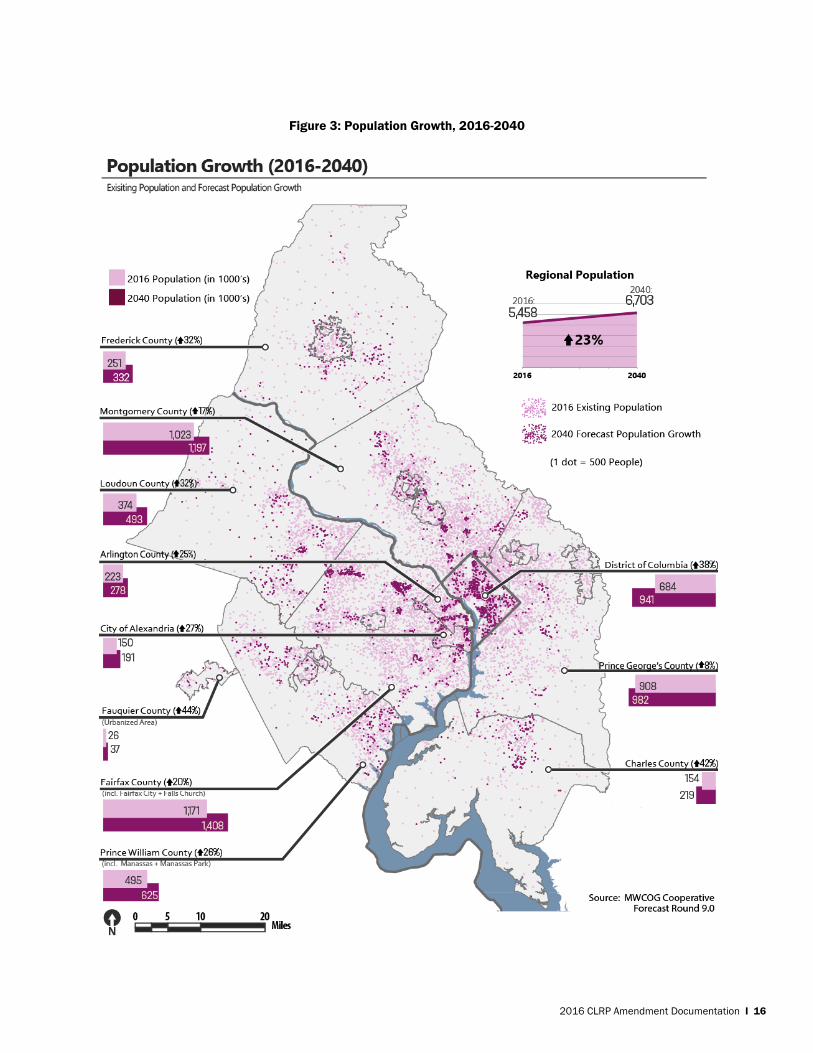
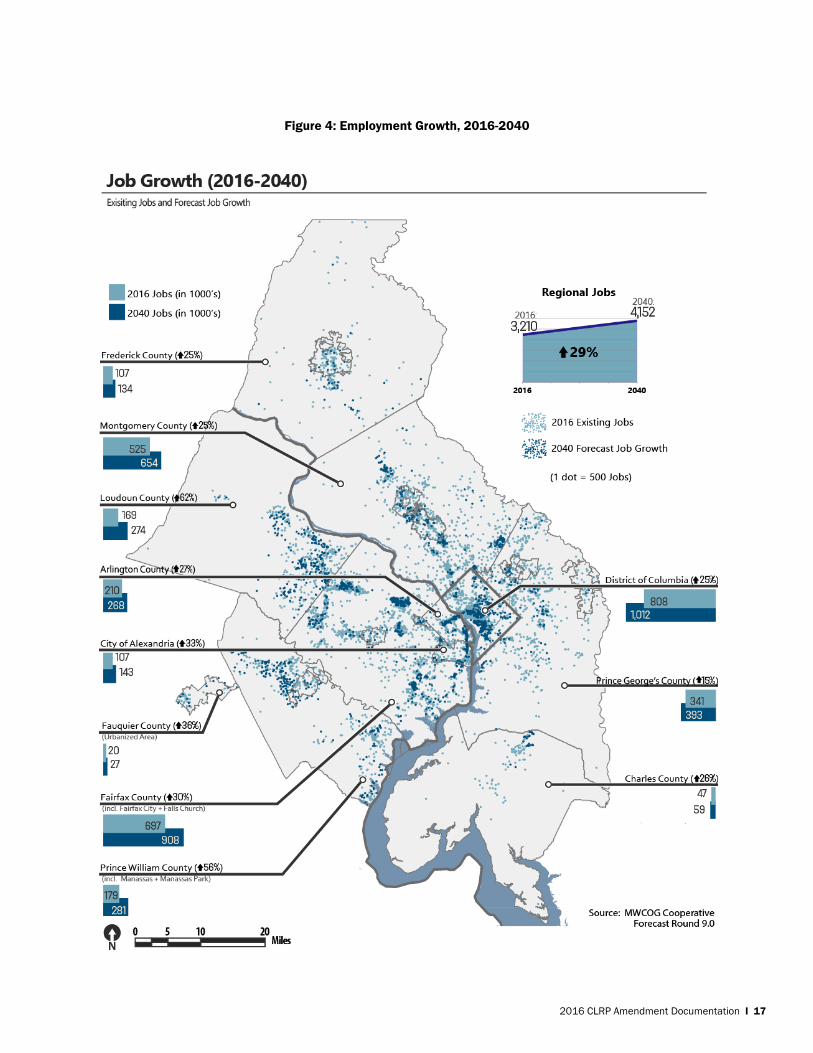
According to the forecasts, the region is expected to add 1.24 million people and 940,000 jobs
between now and 2040. The region’s outer suburban jurisdictions are expected to see the highest
rates of growth, while the inner suburban jurisdictions and regional core will continue to be home to
the greater number of jobs and the most population.
Figure 2: Regional Population and Job Growth
2016 CLRP Amendment Documentation I 16
Figure 3: Population Growth, 2016-2040
2016 CLRP Amendment Documentation I 17
Figure 4: Employment Growth, 2016-2040
2016 CLRP Amendment Documentation I 18
PROJECTS AND PROGRAMS
The CLRP identifies all the regionally significant capital improvements to the region’s highway and
transit systems that area transportation agencies expect to make and to be able to afford through
2040. It also outlines all anticipated spending on operations and maintenance of the current and
future transportation system over the same timeframe. Any project that might affect future air quality
by adding or removing highway or transit capacity must be included in the plan.
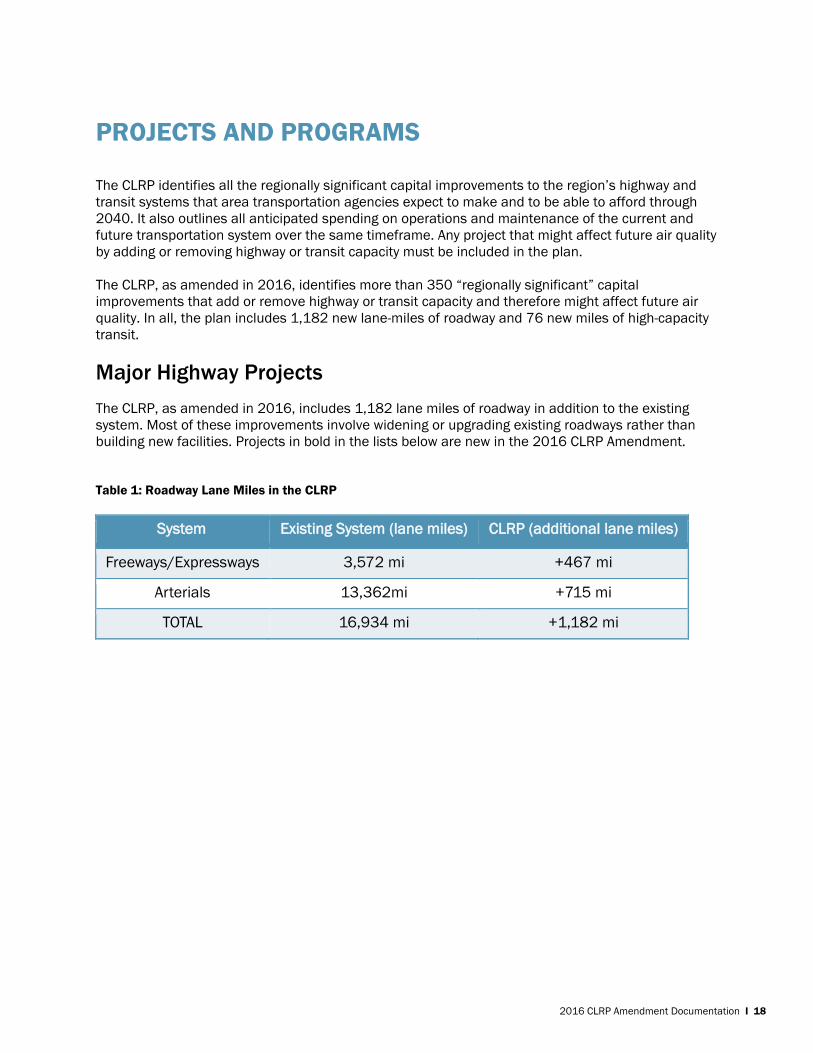
The CLRP, as amended in 2016, identifies more than 350 “regionally significant” capital
improvements that add or remove highway or transit capacity and therefore might affect future air
quality. In all, the plan includes 1,182 new lane-miles of roadway and 76 new miles of high-capacity
transit.
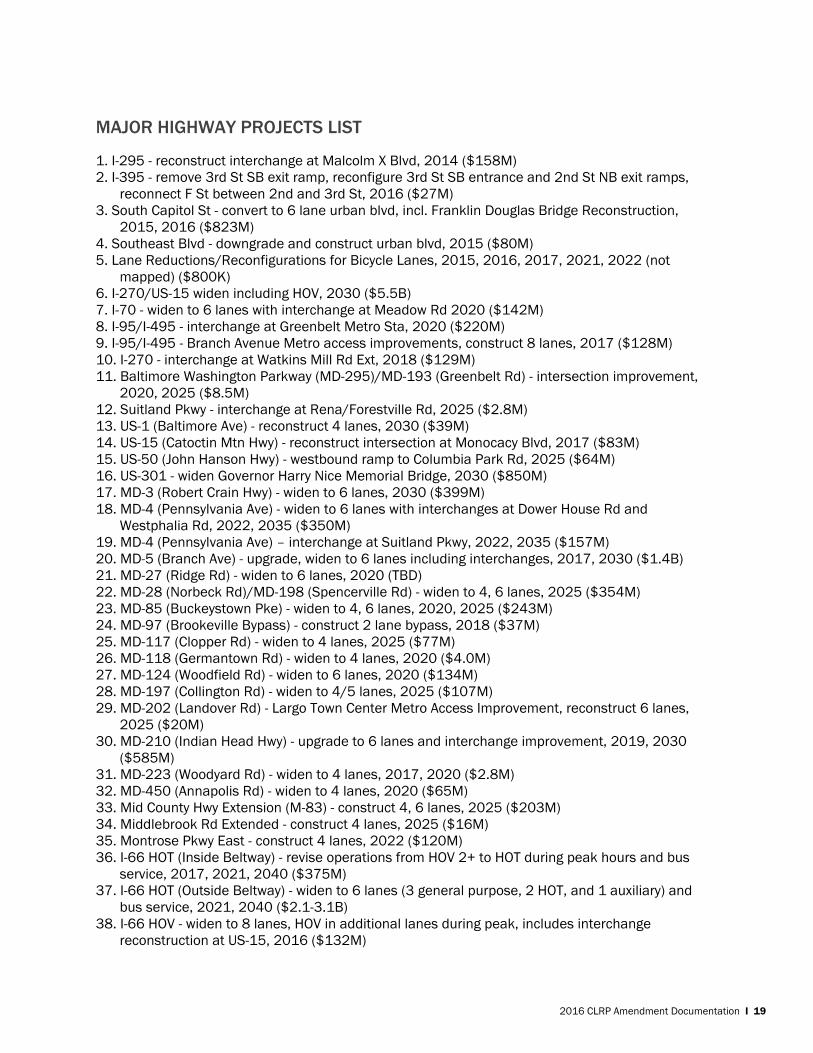
Major Highway Projects
The CLRP, as amended in 2016, includes 1,182 lane miles of roadway in addition to the existing
system. Most of these improvements involve widening or upgrading existing roadways rather than
building new facilities. Projects in bold in the lists below are new in the 2016 CLRP Amendment.
Table 1: Roadway Lane Miles in the CLRP
System Existing System (lane miles) CLRP (additional lane miles)
Freeways/Expressways 3,572 mi +467 mi
Arterials 13,362mi +715 mi
TOTAL 16,934 mi +1,182 mi
2016 CLRP Amendment Documentation I 19
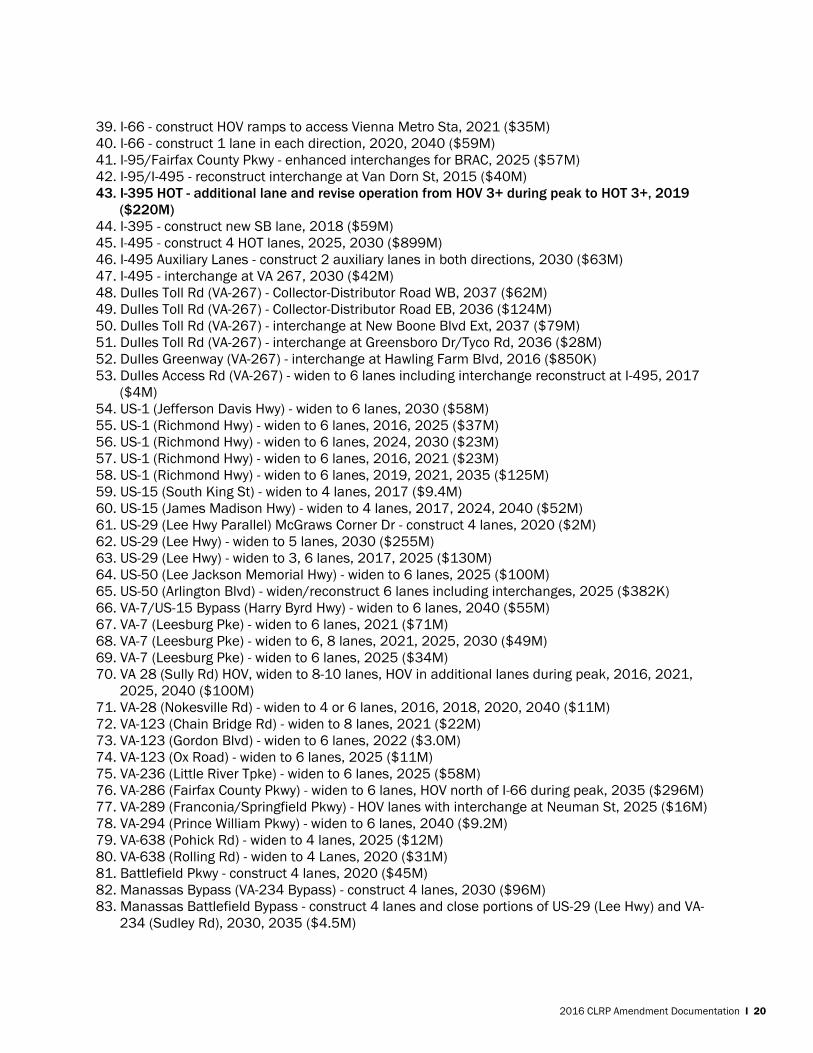
MAJOR HIGHWAY PROJECTS LIST
1. I-295 - reconstruct interchange at Malcolm X Blvd, 2014 ($158M)
2. I-395 - remove 3rd St SB exit ramp, reconfigure 3rd St SB entrance and 2nd St NB exit ramps,
reconnect F St between 2nd and 3rd St, 2016 ($27M)
3. South Capitol St - convert to 6 lane urban blvd, incl. Franklin Douglas Bridge Reconstruction,
2015, 2016 ($823M)
4. Southeast Blvd - downgrade and construct urban blvd, 2015 ($80M)
5. Lane Reductions/Reconfigurations for Bicycle Lanes, 2015, 2016, 2017, 2021, 2022 (not
mapped) ($800K)
6. I-270/US-15 widen including HOV, 2030 ($5.5B)
7. I-70 - widen to 6 lanes with interchange at Meadow Rd 2020 ($142M)
8. I-95/I-495 - interchange at Greenbelt Metro Sta, 2020 ($220M)
9. I-95/I-495 - Branch Avenue Metro access improvements, construct 8 lanes, 2017 ($128M)
10. I-270 - interchange at Watkins Mill Rd Ext, 2018 ($129M)
11. Baltimore Washington Parkway (MD-295)/MD-193 (Greenbelt Rd) - intersection improvement,
2020, 2025 ($8.5M)
12. Suitland Pkwy - interchange at Rena/Forestville Rd, 2025 ($2.8M)
13. US-1 (Baltimore Ave) - reconstruct 4 lanes, 2030 ($39M)
14. US-15 (Catoctin Mtn Hwy) - reconstruct intersection at Monocacy Blvd, 2017 ($83M)
15. US-50 (John Hanson Hwy) - westbound ramp to Columbia Park Rd, 2025 ($64M)
16. US-301 - widen Governor Harry Nice Memorial Bridge, 2030 ($850M)
17. MD-3 (Robert Crain Hwy) - widen to 6 lanes, 2030 ($399M)
18. MD-4 (Pennsylvania Ave) - widen to 6 lanes with interchanges at Dower House Rd and
Westphalia Rd, 2022, 2035 ($350M)
19. MD-4 (Pennsylvania Ave) – interchange at Suitland Pkwy, 2022, 2035 ($157M)
20. MD-5 (Branch Ave) - upgrade, widen to 6 lanes including interchanges, 2017, 2030 ($1.4B)
21. MD-27 (Ridge Rd) - widen to 6 lanes, 2020 (TBD)
22. MD-28 (Norbeck Rd)/MD-198 (Spencerville Rd) - widen to 4, 6 lanes, 2025 ($354M)
23. MD-85 (Buckeystown Pke) - widen to 4, 6 lanes, 2020, 2025 ($243M)
24. MD-97 (Brookeville Bypass) - construct 2 lane bypass, 2018 ($37M)
25. MD-117 (Clopper Rd) - widen to 4 lanes, 2025 ($77M)
26. MD-118 (Germantown Rd) - widen to 4 lanes, 2020 ($4.0M)
27. MD-124 (Woodfield Rd) - widen to 6 lanes, 2020 ($134M)
28. MD-197 (Collington Rd) - widen to 4/5 lanes, 2025 ($107M)
29. MD-202 (Landover Rd) - Largo Town Center Metro Access Improvement, reconstruct 6 lanes,
2025 ($20M)
30. MD-210 (Indian Head Hwy) - upgrade to 6 lanes and interchange improvement, 2019, 2030
($585M)
31. MD-223 (Woodyard Rd) - widen to 4 lanes, 2017, 2020 ($2.8M)
32. MD-450 (Annapolis Rd) - widen to 4 lanes, 2020 ($65M)
33. Mid County Hwy Extension (M-83) - construct 4, 6 lanes, 2025 ($203M)
34. Middlebrook Rd Extended - construct 4 lanes, 2025 ($16M)
35. Montrose Pkwy East - construct 4 lanes, 2022 ($120M)
36. I-66 HOT (Inside Beltway) - revise operations from HOV 2+ to HOT during peak hours and bus
service, 2017, 2021, 2040 ($375M)
37. I-66 HOT (Outside Beltway) - widen to 6 lanes (3 general purpose, 2 HOT, and 1 auxiliary) and
bus service, 2021, 2040 ($2.1-3.1B)
38. I-66 HOV - widen to 8 lanes, HOV in additional lanes during peak, includes interchange
reconstruction at US-15, 2016 ($132M)
2016 CLRP Amendment Documentation I 20
39. I-66 - construct HOV ramps to access Vienna Metro Sta, 2021 ($35M)
40. I-66 - construct 1 lane in each direction, 2020, 2040 ($59M)
41. I-95/Fairfax County Pkwy - enhanced interchanges for BRAC, 2025 ($57M)
42. I-95/I-495 - reconstruct interchange at Van Dorn St, 2015 ($40M)
43. I-395 HOT - additional lane and revise operation from HOV 3+ during peak to HOT 3+, 2019
($220M)
44. I-395 - construct new SB lane, 2018 ($59M)
45. I-495 - construct 4 HOT lanes, 2025, 2030 ($899M)
46. I-495 Auxiliary Lanes - construct 2 auxiliary lanes in both directions, 2030 ($63M)
47. I-495 - interchange at VA 267, 2030 ($42M)
48. Dulles Toll Rd (VA-267) - Collector-Distributor Road WB, 2037 ($62M)
49. Dulles Toll Rd (VA-267) - Collector-Distributor Road EB, 2036 ($124M)
50. Dulles Toll Rd (VA-267) - interchange at New Boone Blvd Ext, 2037 ($79M)
51. Dulles Toll Rd (VA-267) - interchange at Greensboro Dr/Tyco Rd, 2036 ($28M)
52. Dulles Greenway (VA-267) - interchange at Hawling Farm Blvd, 2016 ($850K)
53. Dulles Access Rd (VA-267) - widen to 6 lanes including interchange reconstruct at I-495, 2017
($4M)
54. US-1 (Jefferson Davis Hwy) - widen to 6 lanes, 2030 ($58M)
55. US-1 (Richmond Hwy) - widen to 6 lanes, 2016, 2025 ($37M)
56. US-1 (Richmond Hwy) - widen to 6 lanes, 2024, 2030 ($23M)
57. US-1 (Richmond Hwy) - widen to 6 lanes, 2016, 2021 ($23M)
58. US-1 (Richmond Hwy) - widen to 6 lanes, 2019, 2021, 2035 ($125M)
59. US-15 (South King St) - widen to 4 lanes, 2017 ($9.4M)
60. US-15 (James Madison Hwy) - widen to 4 lanes, 2017, 2024, 2040 ($52M)
61. US-29 (Lee Hwy Parallel) McGraws Corner Dr - construct 4 lanes, 2020 ($2M)
62. US-29 (Lee Hwy) - widen to 5 lanes, 2030 ($255M)
63. US-29 (Lee Hwy) - widen to 3, 6 lanes, 2017, 2025 ($130M)
64. US-50 (Lee Jackson Memorial Hwy) - widen to 6 lanes, 2025 ($100M)
65. US-50 (Arlington Blvd) - widen/reconstruct 6 lanes including interchanges, 2025 ($382K)
66. VA-7/US-15 Bypass (Harry Byrd Hwy) - widen to 6 lanes, 2040 ($55M)
67. VA-7 (Leesburg Pke) - widen to 6 lanes, 2021 ($71M)
68. VA-7 (Leesburg Pke) - widen to 6, 8 lanes, 2021, 2025, 2030 ($49M)
69. VA-7 (Leesburg Pke) - widen to 6 lanes, 2025 ($34M)
70. VA 28 (Sully Rd) HOV, widen to 8-10 lanes, HOV in additional lanes during peak, 2016, 2021,
2025, 2040 ($100M)
71. VA-28 (Nokesville Rd) - widen to 4 or 6 lanes, 2016, 2018, 2020, 2040 ($11M)
72. VA-123 (Chain Bridge Rd) - widen to 8 lanes, 2021 ($22M)
73. VA-123 (Gordon Blvd) - widen to 6 lanes, 2022 ($3.0M)
74. VA-123 (Ox Road) - widen to 6 lanes, 2025 ($11M)
75. VA-236 (Little River Tpke) - widen to 6 lanes, 2025 ($58M)
76. VA-286 (Fairfax County Pkwy) - widen to 6 lanes, HOV north of I-66 during peak, 2035 ($296M)
77. VA-289 (Franconia/Springfield Pkwy) - HOV lanes with interchange at Neuman St, 2025 ($16M)
78. VA-294 (Prince William Pkwy) - widen to 6 lanes, 2040 ($9.2M)
79. VA-638 (Pohick Rd) - widen to 4 lanes, 2025 ($12M)
80. VA-638 (Rolling Rd) - widen to 4 Lanes, 2020 ($31M)
81. Battlefield Pkwy - construct 4 lanes, 2020 ($45M)
82. Manassas Bypass (VA-234 Bypass) - construct 4 lanes, 2030 ($96M)
83. Manassas Battlefield Bypass - construct 4 lanes and close portions of US-29 (Lee Hwy) and VA-
234 (Sudley Rd), 2030, 2035 ($4.5M)
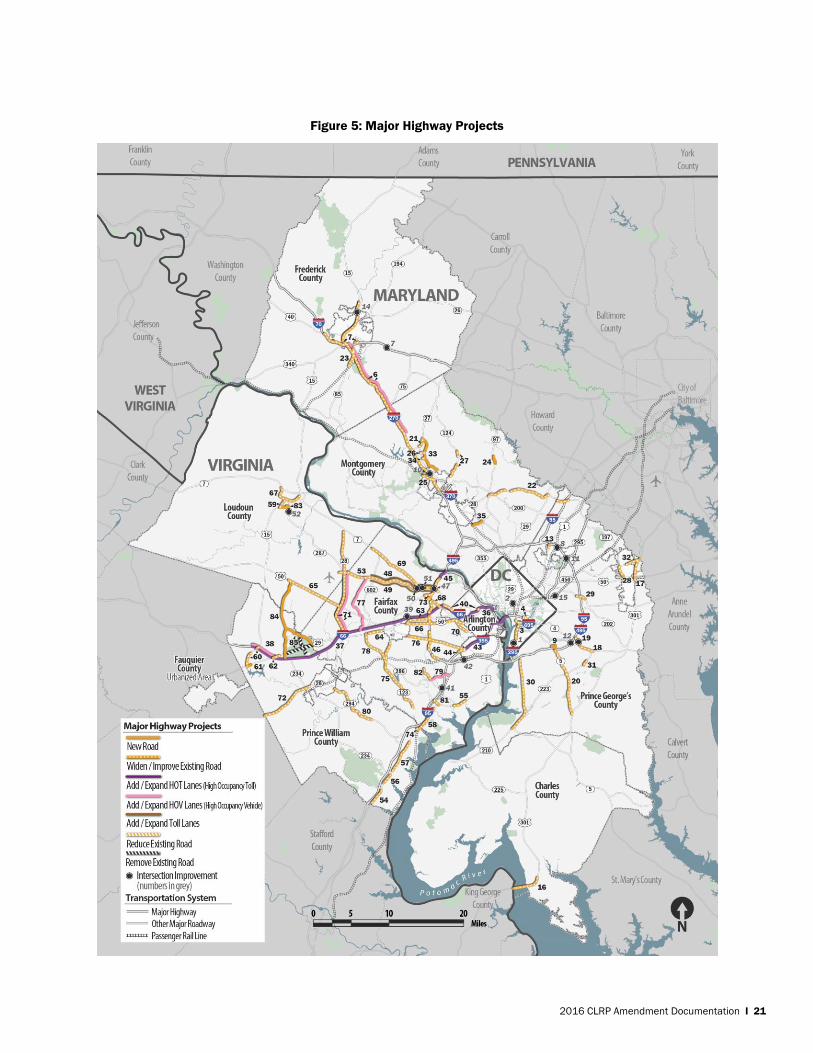
2016 CLRP Amendment Documentation I 21
Figure 5: Major Highway Projects
2016 CLRP Amendment Documentation I 22
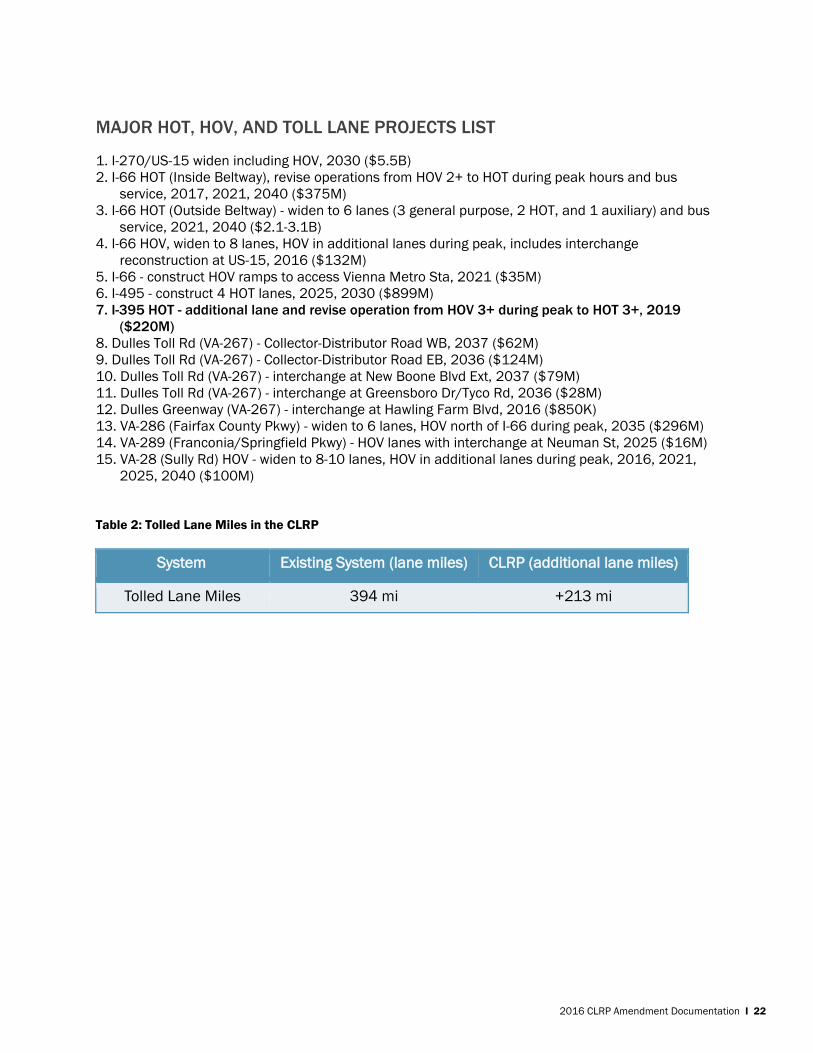
MAJOR HOT, HOV, AND TOLL LANE PROJECTS LIST
1. I-270/US-15 widen including HOV, 2030 ($5.5B)
2. I-66 HOT (Inside Beltway), revise operations from HOV 2+ to HOT during peak hours and bus
service, 2017, 2021, 2040 ($375M)
3. I-66 HOT (Outside Beltway) - widen to 6 lanes (3 general purpose, 2 HOT, and 1 auxiliary) and bus
service, 2021, 2040 ($2.1-3.1B)
4. I-66 HOV, widen to 8 lanes, HOV in additional lanes during peak, includes interchange
reconstruction at US-15, 2016 ($132M)
5. I-66 - construct HOV ramps to access Vienna Metro Sta, 2021 ($35M)
6. I-495 - construct 4 HOT lanes, 2025, 2030 ($899M)
7. I-395 HOT - additional lane and revise operation from HOV 3+ during peak to HOT 3+, 2019
($220M)
8. Dulles Toll Rd (VA-267) - Collector-Distributor Road WB, 2037 ($62M)
9. Dulles Toll Rd (VA-267) - Collector-Distributor Road EB, 2036 ($124M)
10. Dulles Toll Rd (VA-267) - interchange at New Boone Blvd Ext, 2037 ($79M)
11. Dulles Toll Rd (VA-267) - interchange at Greensboro Dr/Tyco Rd, 2036 ($28M)
12. Dulles Greenway (VA-267) - interchange at Hawling Farm Blvd, 2016 ($850K)
13. VA-286 (Fairfax County Pkwy) - widen to 6 lanes, HOV north of I-66 during peak, 2035 ($296M)
14. VA-289 (Franconia/Springfield Pkwy) - HOV lanes with interchange at Neuman St, 2025 ($16M)
15. VA-28 (Sully Rd) HOV - widen to 8-10 lanes, HOV in additional lanes during peak, 2016, 2021,
2025, 2040 ($100M)
Table 2: Tolled Lane Miles in the CLRP
System Existing System (lane miles) CLRP (additional lane miles)
Tolled Lane Miles 394 mi +213 mi

2016 CLRP Amendment Documentation I 23
Figure 6: Major HOT, HOV, and Toll Lane Projects
2016 CLRP Amendment Documentation I 24
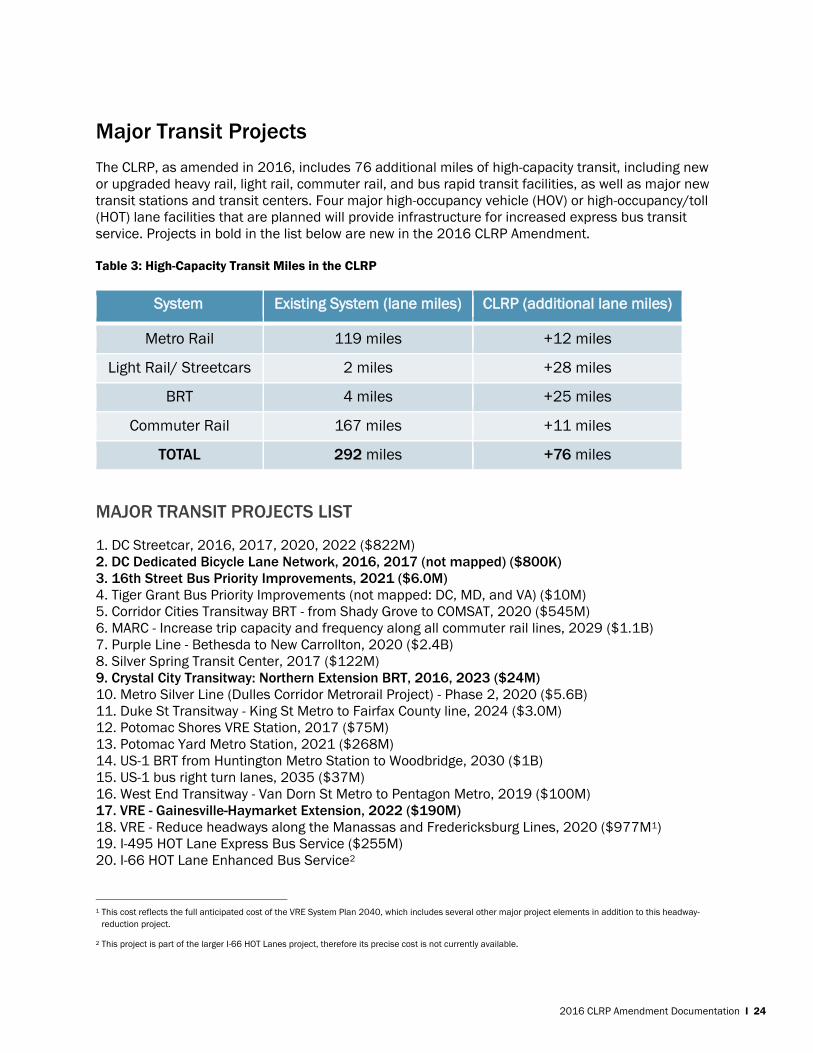
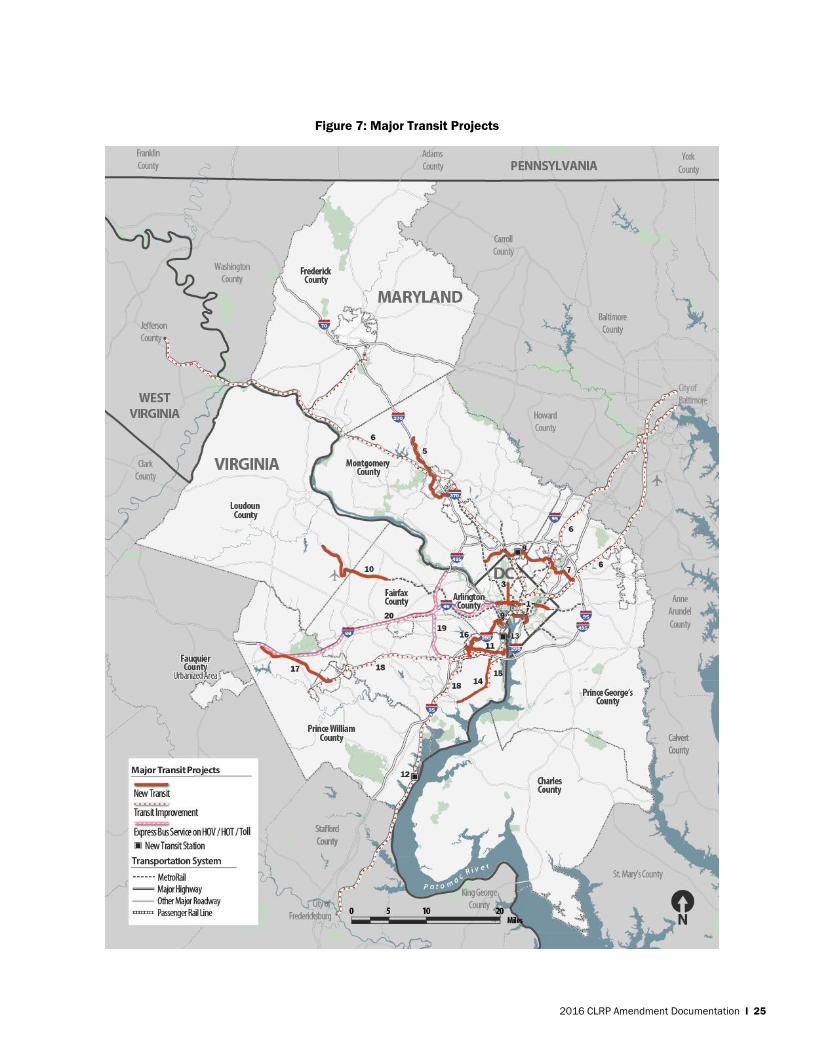
Major Transit Projects
The CLRP, as amended in 2016, includes 76 additional miles of high-capacity transit, including new
or upgraded heavy rail, light rail, commuter rail, and bus rapid transit facilities, as well as major new
transit stations and transit centers. Four major high-occupancy vehicle (HOV) or high-occupancy/toll
(HOT) lane facilities that are planned will provide infrastructure for increased express bus transit
service. Projects in bold in the list below are new in the 2016 CLRP Amendment.
Table 3: High-Capacity Transit Miles in the CLRP
System Existing System (lane miles) CLRP (additional lane miles)
Metro Rail 119 miles +12 miles
Light Rail/ Streetcars 2 miles +28 miles
BRT 4 miles +25 miles
Commuter Rail 167 miles +11 miles
TOTAL 292 miles +76 miles
MAJOR TRANSIT PROJECTS LIST
1. DC Streetcar, 2016, 2017, 2020, 2022 ($822M)
2. DC Dedicated Bicycle Lane Network, 2016, 2017 (not mapped) ($800K)
3. 16th Street Bus Priority Improvements, 2021 ($6.0M)
4. Tiger Grant Bus Priority Improvements (not mapped: DC, MD, and VA) ($10M)
5. Corridor Cities Transitway BRT - from Shady Grove to COMSAT, 2020 ($545M)
6. MARC - Increase trip capacity and frequency along all commuter rail lines, 2029 ($1.1B)
7. Purple Line - Bethesda to New Carrollton, 2020 ($2.4B)
8. Silver Spring Transit Center, 2017 ($122M)
9. Crystal City Transitway: Northern Extension BRT, 2016, 2023 ($24M)
10. Metro Silver Line (Dulles Corridor Metrorail Project) - Phase 2, 2020 ($5.6B)
11. Duke St Transitway - King St Metro to Fairfax County line, 2024 ($3.0M)
12. Potomac Shores VRE Station, 2017 ($75M)
13. Potomac Yard Metro Station, 2021 ($268M)
14. US-1 BRT from Huntington Metro Station to Woodbridge, 2030 ($1B)
15. US-1 bus right turn lanes, 2035 ($37M)
16. West End Transitway - Van Dorn St Metro to Pentagon Metro, 2019 ($100M)
17. VRE - Gainesville-Haymarket Extension, 2022 ($190M)
18. VRE - Reduce headways along the Manassas and Fredericksburg Lines, 2020 ($977M1)
19. I-495 HOT Lane Express Bus Service ($255M)
20. I-66 HOT Lane Enhanced Bus Service2
1 This cost reflects the full anticipated cost of the VRE System Plan 2040, which includes several other major project elements in addition to this headway-
reduction project.
2 This project is part of the larger I-66 HOT Lanes project, therefore its precise cost is not currently available.
2016 CLRP Amendment Documentation I 25
Figure 7: Major Transit Projects
2016 CLRP Amendment Documentation I 26
New Projects and Significant Changes
In all, there were nine new and changed “major” projects in the 2016 CLRP Amendment. For the
purposes of this documentation, “major” projects are defined as those which directly affect
interstates, major arterials, and expressways or freeways with at-grade intersections, as well as
dedicated transit facilities.
REGIONAL POLICY FRAMEWORK FOR DEVELOPMENT OF THE 2016 CLRP AMENDMENT
In December 2015, the TPB released the Call for Projects for the 2016 Amendment to the CLRP and
the FY 2017-2022 TIP. After a 30-day public comment period, the project submissions from each
agency were approved by the TPB for inclusion in the Air Quality Conformity Analysis on March 16,
2016.
The Call for Projects document listed the region’s “greatest needs” for transportation reflecting the
TPB’s policy framework as defined in the Vision and the Regional Transportation Priorities Plan. The Call
for Projects encouraged agencies to consider regional goals, priorities and needs as they developed
and selected projects to submit for inclusion in the 2016 Amendment.
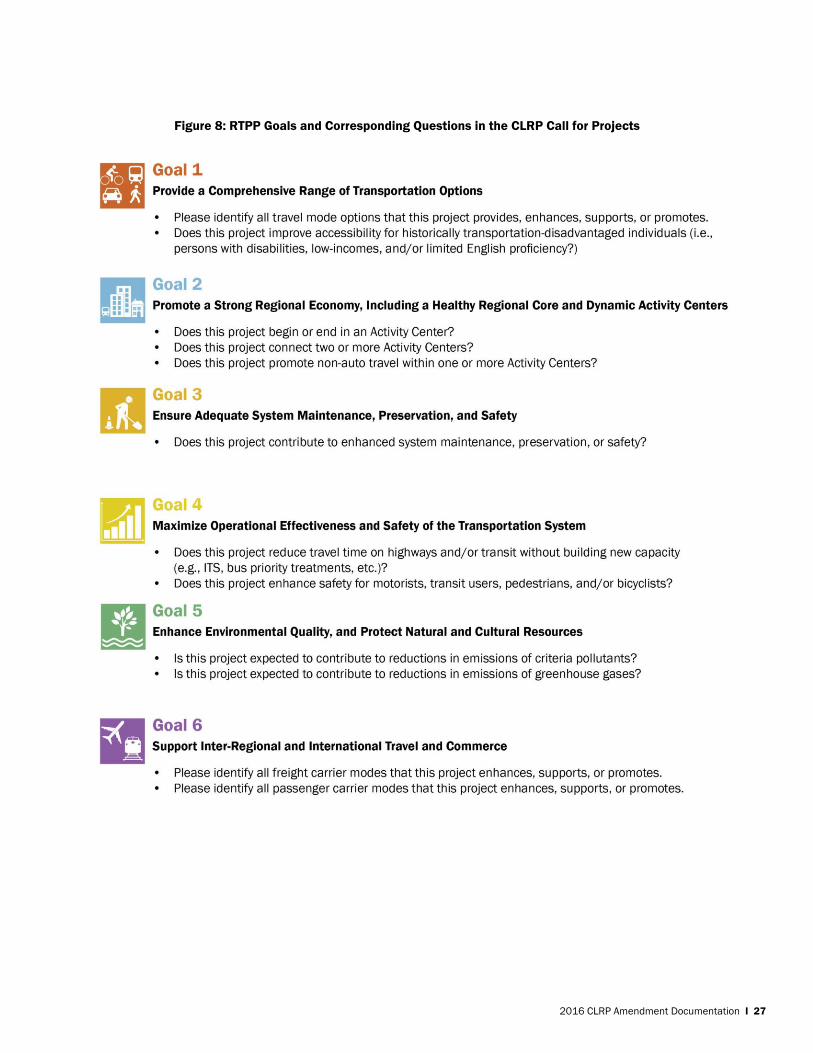
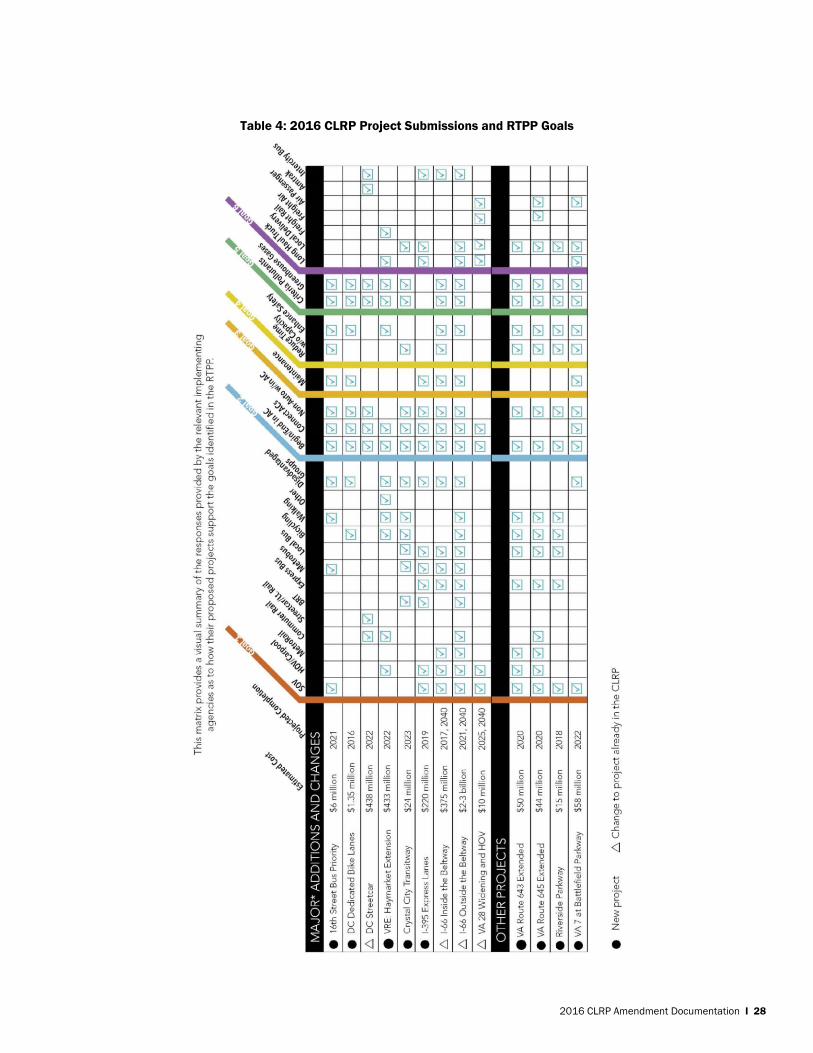
The CLRP project description form asked agencies to answer a series of questions on how new projects
support the goals laid out in the Regional Transportation Priorities Plan. The six RTPP goals are described
in Figure 8. The responses provided by the submitting agencies for all new projects submitted for this
year’s CLRP amendment have been summarized in Table 4.
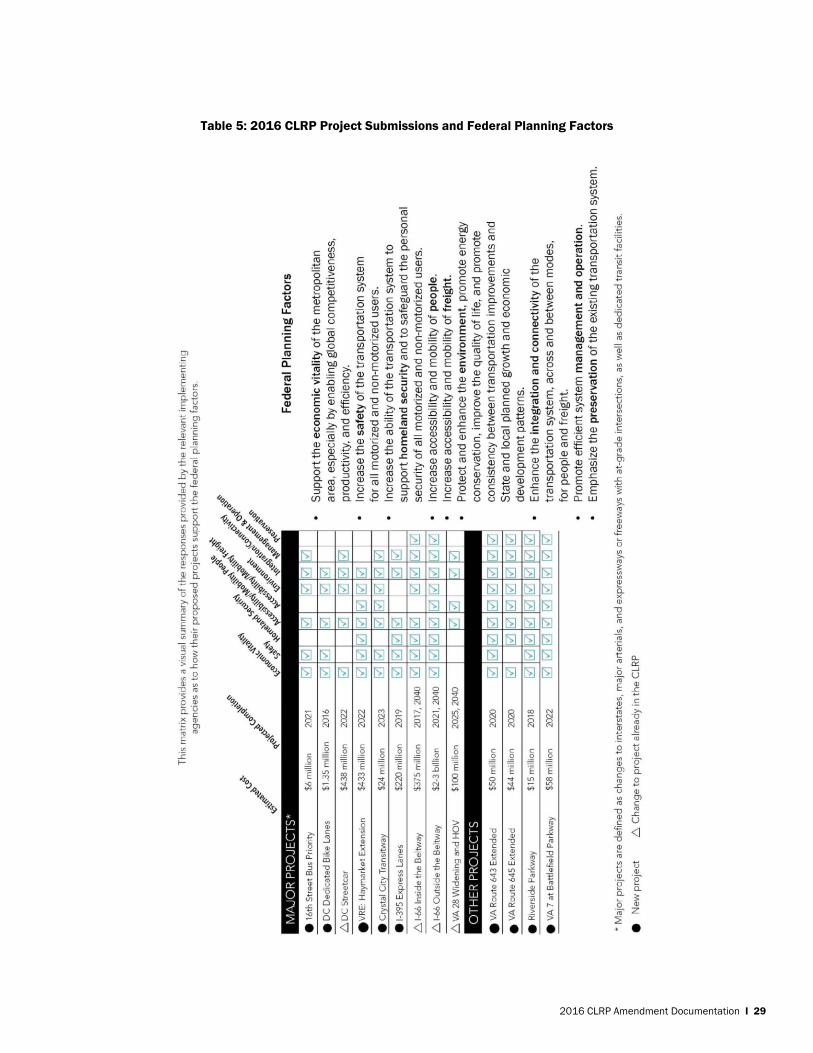
In addition, submitting agencies were asked to identify how new projects support the federal planning
factors prescribed under MAP-21. The responses to those questions are summarized in Table 5.
2016 CLRP Amendment Documentation I 27
Figure 8: RTPP Goals and Corresponding Questions in the CLRP Call for Projects
2016 CLRP Amendment Documentation I 28
Table 4: 2016 CLRP Project Submissions and RTPP Goals
2016 CLRP Amendment Documentation I 29
Table 5: 2016 CLRP Project Submissions and Federal Planning Factors
2016 CLRP Amendment Documentation I 30
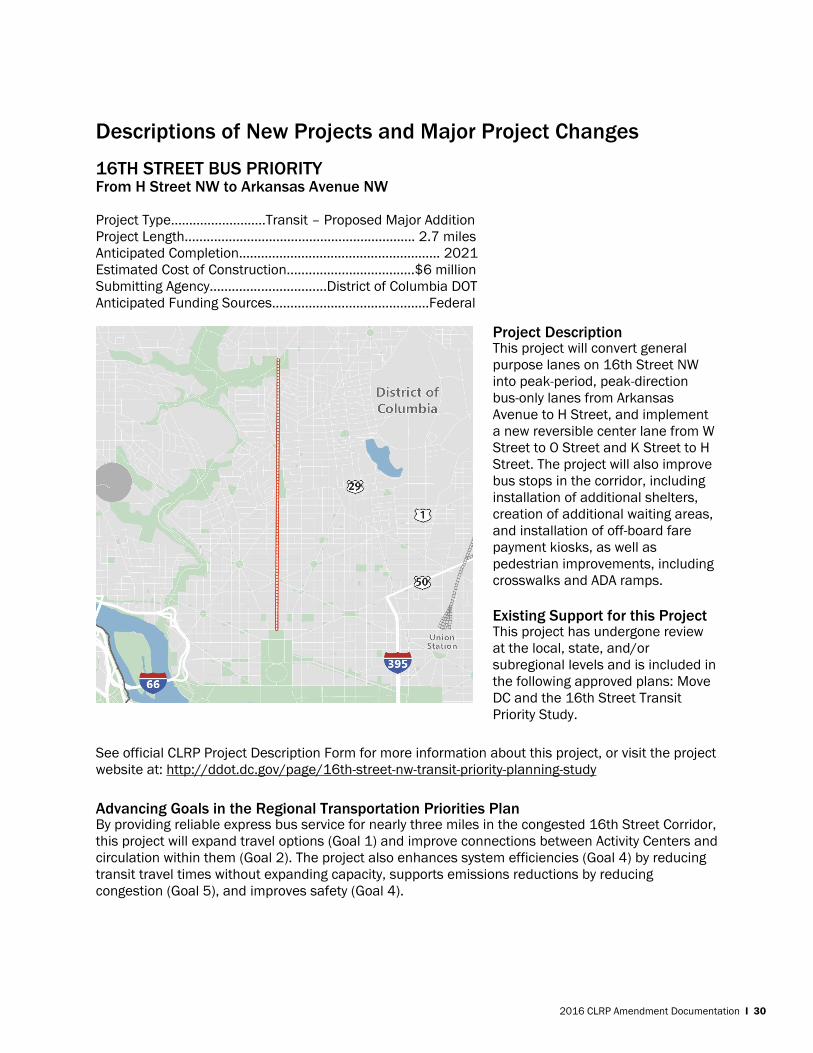
Descriptions of New Projects and Major Project Changes 16TH STREET BUS PRIORITY From H Street NW to Arkansas Avenue NW Project Type…….............…….Transit – Proposed Major Addition
Project Length............................................................... 2.7 miles
Anticipated Completion....................................................... 2021
Estimated Cost of Construction...................................$6 million
Submitting Agency................................District of Columbia DOT
Anticipated Funding Sources...........................................Federal
See official CLRP Project Description Form for more information about this project, or visit the project
website at: http://ddot.dc.gov/page/16th-street-nw-transit-priority-planning-study
Advancing Goals in the Regional Transportation Priorities Plan By providing reliable express bus service for nearly three miles in the congested 16th Street Corridor,
this project will expand travel options (Goal 1) and improve connections between Activity Centers and
circulation within them (Goal 2). The project also enhances system efficiencies (Goal 4) by reducing
transit travel times without expanding capacity, supports emissions reductions by reducing
congestion (Goal 5), and improves safety (Goal 4).
Project Description This project will convert general
purpose lanes on 16th Street NW
into peak-period, peak-direction
bus-only lanes from Arkansas
Avenue to H Street, and implement
a new reversible center lane from W
Street to O Street and K Street to H
Street. The project will also improve
bus stops in the corridor, including
installation of additional shelters,
creation of additional waiting areas,
and installation of off-board fare
payment kiosks, as well as
pedestrian improvements, including
crosswalks and ADA ramps.
Existing Support for this Project This project has undergone review
at the local, state, and/or
subregional levels and is included in
the following approved plans: Move
DC and the 16th Street Transit
Priority Study.
2016 CLRP Amendment Documentation I 31
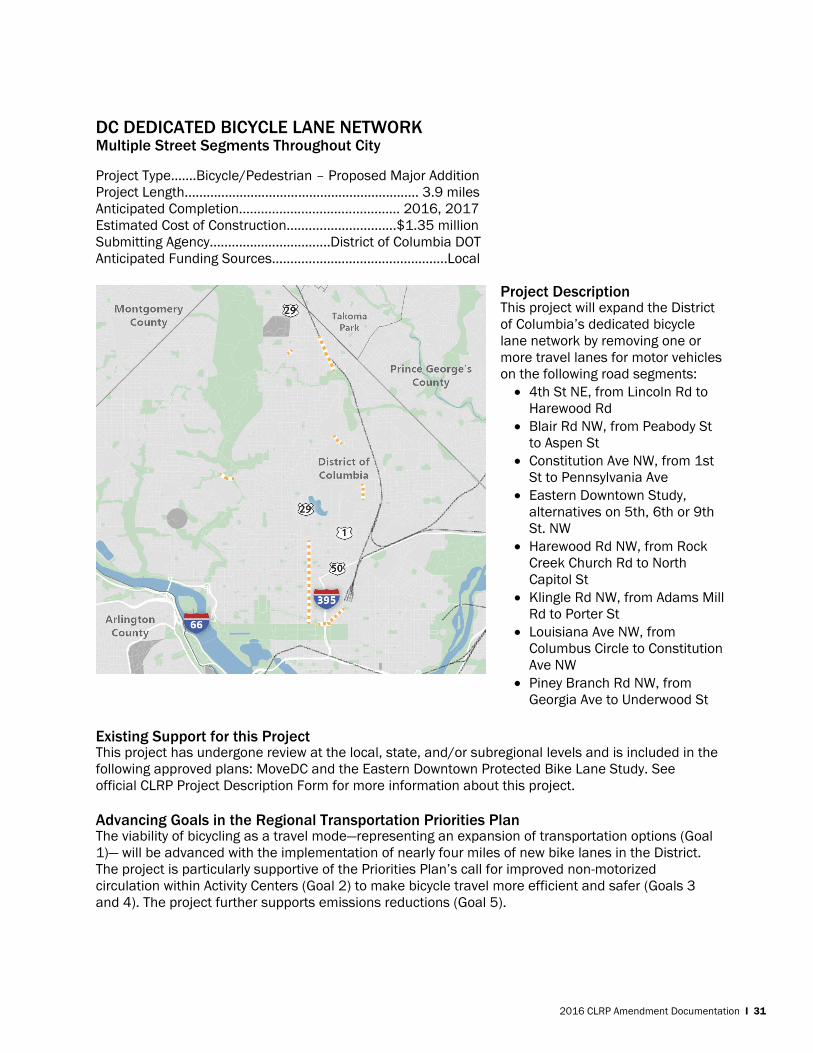
DC DEDICATED BICYCLE LANE NETWORK Multiple Street Segments Throughout City
Project Type…….Bicycle/Pedestrian – Proposed Major Addition
Project Length................................................................ 3.9 miles
Anticipated Completion............................................ 2016, 2017
Estimated Cost of Construction..............................$1.35 million
Submitting Agency.................................District of Columbia DOT
Anticipated Funding Sources................................................Local
Existing Support for this Project This project has undergone review at the local, state, and/or subregional levels and is included in the
following approved plans: MoveDC and the Eastern Downtown Protected Bike Lane Study. See
official CLRP Project Description Form for more information about this project.
Advancing Goals in the Regional Transportation Priorities Plan The viability of bicycling as a travel mode—representing an expansion of transportation options (Goal
1)— will be advanced with the implementation of nearly four miles of new bike lanes in the District.
The project is particularly supportive of the Priorities Plan’s call for improved non-motorized
circulation within Activity Centers (Goal 2) to make bicycle travel more efficient and safer (Goals 3
and 4). The project further supports emissions reductions (Goal 5).
Project DescriptionThis project will expand the District
of Columbia’s dedicated bicycle
lane network by removing one or
more travel lanes for motor vehicles
on the following road segments:
4th St NE, from Lincoln Rd to
Harewood Rd
Blair Rd NW, from Peabody St
to Aspen St
Constitution Ave NW, from 1st
St to Pennsylvania Ave
Eastern Downtown Study,
alternatives on 5th, 6th or 9th
St. NW
Harewood Rd NW, from Rock
Creek Church Rd to North
Capitol St
Klingle Rd NW, from Adams Mill
Rd to Porter St
Louisiana Ave NW, from
Columbus Circle to Constitution
Ave NW
Piney Branch Rd NW, from
Georgia Ave to Underwood St
2016 CLRP Amendment Documentation I 32
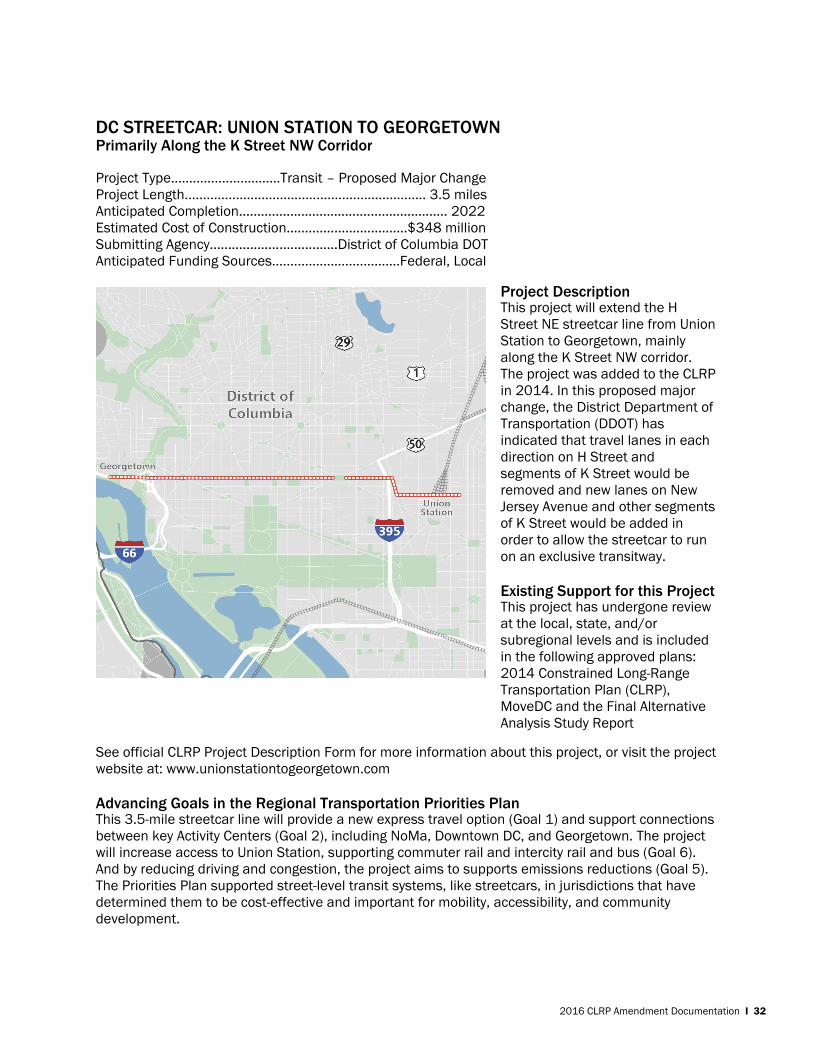
DC STREETCAR: UNION STATION TO GEORGETOWN Primarily Along the K Street NW Corridor
Project Type…….................…….Transit – Proposed Major Change
Project Length.................................................................. 3.5 miles
Anticipated Completion......................................................... 2022
Estimated Cost of Construction.................................$348 million
Submitting Agency...................................District of Columbia DOT
Anticipated Funding Sources...................................Federal, Local
See official CLRP Project Description Form for more information about this project, or visit the project
website at: www.unionstationtogeorgetown.com
Advancing Goals in the Regional Transportation Priorities Plan This 3.5-mile streetcar line will provide a new express travel option (Goal 1) and support connections
between key Activity Centers (Goal 2), including NoMa, Downtown DC, and Georgetown. The project
will increase access to Union Station, supporting commuter rail and intercity rail and bus (Goal 6).
And by reducing driving and congestion, the project aims to supports emissions reductions (Goal 5).
The Priorities Plan supported street-level transit systems, like streetcars, in jurisdictions that have
determined them to be cost-effective and important for mobility, accessibility, and community
development.
Project Description This project will extend the H
Street NE streetcar line from Union
Station to Georgetown, mainly
along the K Street NW corridor.
The project was added to the CLRP
in 2014. In this proposed major
change, the District Department of
Transportation (DDOT) has
indicated that travel lanes in each
direction on H Street and
segments of K Street would be
removed and new lanes on New
Jersey Avenue and other segments
of K Street would be added in
order to allow the streetcar to run
on an exclusive transitway.
Existing Support for this Project This project has undergone review
at the local, state, and/or
subregional levels and is included
in the following approved plans:
2014 Constrained Long-Range
Transportation Plan (CLRP),
MoveDC and the Final Alternative
Analysis Study Report
2016 CLRP Amendment Documentation I 33
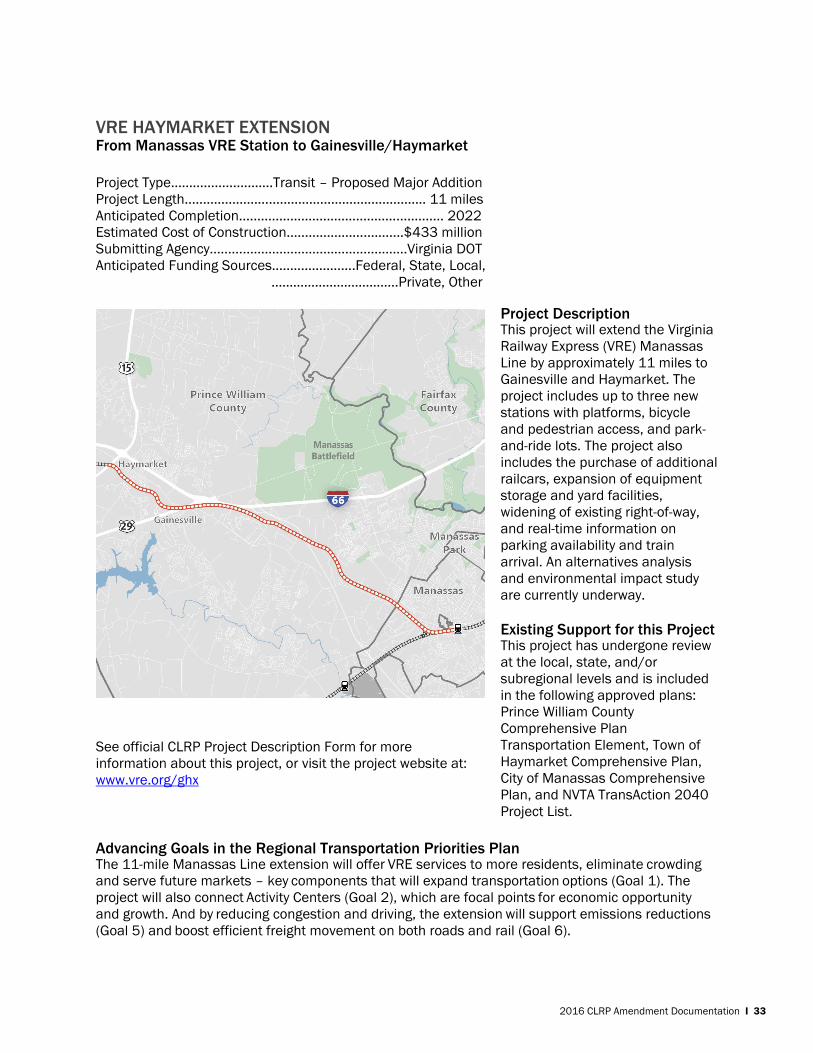
VRE HAYMARKET EXTENSION From Manassas VRE Station to Gainesville/Haymarket
Project Type…….................…..Transit – Proposed Major Addition
Project Length.................................................................. 11 miles
Anticipated Completion........................................................ 2022
Estimated Cost of Construction................................$433 million
Submitting Agency......................................................Virginia DOT
Anticipated Funding Sources…………………..Federal, State, Local,
……………………………..Private, Other
See official CLRP Project Description Form for more
information about this project, or visit the project website at:
www.vre.org/ghx
Advancing Goals in the Regional Transportation Priorities Plan The 11-mile Manassas Line extension will offer VRE services to more residents, eliminate crowding
and serve future markets – key components that will expand transportation options (Goal 1). The
project will also connect Activity Centers (Goal 2), which are focal points for economic opportunity
and growth. And by reducing congestion and driving, the extension will support emissions reductions
(Goal 5) and boost efficient freight movement on both roads and rail (Goal 6).
Project Description This project will extend the Virginia
Railway Express (VRE) Manassas
Line by approximately 11 miles to
Gainesville and Haymarket. The
project includes up to three new
stations with platforms, bicycle
and pedestrian access, and park-
and-ride lots. The project also
includes the purchase of additional
railcars, expansion of equipment
storage and yard facilities,
widening of existing right-of-way,
and real-time information on
parking availability and train
arrival. An alternatives analysis
and environmental impact study
are currently underway.
Existing Support for this Project This project has undergone review
at the local, state, and/or
subregional levels and is included
in the following approved plans:
Prince William County
Comprehensive Plan
Transportation Element, Town of
Haymarket Comprehensive Plan,
City of Manassas Comprehensive
Plan, and NVTA TransAction 2040
Project List.
2016 CLRP Amendment Documentation I 34
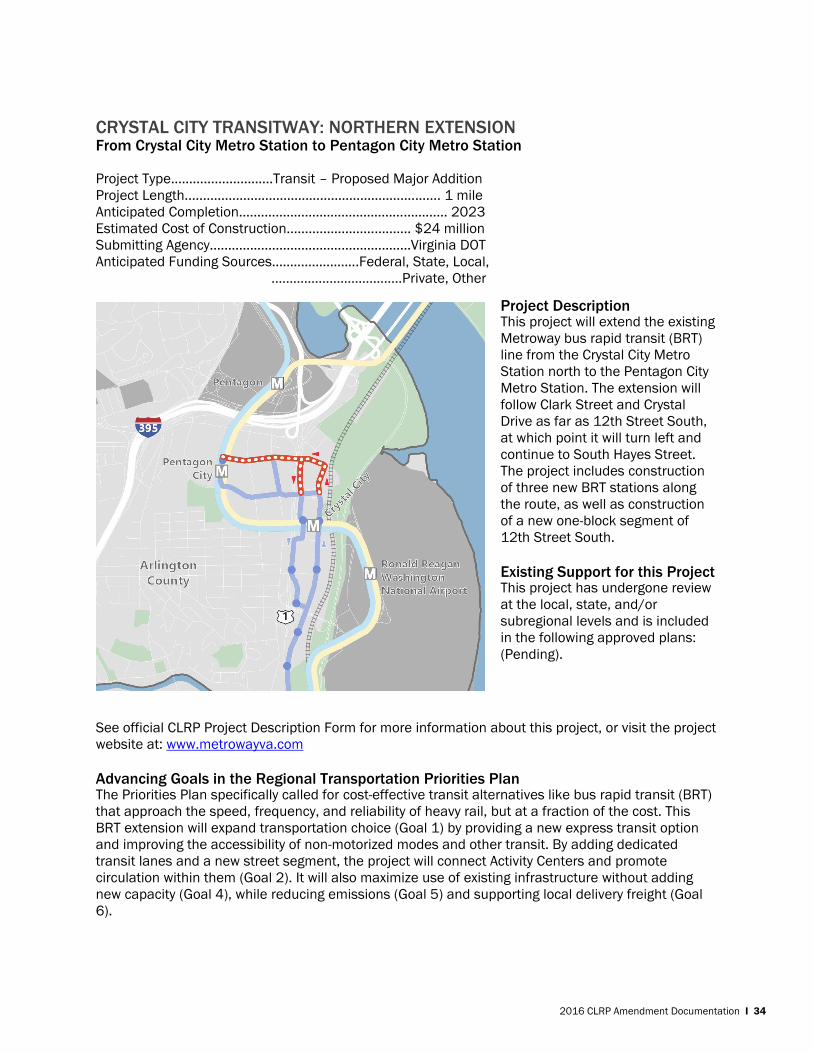
CRYSTAL CITY TRANSITWAY: NORTHERN EXTENSION
From Crystal City Metro Station to Pentagon City Metro Station Project Type…….................…..Transit – Proposed Major Addition
Project Length...................................................................... 1 mile
Anticipated Completion......................................................... 2023
Estimated Cost of Construction.................................. $24 million
Submitting Agency.......................................................Virginia DOT
Anticipated Funding Sources…………….……..Federal, State, Local,
…………….………………..Private, Other
See official CLRP Project Description Form for more information about this project, or visit the project
website at: www.metrowayva.com
Advancing Goals in the Regional Transportation Priorities Plan The Priorities Plan specifically called for cost-effective transit alternatives like bus rapid transit (BRT)
that approach the speed, frequency, and reliability of heavy rail, but at a fraction of the cost. This
BRT extension will expand transportation choice (Goal 1) by providing a new express transit option
and improving the accessibility of non-motorized modes and other transit. By adding dedicated
transit lanes and a new street segment, the project will connect Activity Centers and promote
circulation within them (Goal 2). It will also maximize use of existing infrastructure without adding
new capacity (Goal 4), while reducing emissions (Goal 5) and supporting local delivery freight (Goal
6).
Project Description This project will extend the existing
Metroway bus rapid transit (BRT)
line from the Crystal City Metro
Station north to the Pentagon City
Metro Station. The extension will
follow Clark Street and Crystal
Drive as far as 12th Street South,
at which point it will turn left and
continue to South Hayes Street.
The project includes construction
of three new BRT stations along
the route, as well as construction
of a new one-block segment of
12th Street South.
Existing Support for this Project This project has undergone review
at the local, state, and/or
subregional levels and is included
in the following approved plans:
(Pending).
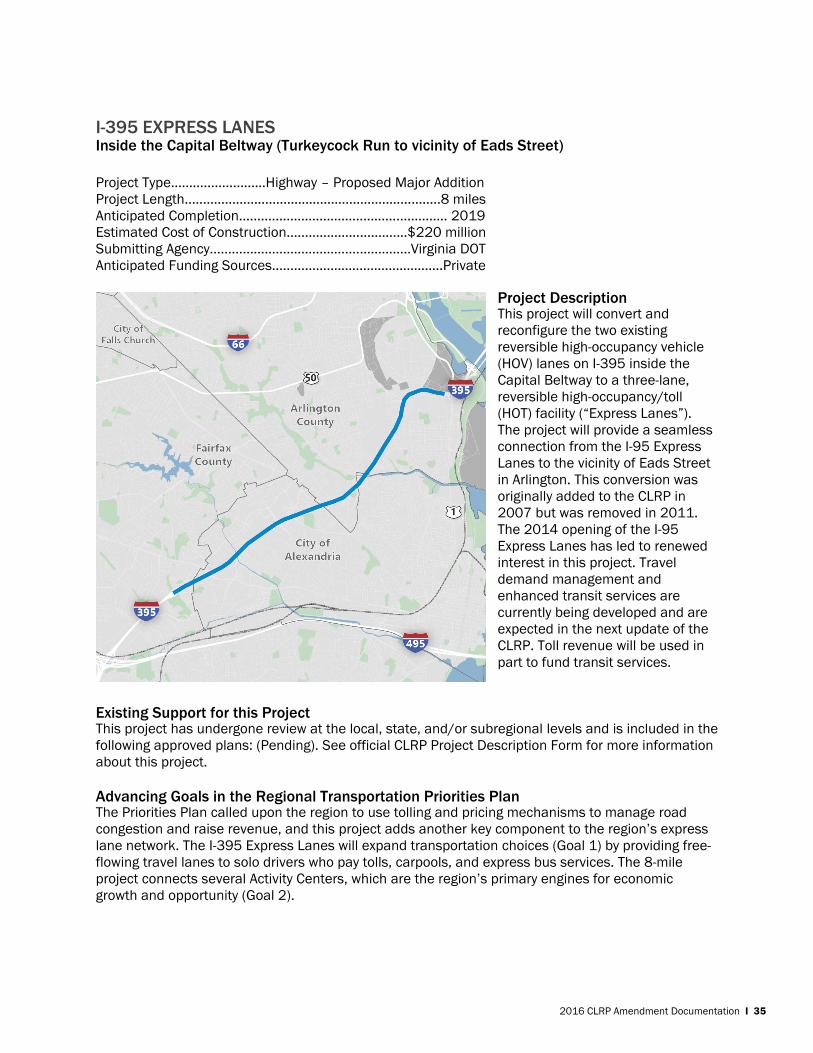
2016 CLRP Amendment Documentation I 35
I-395 EXPRESS LANES Inside the Capital Beltway (Turkeycock Run to vicinity of Eads Street)
Project Type……...............…..Highway – Proposed Major Addition
Project Length......................................................................8 miles
Anticipated Completion......................................................... 2019
Estimated Cost of Construction.................................$220 million
Submitting Agency.......................................................Virginia DOT
Anticipated Funding Sources..........………………….…………...Private
Existing Support for this Project This project has undergone review at the local, state, and/or subregional levels and is included in the
following approved plans: (Pending). See official CLRP Project Description Form for more information
about this project.
Advancing Goals in the Regional Transportation Priorities Plan The Priorities Plan called upon the region to use tolling and pricing mechanisms to manage road
congestion and raise revenue, and this project adds another key component to the region’s express
lane network. The I-395 Express Lanes will expand transportation choices (Goal 1) by providing free-
flowing travel lanes to solo drivers who pay tolls, carpools, and express bus services. The 8-mile
project connects several Activity Centers, which are the region’s primary engines for economic
growth and opportunity (Goal 2).
Project Description This project will convert and
reconfigure the two existing
reversible high-occupancy vehicle
(HOV) lanes on I-395 inside the
Capital Beltway to a three-lane,
reversible high-occupancy/toll
(HOT) facility (“Express Lanes”).
The project will provide a seamless
connection from the I-95 Express
Lanes to the vicinity of Eads Street
in Arlington. This conversion was
originally added to the CLRP in
2007 but was removed in 2011.
The 2014 opening of the I-95
Express Lanes has led to renewed
interest in this project. Travel
demand management and
enhanced transit services are
currently being developed and are
expected in the next update of the
CLRP. Toll revenue will be used in
part to fund transit services.
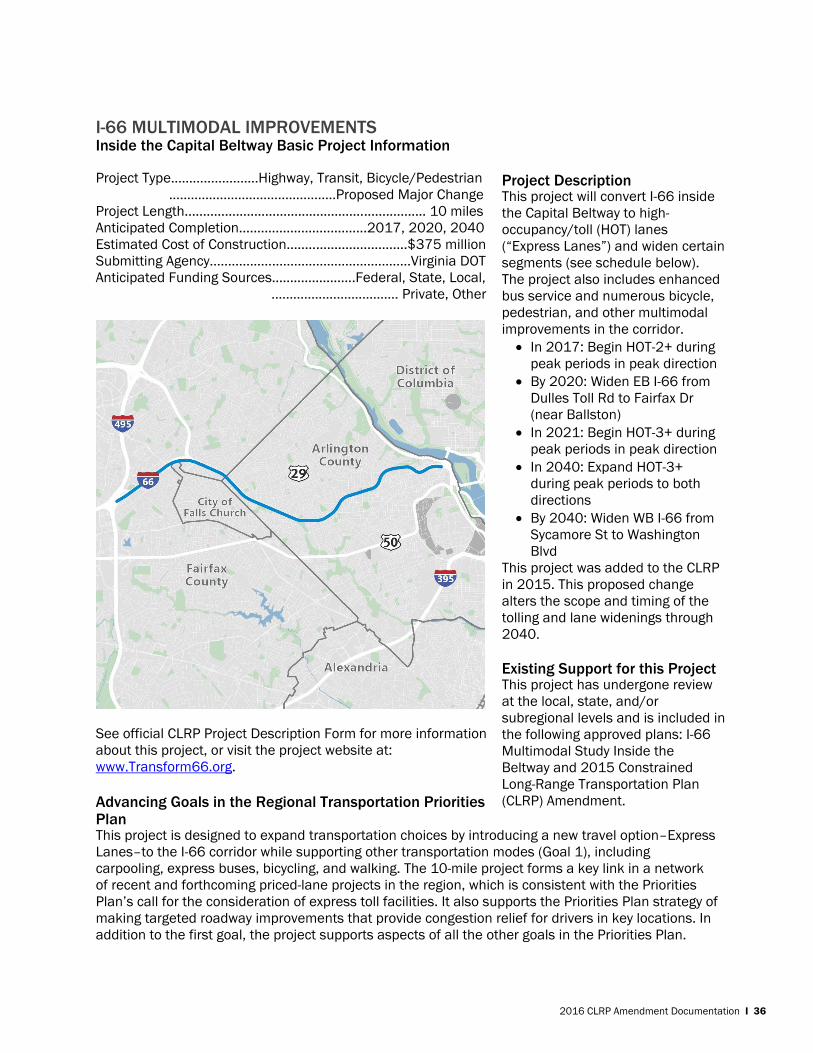
2016 CLRP Amendment Documentation I 36
I-66 MULTIMODAL IMPROVEMENTS Inside the Capital Beltway Basic Project Information
Project Type…….............…..Highway, Transit, Bicycle/Pedestrian
.………………………………………Proposed Major Change
Project Length.................................................................. 10 miles
Anticipated Completion...................................2017, 2020, 2040
Estimated Cost of Construction.................................$375 million
Submitting Agency.......................................................Virginia DOT
Anticipated Funding Sources…………………..Federal, State, Local,
……………….……………. Private, Other
See official CLRP Project Description Form for more information
about this project, or visit the project website at:
www.Transform66.org.
Advancing Goals in the Regional Transportation Priorities Plan This project is designed to expand transportation choices by introducing a new travel option–Express
Lanes–to the I-66 corridor while supporting other transportation modes (Goal 1), including
carpooling, express buses, bicycling, and walking. The 10-mile project forms a key link in a network
of recent and forthcoming priced-lane projects in the region, which is consistent with the Priorities
Plan’s call for the consideration of express toll facilities. It also supports the Priorities Plan strategy of
making targeted roadway improvements that provide congestion relief for drivers in key locations. In
addition to the first goal, the project supports aspects of all the other goals in the Priorities Plan.
Project Description This project will convert I-66 inside
the Capital Beltway to high-
occupancy/toll (HOT) lanes
(“Express Lanes”) and widen certain
segments (see schedule below).
The project also includes enhanced
bus service and numerous bicycle,
pedestrian, and other multimodal
improvements in the corridor.
In 2017: Begin HOT-2+ during
peak periods in peak direction
By 2020: Widen EB I-66 from
Dulles Toll Rd to Fairfax Dr
(near Ballston)
In 2021: Begin HOT-3+ during
peak periods in peak direction
In 2040: Expand HOT-3+
during peak periods to both
directions
By 2040: Widen WB I-66 from
Sycamore St to Washington
Blvd
This project was added to the CLRP
in 2015. This proposed change
alters the scope and timing of the
tolling and lane widenings through
2040.
Existing Support for this Project This project has undergone review
at the local, state, and/or
subregional levels and is included in
the following approved plans: I-66
Multimodal Study Inside the
Beltway and 2015 Constrained
Long-Range Transportation Plan
(CLRP) Amendment.
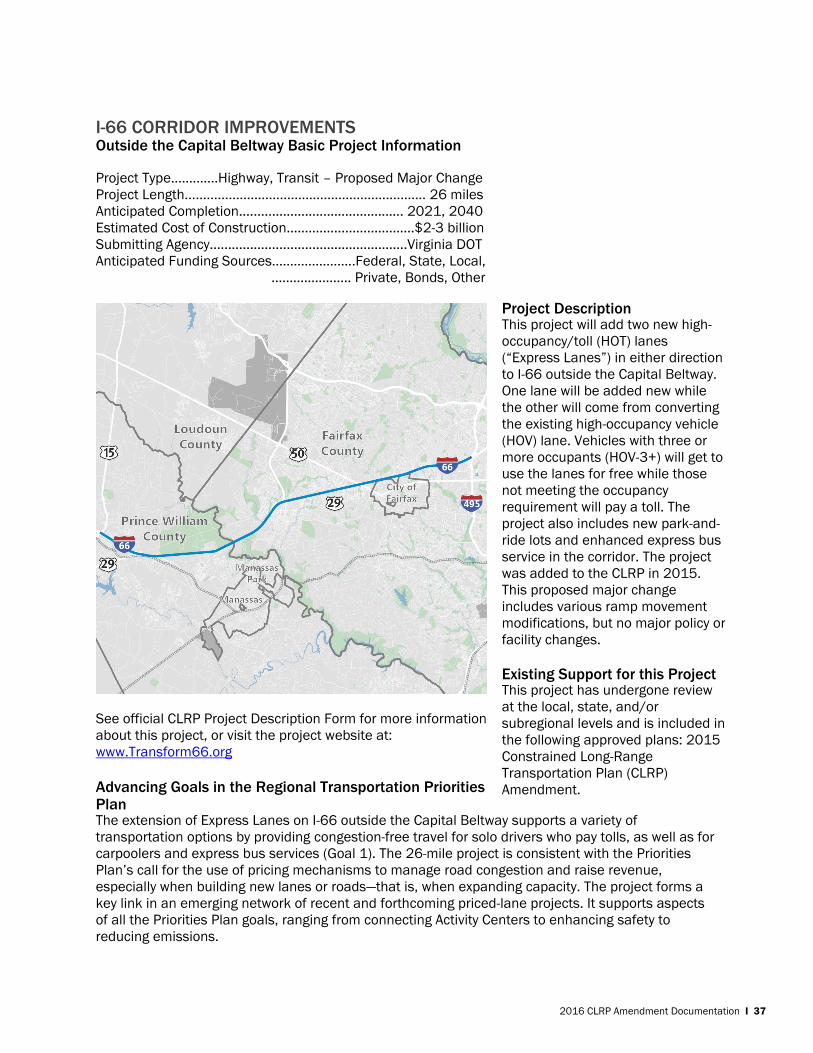
2016 CLRP Amendment Documentation I 37
I-66 CORRIDOR IMPROVEMENTS Outside the Capital Beltway Basic Project Information
Project Type……..…..Highway, Transit – Proposed Major Change
Project Length.................................................................. 26 miles
Anticipated Completion............................................. 2021, 2040
Estimated Cost of Construction………..........................$2-3 billion
Submitting Agency......................................................Virginia DOT
Anticipated Funding Sources…………………..Federal, State, Local,
…………………. Private, Bonds, Other
See official CLRP Project Description Form for more information
about this project, or visit the project website at:
www.Transform66.org
Advancing Goals in the Regional Transportation Priorities Plan The extension of Express Lanes on I-66 outside the Capital Beltway supports a variety of
transportation options by providing congestion-free travel for solo drivers who pay tolls, as well as for
carpoolers and express bus services (Goal 1). The 26-mile project is consistent with the Priorities
Plan’s call for the use of pricing mechanisms to manage road congestion and raise revenue,
especially when building new lanes or roads—that is, when expanding capacity. The project forms a
key link in an emerging network of recent and forthcoming priced-lane projects. It supports aspects
of all the Priorities Plan goals, ranging from connecting Activity Centers to enhancing safety to
reducing emissions.
Project Description This project will add two new high-
occupancy/toll (HOT) lanes
(“Express Lanes”) in either direction
to I-66 outside the Capital Beltway.
One lane will be added new while
the other will come from converting
the existing high-occupancy vehicle
(HOV) lane. Vehicles with three or
more occupants (HOV-3+) will get to
use the lanes for free while those
not meeting the occupancy
requirement will pay a toll. The
project also includes new park-and-
ride lots and enhanced express bus
service in the corridor. The project
was added to the CLRP in 2015.
This proposed major change
includes various ramp movement
modifications, but no major policy or
facility changes.
Existing Support for this Project This project has undergone review
at the local, state, and/or
subregional levels and is included in
the following approved plans: 2015
Constrained Long-Range
Transportation Plan (CLRP)
Amendment.
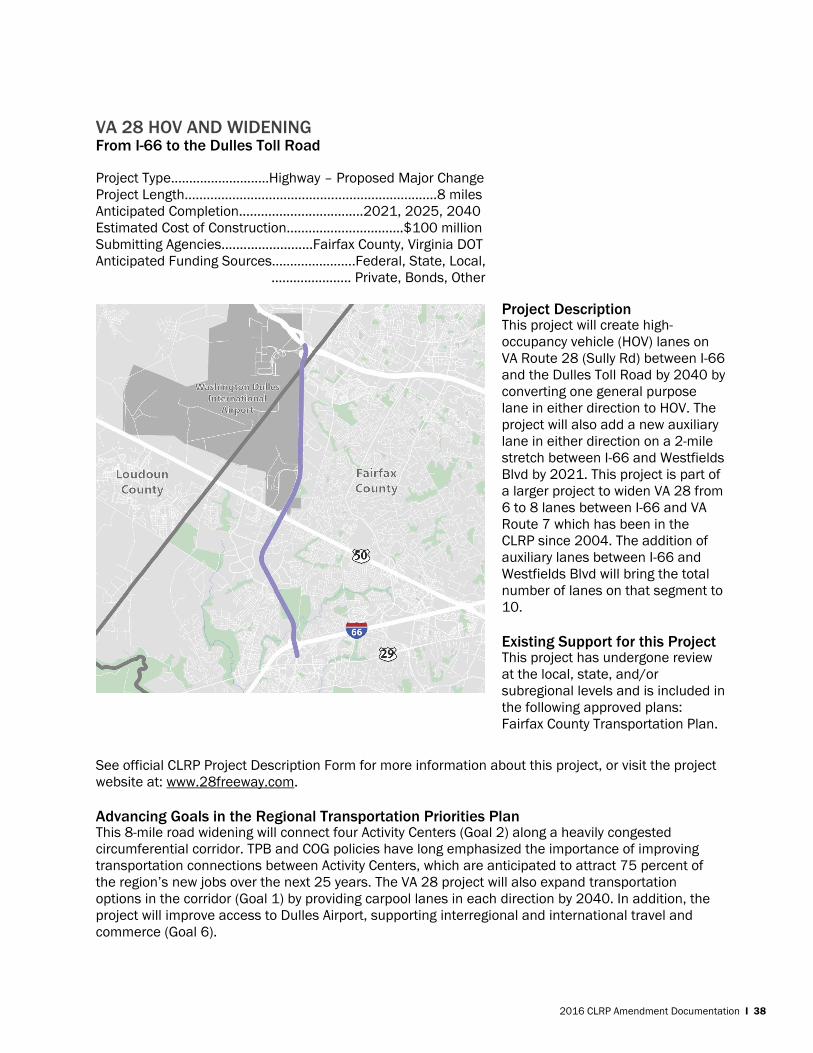
2016 CLRP Amendment Documentation I 38
VA 28 HOV AND WIDENING From I-66 to the Dulles Toll Road
Project Type………………….…..Highway – Proposed Major Change
Project Length.....................................................................8 miles
Anticipated Completion..................................2021, 2025, 2040
Estimated Cost of Construction…………....................$100 million
Submitting Agencies.........................Fairfax County, Virginia DOT
Anticipated Funding Sources…………………..Federal, State, Local,
…………………. Private, Bonds, Other
See official CLRP Project Description Form for more information about this project, or visit the project
website at: www.28freeway.com.
Advancing Goals in the Regional Transportation Priorities Plan This 8-mile road widening will connect four Activity Centers (Goal 2) along a heavily congested
circumferential corridor. TPB and COG policies have long emphasized the importance of improving
transportation connections between Activity Centers, which are anticipated to attract 75 percent of
the region’s new jobs over the next 25 years. The VA 28 project will also expand transportation
options in the corridor (Goal 1) by providing carpool lanes in each direction by 2040. In addition, the
project will improve access to Dulles Airport, supporting interregional and international travel and
commerce (Goal 6).
Project Description This project will create high-
occupancy vehicle (HOV) lanes on
VA Route 28 (Sully Rd) between I-66
and the Dulles Toll Road by 2040 by
converting one general purpose
lane in either direction to HOV. The
project will also add a new auxiliary
lane in either direction on a 2-mile
stretch between I-66 and Westfields
Blvd by 2021. This project is part of
a larger project to widen VA 28 from
6 to 8 lanes between I-66 and VA
Route 7 which has been in the
CLRP since 2004. The addition of
auxiliary lanes between I-66 and
Westfields Blvd will bring the total
number of lanes on that segment to
10.
Existing Support for this Project This project has undergone review
at the local, state, and/or
subregional levels and is included in
the following approved plans:
Fairfax County Transportation Plan.
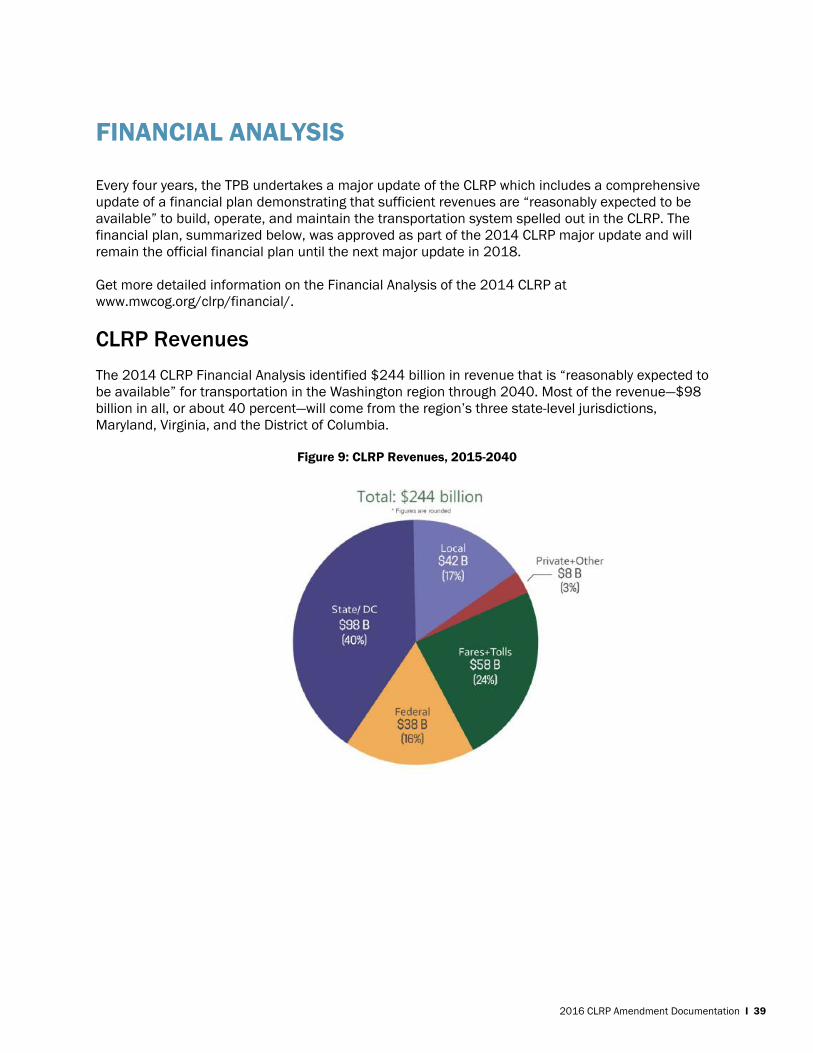
2016 CLRP Amendment Documentation I 39
FINANCIAL ANALYSIS
Every four years, the TPB undertakes a major update of the CLRP which includes a comprehensive
update of a financial plan demonstrating that sufficient revenues are “reasonably expected to be
available” to build, operate, and maintain the transportation system spelled out in the CLRP. The
financial plan, summarized below, was approved as part of the 2014 CLRP major update and will
remain the official financial plan until the next major update in 2018.
Get more detailed information on the Financial Analysis of the 2014 CLRP at
www.mwcog.org/clrp/financial/.
CLRP Revenues
The 2014 CLRP Financial Analysis identified $244 billion in revenue that is “reasonably expected to
be available” for transportation in the Washington region through 2040. Most of the revenue—$98
billion in all, or about 40 percent—will come from the region’s three state-level jurisdictions,
Maryland, Virginia, and the District of Columbia.
Figure 9: CLRP Revenues, 2015-2040

2016 CLRP Amendment Documentation I 40
CLRP Expenditures
The largest share of expenditures—about $123 billion, or 51 percent—will go toward operations and
routine maintenance of the region’s transportation system. More than half of the region’s anticipated
transportation spending through 2040 will go toward investments in transit. The largest share of that
spending, about 70 percent, will go toward operations and routine maintenance, including paying
train and bus operators and servicing railcars and buses.
Figure 10: CLRP Expenditures, 2015-2040
2016 CLRP Amendment Documentation I 41
PERFORMANCE ANALYSIS OF THE 2016 CLRP
The Performance Analysis of the 2016 CLRP uses output from the TPB’s travel demand model, which
forecasts where, when, and how people will travel around the region in coming decades. To make its
predictions, the model relies on the latest regional population and job growth forecasts from the
Metropolitan Washington Council of Governments, information on existing travel patterns from the
TPB’s Household Travel Survey, and the future transportation system laid out in the CLRP. The CLRP
can be analyzed to see how well it accommodates rising travel demand resulting from population
and job growth and how it supports or advances key strategies in the Regional Transportation
Priorities Plan. The results of this analysis can help decision-makers and the public better
understand what changes to current plans and funding might be needed to achieve different future
outcomes.
Performance Analysis Summary
The results of the performance analysis of the 2016 CLRP are dependent upon the following inputs:
Round 9.0 Cooperative Land Use Forecasts for population and jobs, the full set of transportation
projects programmed for the region in the 2016 CLRP, TPB’s Version 2.3.66 Travel Demand Model,
and other modeling assumptions.3
Based on the over 500 projects in the 2016 CLRP, by 2040 there will be approximately 1,200 new
lane miles of roadways, around 200 of which will be tolled. There will be expansions of Metrorail,
commuter rail, and the BRT and light rail systems throughout the region. Further details about the
projects can be found in the “Projects, Programs, & Funding” chapter.
Figure 11 displays a summary of the key performance analysis indicators for the 2016 CLRP. By
2040, the region’s transportation system is expected to handle 4 million more trips than it does
today, an increase of 23%. The rate of growth in pedestrian and bicycle trips is expected to outpace
growth in single-occupancy vehicle trips and transit trips. The total amount of driving, measured in
vehicle miles of travel (VMT), is expected to grow, but at a slightly lower rate than population growth,
meaning that the average amount of driving per person will be less in 2040 than it is today. Growth
in travel demand will, under the forecasts, outpace the addition of new highway and transit capacity,
resulting in significant increases in congestion and crowding.
3 Other modeling assumptions include: modeling done for the TPB Planning Area (not the TPB Modelled Area), 2014 Vehicle Registration Data (VIN), HOV Policy
assumption, and EPA’s MOVES2014a Mobile Emissions Model
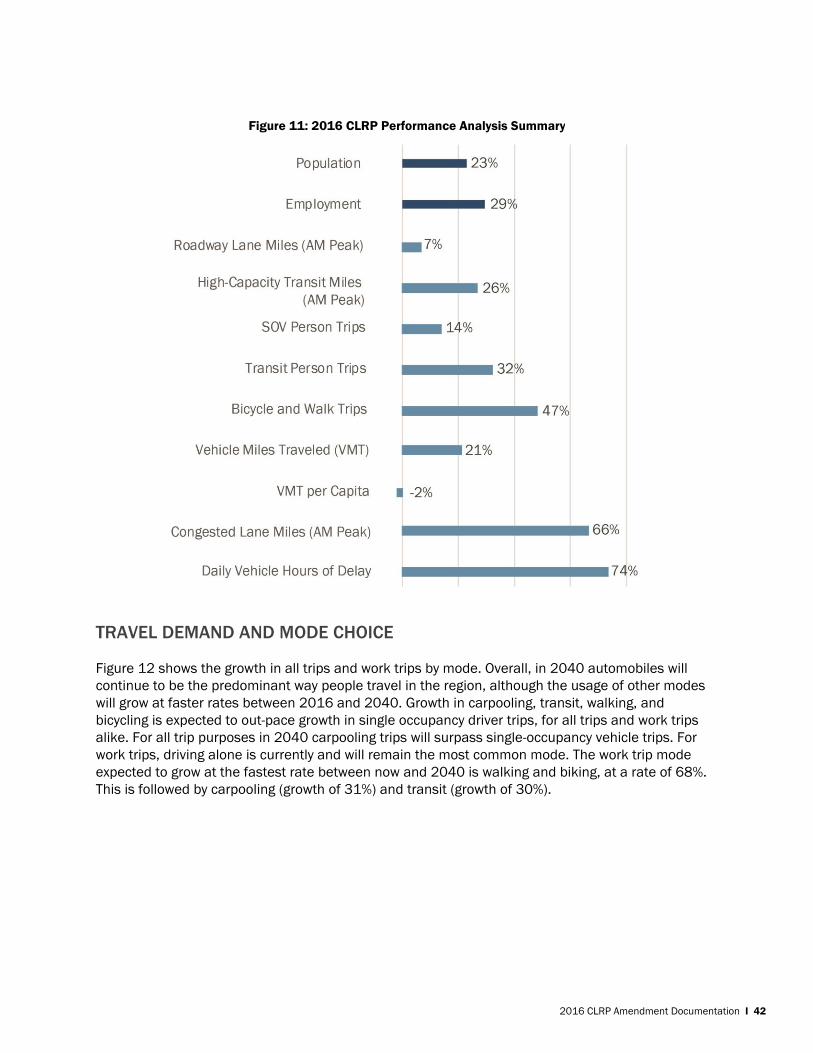
2016 CLRP Amendment Documentation I 42
TRAVEL DEMAND AND MODE CHOICE
Figure 12 shows the growth in all trips and work trips by mode. Overall, in 2040 automobiles will
continue to be the predominant way people travel in the region, although the usage of other modes
will grow at faster rates between 2016 and 2040. Growth in carpooling, transit, walking, and
bicycling is expected to out-pace growth in single occupancy driver trips, for all trips and work trips
alike. For all trip purposes in 2040 carpooling trips will surpass single-occupancy vehicle trips. For
work trips, driving alone is currently and will remain the most common mode. The work trip mode
expected to grow at the fastest rate between now and 2040 is walking and biking, at a rate of 68%.
This is followed by carpooling (growth of 31%) and transit (growth of 30%).
Figure 11: 2016 CLRP Performance Analysis Summary
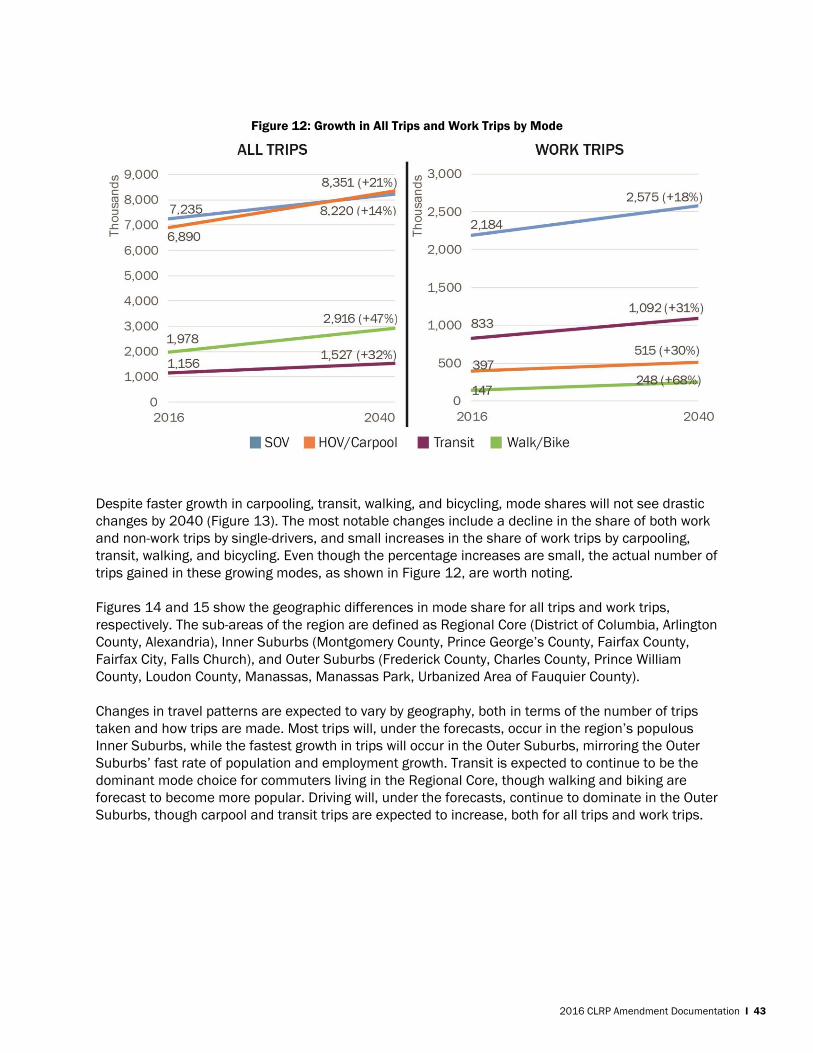
2016 CLRP Amendment Documentation I 43
Despite faster growth in carpooling, transit, walking, and bicycling, mode shares will not see drastic
changes by 2040 (Figure 13). The most notable changes include a decline in the share of both work
and non-work trips by single-drivers, and small increases in the share of work trips by carpooling,
transit, walking, and bicycling. Even though the percentage increases are small, the actual number of
trips gained in these growing modes, as shown in Figure 12, are worth noting.
Figures 14 and 15 show the geographic differences in mode share for all trips and work trips,
respectively. The sub-areas of the region are defined as Regional Core (District of Columbia, Arlington
County, Alexandria), Inner Suburbs (Montgomery County, Prince George’s County, Fairfax County,
Fairfax City, Falls Church), and Outer Suburbs (Frederick County, Charles County, Prince William
County, Loudon County, Manassas, Manassas Park, Urbanized Area of Fauquier County).
Changes in travel patterns are expected to vary by geography, both in terms of the number of trips
taken and how trips are made. Most trips will, under the forecasts, occur in the region’s populous
Inner Suburbs, while the fastest growth in trips will occur in the Outer Suburbs, mirroring the Outer
Suburbs’ fast rate of population and employment growth. Transit is expected to continue to be the
dominant mode choice for commuters living in the Regional Core, though walking and biking are
forecast to become more popular. Driving will, under the forecasts, continue to dominate in the Outer
Suburbs, though carpool and transit trips are expected to increase, both for all trips and work trips.
Figure 12: Growth in All Trips and Work Trips by Mode
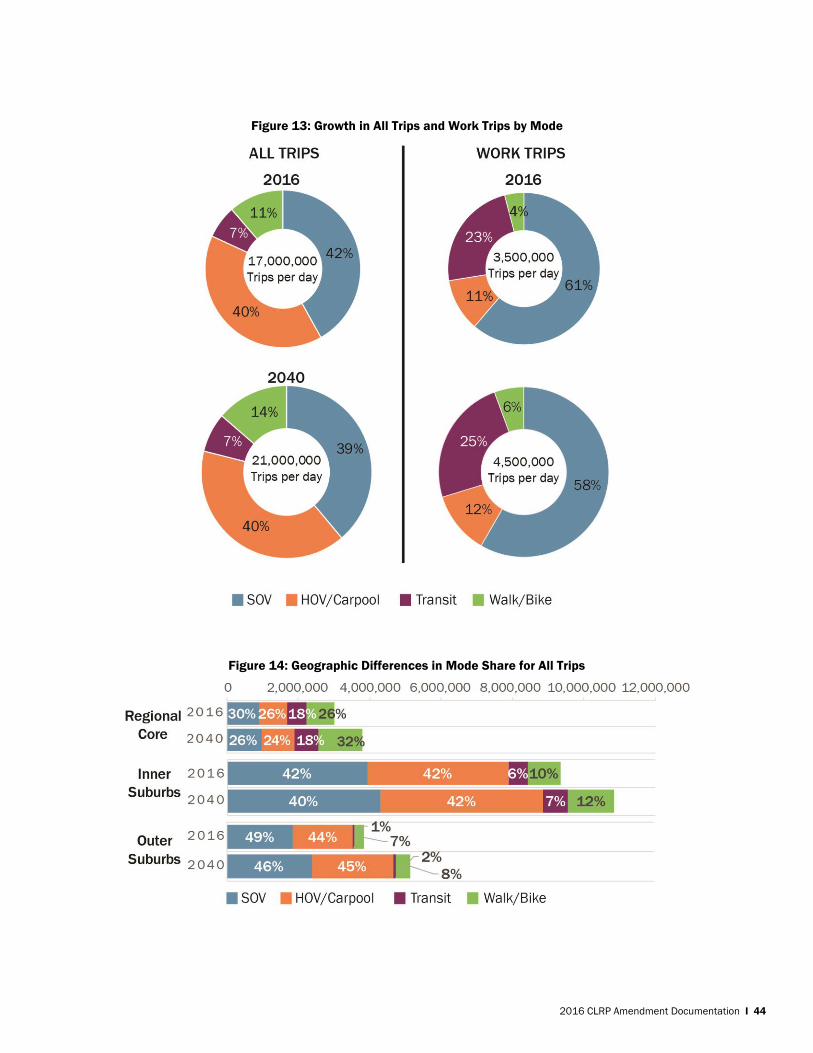
2016 CLRP Amendment Documentation I 44
Figure 13: Growth in All Trips and Work Trips by Mode
Figure 14: Geographic Differences in Mode Share for All Trips

2016 CLRP Amendment Documentation I 45
Performance Analysis and the TPB’s Regional Transportation Priorities New to this year’s CLRP project submissions process, the CLRP project description form asked
agencies to answer a series of questions on how new projects support the goals laid out in the Regional
Transportation Priorities Plan (RTPP). The Priorities Plan, approved in January 2014, is also used as
the policy framework to guide the performance analysis section of this report. The Priorities Plan was
designed to assist local, state and regional leaders in “thinking regionally and acting locally” – that
is, in considering regional needs when identifying transportation improvements to advance to
implementation. The RTPP lists the multi-modal goals that were derived from the TPB Vision, which
serves as the policy document for the TPB’s transportation plans.
Recognizing that the region’s economy and quality of life depend on our transportation system, the
Priorities Plan identified a host of practical strategies to alleviate congestion and crowding and
accommodate future growth. The analysis in this study utilizes those strategies as a way to examine
different packages of potential transportation improvements.
The Priorities Plan identified 19 specific strategies with the greatest potential to advance our
regional transportation goals. Some of these strategies call for transportation capacity expansion
projects, some strategies call for maintenance of the existing transportation system, and other
strategies are oriented toward policy or program changes (e.g., support and promote electric
vehicles), which are not typically addressed by the CLRP.
To better understand the impacts of the transportation investments in the 2016 Amendment to the
CLRP, TPB staff developed a framework for analysis using the RTPP strategies. The development of
this framework included two preliminary tasks to streamline the categories for analysis: 1) those
strategies that would be addressed through transportation capacity increases were culled from the
full list of 19 strategies, and 2) similar strategies were grouped into categories that could be
analyzed in a unified manner.
Figure 15: Geographic Differences in Mode Share for Work Trips
2016 CLRP Amendment Documentation I 46
Five packages of RTPP strategies, listed below, have been given succinct titles (in italics below) that
reflect thematic objectives. They form the basis for the analysis in this report.
Maintenance (see call-out box on this page)
Ensure maintenance of the transit
system
Ensure maintenance of roads and
bridges
Transit Improvements
Provide additional capacity on the
existing transit system
Implement bus rapid transit (BRT) and
other cost-effective transit alternatives
Apply priority bus treatments
Targeted Congestion Relief
Build/Implement Express Toll Lanes
Alleviate roadway bottlenecks
Circulation in Activity Centers & Access to
Transit
Improve access to transit stops and
stations
Enhance circulation within Activity
Centers
Environmental Justice Communities
Ensure accessibility for persons with
disabilities, low incomes, and limited
English proficiency
MAINTENANCE Maintenance of our transportation system is vital. The Priorities Plan identified maintenance of our roadways and transit systems as the region’s top transportation priority. That means taking care of day-to-day maintenance and repair activities as well as rehabilitating or completely replacing aging infrastructure. The last CLRP Financial Analysis (conducted in 2014) included a full funding commitment for operations and state of good repair for roads and transit. WHAT’S IN THE PLAN: 1) $79 billion for major rehabilitation or complete replacement of aging road and transit infrastructure 2) Another $123 billion for operating and maintaining the system, including repaving roads and servicing transit vehicles See the previous chapter on “Projects, Programs & Funding” for more details on funding for maintenance.
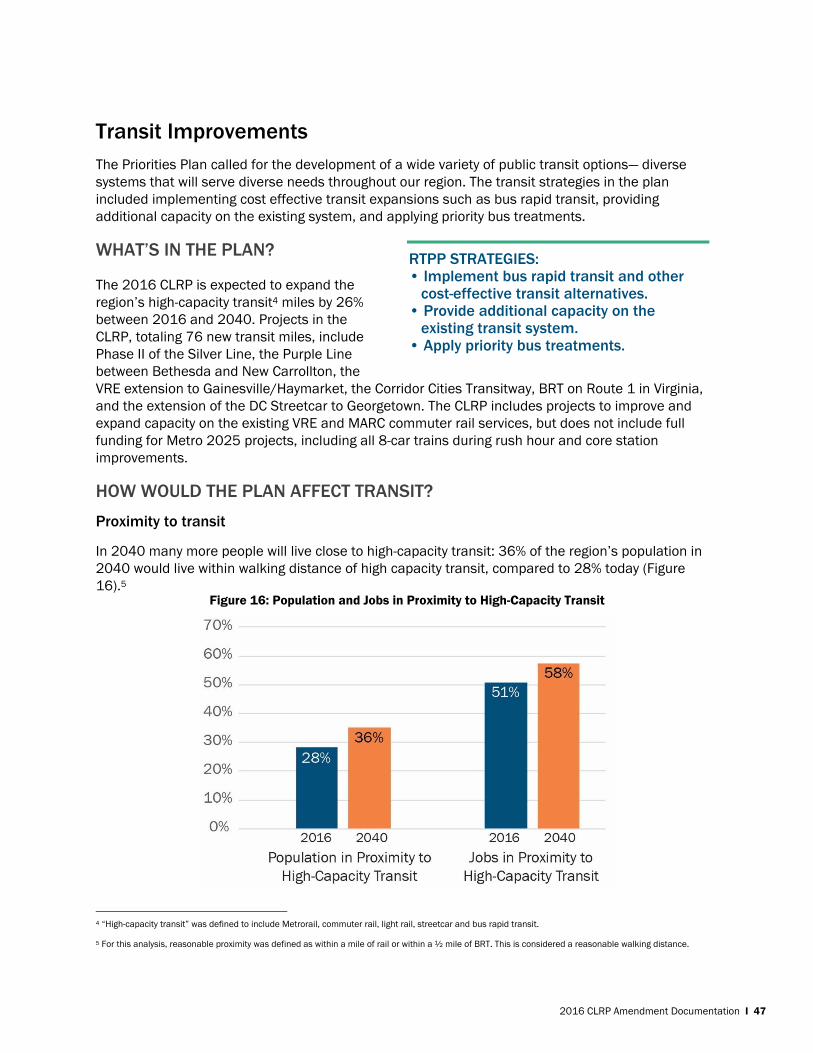
2016 CLRP Amendment Documentation I 47
Transit Improvements
The Priorities Plan called for the development of a wide variety of public transit options— diverse
systems that will serve diverse needs throughout our region. The transit strategies in the plan
included implementing cost effective transit expansions such as bus rapid transit, providing
additional capacity on the existing system, and applying priority bus treatments.
WHAT’S IN THE PLAN?
The 2016 CLRP is expected to expand the
region’s high-capacity transit4 miles by 26%
between 2016 and 2040. Projects in the
CLRP, totaling 76 new transit miles, include
Phase II of the Silver Line, the Purple Line
between Bethesda and New Carrollton, the
VRE extension to Gainesville/Haymarket, the Corridor Cities Transitway, BRT on Route 1 in Virginia,
and the extension of the DC Streetcar to Georgetown. The CLRP includes projects to improve and
expand capacity on the existing VRE and MARC commuter rail services, but does not include full
funding for Metro 2025 projects, including all 8-car trains during rush hour and core station
improvements.
HOW WOULD THE PLAN AFFECT TRANSIT?
Proximity to transit
In 2040 many more people will live close to high-capacity transit: 36% of the region’s population in
2040 would live within walking distance of high capacity transit, compared to 28% today (Figure
16).5
4 “High-capacity transit” was defined to include Metrorail, commuter rail, light rail, streetcar and bus rapid transit.
5 For this analysis, reasonable proximity was defined as within a mile of rail or within a ½ mile of BRT. This is considered a reasonable walking distance.
RTPP STRATEGIES: • Implement bus rapid transit and other cost-effective transit alternatives. • Provide additional capacity on the existing transit system. • Apply priority bus treatments.
Figure 16: Population and Jobs in Proximity to High-Capacity Transit
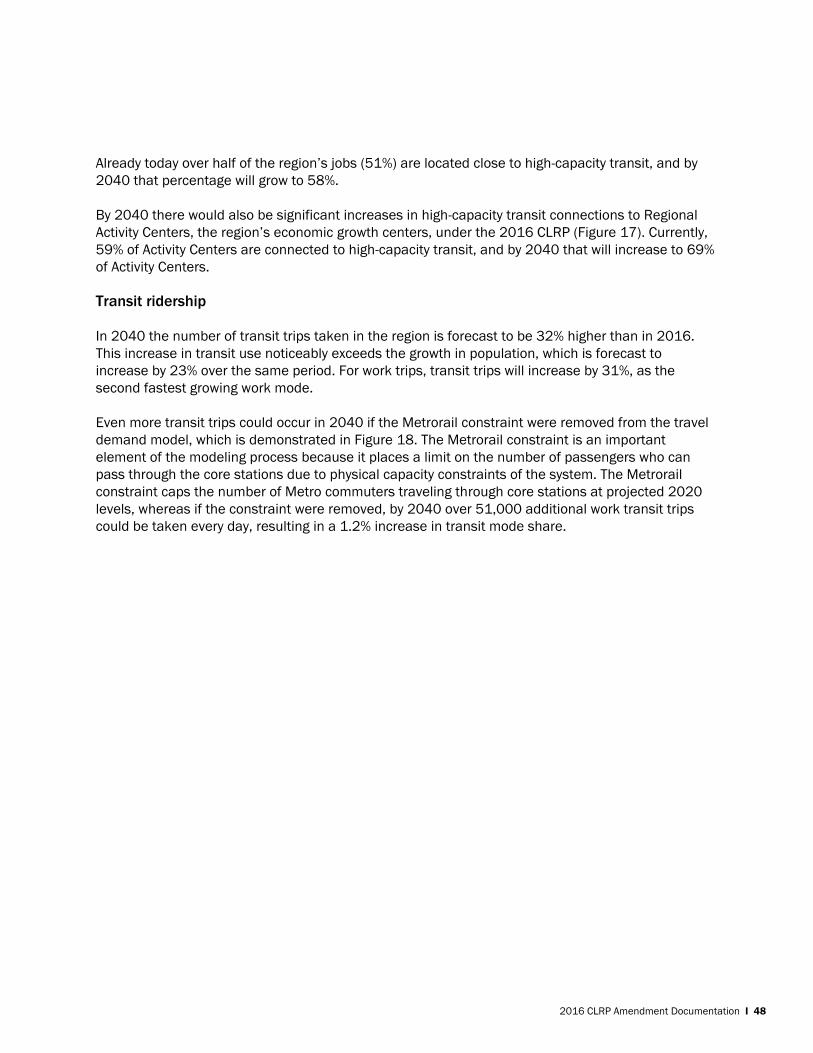
2016 CLRP Amendment Documentation I 48
Already today over half of the region’s jobs (51%) are located close to high-capacity transit, and by
2040 that percentage will grow to 58%.
By 2040 there would also be significant increases in high-capacity transit connections to Regional
Activity Centers, the region’s economic growth centers, under the 2016 CLRP (Figure 17). Currently,
59% of Activity Centers are connected to high-capacity transit, and by 2040 that will increase to 69%
of Activity Centers.
Transit ridership
In 2040 the number of transit trips taken in the region is forecast to be 32% higher than in 2016.
This increase in transit use noticeably exceeds the growth in population, which is forecast to
increase by 23% over the same period. For work trips, transit trips will increase by 31%, as the
second fastest growing work mode.
Even more transit trips could occur in 2040 if the Metrorail constraint were removed from the travel
demand model, which is demonstrated in Figure 18. The Metrorail constraint is an important
element of the modeling process because it places a limit on the number of passengers who can
pass through the core stations due to physical capacity constraints of the system. The Metrorail
constraint caps the number of Metro commuters traveling through core stations at projected 2020
levels, whereas if the constraint were removed, by 2040 over 51,000 additional work transit trips
could be taken every day, resulting in a 1.2% increase in transit mode share.
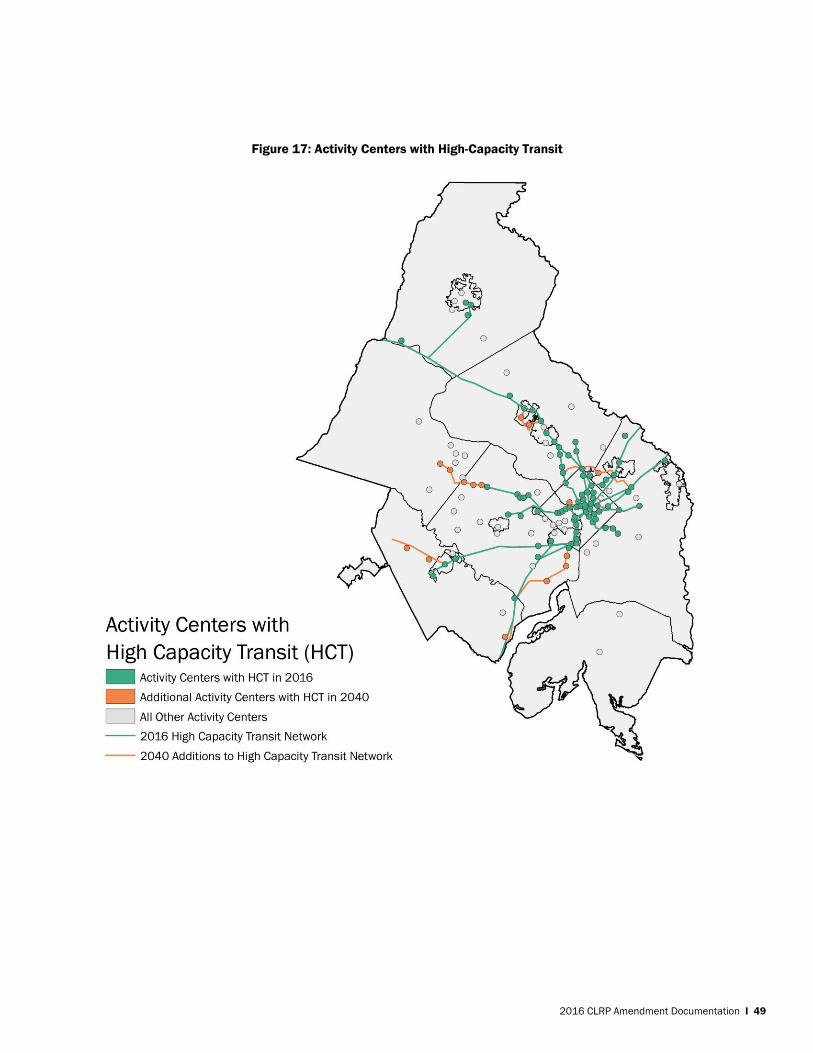
2016 CLRP Amendment Documentation I 49
Figure 17: Activity Centers with High-Capacity Transit
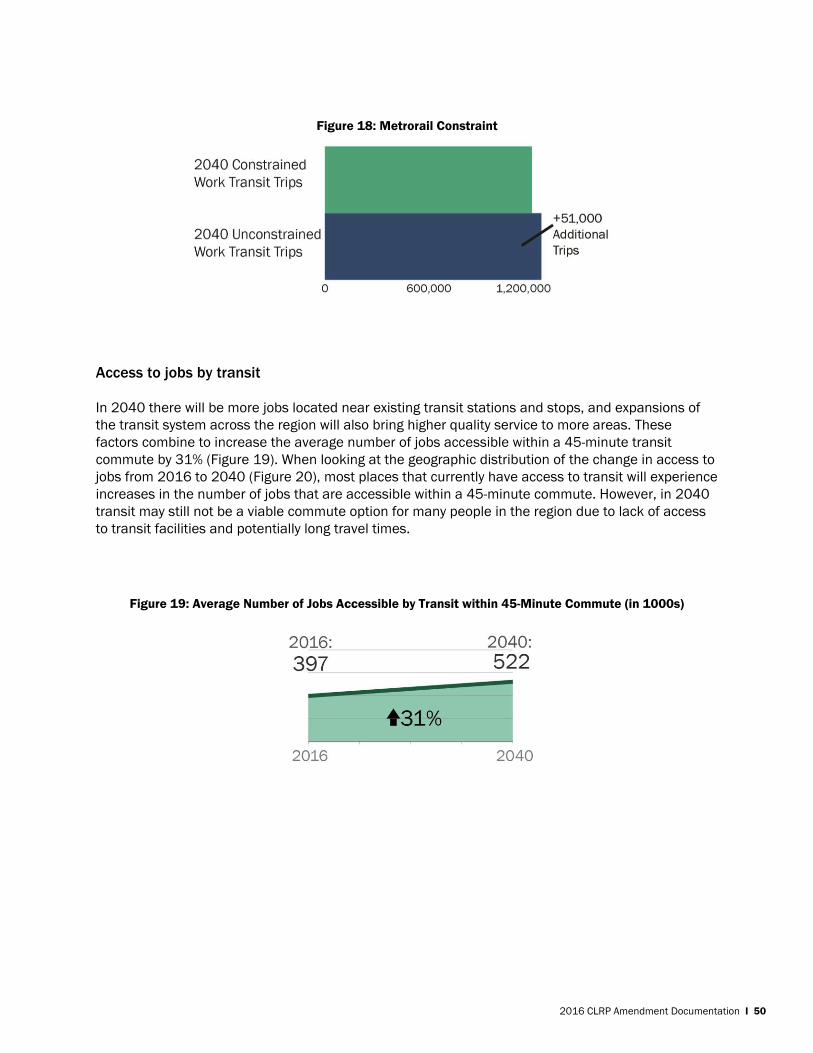
2016 CLRP Amendment Documentation I 50
Access to jobs by transit In 2040 there will be more jobs located near existing transit stations and stops, and expansions of
the transit system across the region will also bring higher quality service to more areas. These
factors combine to increase the average number of jobs accessible within a 45-minute transit
commute by 31% (Figure 19). When looking at the geographic distribution of the change in access to
jobs from 2016 to 2040 (Figure 20), most places that currently have access to transit will experience
increases in the number of jobs that are accessible within a 45-minute commute. However, in 2040
transit may still not be a viable commute option for many people in the region due to lack of access
to transit facilities and potentially long travel times.
Figure 19: Average Number of Jobs Accessible by Transit within 45-Minute Commute (in 1000s)
Figure 18: Metrorail Constraint
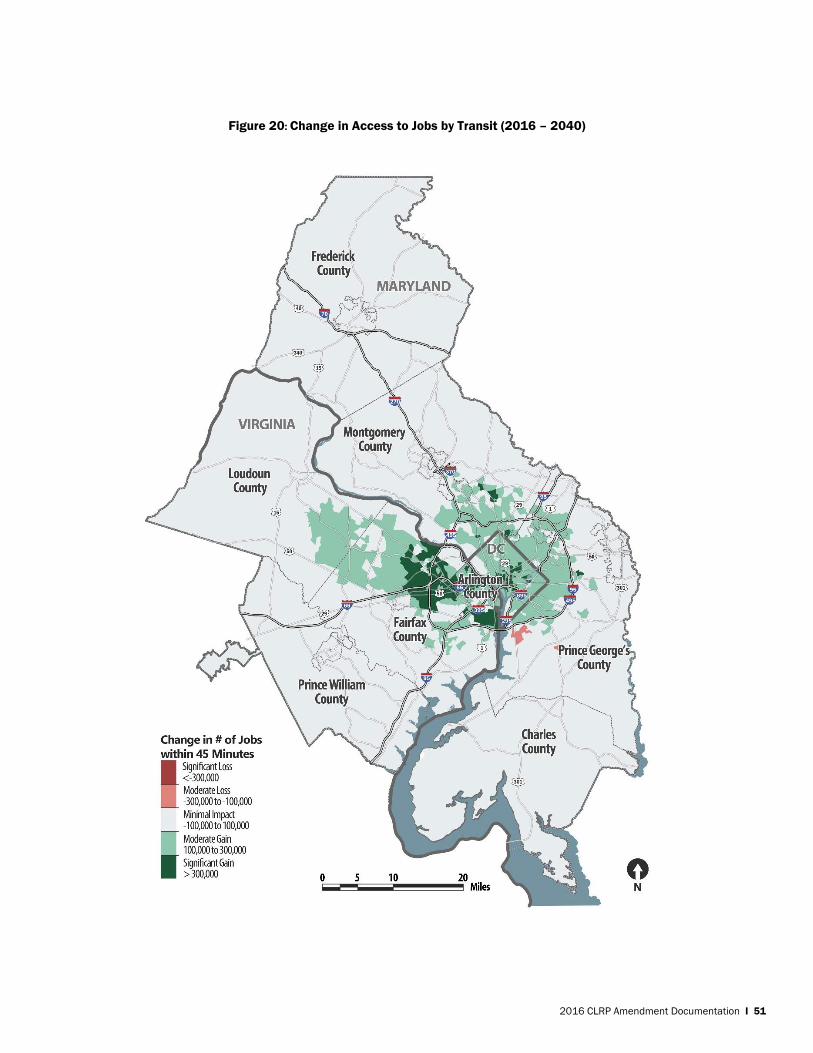
2016 CLRP Amendment Documentation I 51
Figure 20: Change in Access to Jobs by Transit (2016 – 2040)
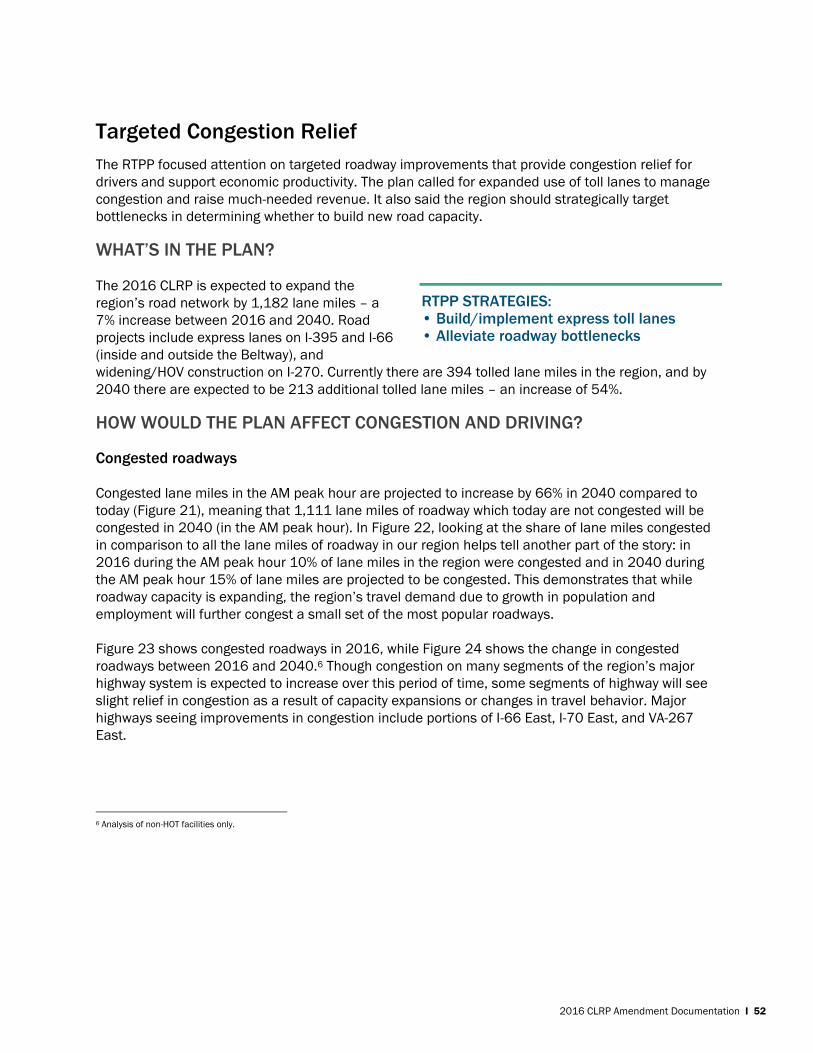
2016 CLRP Amendment Documentation I 52
Targeted Congestion Relief
The RTPP focused attention on targeted roadway improvements that provide congestion relief for
drivers and support economic productivity. The plan called for expanded use of toll lanes to manage
congestion and raise much-needed revenue. It also said the region should strategically target
bottlenecks in determining whether to build new road capacity.
WHAT’S IN THE PLAN?
The 2016 CLRP is expected to expand the
region’s road network by 1,182 lane miles – a
7% increase between 2016 and 2040. Road
projects include express lanes on I-395 and I-66
(inside and outside the Beltway), and
widening/HOV construction on I-270. Currently there are 394 tolled lane miles in the region, and by
2040 there are expected to be 213 additional tolled lane miles – an increase of 54%.
HOW WOULD THE PLAN AFFECT CONGESTION AND DRIVING?
Congested roadways
Congested lane miles in the AM peak hour are projected to increase by 66% in 2040 compared to
today (Figure 21), meaning that 1,111 lane miles of roadway which today are not congested will be
congested in 2040 (in the AM peak hour). In Figure 22, looking at the share of lane miles congested
in comparison to all the lane miles of roadway in our region helps tell another part of the story: in
2016 during the AM peak hour 10% of lane miles in the region were congested and in 2040 during
the AM peak hour 15% of lane miles are projected to be congested. This demonstrates that while
roadway capacity is expanding, the region’s travel demand due to growth in population and
employment will further congest a small set of the most popular roadways.
Figure 23 shows congested roadways in 2016, while Figure 24 shows the change in congested
roadways between 2016 and 2040.6 Though congestion on many segments of the region’s major
highway system is expected to increase over this period of time, some segments of highway will see
slight relief in congestion as a result of capacity expansions or changes in travel behavior. Major
highways seeing improvements in congestion include portions of I-66 East, I-70 East, and VA-267
East.
6 Analysis of non-HOT facilities only.
RTPP STRATEGIES: • Build/implement express toll lanes • Alleviate roadway bottlenecks
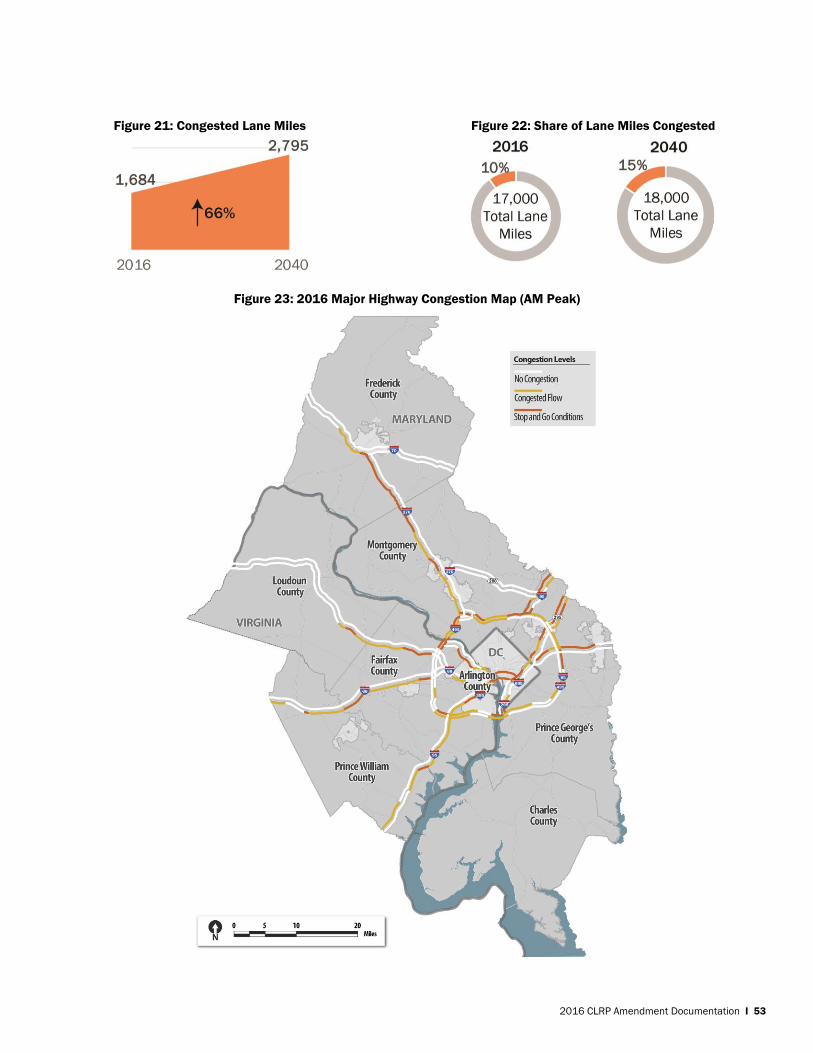
2016 CLRP Amendment Documentation I 53
Figure 23: 2016 Major Highway Congestion Map (AM Peak)
Figure 22: Share of Lane Miles Congested Figure 21: Congested Lane Miles
2016 CLRP Amendment Documentation I 54
Vehicle hours of delay
Total daily vehicle hours of delay, which is the total daily amount of time that all vehicles spend on
congested roadways, will increase by 74% between 2016 and 2040 (Figure 25). Another way to look
at that same data is by looking at the delay that individual vehicle trips experience: in 2016 the
average vehicle delay per trip was 4.9 minutes and in 2040 its estimate that will grow to 7.3 minutes
(Figure 26). Keeping in mind that this is modeled data, not observed data (meaning that the actual
Figure 24: 2040 Major Highway Congestion Map (AM Peak)
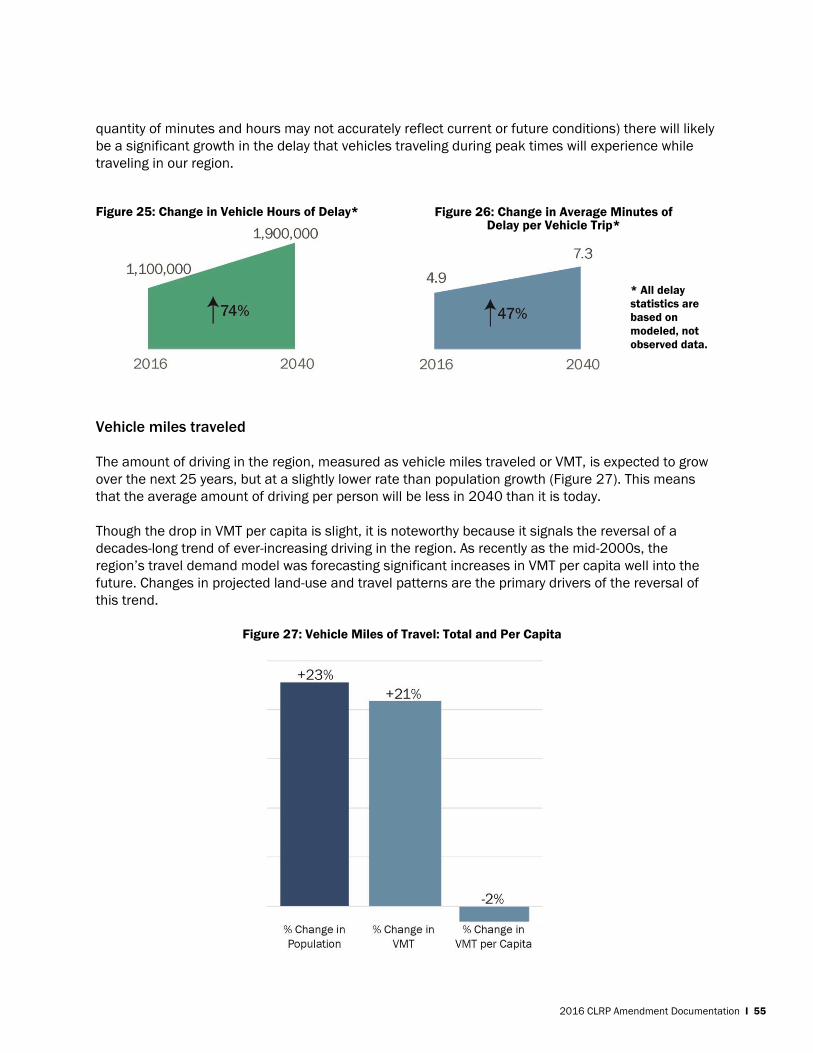
2016 CLRP Amendment Documentation I 55
quantity of minutes and hours may not accurately reflect current or future conditions) there will likely
be a significant growth in the delay that vehicles traveling during peak times will experience while
traveling in our region.
Vehicle miles traveled
The amount of driving in the region, measured as vehicle miles traveled or VMT, is expected to grow
over the next 25 years, but at a slightly lower rate than population growth (Figure 27). This means
that the average amount of driving per person will be less in 2040 than it is today.
Though the drop in VMT per capita is slight, it is noteworthy because it signals the reversal of a
decades-long trend of ever-increasing driving in the region. As recently as the mid-2000s, the
region’s travel demand model was forecasting significant increases in VMT per capita well into the
future. Changes in projected land-use and travel patterns are the primary drivers of the reversal of
this trend.
Figure 25: Change in Vehicle Hours of Delay*
Figure 27: Vehicle Miles of Travel: Total and Per Capita
Figure 26: Change in Average Minutes of Delay per Vehicle Trip*
* All delay
statistics are
based on
modeled, not
observed data.
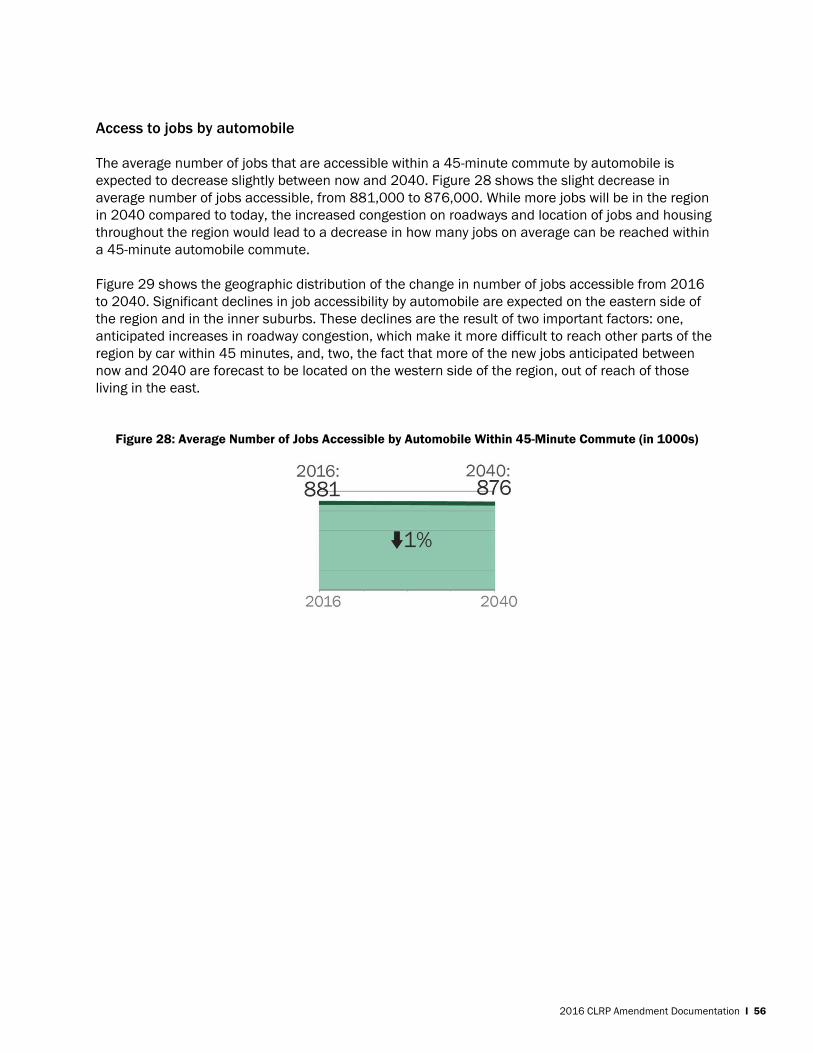
2016 CLRP Amendment Documentation I 56
Access to jobs by automobile
The average number of jobs that are accessible within a 45-minute commute by automobile is
expected to decrease slightly between now and 2040. Figure 28 shows the slight decrease in
average number of jobs accessible, from 881,000 to 876,000. While more jobs will be in the region
in 2040 compared to today, the increased congestion on roadways and location of jobs and housing
throughout the region would lead to a decrease in how many jobs on average can be reached within
a 45-minute automobile commute.
Figure 29 shows the geographic distribution of the change in number of jobs accessible from 2016
to 2040. Significant declines in job accessibility by automobile are expected on the eastern side of
the region and in the inner suburbs. These declines are the result of two important factors: one,
anticipated increases in roadway congestion, which make it more difficult to reach other parts of the
region by car within 45 minutes, and, two, the fact that more of the new jobs anticipated between
now and 2040 are forecast to be located on the western side of the region, out of reach of those
living in the east.
Figure 28: Average Number of Jobs Accessible by Automobile Within 45-Minute Commute (in 1000s)
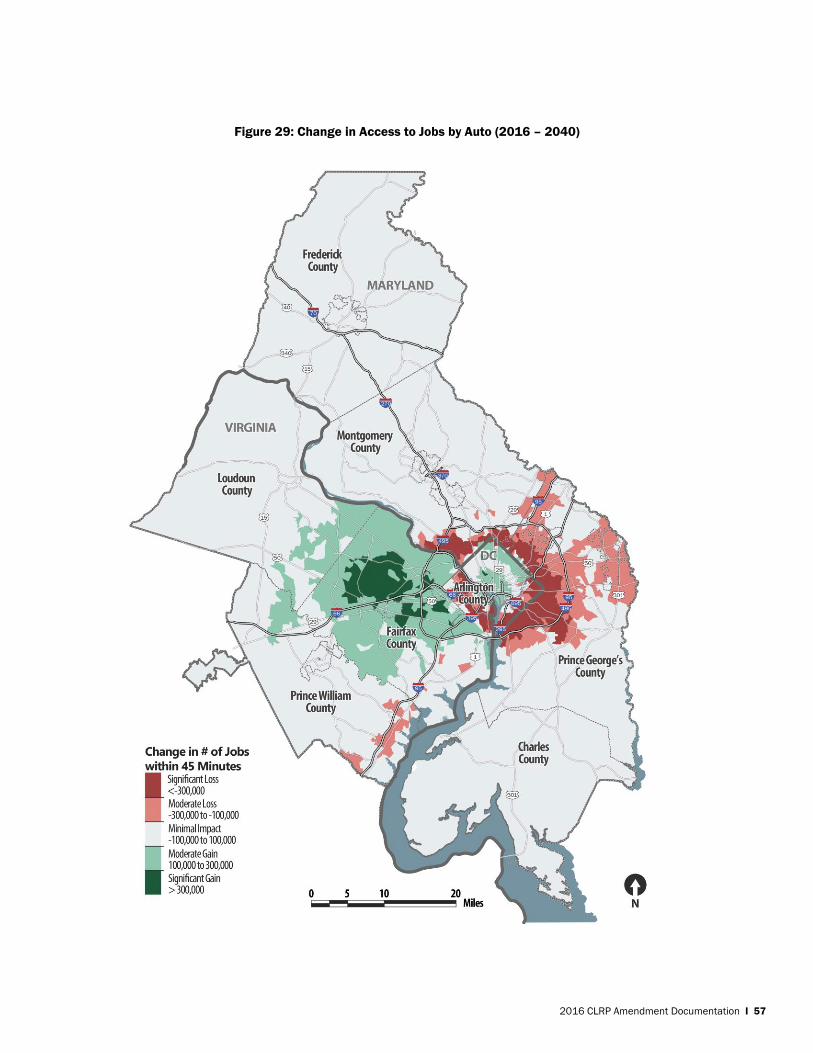
2016 CLRP Amendment Documentation I 57
Figure 29: Change in Access to Jobs by Auto (2016 – 2040)
2016 CLRP Amendment Documentation I 58
Access to Transit & Circulation in Activity Centers The Priorities Plan called for small capital improvements to promote circulation within Activity
Centers and to provide first-mile and last-mile connections to transit. Such improvements typically
emphasize walking and bicycling.
WHAT’S IN THE PLAN?
The CLRP does not include most bicycle and
pedestrian improvements that are in local
plans because most of them do not involve
federal funding. However, those types of
projects have great potential to increase local
access to transit stations as well as to improve
circulation within Activity Centers.
Projects in the plan which connect Activity Centers with high-capacity transit, as well as growth in
population and jobs within Activity Centers, can be analyzed for their relevance to this subject area
called for in the Priorities Plan.
HOW WOULD THE PLAN AFFECT ACCESS TO TRANSIT?
The land use forecasts used for the performance analysis shed light on the continuing trend
throughout the region of locating new population and jobs within Regional Activity Centers. Figure 30
shows that three out of five new residents in the region between 2016 and 2040 will move into
Activity Centers, and three out of four new jobs will be located in Activity Centers. Currently there is a
strong base of jobs in Activity Centers, and the continued growth will build on that base. Today more
people live outside of Activity Centers than live inside them, which will continue to be the case in
2040, however the growth rate of population moving to Activity Centers (48%) will outpace growth
outside of them (13%). While this is not a direct reflection of the projects in the CLRP, throughout the
region there is a desire to plan for connections between growth and transportation investments.
Due to the continued growth in Activity Centers, where transit is readily available, the transit projects
in the CLRP which connect Activity Centers will help improve region-wide access to transit. By 2040
there would be significant increases in high-capacity transit connections to Activity Centers (Figure
17). Currently, 59% of Activity Centers are connected to high-capacity transit, and by 2040 that will
increase to 69% of Activity Centers.
HOW WOULD THE PLAN AFFECT CIRCULATION WITHIN ACTIVITY CENTERS? Some Activity Centers will have connections to high-capacity transit for the first time as a result of
projects in the CLRP. Most these projects do not directly address circulation within those Activity
Centers because they typically will add one or two major transit stations or stops as opposed
providing local bus or bicycle and pedestrian enhancements. However, these projects can still
contribute to the improved circulation within Activity Centers by making transfers between transit
lines easier, creating public spaces, and drawing commercial or recreational attractions to busy
areas.
RTPP STRATEGIES: •Improve access to transit stops and stations •Enhance circulation within Activity Centers
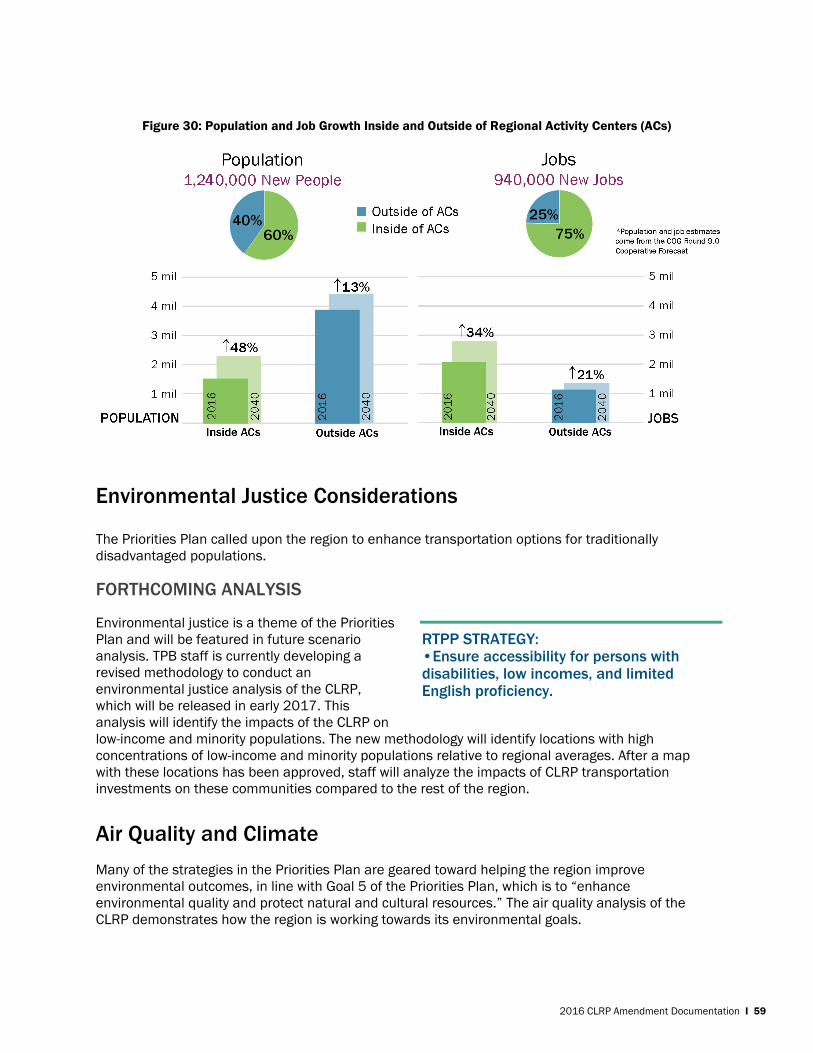
2016 CLRP Amendment Documentation I 59
Environmental Justice Considerations The Priorities Plan called upon the region to enhance transportation options for traditionally
disadvantaged populations.
FORTHCOMING ANALYSIS
Environmental justice is a theme of the Priorities
Plan and will be featured in future scenario
analysis. TPB staff is currently developing a
revised methodology to conduct an
environmental justice analysis of the CLRP,
which will be released in early 2017. This
analysis will identify the impacts of the CLRP on
low-income and minority populations. The new methodology will identify locations with high
concentrations of low-income and minority populations relative to regional averages. After a map
with these locations has been approved, staff will analyze the impacts of CLRP transportation
investments on these communities compared to the rest of the region.
Air Quality and Climate
Many of the strategies in the Priorities Plan are geared toward helping the region improve
environmental outcomes, in line with Goal 5 of the Priorities Plan, which is to “enhance
environmental quality and protect natural and cultural resources.” The air quality analysis of the
CLRP demonstrates how the region is working towards its environmental goals.
RTPP STRATEGY: •Ensure accessibility for persons with disabilities, low incomes, and limited English proficiency.
Figure 30: Population and Job Growth Inside and Outside of Regional Activity Centers (ACs)
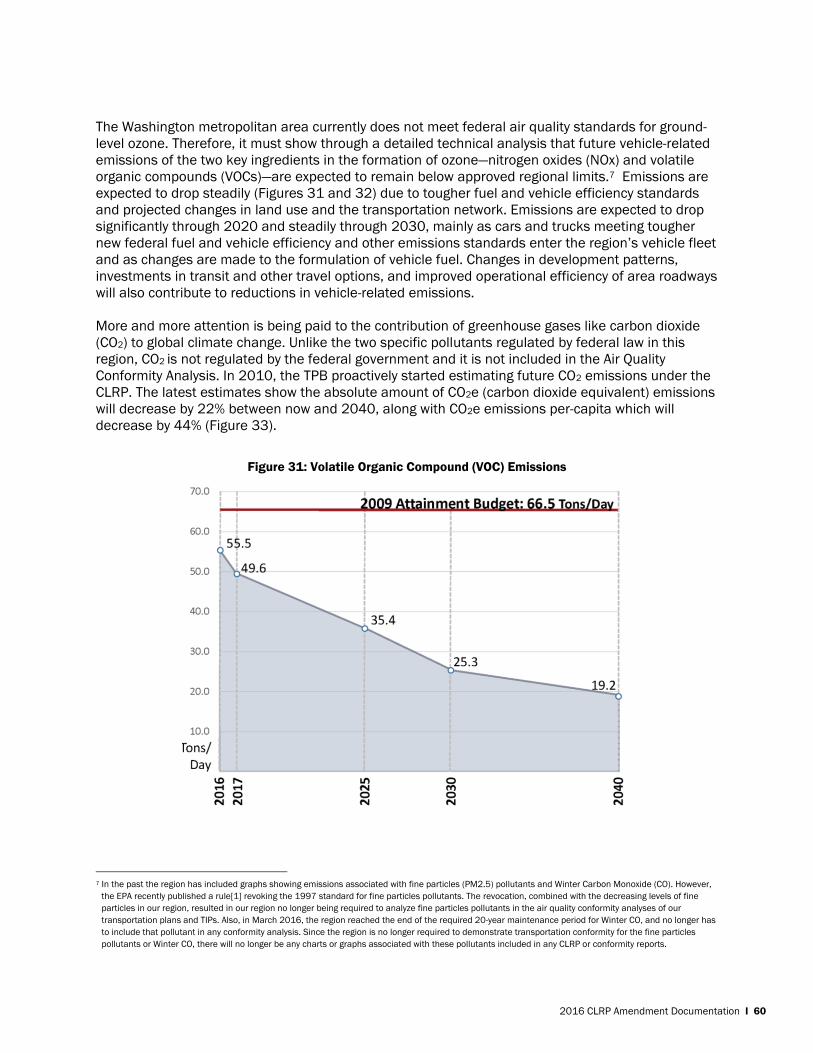
2016 CLRP Amendment Documentation I 60
The Washington metropolitan area currently does not meet federal air quality standards for ground-
level ozone. Therefore, it must show through a detailed technical analysis that future vehicle-related
emissions of the two key ingredients in the formation of ozone—nitrogen oxides (NOx) and volatile
organic compounds (VOCs)—are expected to remain below approved regional limits.7 Emissions are
expected to drop steadily (Figures 31 and 32) due to tougher fuel and vehicle efficiency standards
and projected changes in land use and the transportation network. Emissions are expected to drop
significantly through 2020 and steadily through 2030, mainly as cars and trucks meeting tougher
new federal fuel and vehicle efficiency and other emissions standards enter the region’s vehicle fleet
and as changes are made to the formulation of vehicle fuel. Changes in development patterns,
investments in transit and other travel options, and improved operational efficiency of area roadways
will also contribute to reductions in vehicle-related emissions.
More and more attention is being paid to the contribution of greenhouse gases like carbon dioxide
(CO2) to global climate change. Unlike the two specific pollutants regulated by federal law in this
region, CO2 is not regulated by the federal government and it is not included in the Air Quality
Conformity Analysis. In 2010, the TPB proactively started estimating future CO2 emissions under the
CLRP. The latest estimates show the absolute amount of CO2e (carbon dioxide equivalent) emissions
will decrease by 22% between now and 2040, along with CO2e emissions per-capita which will
decrease by 44% (Figure 33).
7 In the past the region has included graphs showing emissions associated with fine particles (PM2.5) pollutants and Winter Carbon Monoxide (CO). However,
the EPA recently published a rule[1] revoking the 1997 standard for fine particles pollutants. The revocation, combined with the decreasing levels of fine
particles in our region, resulted in our region no longer being required to analyze fine particles pollutants in the air quality conformity analyses of our
transportation plans and TIPs. Also, in March 2016, the region reached the end of the required 20-year maintenance period for Winter CO, and no longer has
to include that pollutant in any conformity analysis. Since the region is no longer required to demonstrate transportation conformity for the fine particles
pollutants or Winter CO, there will no longer be any charts or graphs associated with these pollutants included in any CLRP or conformity reports.
Figure 31: Volatile Organic Compound (VOC) Emissions
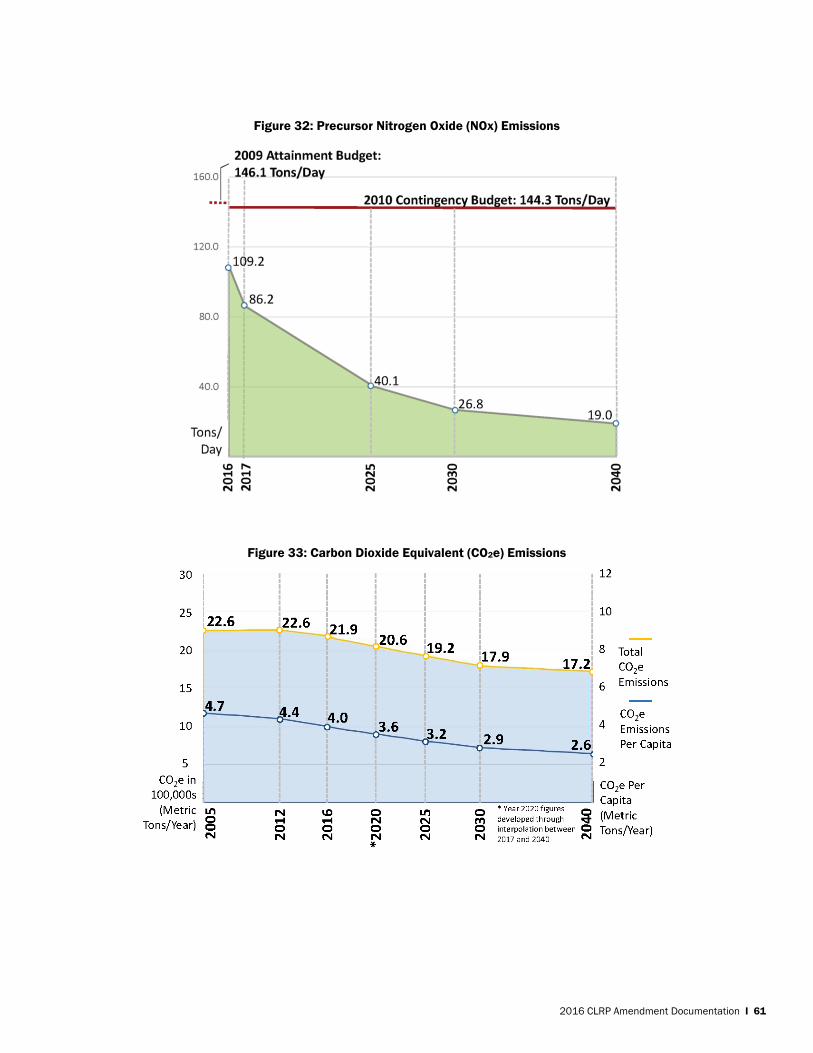
2016 CLRP Amendment Documentation I 61
Figure 32: Precursor Nitrogen Oxide (NOx) Emissions
Figure 33: Carbon Dioxide Equivalent (CO2e) Emissions
2016 CLRP Amendment Documentation I 62
Findings
In summary, the 2016 Amendment to the CLRP supports the priorities laid out in the Regional
Transportation Priorities Plan for maintenance, transit improvements, targeted congestion relief and
Activity Centers. A fundamental element of the CLRP is the region’s solid commitment to
maintenance, which is accounted for in the financial analysis.
Under the CLRP, by 2040 transit would be more widely available and more widely used. By 2040
there will be a 26% increase in new miles of high-capacity transit and overall transit ridership will
increase by 32%. Simultaneously, single-occupancy vehicle trips will decrease from 42% to 39%. Due
to the expanded transit network as well as new jobs coming to the region, job accessibility by transit
will increase by 31%. New transit capacity will parallel efforts to expand capacity on the existing
commuter rail network, but the region has not committed the necessary funds to expand existing
capacity on Metrorail for its Metro 2025 projects.
Congestion and delay will increase as a result of the increased demand on the roadway network from
new population and jobs located in the region. Congested lane miles in the AM peak hour are
expected to increase by 66% between 2016 and 2040 and total daily vehicle hours of delay are
expected to increase by 74%. Tolled lanes will provide alternatives to congested roads, as 213 of the
lane miles in the region will be tolled (18% of all new lane miles).
Most new growth will be in Activity Centers, which will allow for more transit and walking and biking
trips to be possible by 2040. Three out of four new people will live in Activity Centers, and three out
of five new jobs will be located in Activity Centers. Additionally, 69% of Activity Centers will have high-
capacity transit connections by 2040, compared to 59% in 2016.
2016 CLRP Amendment Documentation I 63
LOOKING AHEAD: THE 2018 UPDATE
The TPB will soon begin its next major four-year update of the long-range plan as required by federal
law. The update will include revised estimates of available revenue through the horizon year of the
plan. It will also include a new “unconstrained” element that identifies projects for which funding has
not yet been identified.
The purpose of the new “unconstrained” plan element is two-fold. First, it will help quantify and
highlight the region’s unmet transportation funding needs. The element will spell out hundreds of
projects that local jurisdictions have identified as priorities in their local plans but that remain
unfunded.
Second, the element will provide a foundation from which the region can identify a limited number of
key priority projects to rally regional leaders and the public behind in order to secure funding for the
investments. The 2018 CLRP Update must be adopted by the TPB by the end of 2018. The TPB is
currently developing a plan for involving the public in the update process.