financials - workshop · open circle capital is an early stage venture capital fund which aims to...
TRANSCRIPT

Private & ConfidentialPrivate & Confidential
Financials - Workshop
Presented by:

Private & ConfidentialPrivate & Confidential
— Introduction— Financial Projections— Revenue Forecasting— Exercise #1— Cost Structure— Exercise #2— Conclusion— Exercise #3
Agenda

Private & ConfidentialPrivate & Confidential
Introduction

Private & ConfidentialPrivate & Confidential
Audrius MilukasLECTOR
• Partner and CEO of VC fund Open Circle Capital
• Co-Founder of the largest non-banking alternative financing platform in Baltics – SME FINANCE
• 14-years experience in:- Finance- Banking- Customer relations- Startups’ environment- Investment banking
• Education: London Business School/BMI/VU
Introductions

Private & ConfidentialPrivate & Confidential
OPEN CIRCLE CAPITAL is an early stage venture capital fund which aims to invest up to 20M EUR in technology startups. Target Industries:
Product-oriented companies who have earned their first revenues, with strong potential for fast international growth
ICT— B2B SaaS— Marketplaces— Apps— Infrastructure
solutions
Teams of professionals with strong track records and leadership in their fields
Serial entrepreneurs who have past growth, fundraising and/or exiting experience are particularly welcome
We look for:First Revenue Strong teams Experience
Introductions
Deep tech— ML/AI— Deep data— Med-tech— Optics— Life-sciences
Robotics— Gadgets— Logistics and warehousing— Consumer electronics— Industry 4.0
Air & Space— Components— Actuators— Drone Components
Contact us:
www.opencirclecapital.lt

Private & ConfidentialPrivate & Confidential
Financial Projections

Private & ConfidentialPrivate & Confidential
Complete View for YourselfDetailed forecast for the 1 year period – monthly figures
Revenue Streams
Cost Structure
Investment Need
Cashflow Figures
Financial Projections

Private & ConfidentialPrivate & Confidential
Summary for Investors
Company is raising 150 000 EUR for 6 months period
Milestones:Developed ProductEstablished direct sales team – 5 specialists = 5k MRR.
Prove how much funding you need and what will be achieved in case of Investment
TIP:
It is recommended to raiseabout 20% more funding thanforecasted due to the highpossibility of unexpected costoccurrence
Financial Projections
Summary2019 Q1 2019 Q2 2019 Q3 2019 Q4
Recurring Revenue - 9,750 30,030 51,870 Monhtly Recurring Revenue - 5,250 11,880 20,520 Total Revenue - 9,750 33,030 56,370 Cost: Development 50,700 35,700 53,200 60,700 Cost: Sales and Marketing 5,000 30,000 45,000 60,000 Cost: IT Support 9,000 9,000 9,000 6,000 Cost: Other 4,500 4,500 4,500 4,500 Total Cost: 69,200 79,200 111,700 134,200 Income - Cost (Profit or Loss) 69,200- 69,450- 78,670- 77,830- Rolling Profit or Loss 69,200- 138,650- 217,320- 295,150- Income - Cost + Investment 80,800 11,350 132,680 54,850

Private & ConfidentialPrivate & Confidential
Long-Term Forecast: 3-5 Years PeriodHard to predict at early stage but is essential in order to show your ambitions and to understand if your business could be scalable/profitable in the long-term
TIP:
Venture Capital Investors wantsto see 10x opportunity beforemaking the investment
Hockey-Stick Growth
90667
3568
2019 2020 2021
Annual Recurring Revenue, thousands
Break-even Point
Financial Projections
Private & ConfidentialPrivate & Confidential
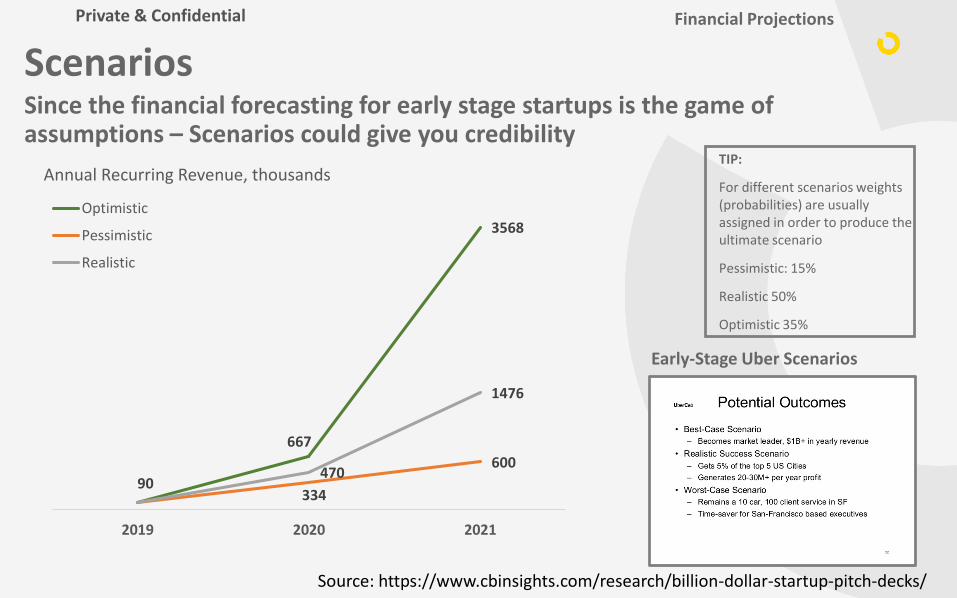
ScenariosSince the financial forecasting for early stage startups is the game of assumptions – Scenarios could give you credibility
TIP:
For different scenarios weights (probabilities) are usually assigned in order to produce the ultimate scenario
Pessimistic: 15%
Realistic 50%
Optimistic 35%
90
667
3568
334
600470
1476
2019 2020 2021
Annual Recurring Revenue, thousands
Optimistic
Pessimistic
Realistic
Early-Stage Uber Scenarios
Financial Projections
Source: https://www.cbinsights.com/research/billion-dollar-startup-pitch-decks/

Private & ConfidentialPrivate & Confidential
Revenue Forecasting

Private & ConfidentialPrivate & Confidential
Revenue Streams:Recurring revenue:• Subscription fees • SaaS• PaaS• Licensing content to third parties• Brokerage fees• Advertising fees…
Transaction-based revenue:Proceeds from sales of goods that are usually one-time customer payments.
Service revenue:Revenues are generated by providing services to customers and are calculated based on time. For example, the number of hours of consulting services provided.
Project revenue:Revenues earned through one-time projects with existing or new customers.
The recurring revenue model is the model most anticipated byInvestors because it is predictable and it assures the company’s sourceof revenue as ongoing
Terms to always remember:
MRR – Monthly Recurring Revenue
ARR – Annual Recurring Revenue
— LAW companies
— Consulting companies
— Software dev companies…
— Construction companies
— Infrastructure companies…
— Retail
— Hospitality…
Growth is important
VC requests that MRR growth is equal to 15-20% M-o-M
Revenue Forecasting
Private & ConfidentialPrivate & Confidential
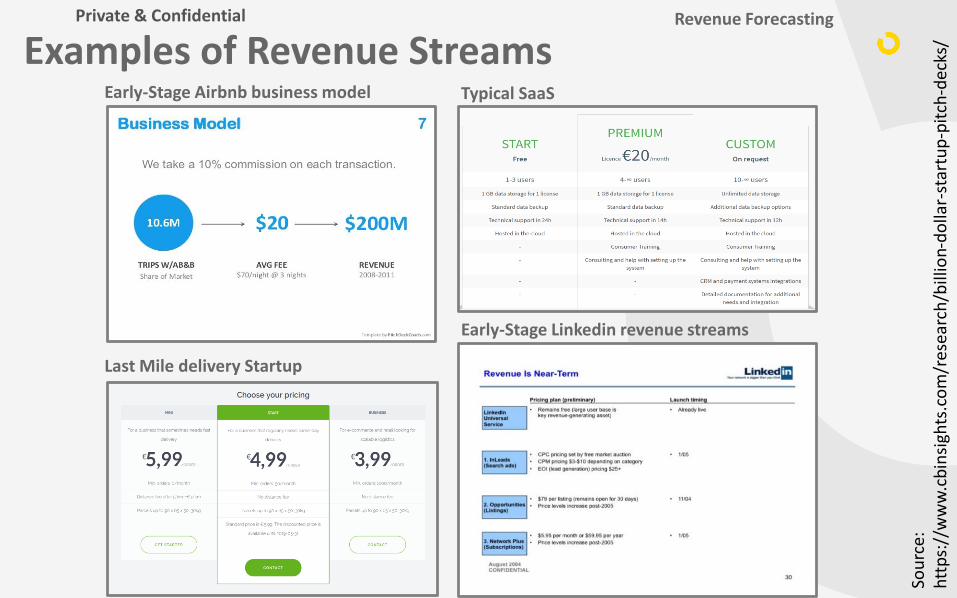
Examples of Revenue StreamsEarly-Stage Airbnb business model
Last Mile delivery Startup
Early-Stage Linkedin revenue streams
Typical SaaS
Revenue Forecasting
Sour
ce:
http
s://
ww
w.c
bins
ight
s.co
m/r
esea
rch/
billi
on-d
olla
r-st
artu
p-pi
tch-
deck
s/

Private & ConfidentialPrivate & Confidential
Sales Channels• Direct Sales Direct selling deals can be closed via personal arrangements, in-person demos, and of course viaonline direct sales. A direct sales channel requires building and managing a sales team.• Inbound MarketingContent marketing/Social Media/Paid Ad campaigns• Outbound MarketingTraditional advertising (TV/RADIO/Press)• DistributorsValue added Resellers/Partners/Agents/Integrators/Retail/E-Commerce
Early-Stage Dropbox Sales Channels Early-Stage WeWork list of partners
Important Metrics in order to value sales channel:
LTV – Customer lifetime value
CAC – Customer Acquisition Cost
LTV/CAC – 3:1
Revenue Forecasting
Sour
ce:
http
s://
ww
w.c
bins
ight
s.co
m/r
esea
rch/
billi
on-d
olla
r-st
artu
p-pi
tch-
deck
s/

Private & ConfidentialPrivate & Confidential
Assumptions/Drivers/MetricsRevenue in your financial plans should be a derived number – meaning that behind every revenue entry should be assumptions and rationaleSimplified Example:Total Projected Sales Leads -> Conversion Rate -> Total projected paying clients x Avg Price -> Revenue
In order to always monitor your assumptions/drivers you need to maintain Metrics sheet:
Key Revenue-Related Metrics:
Source: a16z.com
Revenue Forecasting

Private & ConfidentialPrivate & Confidential
Exercise #1REVENUE FORECASTINGBuild your company’s revenue model for 12 months. Thinkabout what type of revenue streams (income) are you goingto have and what type of sales channels are you going touse. How many customers can you expect? How many unitswill be sold or clients served? How will you price yourproduct/service?
Think of all possible revenue streams and channels and show them separately. Draw sales channels graph.
Calculate / predict:
• Quantity (units, number of daily sales)• Selling price (EUR, in average)
Sales Channels Graph - Example
Revenue Forecasting - Example
TIME: 20 Minutes
Exercise #1

Private & ConfidentialPrivate & Confidential
Cost Structure

Private & ConfidentialPrivate & Confidential
StructureIt is recommended to structure cost according to set milestonesHow much cash you need to burn in order to achieve quantified goals
• DevelopmentR&D, salaries of tech/business dev employees, contracts etc.
• Cost of Goods Sold (COGS)Variable costs – increase at around constant rate to output/revenue (materials etc.)
• Sales and MarketingDirect Sales, Content Marketing, Paid-Marketing
• Support• Other
Fixed Costs: Rent, Legal, Accounting, Admin
Cost Structure
Costs: DevelopmentSalaries: 11,900 11,900 11,900 CEO 2,500 2,500 2,500 CMO 2,200 2,200 2,200 CTO 2,200 2,200 2,200 Other key people - - - Other 5,000 5,000 5,000 Contracting: 5,000 5,000 5,000 Position 1 (Name Surname) 5,000 5,000 5,000 Total: 16,900 16,900 16,900 Costs: MarketingCustomer relationships (Sales, research, marketing) - - 5,000 Total: - - 5,000 Costs: IT costsServers & related costs 3,000 3,000 3,000 Equipment - - Total: 3,000 3,000 3,000 Costs: OtherFacilities 500 500 500 Legal + Investment 500 500 500 Acountant 500 500 500 Unexpected expendidures - - - Other - - - Total: 1,500 1,500 1,500 Total costs: 21,400 21,400 26,400

Private & ConfidentialPrivate & Confidential
Importance of Cash-FlowsAccording to the analysis by CB Insights – 29% fail due to they ran out of cash – 2nd most common reason.
It is essential to always monitor your cash-flow situation and use techniques in order to enhance it
Simple techniques- Accelerate Payments – for instance try to charge on the annual basis instead of monthly basis.- Delay your payments as much as you can- Reduce your need for inventory – optimize the process- Alternative Financing – Factoring
Key Cashflow-Related Metrics:
Source: a16z.com
Cost Structure

Private & ConfidentialPrivate & Confidential
Break-even Point and MarginsIt is essential to forecast the point in the future when you will start to generate profit
Break-Even Point – point where total revenue and total cost are equalConduct Break-Even analysis:
- Determine and evaluate your fixed and variable cost and their patterns;- Evaluate your pricing strategy in context of break-even perspective;- Find out the output (units, clients, licenses) at which your total cost and total revenue would be equal;- Make the forecast – when you will be able to reach break-even enabling amount of units.
Margins – critical metrics to understand rationale behind your business:
Gross profit Margin: (Sales – COGS)/Sales. It indicates how efficiently management uses supplies and production. % Depends on the industry. For software startups margin should be around 50-80%Operating profit Margin: (Sales – COGS – Operating expenses)/SalesNet profit Margin: Net Income/Sales
Cost Structure

Private & ConfidentialPrivate & Confidential
Exercise #2Cost StructureBuild your company’s cost model for 12 months. You don’tneed to do an incredibly detailed breakdown (such as listingthe cost every chain you plan to purchase), but you do needgeneral figure of staff, office, tools/software, marketing, etc.It will give you an approximate investment needs for the 1st
business year.
Calculate / predict by category:
• Solution features (R&D/ Development)• Operations (Manufacturing/Support)• Marketing and Sales• Other
Structure of Total Cost- Example
TIME: 20 Minutes
Cost Model - Example
Exercise #2

Private & ConfidentialPrivate & Confidential
Conclusion – Key PointsFinancial Projections:• Detailed forecast for the 1 year period – monthly figures• Summarize data for Investors – Set Milestones• Long-Term Forecast: 3-5 Years period• Sales Growth is important: Benchmark 15-20%
Revenue Streams:• Recurring Revenue• Transaction-based Revenue• Service Revenue• Project Revenue
Sales Channels:• Direct Sales• Inbound Marketing• Outbound Marketing• Distributors
Cost Structure:• Development• COGS• Sales and Marketing• Support• Other
Importance of Cash-Flow:
METRICS:
Source: a16z.com
Conclusion

Private & ConfidentialPrivate & Confidential
Exercise #3Prepare Slide “Financials”Combine your Revenue Model and Cost Structure.
This slide should represent your costs and revenues in 1st
year. Show how much does it cost to make and to sell yourproduct/service, explain the cost structure.
TIME: 10 Minutes
Exercise #3

Private & ConfidentialPrivate & Confidential
Contact us:
www.opencirclecapital.lt
Thank you