finding the value of urban parking: an analysis of the ... · finding the value of urban parking in...
TRANSCRIPT

Finding the Value of Urban Parking: An Analysis of the
Impacts of Smart Parking Systems on Congestion and
Land Values in Downtown Houston
Final Report
PRC 17-88 F

Finding the Value of Urban Parking: An Analysis of
the Impacts of Smart Parking Systems on
Congestion and Land Values in Downtown Houston
Texas A&M Transportation Institute
PRC 17-88 F
January 2018
Authors
Brett Huntsman
Phil Lasley
Madison Metsker-Galarza
Copies of this publication have been deposited with the Texas State Library in compliance with the State Depository
Law, Texas Government Code §441.101-106.
Finding the Value of Urban Parking
In this report, researchers examined smart parking, a parking management tool that helps drivers
efficiently find and pay for available parking by knowing where they will park before reaching
their destination. This can prompt more traffic to have a definitive destination when exiting from
major roadways near dense urban areas, potentially leading to increased efficiencies of existing
parking structures and land use. Smart parking can also reduce congestion, 30 percent of which
in urban cores is attributable to drivers searching for parking spaces. Researchers anticipate that
smart parking systems will spark property redevelopment as land values increase and parking
demand patterns change. A number of observations emerged from the study, which used
downtown Houston as a case study.
Using value capture mechanisms to collect revenues from smart parking improvements,
an urban core and existing roadway networks would, if marginal property tax revenues
exceed the cost of implementing and maintaining the system, receive congestion benefits
and property value increases for no additional taxes or fees to the property owners. The
revenues would come solely from the taxes levied on increased property values instead of
diverting funds or raising taxes.
Study results estimate about $4.4 million per year in congestion savings for the City of
Houston if a smart parking system were to be implemented (though implementation and
maintenance costs are not estimated).
The potential value of redevelopment of surface parking in the analysis area ranges from
$82 million to $722 million, based on a variety of different land uses. Using tax
increment financing, the estimated additional annual tax revenue from increased property
values is estimated between $575,000 and $4.7 million, depending on the new land use.
Estimates are subject to current landowners’ willingness to sell or redevelop property. As
such, these results are hypothetical and are intended to determine whether there is
unleveraged value in the redevelopment of parking.
There are approximately 10 acres of government owned, tax-exempt surface parking
within the central business district (CBD). While data on the value of this land is not
available, these parcels offer ideal opportunities for public-private partnerships to occur.
Improvements to transportation infrastructure at the local level will also benefit the state
system; therefore, encouraging local transportation initiatives, in many cases, may
increase efficiency of the state system, delaying or eliminating the need for the state to
fund other, costlier transportation improvements.
While this report is narrow in scope, researchers believe that the findings are applicable
to not only other CBDs within Texas, but also to surrounding urban areas.
1
Table of Contents
List of Figures ................................................................................................................................. 3
List of Tables .................................................................................................................................. 3
Executive Summary ........................................................................................................................ 4
Approach ..................................................................................................................................... 4
Analysis ...................................................................................................................................... 5
Literature Review Summary ....................................................................................................... 5
Results ......................................................................................................................................... 6
Congestion Saving and Occupancy ........................................................................................ 6
Added Value and Revenue ...................................................................................................... 6
Considerations ............................................................................................................................ 7
Introduction ..................................................................................................................................... 8
Project Purpose ............................................................................................................................... 9
What Is Parking Management? ..................................................................................................... 12
What Is Smart Parking? ............................................................................................................ 13
Smart Parking Systems ............................................................................................................. 13
Smart Parking Concepts ............................................................................................................ 14
Project Financing through Value Capture ..................................................................................... 16
What Is Value Capture? ............................................................................................................ 16
Value Capture Methods ............................................................................................................ 16
Tax Increment Financing ...................................................................................................... 17
Transportation Reinvestment Zones ..................................................................................... 19
Special Assessment District .................................................................................................. 20
Other Value Capture Options ................................................................................................ 20
Value Capture as Opportunity for Local Governments ........................................................ 22
Smart Parking Case Studies .......................................................................................................... 24
SFpark, San Francisco, California ............................................................................................ 24
Results ................................................................................................................................... 25
Downtown Columbus, Ohio ..................................................................................................... 25
Results ................................................................................................................................... 26
Smart Parking Systems, Istanbul, Turkey ................................................................................. 26
Results ................................................................................................................................... 27
Future Expansion of the Smart Parking System ................................................................... 27
Value Capture Redevelopment Case Studies ................................................................................ 28
Center for Neighborhood Technology ...................................................................................... 28
U.S. Government Accountability Office .................................................................................. 29
Analysis......................................................................................................................................... 32
Data Collection and Parking Inventory Development Database .............................................. 32
Methodology: Smart Parking Systems and the Congestion Benefit ......................................... 32
Estimating the True Mean Percent Occupancies of Parking Facilities ................................. 32

2
Estimated Congestion Benefits of a Smart Parking System ................................................. 34
Methodology: Value Added and Revenue Estimation ............................................................. 36
Existing Tax Increment Financing Districts ......................................................................... 37
Redevelopment Identification ............................................................................................... 39
Estimated Redevelopment Value .......................................................................................... 40
Tax Increment Financing ...................................................................................................... 41
Results ................................................................................................................................... 41
Considerations of Findings ................................................................................................... 44
Summary ....................................................................................................................................... 45
References ..................................................................................................................................... 46

3
List of Figures
Figure 1. Parking Inventory – Downtown Houston (2017). ......................................................... 10
Figure 2. Tax Increment Financing. .............................................................................................. 19
Figure 3. Congestion Analysis Road Network. ............................................................................ 35
Figure 4. Tax Increment Reinvestment Zones in Downtown Houston. ....................................... 39
List of Tables
Table 1. Texas Value Capture Funding and Financing Options Authorized by Law. .................. 17
Table 2. Common Responsibilities of a TIF Board. ..................................................................... 18
Table 3. Estimated Captured Revenues from Parking Lot Redevelopment. ................................ 28
Table 4. Major Transit Infrastructure Projects Funded by Value Capture. .................................. 30
Table 5. Total and Sampling Size of Each Parking Facility. ........................................................ 33
Table 6. Summary Statistics and Confidence Intervals for the True Mean Percent Occupancy
by Parking Facility. ........................................................................................................... 34
Table 7. Estimated Congestion Benefit for Downtown Houston. ................................................ 36
Table 8. Land Use Estimated Assessed Value per Improved Square Foot and Floor
Multiplier. ......................................................................................................................... 40
Table 9. Total Surface Parking Area for Analysis. ....................................................................... 40
Table 10. Potential Incremental Assessed Value, Outside of Existing TIRZ. .............................. 42
Table 11. Estimated Average Annual Tax Increment Revenue, Outside of Existing TIRZ ......... 42
Table 12. Potential Incremental Assessed Value, Inside of Existing TIRZ.................................. 44

4
Executive Summary
As of 2010, nearly 85 percent of the Texas population lived in an urban area.1 According to
Texas demographers, the state population is expected to more than double by 2050,2 most of
which will occur in urban areas. As the largest metropolitan areas within the state grow at an
exponential rate, the ability for local governments to address the challenges of congestion and
safety become increasingly important. While many of the efforts to address congestion and
safety and their financing are being made at the local level, they can directly impact some of the
most congested roadways on the state system. Therefore, research is needed to examine ways in
which the adoption of innovative technologies at the local level might impact the efficiency of
state infrastructure, while identifying opportunities to leverage funding for such programs.
Approach
For this report, researchers have examined smart parking, which is a parking management tool
that uses various technologies to aid drivers in efficiently locating and paying for available
parking. Smart parking systems allow drivers to know where they will park before reaching their
destination, in turn prompting more traffic to have a definitive destination when exiting from
major roadways near dense urban areas. This leads to increased efficiencies of existing parking
structures and land use, while also reducing congestion on both local and state roads. These
systems work by allowing drivers to know where they will park before reaching their destination.
Transportation investments such as these have the potential to increase overall accessibility,
increasing land values in turn. Non-exempt properties with higher land values will pay a larger
amount in ad valorem taxes to the different entities that have jurisdiction of the property. To
provide funding for this system, researchers began identifying innovative strategies to capture
this incremental property value change.
Researchers anticipate that the implementation of smart parking systems will spark property
redevelopment within an urban core, as land values increase and parking demand patterns
change. Any parcel can be redeveloped to a certain extent, however, parcels with high land value
and lower improvement values would be more likely to redevelop first. Surface parking lots, in
this case, would be prime sites for redevelopment as the existing improvement value is typically
low, and changes in parking patterns are expected to affect these lots the most. This report
focuses on land use changes of these types of properties.
Using value capture mechanisms to collect revenues from smart parking improvements, an urban
core and existing roadway networks would, if marginal property tax revenues exceed the cost of
implementing and maintaining the system, receive congestion benefits and property value
increases for no additional taxes or fees to the property owners. The revenues would come solely
from the taxes levied on increased property values instead of diverting funds or raising taxes.
1 U.S. Census Bureau 2010 Decennial Census estimates of population in designated urban areas. 2 Based on 2010–2050, Texas State Data Center population projections.

5
Analysis
For this report, researchers chose downtown Houston as a case study to identify whether these
benefits exist, and if there are opportunities available to leverage funding. An investigation into
available data for the Houston central business district (CBD) shows that parcels being used
entirely for public surface parking encompass approximately 16 percent of all developed acreage
in downtown Houston, yet account for less than 3 percent of the total assessed value.3 There are
also approximately 10 acres of government owned, tax-exempt surface parking within the CBD.
While data on the value of this land is not available, these parcels offer ideal opportunities for
public-private partnerships to generate additional parking and tax revenues.
This reports follows the following structure to conduct the analysis:
Literature review of parking management systems and value capture mechanisms.
Case study review of existing smart parking deployments and value capture usage for
transportation investments.
Data collection of existing roadway congestion levels within the Houston CBD.
Data collection of current Houston parking inventory and respective land values.
Analysis of smart parking benefits, including congestion reduction and existing parking
efficiencies.
Estimation of value added through the redevelopment of existing surface parking lots,
and potential revenue through value capture mechanisms.
Literature Review Summary
The literature and case study reviews of smart parking show that while there are many forms of
parking management available, there have been limited instances of large scale smart parking
deployments in the United States. The smart parking systems deployed in San Francisco, CA,
(SFpark) and Columbus, OH, serve as examples for domestic deployments. Smart parking
systems (SPS) in Istanbul, Turkey, represents an international case study.
There are numerous case studies for using value capture mechanisms to fund transportation
improvements, but only one report attempted to identify parking redevelopment as a source of
new tax income. To supplement this report, researchers examined case studies of actual revenues
that have been acquired through value capture, and how those have covered project costs.
3 Calculations using Harris County Appraisal District (HCAD) data along with the reported 2017 parking inventory
collected by the Houston Downtown District and TTI. Includes tax-exempt properties.

6
Results
Congestion Saving and Occupancy
The analysis revealed that the introduction of a SFpark-style smart parking system in downtown
Houston would provide close to 200,000 hours per year of congestion delay reduction with the
city experiencing a $4.4 million savings per year in congestion costs. Furthermore, an analysis
on the existing parking inventory revealed a significant oversupply and inefficient spatial
distribution and use of parking. The analysis suggests that public parking garages are used most
efficiently with daily occupancy between 53 and 80 percent (with a mean occupancy of
66 percent). Public and private surface lots are used much less efficiently, ranging between 27
and 68 percent occupancy (with means of 54 and 46 percent, respectively). Researchers noted
that there is also a significant spatial imbalance of supplied parking compared to demand. This
oversupply of parking may grow further if a smart parking system is introduced that focuses on
efficiency and spatial distribution using dynamic pricing. Greater efficiency would leave some
lots empty, which would in turn motivate some lots to redevelop into higher uses.
Added Value and Revenue
To estimate potential added value and increment tax revenue, researchers identified assessed
values per land use type currently in downtown Houston. These values allowed for the
calculation of potential redevelopment value of surface parking lots analyzed as part of this
report. Potential redevelopment includes converting surface parking into a land use already
present in downtown Houston, such as mid- or high-rise apartments or offices. The results of the
analysis suggested a potential added taxable value through redevelopment of all surface parking
outside of existing TIRZs between approximately $82 million and $722 million. Redevelopment
within existing TIRZs could produce between $562 million and $6 billion of added taxable value
in a given year (using 2020 for an analysis year). This represents a range of possible land uses
and their calculated value in this project.
Once a potential incremental taxable value was calculated, researchers determined whether there
were opportunities to capture that value and convert it into revenue. Tax increment financing
provides the most suitable approach. As there are two existing TIRZs in downtown Houston,
researchers identified the surface parking outside of these zones, indicating parcels that had no
tax increments obligated to an established authority.
Researchers developed a hypothetical tax increment financing model to calculate revenues over a
20-year period. Using set parameters and 2017 tax rates, surface parking lot redevelopment is
estimated to generate between $575,000 and $4.7 million average incremental annual revenue.
These figures would vary based on tax entity participation rates, growth rates, added value to
existing developments, and the amount of surface parking redeveloped.
7
Considerations
While many elements of this analysis are built on hypothetical scenarios, due to non-zoning laws
in Texas, land owners have the right to develop property as they see fit, given that they meet any
state, county, and local development regulations. For this research, we assume that some land
owners would choose to redevelop based on market pressures due to income reduction from the
introduction of smart parking systems and increasing opportunity costs. However, there are a
multitude of variables affecting property owners’ decisions to buy, sell, or redevelop property.
As such, these results are hypothetical and are intended to determine whether there is
unleveraged value in the redevelopment of parking.
Another aspect of redevelopment worthy of consideration is the role of public agencies engaging
in public-private partnerships to invest in overhauling surface parking. The research conducted in
this report strongly suggests that there are millions of dollars of potential redevelopment of
surface lots in the Houston CBD. However, there are also approximately 10 acres of government
owned, tax-exempt surface parking within the Houston CBD. While data on the value of this
land are not available, these parcels offer ideal opportunities for public-private partnerships to
occur.

8
Introduction
As of 2010, nearly 85 percent of the Texas population lived in an urban area.4 According to
Texas demographers, the state population is expected to more than double by 2050,5 most of
which will occur in urban areas. This level of growth raises concerns of not only the efficiency of
existing transportation infrastructure, but also the ability of future infrastructure funding to meet
the needs of the population. Traditional funding mechanisms are becoming less effective, and the
need for innovative funding and financing programs is increasing. New revenue sources, such as
Proposition 1 (83(3)) regarding oil and gas tax revenues and certain sales tax revenues dedicated
through Proposition 7 (84R) provide relief, but gaps between revenue and needs remain (1, 2, 3).
These funding challenges are then shared with local governments, all of which have unique
challenges in funding transportation. As such, innovative strategies to supplement infrastructure
investments within urban areas are needed.
Increasing the efficiency of new and existing infrastructure, expanding multi-modal options, and
encouraging employment changes such as flexible work hours, telecommuting, and employment
locations are all strategies for local governments to consider. As technological innovations are
being introduced, new congestion reduction and mobility strategies are becoming available.
Research is needed to examine ways urban areas can utilize these new strategies to improve
accessibility and reduce congestion in their area. As gaps in funding introduce additional barriers
to implementation for state and local governments, innovative financing solutions should also be
examined. Decisions made at the local level can result in a direct impact on some of the most
congested roadways in the state system.
4 U.S. Census Bureau 2010 Decennial Census estimates of population in designated urban areas. 5 Based on 2010–2050, Texas State Data Center population projections.

9
Project Purpose
The purpose of this report is to investigate smart parking, a strategy that has developed from
recent technological advances, and its effects on congestion in urban areas. Smart parking, a
form of parking management, is a system which uses various technologies to aid drivers in
efficiently locating and paying for available parking. This report examines how investments into
these systems by local governments could reduce congestion and increase accessibility within
urban centers. Smart parking systems allow drivers to know where they will park before reaching
their destination, in turn prompting more traffic to have a definitive destination when exiting
from major roadways near dense urban areas. Dynamically priced street spaces based on current
demand can ensure that parking is used efficiently and available when and where needed. This
serves to lessen congestion within downtowns as drivers could spend less time searching for
parking; it is estimated that approximately 30 percent of traffic congestion in these areas is
attributable to drivers searching for parking (19). These improved efficiencies could lead to
downtowns becoming more accessible and thus, more attractive to businesses and customers.
Researchers considered the opportunity to generate funding for these technologies by
capitalizing on the resulting efficiencies through the redevelopment of existing excess and
underutilized surface parking. Researchers analyzed the effectiveness of selected value-capture
methods set in place by local governments to capture incremental differences in assessed values
as redevelopment occurs. While it is possible that any parcel can be redeveloped to a certain
extent, parcels which have high land value and lower improvement values would be more likely
to be redeveloped first. Surface parking lots, in this case, would be the most reasonable sites for
redevelopment as the existing improvement value is typically low.
Redevelopment of these sites could offer the same level of service while generating additional ad
valorem tax revenues for local governments and sales tax revenue for the state (the latter not
discussed in this report). There is also potential economic gain for the state as additional parking
may stimulate economic growth arising from the increase in accessibility generated by smart
parking management. An investigation into available data shows that parcels being used entirely
for public surface parking encompass approximately 16 percent of all developed acreage in
downtown Houston, yet account for less than 3 percent of the total assessed value.6 Figure 1
illustrates the amount of land used for parking in downtown Houston per available data and
onsite observations.
While these surface lots may provide valuable services to nearby facilities, they are
underdeveloped in terms of assessed value when compared to structured parking and other land
uses. Reports of underdeveloped parking from other downtowns in Texas and other states show
that these opportunities are not unique to Houston. While this report focused on the Houston
6 Calculations using Harris County Appraisal District (HCAD) data along with the reported 2017 parking inventory
collected by the Houston Downtown District and TTI. Includes tax-exempt properties.

10
central business district (CBD) as a case study, it is likely that similar conditions exist in many
other urban cores across the state.
Source: Harris County Appraisal District (CAD), Houston Downtown District, Texas A&M Transportation Institute
(TTI)
Figure 1. Parking Inventory – Downtown Houston (2017).
Researchers gathered assessed value, lot size, construction costs (where applicable), the parking
inventory of individual parcels, and occupancy rates for parking on each selected block. This
information was obtained from available sources on downtown Houston, as well as on-site
analysis where researchers confirmed and updated the nature of the parking. The data were used

11
to estimate average potential annual revenues and the change in assessed value for all parcels,
whether in an existing TIF (tax increment financing) district or not.
The results of this part of the analysis should not be used to inform detailed development plans,
since they do not account for all potential costs or barriers unique to each municipality. The
results of the analysis are to present an estimation of possible value capture through
redevelopment.
To conduct the analysis, researchers collected key information through several steps:
Literature review of the following:
o Definition and types of smart parking systems available.
o The effects of smart parking systems on land value and land usage.
o Brief overview of the most common value capture strategies for funding
transportation.
o Use of value capture to leverage funding from site redevelopment.
Case study review of the following:
o Existing smart parking programs and their effects on accessibility, congestion,
land value, and usage.
o Value methods capture being used in conjunction with site redevelopment to
generate funding or financing for transportation projects.
Researchers used the collected information to estimate potential benefits in terms of congestion
reduction, funding, land values, and accessibility that can be leveraged through the
implementation of such mechanisms and to describe associated costs. Furthermore, researchers
created a model framework that municipalities or the State can use to realize the potential
congestion and economic benefits in urban areas throughout the state.

12
What Is Parking Management?
Parking management is the use of various techniques and strategies to administer the availability
and price of parking in crowded, high-activity areas, such as downtowns. When optimally
enacted, these strategies work to reduce congestion on the surrounding roadways and spur
economic development in an area. Urban areas could often make better use of scarce and
expensive parking resources through the conversion of parking lots into buildings, as unmanaged
parking restricts infill development and redevelopment (7). Effective parking management can
spur the development of underutilized parking lots, yielding increases in tax revenues to cities,
which may also increase revenues for the state. To illustrate costs, the following provides an
order of magnitude of capital costs and operational and maintenance (O&M) costs for subsurface
parking in suburban, urban, and central business districts (CBDs) (4):
Suburban surface parking: $2.42 per space per day ($200,000 per acre land, $5,000 per
space capital cost, $200 per space per year O&M).
Urban three-story parking structure: $7.44 per space per day ($500,000 per acre land,
$23,800 per stall capital cost, $300 per space per year O&M).
CBD underground structure: $11.16 per day ($0 land cost, $40,000 per space capital cost,
$500 per space per year O&M).
Through deploying effective parking management strategies, cities and states will increase the
efficiency of space devoted to parking and reduce underutilized parking for (5):
A given population.
A specific level of economic activity.
Or a building area.
The Institute of Transportation Engineers (ITE) Parking Generation Handbook seeks to illustrate
different approaches cities can take to reduce the amount of parking and maximize efficiency.
Note the data used for this paper does not endorse the ITE standards, but rather is used as an
example to illustrate an approach. The average level in the ITE Parking Generation Handbook
for office building parking is 2.84 spaces per 1,000 square feet compared to the conventional
approach of 4 spaces per 1,000 square feet (4). Thus, in an office building of 100,000 square feet,
the typical building requirement would contribute to the overbuilding of 116 spaces, with many
of the buildings built to this standard contributing to unused parking spaces (4).
The highest building rate (highest rate of required parking for new construction) and highest
parking utilization of these spaces is 5.58 spaces per 1,000 square feet providing sufficient
parking for an office building (4).
7 The development of buildings in vacant areas usually in urban areas that are already largely developed.

13
With this type of approach, cities can adopt parking management strategies that aim to maximize
the efficiency of space use. Parking management strategies for this purpose include:
Space designations.
Shared parking.
Space search (driver looking for a parking space).
Space turnover.
Parking density.
Off-site parking.
Smart parking.
This report will focus on the smart parking strategy. Note that there are now many other
resources for parking management techniques other than the ITE Handbook.
What Is Smart Parking?
Smart parking is a form of parking management that consists of a variety of systems to help
reduce traffic congestion, space search time, travel time, and vehicle miles traveled (VMT) while
maximizing the utilization efficiency of developed land. Smart parking uses equipment and
technologies such as cameras, wireless communications, data analytics, induction loops, smart
parking meters, and advanced algorithms to gather information, predict future parking patterns,
and manipulate parking strategies to create a more dynamic and efficient parking system. No
single technology is proven to be the most effective in creating a dynamic parking system for
cities; this report posits that the integration of a combination of the available technologies along
with effective parking practices and concepts can be used to create the system most appropriate
for a specific city.
Smart Parking Systems
Smart parking systems can be subdivided into five categories: parking guidance and information
systems (PGIS), transit based information systems, smart payment systems, E-parking, and
automated parking (6).
Parking Guidance and Information Systems (PGIS): Provide information for drivers to
aid in the decision-making process involved in reaching their destination and locating
vacant parking spaces within the parking facility. PGIS consists of smart systems such as
static/dynamic variable message signs (VMS); global positioning systems (GPS) within
mobile phones; and vehicle detection sensors. VMS can help direct drivers to open lots as
they near their desired destination. The GPS within the vehicle can interface with a
parking guidance system to help direct drivers to parking lots using their current location,

14
and vehicle detection sensors installed at parking lot entrances/exits/or individual spaces
can detect vehicle occupancy.
Transit Based Information Systems: Uses the same technology as PGIS except that its
goal is to guide users to park-and-ride facilities. Real-time information includes public
transit schedules and traffic conditions, which provide users with the ability to make the
best decision to meet their needs. This type of parking system aids in parking
management while promoting the use of public transportation, thus increasing transit
revenue (6).
Smart Payment Systems: Include the use of smart phones, smart cards, debit cards, and
credit cards to efficiently pay for parking, including directly paying a meter. These
systems allow drivers to adjust their time as needed, without the added stress of trying to
make it back to their car before their time expires and has the potential to provide refunds
or credits to users who pay for more time than needed.
E-parking: Uses text messages or the internet to allow drivers to reserve or check the
availability of vacant parking spaces before arriving at a parking facility. Improving the
information used in the planning process allows users to make better-informed decisions
as they can choose a parking location based on both supply and proximity to their
destination. Users do not have to include an end time and can park indefinitely,
eliminating the worry of expired times.
Automated Parking: Consists of users getting to their parking lot, locking their car, and
allowing automatic machines to place the vehicle in an allocated space. This ensures
maximum efficiency of parking spaces and increases safety as drivers will no longer
cruise the parking lot to find a vacant space.
Smart Parking Concepts
Smart parking concepts are another way cities are implementing new technology to increase
customer satisfaction and revenue from parking.
Parking reservation: allows drivers to reserve and pay for their parking in advance,
eliminating the stress and uncertainty of finding parking once they have arrived at their
destination.
Dynamic pricing (variable parking): varies the cost of parking based on factors including
time, location, and consumer need, and serves to maximize efficiency during peak
periods of demand. This provides drivers with an economic impetus to make better
decisions when choosing to drive their personal vehicle or opt for a different mode. Fees
are set to ensure that a couple of vacant spaces always exist for those willing to pay for it.

15
Smart parking deployment: integrates various smart parking concepts to develop an
optimal smart parking system based on the needs of an area. These systems may include
the use of real-time parking availability, parking reservations, transit-based information
systems, and dynamic pricing (7).

16
Project Financing through Value Capture
The parking management strategies mentioned in this report thus far aim to increase accessibility
within urban centers. Accessibility measures the ability of individuals to reach locations such as
work, school, shopping, etc. The increased ease of movement between destinations that such
transportation infrastructure provides creates value for the project. Transportation improvements
also create economic value. This economic value arises from the increased accessibility (i.e.,
time and fuel savings from relieved congestion) and from the resultant appreciation of land
values. As accessibility increases around an area, either through such investments as highway
expansion or improved transit service, the land itself becomes more desirable (8).
This section explains information on strategies designed to capture the incremental value. An
introduction into what these strategies aim to achieve, as well as an examination of the most
common forms of value-capture, are provided. As part of the analysis of these projects, identified
strategies will be examined based on their effectiveness and suitability for implementation in a
given area.
What Is Value Capture?
Value capture is a financing mechanism that captures the increased value of a parcel of land as a
result of public infrastructure investment. These funds are then available either to reimburse local
agencies for the original public investment, or to fund new projects. This type of project
financing is not a new tool for local agencies. Value capture has been in use since the 18th
century and has been adopted by at least 30 countries around the world (9).
For this project, researchers examined literature thought to be the most directly related to the
purpose of this report. This is not an exhaustive listing of value capture literature in this field, nor
does it explore the nuances within each method. Instead, the literature examined for this report
provided researchers with a general understanding of the value capture process and the most
common mechanisms used for transportation related purposes. The next sections give an
overview of value capture legislation in Texas, the function of the most common value capture
strategies, and a brief overview of how these tools could be used by local governments to better
leverage the value of infrastructure improvements associated with more efficient parking
systems.
Value Capture Methods
These mechanisms have a wide range of purposes from encouraging increased mass transit
utilization (Transit Based Information [TBI] smart parking systems), to mechanisms that favor
transportation investments. The following provides a brief overview of several value-capture
methods, their usage, and major considerations regarding implementation. Table 1 summarizes
common value capture options along with corresponding enabling state legislation. Value
capture methods without direct state legislation are mentioned in the following section.

17
Table 1. Texas Value Capture Funding and Financing Options Authorized by Law.
Option Statute
Enabling Code
Key Provisions
Tax Increment Financing
Texas Tax Code Ch. 311
Tax increment financing (TIF) districts are created by counties and municipalities.
A municipality or county can create a Tax Increment Reinvestment Zone (TIRZ) pursuant to this chapter; however, only a city may issue bonds pursuant to the Texas Constitution.
Cost of improvements within the districts is repaid through the future taxes levied against property owners.
Transportation Reinvestment Zones (TRZ)
Texas Transportation Code Ch. 222
A form of tax increment financing designed to address added value from transportation projects.
Under current law, cities, counties, and port authorities have the authority to establish a TRZ.
Many local governments have used tax increment reinvestment zones and tax increment financing, but a TRZ allows for a broader range of transportation projects and does not require a local entity to create a board.
Special Assessment Districts
Texas Local Government Code Chapter 372
Provide infrastructure and services in a designated area.
May serve as tools to help raise revenue.
Typically can come in two forms: a municipal management district and public improvement district.
These districts can provide a source of revenue of funding for capital improvements and, if authorized, used to fund operations and maintenance activities.
These districts are common: Nearly every major Texas city has at least one special assessment district.
Development Impact Fees
Local government Code Ch. 395
Charge or assessment by political subdivision to generate revenue for funding or to recoup loss from expansion of existing systems for new development.
Local Government Corporation
Texas Transportation Code 431
Enacted to help “encourage donations of right of way for state highways, and donations of funds for preliminary planning and design for those highways.”
Helps provide cities and counties with an additional vehicle to conduct public-private partnerships for transportation projects.
Chapter 380 Economic Development Programs
Local Government Code Ch. 380
Authorizes municipalities to offer a range of incentives to promote state or local economic development.
Authorizes grants and loans to city funds for economic development purposes; does not specifically provide for a specific tax or fee to fund these grants and loans.
A home-rule municipality may issue bonds to fund an economic development program, per certain conditions.
Source: TTI
The subsections below provide further information on each option presented in Table 1 above.
Tax Increment Financing
Tax increment financing (TIF) is a widely-used tool for capturing the value of infrastructure
improvements. This value-capture mechanism is structured in the form of districts that manage
18
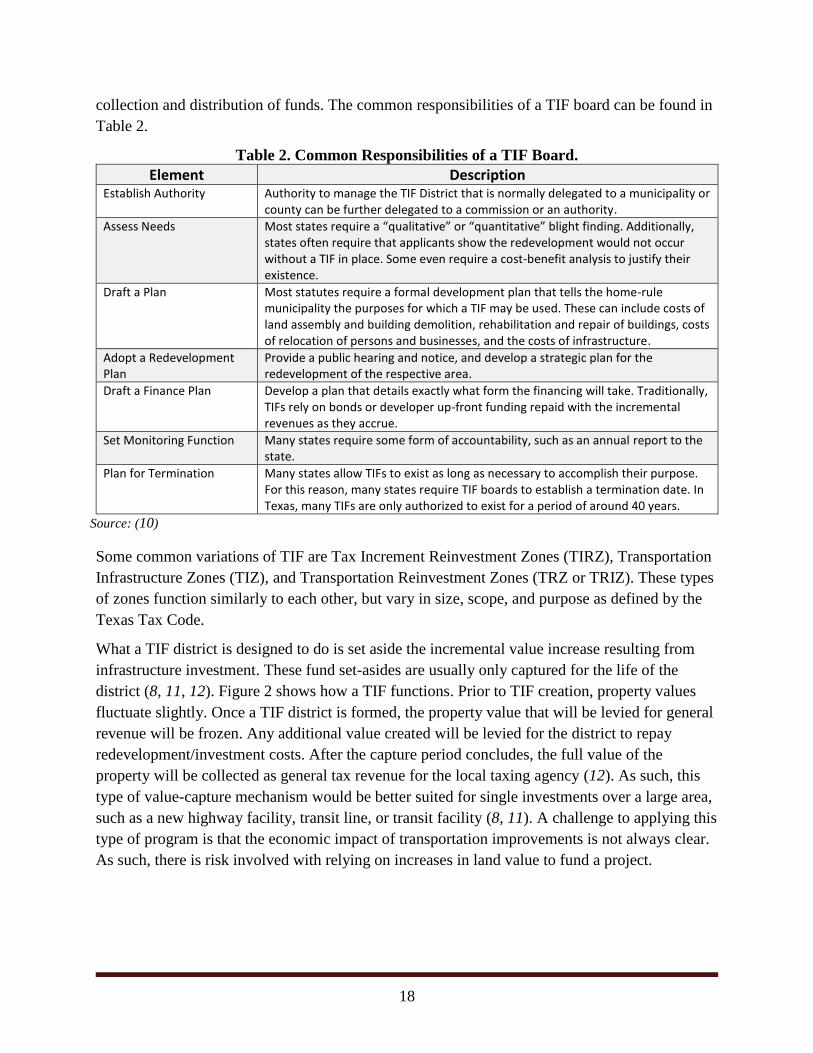
collection and distribution of funds. The common responsibilities of a TIF board can be found in
Table 2.
Table 2. Common Responsibilities of a TIF Board.
Element Description Establish Authority Authority to manage the TIF District that is normally delegated to a municipality or
county can be further delegated to a commission or an authority.
Assess Needs Most states require a “qualitative” or “quantitative” blight finding. Additionally, states often require that applicants show the redevelopment would not occur without a TIF in place. Some even require a cost-benefit analysis to justify their existence.
Draft a Plan Most statutes require a formal development plan that tells the home-rule municipality the purposes for which a TIF may be used. These can include costs of land assembly and building demolition, rehabilitation and repair of buildings, costs of relocation of persons and businesses, and the costs of infrastructure.
Adopt a Redevelopment Plan
Provide a public hearing and notice, and develop a strategic plan for the redevelopment of the respective area.
Draft a Finance Plan Develop a plan that details exactly what form the financing will take. Traditionally, TIFs rely on bonds or developer up-front funding repaid with the incremental revenues as they accrue.
Set Monitoring Function Many states require some form of accountability, such as an annual report to the state.
Plan for Termination Many states allow TIFs to exist as long as necessary to accomplish their purpose. For this reason, many states require TIF boards to establish a termination date. In Texas, many TIFs are only authorized to exist for a period of around 40 years.
Source: (10)
Some common variations of TIF are Tax Increment Reinvestment Zones (TIRZ), Transportation
Infrastructure Zones (TIZ), and Transportation Reinvestment Zones (TRZ or TRIZ). These types
of zones function similarly to each other, but vary in size, scope, and purpose as defined by the
Texas Tax Code.
What a TIF district is designed to do is set aside the incremental value increase resulting from
infrastructure investment. These fund set-asides are usually only captured for the life of the
district (8, 11, 12). Figure 2 shows how a TIF functions. Prior to TIF creation, property values
fluctuate slightly. Once a TIF district is formed, the property value that will be levied for general
revenue will be frozen. Any additional value created will be levied for the district to repay
redevelopment/investment costs. After the capture period concludes, the full value of the
property will be collected as general tax revenue for the local taxing agency (12). As such, this
type of value-capture mechanism would be better suited for single investments over a large area,
such as a new highway facility, transit line, or transit facility (8, 11). A challenge to applying this
type of program is that the economic impact of transportation improvements is not always clear.
As such, there is risk involved with relying on increases in land value to fund a project.

19
*General revenue from property values frozen at value prior to TIF creation
Figure 2. Tax Increment Financing.
To establish a TIF district within Texas, the TIF’s location must meet certain criteria. The
criteria generally involve geographies that are blighted, underdeveloped, or would otherwise not
experience growth unless investment is made. A full list of criteria can be found in Chapter
311.005 of the Texas Tax Code.
The exposure faced by TIF districts arises when assessed values within the district fall because
of an external influence, such as an economic downturn. If projects are being funded or repaid
exclusively through increment revenue, there is a high risk to the governing authority of the TIF.
Transportation Reinvestment Zones
In 2007, the Texas Legislature created transportation reinvestment zones (TRZs). A TRZ is
similar to a TIF in the way it leverages economic value growth: it allows local governments,
such as counties or municipalities, to establish a jurisdiction and raise funds using part of the
incremental growth in property and sales taxes as a result of transportation improvements/
investments. This incremental tax revenue can be used to support funding and financing from the
growth in the tax base. Funds from this increment gain can also be combined with traditional and
non-traditional transportation funding sources (i.e., state gas tax funds, vehicle registration fees,
Mobility Fund bond funds).
First authorized by SB 1266 in 2007, the Texas Legislature has made several mostly incremental
changes to TRZ legislation. Since 2007, lawmakers have changed TRZ enabling legislation to
allow for increased flexibility in their adoption and implementation (HB 563 in 2011), changing

20
which types of projects could be funded through a TRZ (SB 1110 in 2013), and expanding their
authority to include port and navigation projects (SB 971 in 2013).
While TRZ legislation has not been used specifically for parking improvements, the broad
authority does allow a municipality to establish a TRZ and use those funds for transportation
infrastructure that could increase the value of an urban area. This is dependent on the type of
project funding, such as a state infrastructure bank (SIB) loan or general obligation bonds. Using
a SIB loan would require the money to be spent on a state highway project. However, a TRZ
could be set up to help fund roadway improvements while other revenue sources that would have
normally been directed to fund those improvements could be used instead to implement smart
parking and other parking enhancements.
Special Assessment District
Special assessment districts are a type of tax that is placed on a designated area in order to fund a
transportation improvement. The basis of this imposed tax is that those being taxed will receive a
marginal benefit from the transportation improvement (11, 13). This method has been used
widely to fund minor improvements such as streetlights, transit stops, and sidewalks (8). A
challenge associated with these districts is that the imposed fee is highly visible. This can create
political concerns as it is, on the surface, a new tax.
Other Value Capture Options
Transportation Utility Districts
Similar to special assessment districts, transportation utility districts are an imposed tax specific
to the addition of a new facility. Much like water and sewer lines, transportation facilities can be
seen as a utility that should be financed through user chargers (11), where the funding is
proportional to expected use of the facility (8). Similar to special assessment districts, this tax is
visible and can be difficult to implement due to political concerns.
Development Impact Fees
Development impact fees are another form of usage fee that can be imposed by a city to provide
more proportional funding for transportation facilities. Instead of a recurring tax, developer
impact fees are one-time fees on new development used to offset the cost of adding a
transportation facility. These additional costs typically come from the need to install new
infrastructure, such as water and sewage lines, and the increased demand on existing
infrastructure. These fees can be calculated either through a demand-driven or improvement-
based systems (11). These fees are used in more than half of the states (8) in the country. These
fees are not highly visible, but must be calculated appropriately to retain demand for new
development (11). These additional costs to developers are typically passed on to the consumer
in the final cost of the development.

21
Negotiated Exactions
Negotiated exactions are similar to development impact fees in almost every way. The difference
between these mechanisms lies in the means of determining the fee. This process involves less
formal negotiations between developers and local jurisdictions (11).
Joint Development
Joint development is a value-capture method in which a private developer will either implement
or provide funding or financing assistance for new transportation projects. In many cases, these
joint developments merely reflect concurrent interests between local jurisdictions and developers
(11). In addition to these developments, exactions or impact fees are often present as well. Joint
developments reflect cooperation between parties, changing the dynamic from the jurisdiction
providing infrastructure and the land developer consuming it (8). This can be a valuable tool
when developers are producing transit-oriented developments (TODs) (13).
Air Rights
Air rights are a form of value-capture that establishes developer rights above or below a
transportation facility, such as a depressed highway or subway/metro system (11). These
transportation facilities improve accessibility, thus increasing land value. In turn, the value of the
land above the transportation facility can be marketed and leased to developers (8, 11). Often,
this source of revenue will follow the initial investment in the infrastructure, posing risk to the
local jurisdiction. However, the feasibility of this financing mechanism increases if used in
conjunction with a joint development (13).
Local Government Corporation
Enacted into law in 1984, a local government corporation (LGC) is a corporate entity that is
formed by a municipal or county government to act on behalf of that city or county. By
establishing a separate corporation, a city or county can be protected from lawsuits. In addition,
an LGC limits the risk incurred by the local government.
Chapter 431 of the Texas Transportation Code established specific guidelines for the creation
and operation of LGCs in the state. In Texas, transportation projects developed by an LGC must
be part of the state highway system; projects on the local transportation system are not permitted.
For this reason, LGCs may not be a suitable tool for funding parking programs. However, future
legislative changes to LGCs could broaden their purview so that they could finance local
infrastructure improvements both on and off the state transportation network.
Chapter 380 Agreements
Chapter 380 agreements refer to Chapter 380 of the Texas Local Government Code. This
legislation authorizes Texas cities to provide assistance for economic development. Texas cities
may provide several resources, including monies, loans, city personnel, and city services for the
promotion and encouragement of economic development.

22
Before 1987, Texas cities were unable to provide economic assistance to businesses for the
promotion of economic development. In 1987, Texas voters approved a constitutional
amendment authorizing “the making of loans and grants of public money…for the public
purposes of development and diversification of the economy of the state, the elimination of the
unemployment or underemployment of the state…or the development or expansion of
transportation or commerce in the state.”8
The relative flexibility of this tool means that it has the potential to serve as one of the best tools
available for the application of smart parking management technology. Because many parking
lots are owned and managed by private corporations, a tax abatement or other form of assistance
could be granted to a private company, as long as there is demonstrated proof that the improved
parking system provides a tangible public benefit.
Value Capture as Opportunity for Local Governments
The strategies mentioned above could be potential options available for regional and local
policymakers to better leverage value created from land use changes from underutilized surface
parking lots. Experience in other states suggests the efficacy of employing opportunities to
utilize land value taxes as a mechanism to incentivize productive uses of property and to
disincentivize maintaining unproductive properties in high-value locations.
Land-value taxes (LVTs) are a type of value-capture method that assess a tax on the value of the
land rather than the improvement on a piece of property. After the development of a
transportation facility, this tax captures the value of the added benefit of the public good, most
notably through the increase in accessibility (11). As a result, this split tax rate could be
beneficial to the redevelopment of a property, such as underdeveloped lots in downtowns where
demand is high and supply is low, as it incentivizes improving parcels quickly to have the largest
return on investment (8, 14, 15).
Taxation changes can be hindered by political and public opposition. As such, LVTs have not
been widely used in the United States. However, there are a few cases studies of this type of tax
policy being successful. During the 1970s, the city of Pittsburgh implemented a LVT on its
property that taxed land at six times the rate of buildings. As a result, Pittsburgh saw a much
larger growth in commercial development relative to comparable cities (16, 17). There may be
limitations to this type of taxation policy. It is difficult to properly assess land value, and even
more so to assess the increase in the value of land as a direct result of a transportation
improvement. As such, it would be more useful in a large area of a city (14).
Ultimately, the funding options above could be used to better leverage the value in changes in
land use to help fund and finance improvements to surface parking lots and vacant land. In
addition to changes in land use for underutilized land, other technologies could better maximize
the potential benefits from existing parking facilities in urban areas. One set of technologies,
8 Texas Constitution art. III, § 52-a.

23
known collectively as “smart parking,” could also be considered. The sections that follow will
feature case studies of urban areas around the U.S. and present potential ways these lessons
learned could be applied to Texas.

24
Smart Parking Case Studies
SFpark, San Francisco, California
Curb space is being reconsidered as a valuable commodity rather than a free good, forming a
conceptual basis for the adoption of a pricing model that ensures at least one parking space is
available on each block in urban areas each day. The goal is to eliminate underpriced parking
and reduce the number of drivers cruising9 streets to find an open space. Cruising to find a
parking spot leads to wasted fuel, additional air pollution, increased carbon emissions, and
worsening traffic congestion (7). Cruising greatly impacts traffic congestion with an average of
34 percent of cars in congested downtown traffic looking for parking (18). A study conducted in
a 15-block Los Angeles commercial district estimated cruising caused an excess of nearly
1.5 million vehicle kilometers (approximately 932,000 miles) of travel per year (19).
SFpark is a parking management program the city of San Francisco developed with the help of a
grant from the U.S. Department of Transportation. The program used variable pricing techniques
to set the prices of curb parking by installing meters that charge variable prices and sensors to
report the occupancy of each space in real time (18). With this technology, the city adjusted curb
parking prices in response to the observed occupancy rates, and sought a pricing structure that
varied by time and location throughout the city (18).
The intention was to maintain two or more open spots on every block by setting the optimal price
to achieve this goal for each specific block. Underpriced parking can have a large social cost, but
overpriced parking can cause spaces to remain empty contributing to the loss of customers for
nearby stores, loss of jobs to employees, and loss in tax revenues to governments (19).
SFpark had a positive impact on traffic congestion and traffic volumes. The key findings from
the SFpark pilot program are:
43 percent reduction in the time it took for drivers to find a parking spot, resulting to
drivers finding parking within 6.5 minutes.
30 percent reduction in vehicle miles traveled and greenhouse gases from vehicles
searching for parking.
8 percent decrease in traffic volumes in areas with improved parking availability.
22 percent reduction in double parking in pilot areas (20).
Opposition to the SFpark program included the group, ANSWER (Act Now to Stop War and
End Racism Coalition), as they believed the program was an attempt to defeat workers and small
business. Another major source of opposition was from the business community who feared that
metered parking would affect customer satisfaction. In practice the city used the additional
9 Driving around surrounding streets and parking lots to find a parking spot.

25
revenue generated through metered parking for the funding of public services. San Francisco
uses all parking meter revenue to subsidize public transit. As SFpark revenues increase, more
low-income families relying on public transit can be served (19).
The overall goal of the program was to optimize efficiency, not to maximize revenue (20). The
program was relatively well-received as it was fairly transparent to the public.
Results
With two groups of customers: short-term (hourly parkers, visit to shop or eat at nearby
businesses) and commuters (park all day via early bird or monthly parking passes and storing
their vehicles for nine or more hours per day), SFpark maximized the efficiency of the garages
(20). Benefits provided to businesses because of SFpark include:
The amount of time needed to find a parking space decreased by 41 percent from a search
time of 9.2 minutes to 6.5 minutes.
The number of short-term parkers in garages increased by 11 percent or about 130,000
short-term parkers per year.
Of respondents surveyed in the pilot areas before and after the implementation of SFpark,
74 percent stated that it was “somewhat or very easy to pay for parking” (20).
Downtown Columbus, Ohio
The Capital Crossroads Special Improvement District formed in 2001 with the goal of creating a
downtown that is the cleanest, safest, and best place to live, work, and play in Central Ohio. The
special improvement districts (SID) composed of property owners, with property taxing
authority, agreed to pay for the services necessary to pursue this goal. The group hires safety
ambassadors, special-duty police officers, a homeless outreach specialist, and a safety
coordinator. It also maintains a public-private partnership with the city and business owners in
the area.
A group of property owners realized one of the biggest problems facing them was the lack of
parking to accommodate the more than 40,000 downtown workers. Instead of spending millions
of dollars on the four parking garages it would take to accommodate this number of workers,
business owners opted to make transit more appealing by offering free transit passes for
employees. Free transit passes were offered to district workers, allowing them to ride the bus for
free instead of driving to work.
The program would cost $5 million, half of which would be paid for by the 550 property owners
in the Capital Crossroads Special Improvement District. The business owners would be taxed
three cents per square foot of space per year, and the other half would come from grants funded
by foundations.

26
Results
An $80,000 pilot program was conducted from June 2015 through January 2017 and involved
844 employees from companies in the district (21). Throughout the pilot program, the proportion
of those commuting by bus almost doubled, from 6.4 percent to 12.2 percent (21). One
commuter estimated savings of at least $150 per month in parking costs. The District estimates
that if the program continues and expands to all 40,000 plus employees:
2,400 parking spaces would free up.
4,000 to 5,000 people would trade their current mode of transportation for transit.
An additional 2,900 employees could work in the District (21).
The program would especially benefit the District’s low-wage employees in the service industry,
who usually cannot afford to drive to work and park. Low-wage employees who make less than
$25,000 comprise 19 percent of the employees working in the District, among these,
eight percent are paid less than 150 percent of the poverty level (21). The program provides
employees with options reducing high worker turnover attributable to the un-affordability of
transportation, saving businesses money.
Smart Parking Systems, Istanbul, Turkey
Turkey’s largest city, Istanbul, is also the country’s largest industrial hub, generating 55 percent
of Turkey’s trade, 22 percent of Turkey’s gross national product, and containing 33 percent of
Turkey’s commercial enterprises (22). With Istanbul’s large economic role in the country, the
city’s population has doubled to over 13 million people since 1986. During this same period, the
number of registered automobiles in the city has increased by six fold, reaching 1.7 million
vehicles (22). Negative consequences, including traffic congestion, accidents, and exhaust
emissions, have caused the city to rethink their transportation system.
Many of the everyday trips generated consist of private vehicles using the highway; the existing
rail-based public transport was unable to accommodate the needs of traffic demand (22).
Transportation demand management strategies were evaluated, and a smart parking guiding
system was determined to be the best method to reduce congestion and preserve the historical
and cultural heritage of the city.
Fatih Municipality, a metropolitan municipality within the City of Istanbul, is a high-density
historical area with many tourism-related facilities such as hotels, restaurants, and souvenir
shops. Some of the roads in this area were closed to vehicle traffic to protect pedestrians and the
historical architecture of the area, which in turn has improved traffic.
Smart Parking System (SPS) was the system adopted by the Fatih Municipality to help reduce
traffic congestion for drivers trying to find parking that fit their needs. As a kickoff to the
project, a social survey was distributed to assess the current traffic and transportation problems
and gauge the perception from stakeholders in the historical area. Feedback from the survey

27
showed traffic as the major issue, indicating a parking system that maximized the efficiency of
existing parking facilities and limited cruising by vehicles would be the most beneficial. The
goals of the program are as follows:
Reduce the number of vehicles looking for available parking lots.
Motivate drivers to use car parks outside the most congested area by utilizing the shuttle
bus service.
Alleviate traffic congestion in the central area.
The program used internet and smart phone applications to provide drivers with updated
information on parking locations, parking fees, capacity, occupancy rates, and access to car
parks. Information boards were installed at access points providing drivers with real-time free
space information every 5 minutes.
A shuttle bus service that operated every 15–20 minutes during off and on-peak hours was
available only to program participants. The goal of the shuttle bus was to encourage users to park
further from their destination, knowing a ride would take them to their destination (22).
Results
The SPS Pilot Project results showed:
Shorter travel times for users by 20 to 30 minutes.
Shorter travel time for around 90 percent of parking users, with trip times from car parks
to destinations of no more than 10 minutes.
Several users of the program switched from a private vehicle and taxi to walking (22).
The users of SPS expressed high anticipation for expanding the program to other parts of
Fatih/Istanbul, and even illegal parkers showed positive interest in the SPS, although the
program did not lead to their utilization of legal parking lots.
Future Expansion of the Smart Parking System
The city of Istanbul is part of the CitySDK (Smart City Service Development Kit and its
application pilots) project, which partners with other cities to create smart mobility, tourism, and
active participation. The city of Istanbul plans to improve the project management structure of
the SPS program. Transportation planners believe that the program could be strengthened
through the following:
Additional campaigns and public relations activities to promote the utilization of legal
parking areas.
Enforcing existing parking regulation to incentivize compliance among illegal parkers.

28
Value Capture Redevelopment Case Studies
For this step in the process, researchers sought case studies of value capture being used in the
redevelopment process. Researchers focused on studies that examined redevelopment of
underutilized parcels within urban cores to leverage revenue for transportation infrastructure.
Because of the uniqueness of this scope, a limited number of examples were found. Two major
studies were identified, which will serve as the basis for estimating potential revenue.
Center for Neighborhood Technology
The first report examined was a study conducted in 2006 by the Center for Neighborhood
Technology (CNT) in Chicago, IL. The study examined the development potential of surface
parking lots in the Chicago area (23). While they focused on transit-oriented development, the
same general principles could be applied to the development of smart parking systems.
The study examined 84 transit station areas and selected nine surface parking lots in these areas
to act as case studies. After selecting the case studies, CNT created potential development
scenarios that were realistic for each area, allowing them to estimate potential revenues from
development of the surface parking lots. The results of these case studies are shown in Table 3.
Table 3. Estimated Captured Revenues from Parking Lot Redevelopment.
Station Surface Parking Spaces
Parking Lot Net Annual Revenue
Potential Annual Property
Tax
Potential Net Annual Public
Revenues Arlington Heights 180 -$33,120 $606,981 $640,101
Palatine 235 $39,574 $287,673 $248,099
Hanover Park 1,302 -$75,256 $569,987 $645,243
Oak Park 88 $19,501 $178,560 $159,059
LaGrange Road 230 $24,380 $363,217 $338,837
Franklin Park 190 -$11,476 $479,293 $490,769
Homewood 215 $50,740 $375,851 $325,111
Blue Island 795 -$52,669 $533,652 $586,321
Tinley Park 1,733 -$95,662 $528,425 $624,087
Source: (23)
During their research, the CNT also developed a set of recommendations for organizations
undertaking transit-oriented development. The relevant recommendations are as follows:
Establish a joint development authority to oversee development.
Incorporate transit oriented development principles into planning and policy.
Place more emphasis on land value taxation over improvement based taxation system.
While the parking lots provided in this case study do not fall within the urban core, the
methodology provided in this report will help researchers develop a unique methodology for

29
estimating potential revenues. As land values vary greatly by city, it will be necessary to
formulate a methodology that considers variables that can be estimated for each city.
U.S. Government Accountability Office
The second report came from the U.S. Government Accountability Office (GAO) and focuses on
past redevelopment that incorporated value capture methods (24). The 2010 study collected data
from 55 transit agencies to determine what value capture methods had been used to fund the
development of transit facilities. Of the 55 agencies studied, 32 reported that they had previously
used joint development, and 19 had used tax increment financing, special assessment districts,
and/or development impact fees to leverage transit funding from redevelopment. These
developments varied greatly in size, though many were a single parcel near a transit station.
Others were much larger, such as Atlanta’s Lindbergh City Center, which covered 47 acres of
mixed-use development. The GAO found that revenues generated from value capture methods
were typically small relative to operating expenses.
Per the GAO, agencies using joint development typically shared these four characteristics:
Operate older, larger fixed-guideway systems.
Have formal joint development or transit oriented development policies.
Have in-house real estate expertise.
Have developable land holdings on which to build joint developments.
The report found that the permanent nature of fixed-guideway systems made development more
attractive than on non-fixed-guideway systems, although there were some exceptions, including
King County Metro in Seattle, which implemented several joint developments at permanent
intermodal transit centers. Finally, these agencies reported that having developable land was
important for joint development. Many of these agencies converted existing surface park-and-
ride lots into transit-oriented developments with parking structures.
The GAO report focuses on the development of capital improvement projects for the transit
agencies. Most of the projects listed in the report look at transit infrastructure, such as new fixed-
guideway systems, transit centers, and streetcars. However, the report also examined some
transit-oriented developments that did not rely on joint development and instead focused on other
value capture strategies. These case studies would be applicable to the redevelopment of
underutilized parking lots. These can be seen in Table 4.

30
Table 4. Major Transit Infrastructure Projects Funded by Value Capture.
Transit-oriented development
(status)
Location Value capture strategy(ies)
Amount of revenue
generated through the use of value
capture strategy(ies)
($ in millions)
Onsite infrastructure improvements funded
through the use of value capture strategy(ies)
BART Pleasant Hill transit-oriented development (in progress)
Contra Costa County, CA
Tax increment financing and special assessment district
$750 Backbone infrastructure, such as roads and drainage systems; place-making infrastructure, such as parks and plazas; and a new structured parking garage to replace the station’s existing surface parking lot.
Dallas Area Rapid Transit transit-oriented development tax increment financing district (established)
Dallas, TX Tax increment financing
$182 Basic infrastructure improvements, including parking garages and water and sewer systems.
MDOT State Center transit-oriented development (in progress)
Baltimore County, MD
Tax increment financing (backed by a special assessment district)
$100 Structured parking, station amenities, affordable housing, and other infrastructure improvements, in combination with other local bonds.
MDOT Owings Mills transit-oriented development (in progress)
Baltimore County, MD
Tax increment financing and special assessment district
$60 Tax increment funds to pay for the construction of two state-owned parking garages and special assessment funds to pay for the operation of state-owned garages, roads, and other improvements.
MDOT Savage transit-oriented development (in progress)
Howard County, MD
Tax increment financing (backed by a special assessment district)
$14 Structured parking garage to replace the commuter rail station’s surface parking lot.
Source: (24)
A key case study included in this report is the development by Dallas Area Rapid Transit
(DART). DART established tax increment financing districts along the light rail lines to pay for
infrastructure such as streets, water and sewer systems, and portions of parking garages. The
revenue collected from this district, as reported by the GAO, is $100 million. This will aid in
estimating revenues of value-capture for these types of projects specifically within Texas.
From the findings, it is noted that revenue from value capture strategies vary by project. In none
of these cases were value capture mechanisms able to fund the entirety of the project. However,

31
the funds generated were critical to a project’s success (24). Officials from Washington Metro,
the Seattle Department of Transportation, Portland Transit, and the Maryland Department of
Transportation all noted in the report that value capture revenues were necessary in the
development of the project.
The findings from these case study reports provide researchers with information to inform their
determination of the potential values of underutilized parking lots in Texas urban cores. Actual
redevelopment values and tax increment revenues from these case studies are compared to the
findings in this report.

32
Analysis
The analysis conducted in this report is divided into two sections: congestion mitigation from
smart parking systems and value added and revenue estimation. Due to the nature of the project,
the research team needed to conduct two different analyses to help determine the overall value of
urban parking spaces in downtown Houston. The smart parking systems and congestion
mitigation portion of the analysis examines the current parking situation in downtown Houston
and calculates the congestion and dollar value of benefits if a smart parking system were to be
implemented in downtown Houston. The value added and revenue estimation portion of the
analysis assesses the value of redevelopment of the existing surface parking within downtown
Houston.
Data Collection and Parking Inventory Development Database
Data for the analysis of this report came primarily from the Harris County Appraisal District
(HCAD) public data (25). The downloaded data included 2017 parcel spatial and account data,
existing TIF district shapefiles,10 existing management districts, and tax entity boundaries.
Additional parking inventory data came from the Houston Downtown Management District. This
group provided public and private garage/surface parking locations that were matched against
HCAD parcel data. An on-site evaluation of the parking in downtown Houston was warranted
due to the quickly changing nature of the land use in downtown Houston. Researchers spent a
full day matching the on-site data with the recorded data and addressed any changes needed. The
research team used this confirmed on-site data to conduct the analysis.
Parcel data provided 2017 assessed values for land, improvement, extra features, and total
assessment. Additional data on commercial and residential parcels provided land and
improvement (building sq. ft.) areas for each parcel. Parcel data in combination with the on-site
inventory analysis was used to classify the current parking facility types in downtown Houston
and create the parking inventory database to be used throughout the methodology.
Methodology: Smart Parking Systems and the Congestion Benefit
Estimating the True Mean Percent Occupancies of Parking Facilities
To gain a better understanding of the current parking situation downtown Houston faces, the
research team needed to estimate the true mean percent occupancy of each parking facility type:
public surface lots, private surface lots, public parking garages, and private parking garages.
Researchers ran a statistical analysis to determine the sampling size for each group of parking
facilities, based on the total number of parking facilities. Table 5 displays the total number of
10 TIF districts in Harris County are established as tax increment reinvestment zones (TIRZs). As such, this is the
nomenclature that will be used to refer to these districts for the rest of the report.
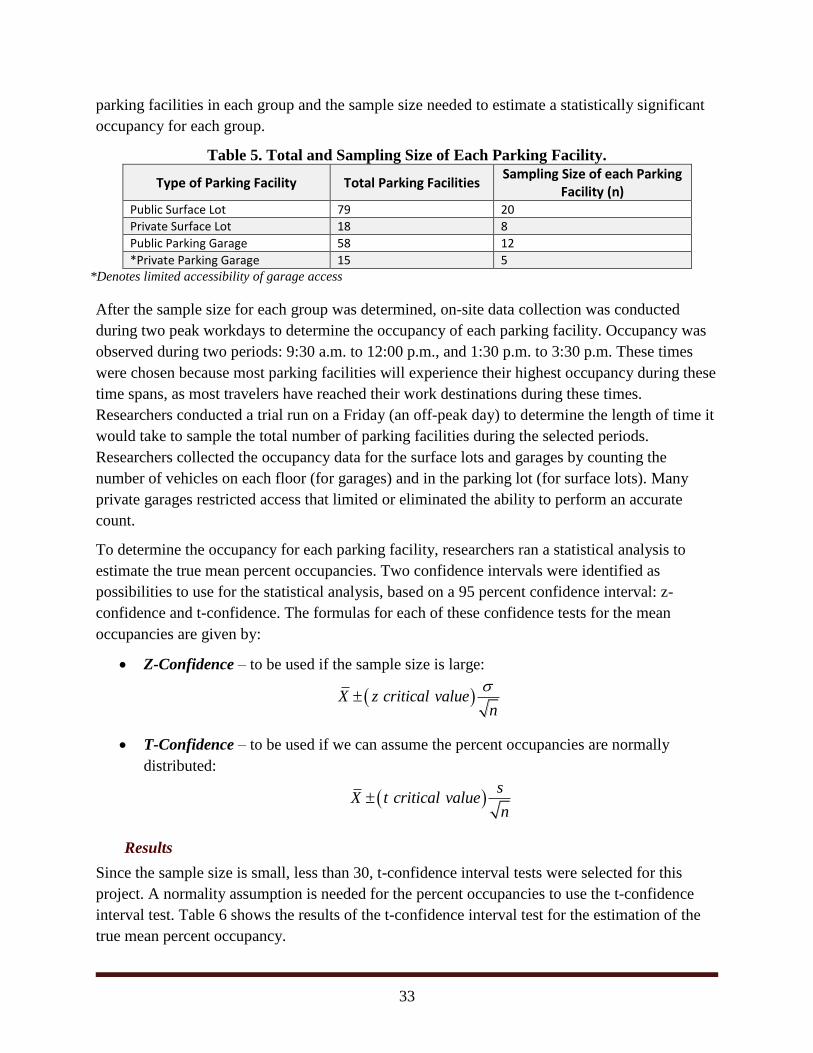
33
parking facilities in each group and the sample size needed to estimate a statistically significant
occupancy for each group.
Table 5. Total and Sampling Size of Each Parking Facility.
Type of Parking Facility Total Parking Facilities Sampling Size of each Parking
Facility (n) Public Surface Lot 79 20
Private Surface Lot 18 8
Public Parking Garage 58 12
*Private Parking Garage 15 5 *Denotes limited accessibility of garage access
After the sample size for each group was determined, on-site data collection was conducted
during two peak workdays to determine the occupancy of each parking facility. Occupancy was
observed during two periods: 9:30 a.m. to 12:00 p.m., and 1:30 p.m. to 3:30 p.m. These times
were chosen because most parking facilities will experience their highest occupancy during these
time spans, as most travelers have reached their work destinations during these times.
Researchers conducted a trial run on a Friday (an off-peak day) to determine the length of time it
would take to sample the total number of parking facilities during the selected periods.
Researchers collected the occupancy data for the surface lots and garages by counting the
number of vehicles on each floor (for garages) and in the parking lot (for surface lots). Many
private garages restricted access that limited or eliminated the ability to perform an accurate
count.
To determine the occupancy for each parking facility, researchers ran a statistical analysis to
estimate the true mean percent occupancies. Two confidence intervals were identified as
possibilities to use for the statistical analysis, based on a 95 percent confidence interval: z-
confidence and t-confidence. The formulas for each of these confidence tests for the mean
occupancies are given by:
Z-Confidence – to be used if the sample size is large:
X z critical valuen
T-Confidence – to be used if we can assume the percent occupancies are normally
distributed:
s
X t critical valuen
Results
Since the sample size is small, less than 30, t-confidence interval tests were selected for this
project. A normality assumption is needed for the percent occupancies to use the t-confidence
interval test. Table 6 shows the results of the t-confidence interval test for the estimation of the
true mean percent occupancy.

34
Table 6. Summary Statistics and Confidence Intervals for the True Mean Percent
Occupancy by Parking Facility.
Parking Lot Type N* X (%) S (%) Lower
Limit for 95% CI**
Upper Limit for 95% CI
Public Surface Lot 20 54.1 33.1 37.4 67.6
Private Surface Lot 8 45.8 22.3 27.1 64.5
Public Parking Garage
12 66.4 21.2 52.9 79.9
Private Parking Garage
5 37.4 21.4 10.8 63.9
*n represents the sample size. **CI denotes a t-confidence interval
Based on the occupancy ranges listed above, public parking garages are used most efficiently
with a conservative mean occupancy throughout Houston of 66.4 percent (upper limit occupancy
of 79.9 percent). Public and private surface lots have a much lower occupancies and are used less
efficiently with respective mean occupancies of 54.1 percent and 45.8 percent, both with upper
limit occupancy of only about 65 percent.
The results of this preliminary analysis suggest that the existing parking supply within downtown
Houston is highly underutilized, with slightly less than half being used throughout the day. For
the purposes of this report, this analysis simply suggests that parking facilities could be removed
through redevelopment, especially if a smart parking system increased how efficiently the
parking supply is used. While additional parking would likely be desired for any new
development, opportunities exist for a reduced supply in the new development, shared parking
with other surrounding uses, and other parking policy strategies.
Estimated Congestion Benefits of a Smart Parking System
Researchers used the results of SFpark and other similar systems integrated into TTI’s sketch
planning tool for congestion benefit estimation, the Future Improvement Examination Technique
(FIXiT), to help estimate the benefits a smart parking system would provide to downtown
Houston. FIXiT uses a variety of data sources, which provide speed values and average daily
traffic, to estimate a magnitude value of reduction benefits from the implementation of a
congestion mitigation strategy. Congestion mitigation strategies are strategies which can be
implemented by cities and state departments of transportation including traffic operations, travel
options, system capacity techniques and alternative modes of transportation. These strategies will
serve a certain role in the road network system, such as improving efficiency by clearing
collisions or improving signal coordination; reducing demand on the system by offering
alternatives to driving; or modifying the road network system to use existing road space more
efficiently. Parking management is a congestion mitigation strategy that encompasses a smart
parking system.

35
FIXiT uses delay reduction assumptions to estimate the magnitude values of reduction benefits.
In the smart parking system case, FIXiT based some of its assumptions on the 30 percent
reduction in vehicle miles of travel the SFpark system found through a follow up study. FIXiT
translates this and other benefits information into a conservative 4 percent delay reduction
benefit for recurring local congestion that is then applied to the local road network.
To determine the benefit a smart parking system would have for the entire road network system
around downtown Houston, researchers used the most current speed, volume, and delay
information from the Texas 100 Most Congested Roadways database. The Texas 100 Most
Congested Roadways list is published annually by the Texas Department of Transportation and
ranks the most congested corridors in Texas from over 1,800 roadway segments. Researchers
used the downtown freeway dispersal loop as the boundary for this analysis, including all
available data inside the loop in addition to the loop itself. This accounts for efficiencies in
parking that directly impact collector streets downtown and also have a minor impact on the
surrounding state freeway system as vehicles are better able to exit and enter the freeways closer
to their final parking destination. Note that this is a conservative network to use as not all of the
collector roads are represented (due to lack of data), and some benefits may impact segments
directly outside of the downtown freeway dispersal loop. Figure 3 displays the network used for
this analysis.
Figure 3. Congestion Analysis Road Network.
Using the roadway network, researchers calculated person hours of delay for both the freeway
and non-freeway segments. The FIXiT tool then uses the following equations to calculate
congestion benefits in terms of overall delay reduction and congestion cost savings in dollars.
Houston consistently ranks near the top for the most congested roads in Texas, costing the city

36
and commuters $22.50 per person hour of delay. Researchers calculated the delay reduction and
delay savings using the formulas below:
Delay Reduction = Delay Benefit (4%) * Person Hour Delay (by road system type)
Delay Savings = Delay Reduction * Houston Cost of Congestion ($22.50)
These numbers were calculated for the freeway, arterial roads, and a combined total of the two
roadway types. Table 7 provides a detailed look at the estimated congestion benefits of
implementing a smart parking system and the potential congestion savings for the system.
Table 7. Estimated Congestion Benefit for Downtown Houston.
Roadway Type Person Hour Delay Delay Reduction
(hours) Delay Savings ($
dollars)
Freeway 3,653,689.00 146,147.56 $3,288,320.10
Arterial 1,296,023.00 51,840.92 $1,166,420.70
Total 4,949,712.00 197,988.48 $4,454,740.80
Methodology: Value Added and Revenue Estimation
Through the literature search and case study review conducted as a part of this report, researchers
determined that a form of tax increment financing (TIF) would be best suited for capturing the
value of the redevelopment of large surface parking lots.
As shown by occupancy rates of existing parking facilities and estimations of smart parking
effectiveness in downtown Houston, the introduction of a smart parking system may cause a shift
in land use for large surface parking lots. As such, these parcels are likely to redevelop to a
higher value use, and the establishment of a TIF district would be the most suitable form of value
capture to use.
Other examined value capture methods would be less effective than a TIF due to how the
revenue is obtained. For example, through special assessment districts, the city or management
district would be required to tax existing property owners at a higher rate to pay for benefits,
which would be a smart parking system in this case. With a TIF, property owners would see no
change in the amount they are paying until after the improvement is implemented. This would
then raise property taxes according to the new value of the property.
Using a TIF district to collect revenues from smart parking improvements, downtown Houston
and existing roadway networks would receive congestion benefits and property value increases
for no additional taxes or fees to the property owners if marginal property tax revenues exceed
the cost of implementing and maintaining the system. The revenues would come solely from the
taxes levied on increased property values.
The first step in this analysis was to determine where within the Houston CBD a TIF would be
feasible. This required identifying existing TIF districts, or equivalent, within the study area.

37
Existing Tax Increment Financing Districts
There are currently two existing tax increment reinvestment zones (TIRZs) within the Houston
CBD. As discussed earlier in this report, a TIRZ is a form of TIF, which focuses on the
redevelopment of blighted or underdeveloped properties. Both existing TIRZ districts originated
in the Houston CBD, but have since expanded. As such, the tax base and area of influence for
each TIRZ has expanded past the scope of this project. Per the examination of parking inventory
within downtown Houston, the majority of surface parking resides within one of these existing
TIRZs. Therefore, any investments using increment tax dollars in these districts must align with
the previously established goals.
The following identifies existing TIRZs within downtown Houston and their characteristics.
Moreover, any goals related to the construction of transportation infrastructure improvements
and other accessibility improvements within those districts have also been identified.
Tax Increment Reinvestment Zone 3: Main Square/ Market Square
The Downtown Redevelopment Authority (the “Authority”) established this TIRZ in 1999. The
Authority is a public, non-profit agency, which operates under Texas law, Chapter 431 of the
Texas Transportation Code, and Chapter 394 of the Texas Local Government Code. The
Authority was created through the Tax Increment Financing Act, Chapter 311, Texas Tax Code
(26).
The purpose of TIRZ 3 in downtown Houston is to facilitate growth of new housing in the CBD.
The TIRZ was established for a 30-year period and requires the expenditure of $34 million for
public improvements and services to be repaid through tax increment funds generated within the
district. Per the creation ordinance, the following improvements are authorized in the TIRZ (27):
Streetscape enhancements (lighting, walks, landscaping, etc.).
Buffalo Bayou greenbelt improvements (walkways, landscaping, etc.).
Improvement of sites for residential redevelopment and the provision of housing.
Utility improvements and security enhancements.
Pedestrian and parking facilities (above and below ground).
The acquisition and rehabilitation of historic buildings.
The state of the original area when the TIRZ was established in northwest downtown Houston is
noted as having vacant and deteriorating building stock. There was also surface parking in the
area.
Since the establishment of the district, there have been eight additions to the original boundary to
create the current TIRZ boundary. The current boundaries, within the project area (downtown
Houston), can be seen in Figure 4.

38
Tax Increment Reinvestment Zone 24: Greater Houston
The Greater Houston TIRZ was established in 2012 to facilitate the development of 7,548 acres
within the Houston CBD. The TIRZ was established for a period of 30 years, and will expire on
December 31, 2042. The area in which the TIRZ was created met the criteria listed in Section
311.005 of the Texas Tax Code as an area that impairs sound growth of the City of Houston due
to deteriorating structures, inadequate or defective sidewalk and street layouts, unsanitary or
unsafe conditions, and conditions that endanger life or property by fire or other cause.
In addition to the stated reasons listed above, the Houston City Council also deemed the area to
meet designation criteria because the land is involved in a connection between a regional
commuter or mass transit system, or for a structure or facility that is beneficial to a regional rail
system.
The purpose of the zone, per the Greater Houston TIRZ financing plan is to develop public
works within the area (28). Improvements can include utilities, streets, streetlights, water and
sewer facilities, pedestrian malls and walkways, parks, flood and drainage facilities, or parking
facilities.
The project cost for the TIRZ is estimated at over $265 million. The TIRZ will spend this
amount, and it will be financed by the incremental tax growth from the base period within the
area.

39
Figure 4. Tax Increment Reinvestment Zones in Downtown Houston.
Source: Harris County Appraisal District (HCAD) Public Data
Redevelopment Identification
Using the parking inventory database, parcels that would be most likely redeveloped due to
market changes were identified. For this, only parcels used exclusively for parking were included
in the analysis. In the case of private surface lots, it was common to find the improvement
(building) included in the same account with surface parking. The combination of parking and
improvement made differentiating the value of the building and surface parking impossible. As a
result, many private surface lots were eliminated from the analysis.
After lots were identified, researchers sought to identify which of the surface parking parcels fell
within existing TIRZs in the CBD. This was done using GIS with the shape file data available
through the HCAD database. This resulted in the number of parcels and their total land area.

40
Estimated Redevelopment Value
The next step in the process was to determine an estimated redevelopment value. Assessed
values (2017) of the various land uses within the CBD were used to create an estimated assessed
value per improved square foot.
In addition to assessed value per improved square foot, it was also necessary to determine the
number of floors for each land use. As the data for the surface parking only provides a land area,
it was necessary to multiply the land value by a multiplier to determine estimated improved
square foot for each land use.
The calculated values and floor multiplier with the corresponding land uses are shown in Table
8.
Table 8. Land Use Estimated Assessed Value per Improved Square Foot and Floor
Multiplier.
Land Use Assessed Value Per Sq. Ft. Floor Multiplier
Misc. Commercial $119.23 1.6
Office $216.36 11.6
Apartments - Garden Style $117.98 0.9
Apartments - Mid Rise to High Rise $208.75 3.0
Real, Residential, Multi-Family $146.38 3.4
Extended Stay Hotel-Motel $105.32 1.9
Hotels, Full Service $162.82 7.8
Motels\Limited Service Hotels $173.92 7.0
Medical $122.80 6.6
This analysis excluded exempt properties such as government and religious buildings. The
analysis also excluded condominium units. These units are recorded in the HCAD database
individually. These units, however, did not include a clear distinction on which building each
unit resides within. This resulted in an inaccurate representation of the total square footage of
this land use.
After establishing a price per square foot for each land use, total land area of each surface
parking lot meeting the criteria for analysis was calculated and multiplied by the values in Table
8. An important distinction was to differentiate between the total square footage and calculated
acreage inside existing TIRZs and that found outside of existing TIRZs, shown in Table 9.
Table 9. Total Surface Parking Area for Analysis. Square Feet Acreage
Outside of Existing TIRZ 250,424 5.75
Inside of Existing TIRZ 2,107,733 48.39

41
Tax Increment Financing
With the total area of surface parking meeting the analysis criteria in the Houston CBD collected,
and estimated assessed value per improved square foot for each land use, the next task in the
analysis involved building a TIF model to show potential revenues. Inventory was separated by
TIRZ and those surface lots not currently in a TIRZ.
A hypothetical TIF scenario was created to determine the potential incremental tax revenues
from surface parking outside of existing TIRZ districts. The results from this hypothetical TIF
scenario are not intended to be taken as the result of a detailed market analysis of the area, but
rather to determine potential untapped revenue that can be generated from these parcels. The
parameters for this TIF are as follows:
TIF establishment: 2018.
Duration: 20 years.
Construction start/completion: 2020.
City of Houston as participating tax entity (0.586420 tax rate).
Annual growth rate: 2 percent.11
No additional obligations (i.e., affordable housing, flood control).
Projected revenues from each existing TIRZ are not included in this report. Each TIRZ has
varying degrees of participation from each tax entity. Moreover, there are existing financial
obligations for each TIRZ authority. Therefore, any potential incremental tax revenues generated
by the redevelopment of surface parking in these districts are already accounted for.
To determine how the governing board of each TIRZ would choose to allocate additional
incremental tax revenues is outside of the scope of this project. Results will show potential
assessed value growth from redevelopment of existing surface parking only.
Results
For the purposes of this project, tax revenues are shown for only surface parking lots in the CBD.
Typically, when developing a TIF financing plan, the estimated revenue will encompass all
properties within the designated boundary.
Analysis of potential added taxable value through the redevelopment of surface parking outside
of existing TIRZs, given the parameters set in the previous section, has an approximate range of
$82 million to $722 million for 2020. This represents the incremental gains over existing
assessed values through redevelopment of all surface parking acreage in the analysis area. Refer
to Table 10 for a detailed look at the estimated potential redevelopment for each land use. These
11 The TIRZ 24 and TIRZ 3 project financing plans were used as reference for growth rates. A 2 percent growth rate
was used for conservative estimates. Higher growth rates were used after detailed area analysis was conducted. For
purposes of this project, a conservative approach was most appropriate.

42
values are intended to be independent of the others (i.e., if all acreage used as surface parking in
the analysis area were to redevelop as the selected land use). Redevelopment values were
calculated based on available land and the values noted in Table 8.
Table 10. Potential Incremental Assessed Value, Outside of Existing TIRZ.
Land Use Base (2018) ($) Potential Post-Development Value (2020) ($)
Increment ($)
Misc. Commercial 50,480,163 313,276,936 262,796,773
Office 50,480,163 772,098,079 721,617,916
Apartments - Garden Style 50,480,163 132,066,551 81,586,388
Apartments - Mid Rise to High Rise 50,480,163 271,192,616 220,712,453
Real, Residential, Multi-Family 50,480,163 555,667,809 505,187,646
Extended Stay Hotel-Motel 50,480,163 156,116,040 105,635,877
Hotels, Full Service 50,480,163 442,247,020 391,766,857
Motels\Limited Service Hotels 50,480,163 426,106,433 375,626,270
Medical 50,480,163 319,577,659 269,097,496 *Base year frozen at 2018 values. These values remain frozen for the duration of the TIF.
The values in Table 10 represent a one-year change in assessed value from the base year (2018)
to the set construction year (2020). Using these values, one can calculate incremental tax revenue
projected over the course of the 20-year TIF.
If a TIF is set up to capture the tax revenue increment resulting from the increased property
values shown in Table 10, using the parameters set in the methodology section of this report,
there is an estimated average annual revenue of between $575,000 and $4.7 million, depending
on the land use of the redevelopment. A detailed look at estimated revenue per land use is shown
in Table 11.
Table 11. Estimated Average Annual Tax Increment Revenue, Outside of Existing TIRZ
Land Use Revenue ($) Revenue Per Acre ($)
Misc. Commercial 722,480 125,673
Office 4,657,593 810,171
Apartments - Garden Style 575,362 100,082
Apartments - Mid Rise to High Rise 1,462,732 254,437
Real, Residential, Multi-Family 1,242,108 216,060
Extended Stay Hotel-Motel 728,753 126,764
Hotels, Full Service 2,553,746 444,215
Motels\Limited Service Hotels 2,450,799 426,307
Medical 1,771,340 308,118
The estimated tax increment revenue results do not account for tax delinquency, a lag in tax
collections, or any tax exemptions/abatements on new development. The results also do not
account for any changes in assessed value to existing development in the area or any
administrative costs to establish and maintain the TIF.
43
The upper boundary of the results is the most unlikely outcome of development. This amount
would indicate that all existing surface parking would redevelop as the highest valued land use in
the same year. Without a detailed development plan for the entire area, these results are
hypothetical. It would be more likely that the surface parking would redevelop as a mix of these
land uses.
The results for this part of the analysis show the potential redevelopment value of all surface
parking within the existing TIRZs. As stated previously in this report, it is unlikely that every
parcel used for surface parking would redevelop simultaneously. This is especially true of the
nearly 50 acres of existing surface parking within the existing TIRZ districts.
Examining surface parking within existing TIRZs, the potential changes in taxable values, and
resulting revenues collected, is more challenging than lots outside of an increment-financing
district. As stated in the Methodology section of this report, each existing TIRZ has unique
participation rates by taxing entity, scheduled and completed projects, and various administrative
and external costs. As such, it would be outside of the scope of this project to determine how
much of the incremental value would be captured as revenue, and how each TIRZ authority
would use those revenues.
For this report, researchers estimated the change in value in the year 2020. The year 2020 was
chosen to be consistent with the hypothetical TIF scenario developed for properties outside of an
existing TIRZ. In addition, this analysis assumed that the value of both existing parcels and
redevelopment would grow at 2 percent annually. Each TIRZ was established at different times.
TIRZ 3 and TIRZ 24 were established in 1999 and 2012 respectively, which means that their
base tax values were frozen in these years. Any added value, such as appreciation of the
property, is counted as the incremental value. To simplify the results, the analysis estimated
values if redevelopment of all parcels was to occur in 2020.
Table 12 suggests that through redevelopment of surface parking lots currently in TIRZs, there is
between $562 million and $6 billion of unleveraged increment tax revenue. These figures assume
that all 48.39 acres were to redevelop as a single land use type.
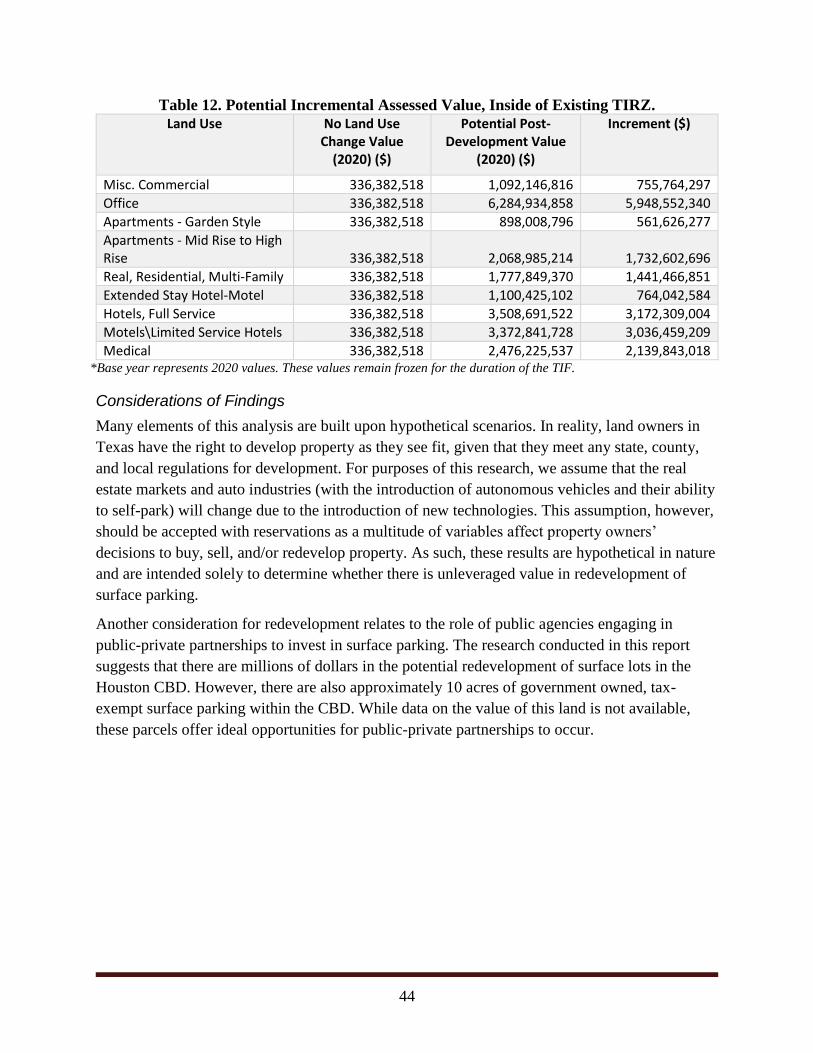
44
Table 12. Potential Incremental Assessed Value, Inside of Existing TIRZ.
Land Use No Land Use Change Value
(2020) ($)
Potential Post-Development Value
(2020) ($)
Increment ($)
Misc. Commercial 336,382,518 1,092,146,816 755,764,297
Office 336,382,518 6,284,934,858 5,948,552,340
Apartments - Garden Style 336,382,518 898,008,796 561,626,277
Apartments - Mid Rise to High Rise 336,382,518 2,068,985,214 1,732,602,696
Real, Residential, Multi-Family 336,382,518 1,777,849,370 1,441,466,851
Extended Stay Hotel-Motel 336,382,518 1,100,425,102 764,042,584
Hotels, Full Service 336,382,518 3,508,691,522 3,172,309,004
Motels\Limited Service Hotels 336,382,518 3,372,841,728 3,036,459,209
Medical 336,382,518 2,476,225,537 2,139,843,018 *Base year represents 2020 values. These values remain frozen for the duration of the TIF.
Considerations of Findings
Many elements of this analysis are built upon hypothetical scenarios. In reality, land owners in
Texas have the right to develop property as they see fit, given that they meet any state, county,
and local regulations for development. For purposes of this research, we assume that the real
estate markets and auto industries (with the introduction of autonomous vehicles and their ability
to self-park) will change due to the introduction of new technologies. This assumption, however,
should be accepted with reservations as a multitude of variables affect property owners’
decisions to buy, sell, and/or redevelop property. As such, these results are hypothetical in nature
and are intended solely to determine whether there is unleveraged value in redevelopment of
surface parking.
Another consideration for redevelopment relates to the role of public agencies engaging in
public-private partnerships to invest in surface parking. The research conducted in this report
suggests that there are millions of dollars in the potential redevelopment of surface lots in the
Houston CBD. However, there are also approximately 10 acres of government owned, tax-
exempt surface parking within the CBD. While data on the value of this land is not available,
these parcels offer ideal opportunities for public-private partnerships to occur.

45
Summary
The purpose of this report is to identify the potential effects that smart parking systems could
have on congestion and land uses within a CBD in Texas, and how value capture methods could
provide a source of revenue to partially pay for these and other types of transportation
improvements. This report used the Houston CBD as a case study for analysis.
While the analysis approach was limited to the local level, the probable benefits of a smart
parking system to the state’s roadway network and how these benefits could be garnered at no
cost to the state was the focus of the analysis. This report aided in the development of a parking
inventory to identify disparities in the assessed values between land use types in the Houston
CBD. While this report is narrow in scope, researchers believe that the findings in this report are
applicable to not only other CBDs within Texas, but also to the surrounding urban areas where
the majority of the population lives, in addition to other similar congestion mitigation strategies.
The analysis conducted in this report suggests that opportunities exist to capture the increased
value of redeveloped surface parking lots outside of existing TIRZs in downtown Houston. The
results estimate approximately $4.4 million per year in congestion savings for the City of
Houston if a smart parking system were to be implemented. Additionally, there are millions of
dollars in feasible assessed value not currently being leveraged in existing TIRZs. These existing
TIRZs are tasked with improving infrastructure, including transportation enhancements.
Improvements to transportation infrastructure at the local level will also benefit the state system;
therefore, encouraging local transportation initiatives, in many cases, may increase efficiency of
the state system, delaying or eliminating the need for the state to fund other, costlier
transportation improvements.
Although an estimated dollar per year in congestion savings was reported, the report does not
include an estimated cost value of implementation of a smart parking system in Houston. The
case study of SFpark found implementation of their smart parking system was approximately
$38.5 million over a seven-year period. SFpark’s approximate cost can only be used as a point of
reference and not as an estimate for a similar parking system in Houston due to various factors.
Additional research will need to be conducted to provide an estimated cost value of a smart
parking system in Houston.
It is important to reiterate that although these findings suggest the potential for multi-million
dollar values in redevelopment, they rely on hypothetical market changes. The analysis
conducted in this report shows disparities between the assessed values of land uses within
downtown Houston that may encourage inefficient land uses. Regardless of market changes by
private developers, this disparity may offer opportunities for state, county, or local governments
to engage in public-private partnerships to leverage additional funds for transportation
infrastructure improvements.
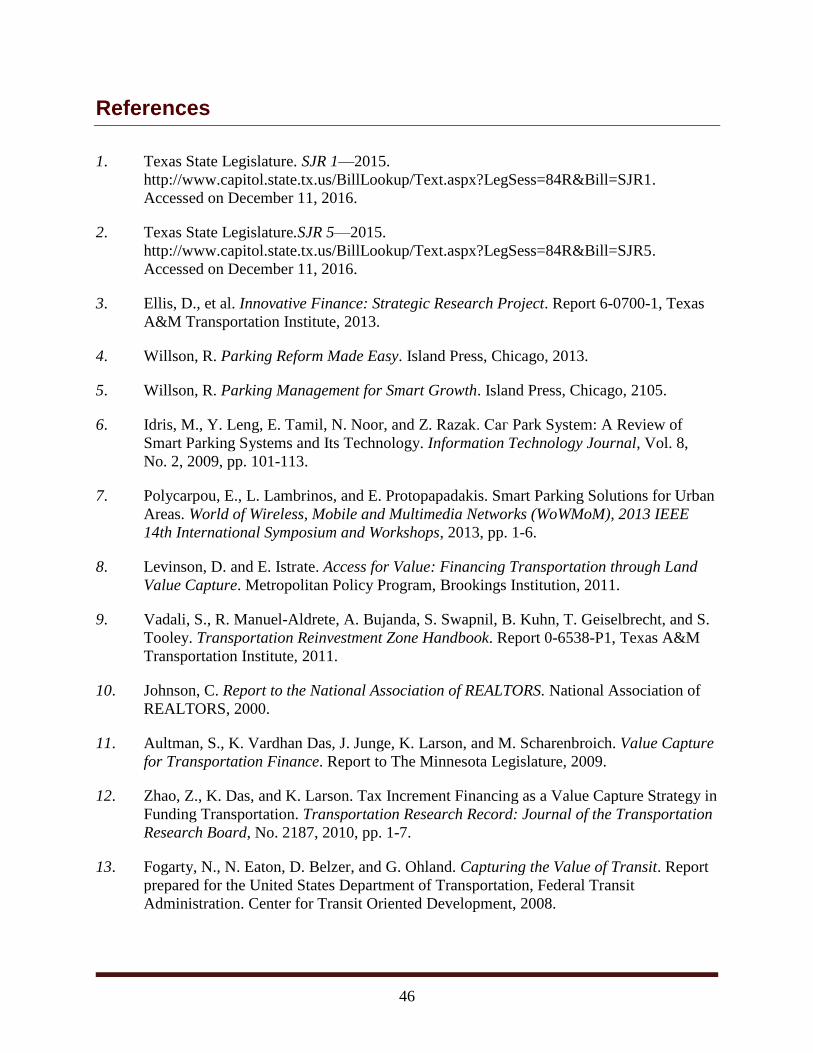
46
References
1. Texas State Legislature. SJR 1—2015.
http://www.capitol.state.tx.us/BillLookup/Text.aspx?LegSess=84R&Bill=SJR1.
Accessed on December 11, 2016.
2. Texas State Legislature.SJR 5—2015.
http://www.capitol.state.tx.us/BillLookup/Text.aspx?LegSess=84R&Bill=SJR5.
Accessed on December 11, 2016.
3. Ellis, D., et al. Innovative Finance: Strategic Research Project. Report 6-0700-1, Texas
A&M Transportation Institute, 2013.
4. Willson, R. Parking Reform Made Easy. Island Press, Chicago, 2013.
5. Willson, R. Parking Management for Smart Growth. Island Press, Chicago, 2105.
6. Idris, M., Y. Leng, E. Tamil, N. Noor, and Z. Razak. Саг Park System: A Review of
Smart Parking Systems and Its Technology. Information Technology Journal, Vol. 8,
No. 2, 2009, pp. 101-113.
7. Polycarpou, E., L. Lambrinos, and E. Protopapadakis. Smart Parking Solutions for Urban
Areas. World of Wireless, Mobile and Multimedia Networks (WoWMoM), 2013 IEEE
14th International Symposium and Workshops, 2013, pp. 1-6.
8. Levinson, D. and E. Istrate. Access for Value: Financing Transportation through Land
Value Capture. Metropolitan Policy Program, Brookings Institution, 2011.
9. Vadali, S., R. Manuel-Aldrete, A. Bujanda, S. Swapnil, B. Kuhn, T. Geiselbrecht, and S.
Tooley. Transportation Reinvestment Zone Handbook. Report 0-6538-P1, Texas A&M
Transportation Institute, 2011.
10. Johnson, C. Report to the National Association of REALTORS. National Association of
REALTORS, 2000.
11. Aultman, S., K. Vardhan Das, J. Junge, K. Larson, and M. Scharenbroich. Value Capture
for Transportation Finance. Report to The Minnesota Legislature, 2009.
12. Zhao, Z., K. Das, and K. Larson. Tax Increment Financing as a Value Capture Strategy in
Funding Transportation. Transportation Research Record: Journal of the Transportation
Research Board, No. 2187, 2010, pp. 1-7.
13. Fogarty, N., N. Eaton, D. Belzer, and G. Ohland. Capturing the Value of Transit. Report
prepared for the United States Department of Transportation, Federal Transit
Administration. Center for Transit Oriented Development, 2008.

47
14. Euritt, M., A. Almquist, and C. Walton. Transportation Corporations and Road Utility
Districts: The Texas Experience. Publication FHWA/TX-93+1270-1F. Texas Department
of Transportation, 1992.
15. Rybeck, R. Using Value Capture to Finance Infrastructure and Encourage Compact
Development. Public Works Management & Policy, Vol. 8, No. 4, 2004, pp. 249-260.
16. Wilson, Reid C. Development Agreements: Basics and Beyond.
http://www.wcglaw.net/assets/docs/publications/development-agreements.pdf
17. Oates, W. E. and R. Schwab. The Impact of Urban Land Taxation: The Pittsburgh
Experience. National Tax Journal, Vol. 50, No. 1, 1997, pp. 1-21.
18. Shoup, D. The High Cost of Free Parking. Planners Press, Chicago, 2005.
19. Pierce, G. and D. Shoup. Getting the Prices Right: An Evaluation of Pricing Parking by
Demand in San Francisco. Journal of the American Planning Association, Vol 79, No. 1,
2013, pp. 67-81.
20. San Francisco Municipal Transportation Agency (SFMTA). The SFTA’s Evaluation of
the Benefits of the SFpark Pilot Project, SFpark Pilot Project Evaluation. 2014.
21. Perry, K. Building Owners Might Subsidize Free Bus Passes for 40,000 Downtown
Workers. The Columbus Dispatch, March 12, 2017.
http://www.dispatch.com/news/20170312/building-owners-might-subsidize-free-bus-
passes-for-40000-downtown-workers. Accessed June, 2017.
22. Watanabe, T. and K. Nagayama, Transportation Demand Management in the Historical
Area of Istanbul: A Pilot Project of Smart Parking System. Journal of the Eastern Asia
Society for Transportation Studies, Vol. 11, 2015, pp. 169-188.
23. Center for Neighborhood Technology. Paved Over: Surface Parking Lots or
Opportunities for Tax-Generating, Sustainable Development? 2006.
http://www3.drcog.org/documents/archive//PavedOver-Final.pdf, Accessed June, 2017.
24. Wise, D. Public Transportation: Federal Role in Value Capture Strategies for Transit Is
Limited, but Additional Guidance could Help Clarify Policies. Report GAO-10-781.
Government Accountability Office, 2010.
25 Houston County Appraisal District (n.d.). Public data. Available at http://pdata.hcad.org/.
26. Houston Economic Development (n.d.). Downtown Redevelopment Authority.
http://www.mainstreettirz.com/home.html. Accessed June, 2017.
27 City of Houston (1995). TIRZ 3 City of Houston, Texas, Ordinance 95-1323. Available
at http://www.houstontx.gov/ecodev/tirzdocs/03/creation.pdf
28 City of Houston (2012). TIRZ 24 City of Houston, Texas, Ordinance 2012-1048.
Available at http://www.houstontx.gov/ecodev/tirzdocs/24/creation.pdf.