findings of mgsp 2008 survey 2008 mgsp kickoff 28 october 2008
Post on 20-Dec-2015
214 views
TRANSCRIPT

Findings of MGSP 2008 Survey
2008 MGSP Kickoff 28 October 2008

Sampling Frame
• 2400 surveys were mailed out– 1200 farm residents– 800 rural residents– 400 urban residents
• Undeliverable/bad addresses were minimal– 18 for farm residents– 66 for non-farm residents

Distribution of 2008 sample
Urban, 16.5%
Rural, 33.5%
Farm, 47.2%
Unknown, 2.8%

Age of respondents (2008)
1.3
15.4
42.3
0.0
12.2
50.8
37.0
0.3
13.6
47.8
38.340.9
0
10
20
30
40
50
60
Less than 25 yrs 25-44 yrs 45-64 yrs 65yrs and over
Age group
Per
cen
tag
e o
f re
spo
nd
ents
Urban
Rural
Farm

Farm Operations
36.8
48.3
37.9
13.1
8.86.1
3.5 3.2
0
5
10
15
20
25
30
35
40
45
50
55
Farm Operation
Per
cen
tag
e o
f F
arm
ers

Farm Size (1996-2008)
55
21
68
31
46
22
14
33
10
0
10
20
30
40
50
60
70
1996 2000 2008
Year
Per
cen
tag
e o
f F
arm
ers
100 acres or less
101-400 acres
More than 400 acres

Groundwater Knowledge (2000 & 2008)
5154
59
555557 57 56
0
10
20
30
40
50
60
70
Urban Rural Farm All
Sub-sample
Ave
rag
e sc
ore
(%
)
2000
2008

High risk perception of land use on groundwater (2008)
66
57
45
27
59
54
49
33
51
41
37
27
0
10
20
30
40
50
60
70
Nation Michigan County Home/property
Location of risk impact
Per
cen
tag
e o
f re
spo
nd
ents
Urban
Rural
Farm

High risk perception of land use on groundwater (1996-2008)
3735
22
47
40
34
20
56
48
42
29
45
0
10
20
30
40
50
60
Nation Michigan County Home/property
Location of risk impact
Per
cen
tag
e o
f re
spo
nd
ents
1996
2000
2008


Participation in Groundwater Programs (1996-2008)
3.3
1.4
0
3.3
2.4
1.9
6.1
4.2
2.3
4.2 4.2
2.8
3.3
1.11.4
2.7
1.9
00
1
2
3
4
5
6
7
Cost share Local GWSteams
Ag chem spillasst
Tech asst Regional GWspec
GW envlopmonitoring
Program/Facility
Per
cen
tag
e cu
rren
tly
usi
ng
1996
2000
2008

Participation in Groundwater Programs (1996-2008)
3.8 3.8
0.50.9
4.7 4.75.1
2.3
6.1
4.14.4
1.4
4.9
1.9
0
1
2
3
4
5
6
7
Clean sweep Pesticide contrecycling
Wellheadprogram
HH hazardousdroop-off
MGSP
Program/Facility
Per
cen
tag
e cu
rren
tly
usi
ng
1996
2000
2008

Sources of Groundwater Information (2008)
19
13
109
76 6
5
0
5
10
15
20
ConservationDistrict
MSU Extension Farm Bureau ConservationDistrict newsleter
Friend MSU Extensionnewsletter
Local newspaper MSU Extensionweb
Information source
Per
cen
tag
e o
f ti
me
cite
d

Water supply to homes (1996-2008)
Farmers Non-Farmers
88.7
95.4 94.1
50.4 51.3
68.7
10.4
4.6 5.9
48.6 48.3
30.4
0.9 1.0 0.4 0.80
10
20
30
40
50
60
70
80
90
100
1996 2000 2008 1996 2000 2008
Year
Pe
rce
nta
ge
of
res
po
nd
en
ts
Private Well
Public water system
Don't know

Origin of Public Water (1996-2008)
Farmers Non-Farmers
4543
57
41
29 30
4548
33
27
39
34
10 10 10
29
32
36
0
10
20
30
40
50
60
1996 2000 2008 1996 2000 2008
Year
Per
cen
tag
e o
f re
spo
nd
ents
Surface water source
Groundwater source
Don't know

Testing of drinking water (1996-2008)
67
79 79
63
6873
0
10
20
30
40
50
60
70
80
90
1996 2000 2008
Year
Per
cen
ateg
of
resp
on
den
ts
Farm
Non-farm
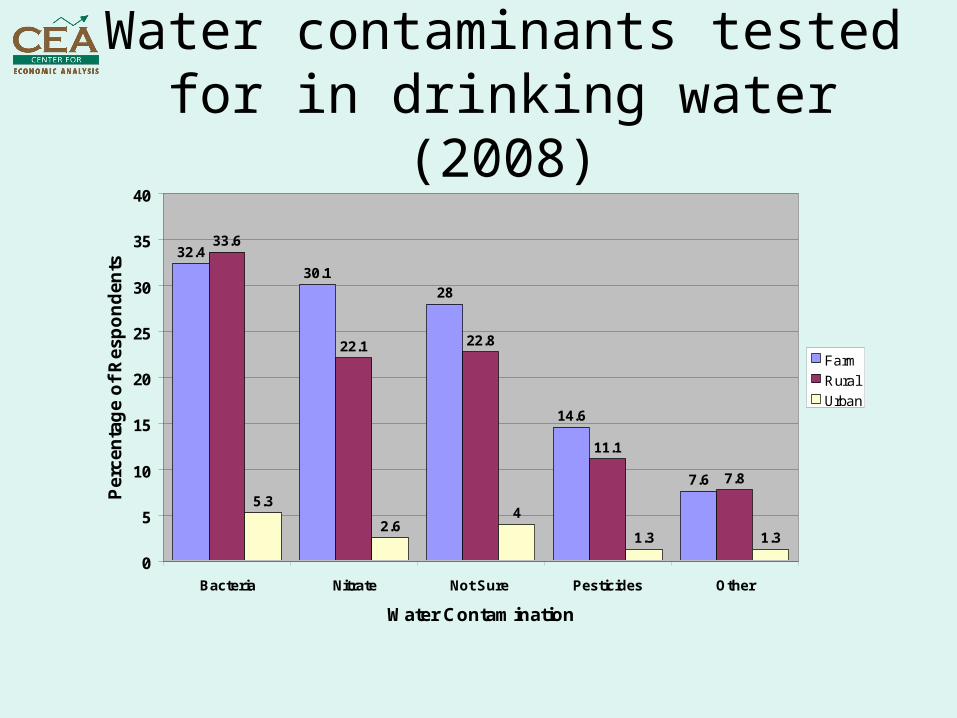
Water contaminants tested for in drinking water (2008)
30.128
14.6
7.6
33.6
22.1 22.8
11.1
7.8
5.3
2.64
1.3 1.3
32.4
0
5
10
15
20
25
30
35
40
Bacteria Nitrate Not Sure Pesticides Other
Water Contamination
Per
cen
tag
e o
f R
esp
on
den
ts
Farm
Rural
Urban

Home and Garden Practices of Non-Farmers (2000 & 2008)
Undesirable Practice
78
51
13
94
13
32
73
83
39
16
95
11
44
79
0
10
20
30
40
50
60
70
80
90
100
Set mowercutting blade
Storepesticide in
garage
Measureamount of
water
Readdirections
Use prof lawncare provider
Drop-offprogarm
Identify pestbefore using
pesticide
Home and garden practices
Per
cen
tag
e o
f re
spo
nd
ents
2000
2008

Farm Management Practices of Farmers (2008)
NOTE: FAS is Farm Assessment System
30
66
93
79
68
4145
11
38
59
41
22
9
24
0
20
40
60
80
100
Watertesting
Containerrecycling
Triple orpowerrinsing
Use air-gapor anti-
backflow
Spill kitavailable
Writtendrift mgt
plan
Writtennutrientmgt plan
Farm Management Practice
Per
ecn
tag
e o
f F
arm
ers
FAS farmers
Non-FAS farmers

Farm Management Practices of Farmers (2000 & 2008)
Undesirable Practices
38
22 22
33
18
7
28
12
22
2928
9
0
5
10
15
20
25
30
35
40
Conduct PSNT Test drinkingwater
Mix pesticideson non-porous
surface
Pesticiderecycling
Rinse awayspills
On-site farmdump
Farm management practice
Per
cen
tag
e o
f fa
rmer
s
2000
2008

Farmers’ Participation in NRCS Programs (2008)
NOTE: NCRS is National Resources Conservation Service
10.6
2.70.4 1.4 1.8 2.7
4.5
25
4.2
1.4
4.25.7
4.32.9
47.1
10 9.7
26.5
9.1
29.4
12.5
0
10
20
30
40
50
CRP CREP CSP EQIP GRP WRP WHIP
NRCS Program
Pe
rce
nta
ge
of
Fa
rme
rs
Small Farm
Medium Farm
Large Farm

Farmers’ Participation in Assessment Systems (2000-2008)
24.0
8.09.3
3.1
0.30
5
10
15
20
25
30
Farm*A*Syst Crop*A*Syst Greenhouse*A*Syst
Assessment System
Per
cen
tag
e o
f fa
rmer
s
2000
2008

Farmers’ Participation in Assessment Systems (2008)
4
0.9
12.3
1.4
38.2
18.2
0
10
20
30
40
Farm*A*Syst Crop*A*Syst
Assessment System
Per
cen
tag
e o
f F
arm
ers
Small Farm
Medium Farm
Large Farm

Effectiveness of Assessment Systems in providing Technical Assistance (2008)
Ineffective, 6%
Somewhat effective, 22%
Effective, 50%
Very effective, 22%

Motivating factors for participating in Assessment Systems (2008)
45.7 45.7
40
28.6
8.6
00
5
10
15
20
25
30
35
40
45
50
Long termviability ofbusiness
RUP Credit Cost-shareincentives
Participation inother program
Mediacampaign
Neighbor'sparticipation
Motivation for participating
Per
cen
tag
e o
f p
arti
cip
atin
g f
arm
ers
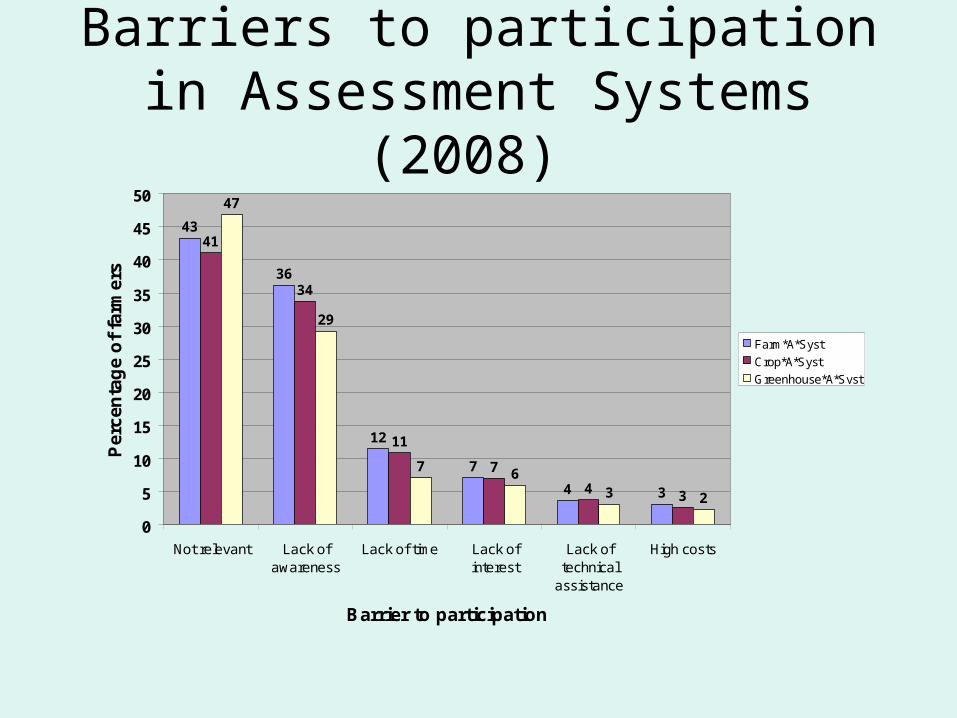
Barriers to participation in Assessment Systems (2008)
43
36
12
7
4 3
41
34
11
7
4 3
47
29
7 63 2
0
5
10
15
20
25
30
35
40
45
50
Not relevant Lack ofawareness
Lack of time Lack ofinterest
Lack oftechnical
assistance
High costs
Barrier to participation
Per
cen
tag
e o
f fa
rmer
s
Farm*A*Syst
Crop*A*Syst
Greenhouse*A*Syst

Knowledge of and participation in MAEAP (2008)
Familiarity with MAEAP MAEAP verified
Yes, 17%
No, 83%
Yes, 5%
No, 95%

Participation in MAEAP by Farmers familiar with MAEAP (2008)
Plan to be MAEAP verified MAEAP Phase 1 Attendance
Yes, 25%
No, 75%
Yes, 26%
No, 62%
Unsure, 12%

Barriers to MAEAP by Non-participating Farmers (2008)
50
33
25
0
10
20
30
40
50
60
Lacks benefits Too time intensive Too expensive
Barrier to MAEAP Verification
Per
cen
tag
e o
f fa
rmer
s

Barriers to MAEAP by Non-participating Farmers (2008)
24
18
59
43
29
3633 33
50
0
10
20
30
40
50
60
Too time intensive Too expensive Lacks benefits
Barrier to MAEAP Verification
Per
cen
tag
e o
f F
arm
ers
Small Farm
Medium Farm
Large Farm
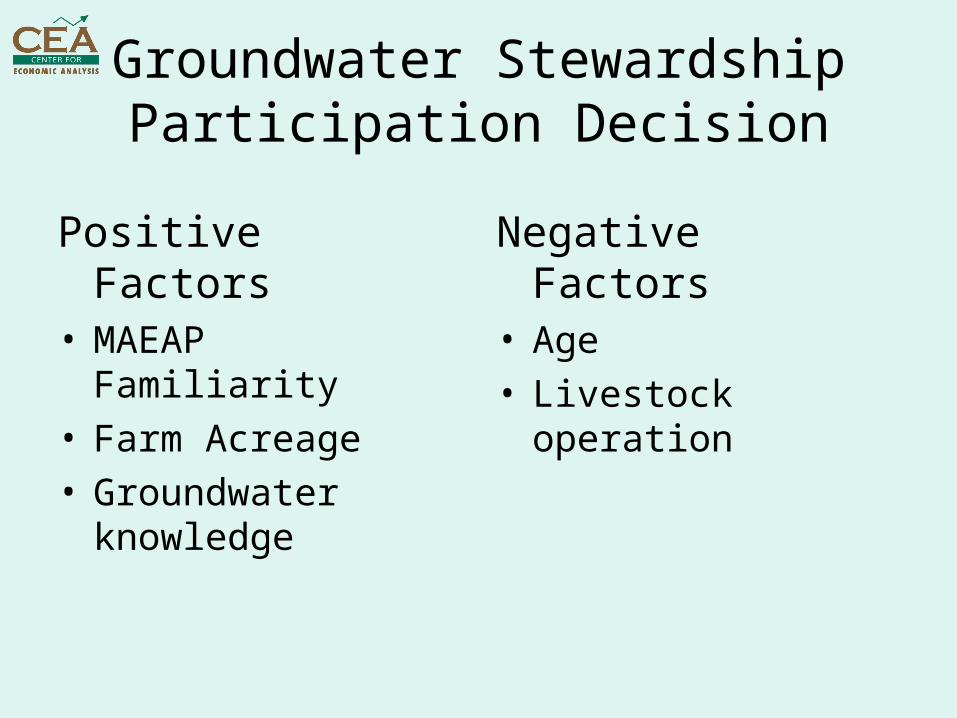
Groundwater Stewardship Participation Decision
Positive Factors• MAEAP Familiarity• Farm Acreage• Groundwater
knowledge
Negative Factors• Age• Livestock operation

Choice of Number of Groundwater Stewardship Practices
Positive Factors• MAEAP Familiarity• MGSP participation• Farm size• Row crop operation
Negative Factors• Hay/Forage operation
Salient Findings
• Groundwater knowledge of Michigan residents remained at comparable level with 1996 results.
• Groundwater knowledge of Michigan resident is not influenced by residential location or by farm size. However, groundwater knowledge appears to be influenced by the level of education.
• Michigan residents’ risk perception of groundwater contamination has risen since the 2000 survey.

Salient Findings
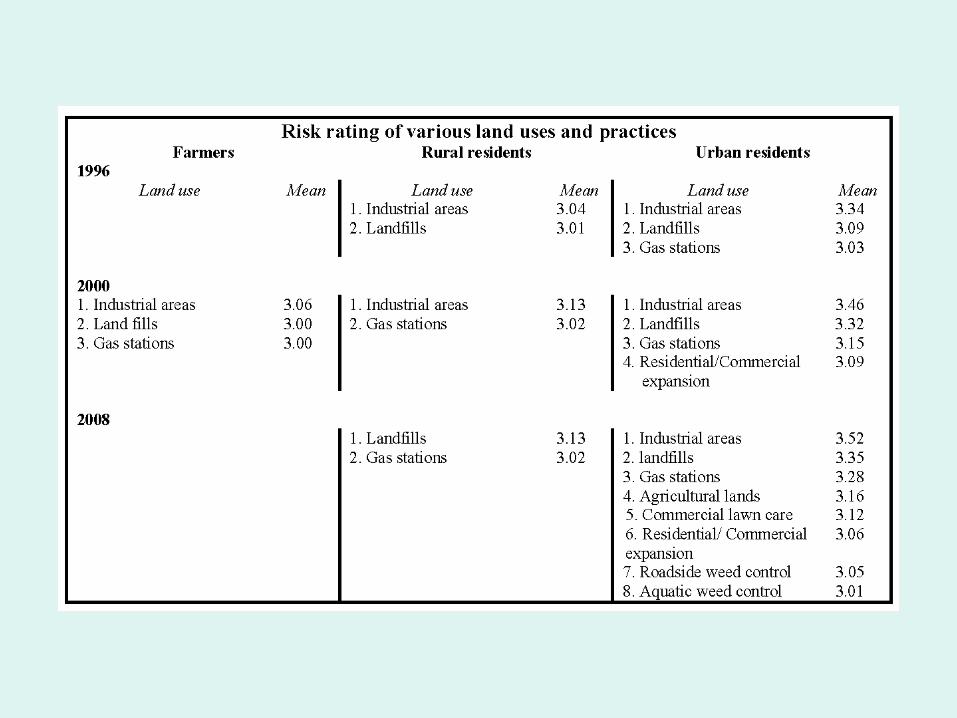
• Urban residents’ perception of the impact of household and industrial material and of the impact of land uses and practices on groundwater quality is much higher than those of farm and rural residents.
• The list of materials and land uses and practices ranked as constituting high to moderate impact on groundwater has been steadily increasing since 1996 and those materials and land uses and practices related to agricultural production featured more prominently on these lists in 2008 than in 1996 or 2000.

Salient Findings• Awareness of and participation in groundwater
conservation programs declined in 2000 compared to previous years. However, large farm operators showed high level of awareness and participation than do small and medium-size farm operators.
• Farmers’ engagement in farm management practices indicative of good stewardship behavior is encouraging. Participation in Farm Assessment System seems to induce farmers to engage in positive groundwater stewardship practices.
• Non-farm home owners’ participation in home and garden practices indicative of good stewardship practices has improved from the 2000 results.

Salient Findings• The practice of testing drinking water remains
popular among Michigan residents although there has been a decline in the percentage of farm and non-farm households that tested their drinking water within a period of less than two years from the survey.
• Farm operators are as familiar with the Michigan Agriculture Environmental Assurance Program (MAEAP) as they are with most groundwater stewardship programs, although large farm operators are more likely to be familiar with MAEAP and identify it as being beneficial than do small and medium-size farm operators.

Salient Findings• The decision by farmers to adopt any groundwater
stewardship practices is positively influenced by knowledge about groundwater issues, farm acreage, and familiarity with MAEAP but negatively influenced by age and having a livestock operation.
• The choice of how many groundwater stewardship practices to adopt is positively influenced by farm size, familiarity with MAEAP, participation in MGSP and having a row crop operation but negatively influenced by having a hay or forage operation.


Race/Ethnicity (2008)
2.04.7
90.5
1.4 1.43.00.3
95.7
0.3 0.70.2 0.0
97.9
0.0 1.9
0
10
20
30
40
50
60
70
80
90
100
American Indian African-American White/Caucasian Spanish/Hispanic Other
Race/Ethnicity
Per
cen
tag
e o
f re
spo
nd
ents
Urban
Rural
Farmers

Groundwater Knowledge (2008)Statement Percentage of Respondents
1996 2000 2008
Farm Rural Urban Farm Rural Urban Farm Rural Urban
Groundwater in Michigan provides water to lakes and streams. (True)
80 82 85 77 78 76 82 83 78
Groundwater generally follows the contours of the land surface. (True)
57 54 61 56 52 61 63 66 69
Irrigation and lawn watering can affect the amount of water leaching into the ground. (True)
86 86 88 89* 81* 86* 88 88 90
Once it reaches the water table, groundwater does not move, unless pumped. (False)
81* 74* 60* 80* 64* 54* 72 68 61
Water that looks clear and tastes good is safe to drink. (False) 81* 93* 91* 84 89 87 87* 94* 88*
Just like surface water, groundwater flows downhill. (True) 44 45 47 44 42 43 40 44 47
It is more cost effective to prevent pollution of groundwater than to pay for the cleanup. (True)
94 95 90 94 93 90 91 91 91
Less than 1% of the earth’s water is available for drinking. (True)
45 45 43 46 42 39 37 40 36
An average American uses 50 gallons of water each day. (False) 20 15 14 14 19 19 16 17 20
Groundwater in Michigan can best be described as an interconnected series of rivers, streams, and caverns. (False)
14 10 7 18 17 14 10 11 11
It is best to apply lawn fertilizers in the spring before the grass starts to turn green. (False)
- - - 45* 38* 28* 34 32 33
Groundwater in Michigan can best be described as a wet sponge where water fills the spaces between soil particles. (True)
67 57 62 59 55 52 58 55 52
Approximately 50% of Michigan’s population relies on groundwater for drinking purposes. (True)
61 56 54 55 56 48 51 53 47
The Groundwater Stewardship Program is a voluntary program that helps people select practices that reduce the risk of groundwater contamination. (True)
61* 37* 42* 61* 34* 30* 63* 54* 52*

Groundwater Knowledge (2008)Statement Percentage of Respondents
Less than High School
High School Diploma
Some College/Assoc
Degree
Four Year Degree
Graduate Level
Groundwater in Michigan provides water to lakes and streams. (True)
77.6* 74.7* 83.6* 88.7* 82.7*
Groundwater generally follows the contours of the land surface. (True)
66.7 59.1 67.5 63.9 68.9
Irrigation and lawn watering can affect the amount of water leaching into the ground. (True)
80.3* 84.5* 90.0* 91.6* 94.0*
Once it reaches the water table, groundwater does not move, unless pumped. (False)
62.3* 60.2* 70.8* 76.3* 74.0*
Water that looks clear and tastes good is safe to drink. (False) 79.4* 88.9* 90.1* 91.7* 93.3*
Just like surface water, groundwater flows downhill. (True) 41.8 42.1 40.0 44.1 46.9
It is more cost effective to prevent pollution of groundwater than to pay for the cleanup. (True)
81.2* 86.4* 93.1* 90.7* 95.3*
Less than 1% of the earth’s water is available for drinking. (True)
23.2* 30.5* 40.8* 37.2* 48.7*
An average American uses 50 gallons of water each day. (False) 17.4 20.7 17.3 14.6 11.6
Groundwater in Michigan can best be described as an interconnected series of rivers, streams, and caverns. (False)
8.8 8.1 10.9 15.5 12.0
It is best to apply lawn fertilizers in the spring before the grass starts to turn green. (False)
30.9 27.5 33.5 42.3 36.2
Groundwater in Michigan can best be described as a wet sponge where water fills the spaces between soil particles. (True)
51.5* 49.8* 54.5* 60.8* 66.0*
Approximately 50% of Michigan’s population relies on groundwater for drinking purposes. (True)
44.9 52.3 54.5 50.5 45.3
The Groundwater Stewardship Program is a voluntary program that helps people select practices that reduce the risk of groundwater contamination. (True)
52.2 56.1 58.7 64.6 59.3

Groundwater Knowledge (2008)Statement Percentage of respondents with correct answer
Farm Rural Urban
Groundwater in Michigan provides water to lakes and streams. (Correct) 82 83 78
Groundwater generally follows the contours of the land surface. (Correct) 63 66 69
Irrigation and lawn watering can affect the amount of water leaching into the ground. (Correct)
88 88 90
Once it reaches the water table, groundwater does not move, unless pumped. (Incorrect)
72 68 61
Water that looks clear and tastes good is safe to drink. (Incorrect) 87* 94* 88*
Just like surface water, groundwater flows downhill. (Correct) 40 44 47
It is more cost effective to prevent pollution of groundwater than to pay for the cleanup. (Correct)
91 91 91
Less than 1% of the earth’s water is available for drinking. (Correct) 37 40 36
An average American uses 50 gallons of water each day. (Incorrect) 16 17 20
Groundwater in Michigan can best be described as an interconnected series of rivers, streams, and caverns. (Incorrect)
10 11 11
It is best to apply lawn fertilizers in the spring before the grass starts to turn green. (Incorrect)
34 32 33
Groundwater in Michigan can best be described as a wet sponge where water fills the spaces between soil particles. (Correct)
58 55 52
Approximately 50% of Michigan’s population relies on groundwater for drinking purposes. (Correct)
51 53 47
The Groundwater Stewardship Program is a voluntary program that helps people select practices that reduce the risk of groundwater contamination. (Correct)
63* 54* 52*

Groundwater Knowledge (2008)Statement Farm size
Small Medium Large
Groundwater in Michigan provides water to lakes and streams. (Correct) 83.7 86.1 75.7
Groundwater generally follows the contours of the land surface. (Correct) 66.9* 69.2* 45.9*
Irrigation and lawn watering can affect the amount of water leaching into the ground. (Correct)
87.1 92.4 86.5
Once it reaches the water table, groundwater does not move, unless pumped. (Incorrect)
72.1 73.4 81.1
Water that looks clear and tastes good is safe to drink. (Incorrect) 91.4 87.3 89.2
Just like surface water, groundwater flows downhill. (Correct) 45.2 33.3 48.6
It is more cost effective to prevent pollution of groundwater than to pay for the cleanup. (Correct)
91.3 92.3 100
Less than 1% of the earth’s water is available for drinking. (Correct) 40.0 32.5 37.8
An average American uses 50 gallons of water each day. (Incorrect) 19.7 9.1 13.9
Groundwater in Michigan can best be described as an interconnected series of rivers, streams, and caverns. (Incorrect)
9.9 12.7 8.1
It is best to apply lawn fertilizers in the spring before the grass starts to turn green. (Incorrect)
35.2 37.7 45.9
Groundwater in Michigan can best be described as a wet sponge where water fills the spaces between soil particles. (Correct)
59.7 51.3 56.8
Approximately 50% of Michigan’s population relies on groundwater for drinking purposes. (Correct)
49.0 48.1 51.4
The Groundwater Stewardship Program is a voluntary program that helps people select practices that reduce the risk of groundwater contamination. (Correct)
57.6* 74.4* 75.7*