finite element simulation of ultrasonic waves in corroded...
TRANSCRIPT

Finite Element Simulation of Ultrasonic Waves in CorrodedReinforced Concrete for Early-stage Corrosion Detection
Qixiang Tang and Tzuyang Yu
Department of Civil and Environmental EngineeringUniversity of Massachusetts Lowell
One University Avenue, Lowell, MA 01854, U.S.A.
ABSTRACT
In reinforced concrete (RC) structures, corrosion of steel rebar introduces internal stress at the interface betweenrebar and concrete, ultimately leading to debonding and separation between rebar and concrete. Effective early-stage detection of steel rebar corrosion can significantly reduce maintenance costs and enable early-stage repair.In this paper, ultrasonic detection of early-stage steel rebar corrosion inside concrete is numerically investigatedusing the finite element method (FEM). Commercial FEM software (ABAQUS) was used in all simulation cases.Steel rebar was simplified and modeled by a cylindrical structure. 1MHz ultrasonic elastic waves were generatedat the interface between rebar and concrete. Two-dimensional plain strain element was adopted in all FE models.Formation of surface rust in rebar was modeled by changing material properties and expanding element size inorder to simulate the rust interface between rebar and concrete and the presence of interfacial stress. Two typesof surface rust (corroded regions) were considered. Time domain and frequency domain responses of displacementwere studied. From our simulation result, two corrosion indicators, baseline (b) and center frequency (fc) wereproposed for detecting and quantifying corrosion.
Keywords: Finite element method (FEM), damage detection, rebar corrosion
1. INTRODUCTION
In the past, fiber optic sensors (FOS) have been successfully applied in civil engineering for monitoring strains,displacements, and cracks of reinforced concrete (RC) and steel structures,1 as well as for nondestructive testing(NDT) and structural health monitoring (SHM) applications.2 Taking advantage of the small size of FOS,civil engineers can measure internal status of RC structures without introducing significant effect of stressconcentration, during and after construction.3,4 An ultrasonic FOS prototype has been proposed to activelymonitor the local condition inside RC structures by utilizing the surface wave generated by the FOS.5,6 Theactive sensing capability of such FOS prototype can be applied to the early-stage detection of steel rebar corrosioninside RC structures. Nonetheless, surface wave propagation behavior inside RC structures need to be betterstudied.
The objective of this study is to better understand the surface wave propagation behavior of ultrasonicsignals between steel rebar and concrete in RC structures. In this research, the wave propagation behaviorof an ultrasonic wave with center frequency of 1 MHz was studied. Finite element (FE) method was appliedin building numerical RC models and simulating wave propagation in RC models. A commercial FE softwarepackage ABAQUS R© (by Dassault Systems) was chosen for its wide applications in explicit analysis. Two FOSwere distributed on both sides of a rebar model, in order to efficiently detect surface corrosion between two FOS.7
Time domain and frequency domain responses were analyzed for corrosion detection.
In this paper, FE modeling of intact and corroded rebar models is first described. Design of FE models andcharacterization of artificial corrosion are provided. Two corrosion indicators based on the time domain andfrequency domain displacement responses are proposed for locating and quantifying surface corrosion. Finally,a corrosion detection method is proposed from research findings.
Further author information: (Send correspondence to T. Yu)E-mail: tzuyang [email protected], Telephone: 1 978 934 2288
1
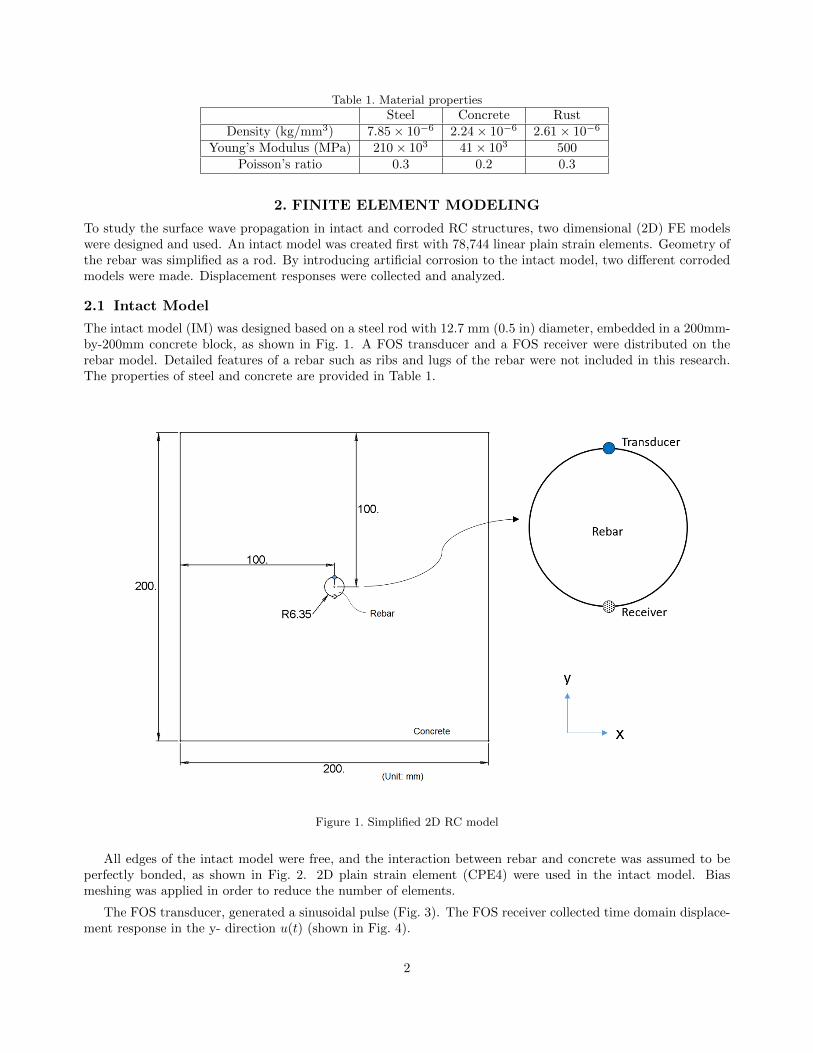
Table 1. Material properties
Steel Concrete RustDensity (kg/mm3) 7.85 × 10⁻⁶ 2.24 × 10⁻⁶ 2.61 × 10⁻⁶
Young’s Modulus (MPa) 210 × 103 41 × 103 500Poisson’s ratio 0.3 0.2 0.3
2. FINITE ELEMENT MODELING
To study the surface wave propagation in intact and corroded RC structures, two dimensional (2D) FE modelswere designed and used. An intact model was created first with 78,744 linear plain strain elements. Geometry ofthe rebar was simplified as a rod. By introducing artificial corrosion to the intact model, two different corrodedmodels were made. Displacement responses were collected and analyzed.
2.1 Intact Model
The intact model (IM) was designed based on a steel rod with 12.7 mm (0.5 in) diameter, embedded in a 200mm-by-200mm concrete block, as shown in Fig. 1. A FOS transducer and a FOS receiver were distributed on therebar model. Detailed features of a rebar such as ribs and lugs of the rebar were not included in this research.The properties of steel and concrete are provided in Table 1.
Figure 1. Simplified 2D RC model
All edges of the intact model were free, and the interaction between rebar and concrete was assumed to beperfectly bonded, as shown in Fig. 2. 2D plain strain element (CPE4) were used in the intact model. Biasmeshing was applied in order to reduce the number of elements.
The FOS transducer, generated a sinusoidal pulse (Fig. 3). The FOS receiver collected time domain displace-ment response in the y- direction u(t) (shown in Fig. 4).
2

Figure 2. Meshing of the intact model
2.2 Corroded Models
Two corroded models, global corrosion model (GCM) and local corrosion model (LCM), were created by intro-ducing artificial corrosion to the intact model. Two types of artificial corrosion were used in this research; globalcorrosion and local corrosion, as shown in Fig. 4.
• Global corrosion – As shown in Fig. 4, global corrosion was a rust layer surrounding the rebar with athickness (h) of 0.1mm. The outer diameter of the rust layer was 12.7 mm (0.5 in). The arc length (a) (orperimeter) of global corrosion was 39.897mm.
• Local corrosion – A local corrosion was a section of global rust layer, as is shown in Fig. 4. The arc length(a) of this section was 3.32 mm (0.13 in).
Two realistic corrosion processes were considered; 1) generation of internal stress due to volumetric expansionof corrosion; 2) material property changes from steel to rust. These two processes were carried out by using thefollowing.
1. Defined the material properties in corroded region to be temperature dependent.8 The material properties(e.g. density, Young’s modulus and Poisson’s ratio) was steel when temperature (T) was 0 K, which was set
3

Figure 3. Loading function
Figure 4. Configuration of FOS transducer and receiver and corrosion types
as the default temperature. When temperature became 1 K, material changed from steel to rust, as shownin Table 1. Material at un-corroded region were independent from temperature, and thermal transfer wasnot included in these models.
2. Defined the thermal expansion coefficient α, which indicated the change in a material’s area due to achange in temperature, as 2 K−1. The area of corrosion region expanded for two times when temperatureincreased for 1 K.
3. Increased the temperature in corroded region from 0 K to 1 K. As a result, internal stress was created bythe expansion of corroded region, and the material was updated from steel to rust.
After introducing artificial corrosion to the model, ultrasonic waves were generated at the transducer. Thesewaves propagated in the FE model and caused time domain displacement responses. The receiver, as shown inFig. 4, collects time domain displacement responses in y- directions (u(t)).
4

Since expansion of corrosion would cause internal stress/strain at the receiver’s location, it resulted in aconstant time domain displacement response. This constant displacement response became a baseline (b) of u(t).Eq.(1) was used to calculate the baseline (b) of u(t).
b =
∣∣∣∣∣Σt=tnt=t0 u(t)
n
∣∣∣∣∣ (1)
where b = baseline (mm), u(t) = time domain displacement response (mm), t = time (s) and n = number ofdata points in u(t).
3. SIMULATION RESULTS
3.1 Time Domain Displacement Responses
Time domain displacement responses u(t) was collected by the receiver from intact and corroded models, asshown in Fig. 5. Baselines were found in time domain displacement of two corrosion models. The baseline ofeach corrosion model was calculated by Eq.(1) and listed in the Table. 2. It was found that, when corrosion sizeincreased from LCM to GCM, baseline became greater. The baseline of GCM was 258.13 times greater than theone of LCM.
Baselines were removed by subtracting them from time domain displacement response u(t) of corroded modelsand shown in Fig. 6. The time domain displacement response of LCM and IM were similar to each other,comparing with the one of GCM was different from them.
In terms of amplitude (of u(t)), for example, the peak value of three models were: IM – 3.02 × 10⁻³ mm;LCM – 3.25 × 10⁻³ mm (7.62% of difference from IM); GCM – 3.6 × 10⁻³ mm (20.53% of difference from IM).
In terms of phase shift, LCM had much less effect than GCM. As an example, arrival time of each peak valuewere: IM – 7.40 × 10⁻⁶ mm; LCM – 7.41 × 10⁻⁶ mm; GCM – 10.60 × 10⁻⁶ mm. The differences in arrival timecaused by local and global corrosion were 0.14% and 43.24%.
Figure 5. Time domain displacement response
5

Table 2. Baseline of each modelBaseline (b) (mm)
Intact model (IM) 0Local corrosion model(LCM) 4.8425 × 10⁻⁴
Global corrosion model (GCM) 0.125
Figure 6. Time domain displacement response without baseline
3.2 Frequency Domain Response
By conducting fast Fourier transform (FFT), time domain displacement responses were converted into frequencydomain. Frequency responses of FE models were shown in Figs. 7 to 9. Note that the frequency of any baselinewas 0 Hz since it was a constant. Greater baseline leaded to greater amplitude of 0 Hz component. As anexample, frequency domain response of GCM had greatest 0 Hz component among three models.
Gaussian curve fitting was applied to frequency domain reposes, as shown in Figs. 7 to 9. Center frequency(fc) of each frequency domain response was found from the corresponding fitted curve in its frequency spectrumand listed in Table 3. It was found that when corrosion size increases, center frequency decreases.
3.3 Corrosion Indicators
• Baselines (b) – Because the baseline represened a constant displacement at receiver caused by corrosion,it was select as an indicator for corrosion detection. For example, in the intact model, the baseline waszero. By introducing a local corrosion, baseline value increases to 4.8425 × 10⁻⁴ mm. It was found that,when corrosion size (arc length(a)) increased, baseline also increased. This relationship was described byEq. (2).
a = 1.657 exp (25.45b) (2)
Table 3. Center frequencies
Arc length (mm) (a) Center frequency (fc) (MHz)Intact model (IM) 0 0.365
Local corrosion model (LCM) 3.32 0.159Global corrosion model (GCM) 39.897 0
6

Figure 7. Frequency response of intact model
Figure 8. Frequency response of local corrosion model
where a= arc length of corrosion (mm) and b = baseline (mm).
• Center frequency (fc) – As shown in Table 3, the value of center frequency reduced when arc length(of corrosion) increased. As an example, arc length in the intact model is zero. By introducing a localcorrosion, center frequency fc decreased from 0.365 MHz to 0.159 MHz. This relationship between fc andarc length (a) was described by Eq. (3).
a = 39.9 exp (−15.38fc) (3)
where a= arc length of corrosion (mm) and fc= center frequency (MHz).
4. CONCLUSION
This paper reports our 2D numerical investigation on the surface corrosion detection using surface ultrasonicwaves. Major research findings are summarized in the following.
7

Figure 9. Frequency response of global corrosion model
• The presence of corrosion at the interface between steel rebar and concrete can be detected by the changeof radial displacement ((u(t)) in this research). The appearance of corrosion results in the decrease of timedomain displacement response u(t) in a transmission sensing scenario. This decrease is a constant valueand is defined as the baseline (b). Non-zero values of b suggest the appearance of corrosion. In this study,non-zero baselines were found from both local and global corrosion models (Fig. 5).
• In the time domain, when the size of corrosion (arc length (a)) grows, the baseline (b) in radial displacementalso increases. For example, baseline of GCM is 258.13 times greater than the one of LCM. The empiricalequation (Eq. (2)) is proposed to estimate the corrosion size.
• In the frequency domain, when the size of corrosion (arc length (a)) increases, center frequency fc of radialdisplacement decreases. For example, center frequency fc decreases from 0.365 MHz to 0.159 MHz when alocal corrosion is introduced to the intact RC model. This relationship can be described by Eq. (3).
• A corrosion detection method is proposed here; 1) Measure time domain displacement response in radialdirection (u(t)); 2) Calculate baseline b from the obtained time domain displacement response using Eq. (1);3) If the baseline is not zero, it indicates the existence of corrosion; 4) Once the corrosion is detected,corrosion size can be estimated using predetermined relationship (i.e., Eq.(2)) between arc length (a)and baselines(b). Alternatively, center frequency (fc) can also be used to estimate corrosion size withfollowing steps; 1) Measure time domain displacement response in radial direction (u(t)) and converted itto the frequency domain; 2) Apply Gaussian curve fitting to the frequency spectrum and find the centerfrequency (fc). 3) Use predetermined relationship (i.e., Eq.(3)) between arc length (a) and center frequency(fc) to estimate corrosion size. However, frequency responses always contain noises in practice. Therefore,Eq.(3) needs to be used with caution.
In this paper, two corrosion indicators, baseline (b) and center frequency (fc), are proposed for detectingand quantifying corrosion. A corrosion detection method utilizing baseline (b) and center frequency (fc) issummarized. This method can be used as guidance for inspecting and monitoring corroded RC structures withsmall sensors (e.g., FOS).
5. ACKNOWNLEDGEMENT
The authors want to express their gratitude to the partial support from the National Science Foundation (NSF),the Civil, Mechanical and Manufacturing Innovation (CMMI) Division, through a grant CMMI #1401369 (PI:Prof. X. Wang, UMass Lowell).
8

REFERENCES
[1] Ansari, F., “Structural health monitoring with fiber optic sensors,” Frontiers of Mechanical Engineering inChina , 169–196 (2009).
[2] Mendez, A. and Graver, T., “Overview of fiber optic sensors for ndt applications,” Proceedings of IV NDTPanamerican Conference (2007).
[3] Zou, X., Chao, A., Tian, Y., Wu, N., Zhang, H., Yu, T., and Wang, X., “An experimental study on theconcrete hydration process using fabryperot fiber optic temperature sensors,” Measurement 45 (2012).
[4] Zou, X., Chao, A., Tian, Y., Wu, N., , Yu, T., and Wang, X., “A novel fabry-perot fiber optic temperaturesensor for early age hydration heat study in portland cement concrete,” Smart Structures and System 12(2013).
[5] Zou, X., Schmitt, T., Perloff, D., Wu, N., Yu, T., and Wang, X., “Nondestructive corrosion detection usingfiber optic photoacoustic ultrasound generator,” Measurement 62, 74–80 (2015).
[6] Wu, N., Zou, X., Zhou, J., and Wang, X., “Fiber optic ultrasound transmitters and their applications,”Measurement 79, 164–171 (2016).
[7] Tang, Q. and Yu, T., “Finite element simulation for damage detection of surface rust in steel rebars usingelastic waves,” Proceedings of SPIE Vol. 9804 (2016).
[8] Dassault Systemes, 10 rue Marcel Dassault, CS 40501, 78946 Velizy-Villacoublay Cedex-France,Abaqus/CAE User’s Manual Version 6.12.
[9] Zou, X., Schmitt, T., Perloff, D., Wu, N., Yu, T., and Wang, X., “Nondestructive corrosion detection usingfiber optic photoacoustic ultrasound generator,” Measurement 62, 74–80 (2015).
9