finnigan triton - wwz.ifremer.fr · operator other ... manual control ... welcome to the finnigan...
TRANSCRIPT

Finnigan™
TritonMulticollector Software Version 3.1
Operating Manual
Revision C
116 8950

Technical information contained in this publication is for reference purposes only and is subject to change without notice. Every effort has been made to supply complete and accurate information; however, Thermo Electron assumes no responsibility and will not be liable for any errors, omissions, damage, or loss that might result from any use of this manual or the information contained therein (even if this information is properly followed and problems still arise).
This publication is not part of the Agreement of Sale between Thermo Electron and the purchaser of a Thermo Electron system. In the event of any conflict between the provisions of this document and those contained in Thermo Electron Terms and Conditions, the provisions of the Terms and Conditions shall govern.
Reference to System Configurations and Specifications supersede all previous information and are subject to change without notice.
The products of Thermo Electron Bremen are produced under ISO 9001 accredited quality management systems.
Australia: P.O. Box 239 Rydalmere • Unit 14, 38 – 46 South Street • Rydalmere, N.S.W. 2116 • [61] (02) 9898-9000Austria: Wehlistrasse 27b • A-1200 Wien • [43] (01) 333 50 34-0Belgium: Technologiestraat 47 • B-1082 Brussels • [32] (02) 482 30 30Canada: 5716 Coopers Avenue, Unit 1 • Mississauga, Ontario • L4Z 2E8 • [1] (905) 712-2258France: 16 Avenue du Québec • Silic 765 • Z.A. de Courtaboeuf • F-91963 Les Ulis Cédex • [33] (01) 60 92 48 00Germany: Im Steingrund 4-6 • D-63303 Dreieich • [49] (06103) 408 0Italy: Strada Rivoltana • I-20090 Rodano (Milano) • [39] (02) 95059 226Japan: C-2F • 3-9, Moriya-cho, Kanagawa-ku • Yokohama, Kanagawa • 221-0022 • [81] (45) 453 9100Japan: Esaka Grand Building • 2-3-1 Esaka-cho, Suita City • Osaka 564-0063 • [81] (06) 6387-6681Netherlands: Takkebijsters 1 • 4817 BL Breda • [31] (076) 5878 722P.R. China: Room 901, Ping-an Mansion • No. 23, Jin Rong Street • Xi Cheng District • Beijing 100032 • [86] (010) 6621 0839Spain: Sepulveda 7 A • ES-28108 Alcobendas (Madrid) • [34] (091) 657 4930Spain: Acer 30 – 32 • Edificio Sertram – Planta 2, Modulo 3 • ES-08038 Barcelona • [34] (093) 223 0918Sweden: Pyramidbacken 3 • S-141 75 Kungens Kurva (Stockholm) • [46] (08) 556 468 00United Kingdom: Stafford House • 1 Boundary Park • Boundary Way • Hemel Hempstead • Hertfordshire HP2 7GE • [44] (01442) 233 555U.S.A.: 355 River Oaks Parkway • San Jose, CA 95134-1991 • [1] (408) 965-6000
Notes: The country code is enclosed in square brackets [ ]. The city code or area code is enclosed in parenthesis ( ). For countries other than the U.S.A., when you are dialing from within the specified country, dial the 0 of the city code. For countries other than Italy, when you are dialing from outside the country, do not dial the 0 of the city code.
Finnigan is a trademark of Thermo Electron Corporation. Swagelok® is a registered trademark of the Swagelok Corporation. Teflon® is a registered trademark of E. I. du Pont de Nemours & Co. Microsoft®, Windows®, and Windows NT® are registered trademarks of the Microsoft Corporation.
Printing History: Revision C printed in August 2004.
Published by Product Marketing, Thermo Electron Corporation, Bremen, Germany.Copyright© 2004 Thermo Electron Corporation. All rights reserved. Printed in Germany.

Customer Registration... Register now and receive all the privileges associated with being a Thermo Electron, Finnigan product user, including application reports and technical reports.Name_______________________________________________________________________________________
Title________________________________________________________________________________________
Company ___________________________________________________________________________________
Address_____________________________________________________________________________________
City/State/Postal Code_________________________________________________________________________
Country ____________________________________________________________________________________
Telephone _____________________________________________ Ext. _________________________________
Tell us more... Let us know more about how you use this product:
My Organization Is: (Check one only) My Primary Application Is: (Check one only)Commercial (for profit) lab AnalyticalGovernment lab BiomedicalHospital / Clinic Clinical / ToxicologyResearch Institute EnergyUniversity / College Food / AgricultureVeterinary Forensic / ToxicologyOther ___________________________ Pharmaceutical
Research / Education
Job Function: (Check one only)Other ___________________________
AdministrationLab ManagementOperatorOther ___________________________
Reader Survey... Help us to improve the quality of our documentation by answering a few questions:
Finnigan TritonMulticollector Software 3.1 Operating Manual
Revision C 116 8950
Strongly Agree Agree Disagree
Strongly Disagree
The manual is well organized. 1 2 3 4The manual is clearly written. 1 2 3 4The manual contains all of the information I need. 1 2 3 4The instructions are easy to follow. 1 2 3 4The instructions are complete. 1 2 3 4The technical information is easy to understand. 1 2 3 4The figures are helpful. 1 2 3 4I was able to operate the system by using this manual. (If not, please comment below.)
1 2 3 4
Additional Comments: (Attach additional sheets if necessary.)_____________________________________________________________________________________________________________________________________________________________________________________________________________________________________________________________________________________________________________________________________________________________________________________________________________________________________________________________________________________________________________________________________________________________________________________________________
Tear this sheet from the manual, fold it closed, stamp it, and drop it in the mail.
Finnigan Triton Serial # _________________________________ Date Purchased _______________________

PlaceStampHere
Thermo Electron (Bremen) GmbHFinnigan Advanced Mass SpectrometryProduct MarketingBarkhausenstr. 2
D-28197 BremenGermany
From ________________________________
_____________________________________
_____________________________________
fold
fold

Table of Contents
Read This First ........................................................................................................................... vii
Changes to the Manual ......................................................................................................................... viii
Abbreviations ......................................................................................................................................... ix
Typographical Conventions .................................................................................................................. xiiData Input ............................................................................................................................ xiiBoxed Information.............................................................................................................. xiiiTopic Headings................................................................................................................... xiv
Training ................................................................................................................................................. xv
Reply Cards .......................................................................................................................................... xvi
System Startup .......................................................................................................................... 1-1
1.1 General ...................................................................................................................................... 1-2Basic Procedure .................................................................................................................. 1-3
1.2 System Startup .......................................................................................................................... 1-5Hardware System Status..................................................................................................... 1-5Software System Status ...................................................................................................... 1-6
Acquisition ................................................................................................................... 1-6System Status Display .................................................................................................. 1-7
Tune ............................................................................................................................................ 2-1
2.1 Introduction - Tune ................................................................................................................... 2-2Standard Bars and Commands............................................................................................ 2-3
Title Bar ....................................................................................................................... 2-3Menu Bar ..................................................................................................................... 2-4Status Bar ..................................................................................................................... 2-4Dialog Windows .......................................................................................................... 2-5
2.2 Accessories and Information Dialog Windows......................................................................... 2-6Display Dialog Bars and Windows .................................................................................... 2-6
Show/Hide Dialog Bars ............................................................................................... 2-6Show/Hide Dialog Windows ....................................................................................... 2-6
Application Start................................................................................................................. 2-8Tune Dialog Window ......................................................................................................... 2-8Watch Parameter................................................................................................................. 2-9
Edit Watch Parameter ................................................................................................. 2-10
______________________ Multicollector Software 3.1 Manual_________________________ iThermoELECTRON CORPORATION

Table of Contents________________________________________________________ Multicollector Software 3.1
File Browser..................................................................................................................... 2-12Edit File Browser ....................................................................................................... 2-12
Logviewer ........................................................................................................................ 2-13Chart Recorder ................................................................................................................. 2-14
Start and Stop Chart Recorder ................................................................................... 2-15Edit Chart Recorder ................................................................................................... 2-15
Information....................................................................................................................... 2-18
2.3 Instrument Control.................................................................................................................. 2-19Tabbed Pages.................................................................................................................... 2-20Sample Wheel .................................................................................................................. 2-21Filament Control .............................................................................................................. 2-24
Status ......................................................................................................................... 2-24Actual Values ............................................................................................................. 2-25Automatic Control ..................................................................................................... 2-25Manual Control .......................................................................................................... 2-26Preheat 1 Controls/ Preheat 2 Controls (Optional) .................................................... 2-26
Source Lenses .................................................................................................................. 2-27Optimize the High Voltage (Source Lenses) ............................................................. 2-28Autofocus .................................................................................................................. 2-29Source Controls ......................................................................................................... 2-31
Scan Control..................................................................................................................... 2-31Peak Control .............................................................................................................. 2-32Mass Scan .................................................................................................................. 2-37
Zoom Optics..................................................................................................................... 2-39Cup Configuration............................................................................................................ 2-40
Actual Cup Position ................................................................................................... 2-41Configuration ............................................................................................................. 2-42Sub-Configuration ..................................................................................................... 2-43Zoom Optics (Cup Configuration) ............................................................................ 2-43Setting up a Cup Configuration ................................................................................. 2-44
Detector Calibration......................................................................................................... 2-47Faraday Cups ............................................................................................................. 2-47Ion Counter ................................................................................................................ 2-50
Center Cup ....................................................................................................................... 2-55Retarding Potential Quadrupole Lens ....................................................................... 2-55
ThermoELECTRON CORPORATIONii _________________________ Multicollector Software 3.1 Manual ______________________

Table of ContentsMulticollector Software 3.1 ____________________________________________________________
Method Editor ........................................................................................................................... 3-1
3.1 Introduction - Method Editor .................................................................................................... 3-2Creating a Method .............................................................................................................. 3-3Standard Bars and Commands............................................................................................ 3-4
Title Bar ....................................................................................................................... 3-5Menu Bar ..................................................................................................................... 3-5Tool Bar ....................................................................................................................... 3-7Status Bar ..................................................................................................................... 3-8Editor Pane ................................................................................................................... 3-9
Dialog Bars......................................................................................................................... 3-9Accessories Dialog Bar ................................................................................................ 3-9Information Dialog Bar .............................................................................................. 3-10
Panes................................................................................................................................. 3-11
3.2 Acquisition Parameter............................................................................................................. 3-12Cup Configuration Table .................................................................................................. 3-12
Static, Dynamic and Multidynamic Measurements ................................................... 3-13Table Columns ........................................................................................................... 3-14Editing the Table ........................................................................................................ 3-16
Acquisition Parameters..................................................................................................... 3-17Data Structure ............................................................................................................ 3-18Abort Criteria ............................................................................................................. 3-18
3.3 Acquisition Control................................................................................................................. 3-20Filament Heating .............................................................................................................. 3-20
Settings ....................................................................................................................... 3-20Filament Heater Program ........................................................................................... 3-22Total Evaporation ....................................................................................................... 3-25
Interblock Actions ............................................................................................................ 3-26Heating ....................................................................................................................... 3-26Counter Calibration .................................................................................................... 3-27Tuning ........................................................................................................................ 3-27Amplifier .................................................................................................................... 3-28
Run Script......................................................................................................................... 3-30
3.4 Evaluation Pane....................................................................................................................... 3-31Isotope Ratios ................................................................................................................... 3-31Interference Element Correction (IEC) ............................................................................ 3-32
Example: Defining Isotope Ratios and IEC ............................................................... 3-32Evaluation Parameter........................................................................................................ 3-35
Outlier Test ................................................................................................................. 3-36Internal Standard Normalization ................................................................................ 3-37
______________________ Multicollector Software 3.1 Manual________________________ iiiThermoELECTRON CORPORATION

Table of Contents________________________________________________________ Multicollector Software 3.1
Multidynamic Evaluation MD ......................................................................................... 3-39Atom & Weight %............................................................................................................ 3-40
Example ..................................................................................................................... 3-40C-Factor ........................................................................................................................... 3-42Formula Editor ................................................................................................................. 3-43
Example: Defining an Online-Calculation using the Formula Editor ....................... 3-44
Sequence Editor ........................................................................................................................ 4-1
4.1 Introduction - Sequence Editor................................................................................................. 4-2Standard Bars and Commands ........................................................................................... 4-3
Title Bar ....................................................................................................................... 4-3Menu Bar ..................................................................................................................... 4-4Tool Bar ....................................................................................................................... 4-6Sample Type Bar ......................................................................................................... 4-7Status Bar ..................................................................................................................... 4-7Editor Pane .................................................................................................................. 4-7
Dialog Bars ........................................................................................................................ 4-8Accessories Dialog Bar ............................................................................................... 4-8Information Dialog Bar ............................................................................................... 4-9
Panes ................................................................................................................................ 4-10
4.2 Sequence Table ........................................................................................................................ 4-11Columns in the Sequence Table ........................................................................................ 4-11Example: Setting up A Sequence..................................................................................... 4-13
Sequence Online Settings .......................................................................................... 4-16
Evaluation .................................................................................................................................. 5-1
5.1 Introduction - Evaluation.......................................................................................................... 5-2Standard Bars and Commands ........................................................................................... 5-2
Title Bar ....................................................................................................................... 5-3Menu Bar ..................................................................................................................... 5-3Status Bar ..................................................................................................................... 5-4
Deadtime Parameter........................................................................................................... 5-5Deadtime Correction ................................................................................................... 5-5
Dialog Bars ........................................................................................................................ 5-7Accessories Dialog Bar ............................................................................................... 5-7Information Dialog Bar ............................................................................................... 5-8
ThermoELECTRON CORPORATIONiv ________________________ Multicollector Software 3.1 Manual ______________________

Table of ContentsMulticollector Software 3.1 ____________________________________________________________
Display Panes ..................................................................................................................... 5-9Navigation Bars ........................................................................................................... 5-9Select Data Evaluation and Organization .................................................................... 5-9Select View Control .................................................................................................. 5-10Miscellaneous Control .............................................................................................. 5-10
5.2 Data Evaluation and Organization .......................................................................................... 5-11View Control .................................................................................................................... 5-11
View Control Icons .................................................................................................... 5-11Context Menus Graphical/ Numerical View .............................................................. 5-13View Parameters ........................................................................................................ 5-14View Configuration .................................................................................................... 5-15
Data Evaluation ................................................................................................................ 5-18Static Evaluation (St) ................................................................................................. 5-18Dynamic Evaluation (Dy) .......................................................................................... 5-18Total Evaporation (TE) .............................................................................................. 5-18Multidynamic Evaluation (MD) ................................................................................ 5-19
Data Organization............................................................................................................. 5-20Run Block View (RB) ................................................................................................ 5-20Run Number View (RN) ............................................................................................ 5-21Block View (B) .......................................................................................................... 5-22Data View (D) ............................................................................................................ 5-23Statistics on Selected Data ......................................................................................... 5-24
Online Evaluation............................................................................................................. 5-25Print .................................................................................................................................. 5-25Export ............................................................................................................................... 5-25Default Layout.................................................................................................................. 5-26Method Editor................................................................................................................... 5-27
Executive .................................................................................................................................... 6-1
6.1 Introduction - Executive............................................................................................................ 6-2Standard Bars and Commands............................................................................................ 6-3
Title Bar ....................................................................................................................... 6-3Menu Bar ..................................................................................................................... 6-3Tool Bars ...................................................................................................................... 6-6Status Bar ..................................................................................................................... 6-6
6.2 System Table ............................................................................................................................. 6-7System Parameter List ........................................................................................................ 6-8
Installed Hardware ....................................................................................................... 6-8Amplifier Box .............................................................................................................. 6-8Channeltron Box ........................................................................................................ 6-10
______________________ Multicollector Software 3.1 Manual_________________________ vThermoELECTRON CORPORATION

Table of Contents________________________________________________________ Multicollector Software 3.1
User Parameter List.......................................................................................................... 6-12
6.3 Dialog Panes ........................................................................................................................... 6-13Collector Dialog Pane ...................................................................................................... 6-14
Collector Tool Bar ..................................................................................................... 6-14Channeltron Dialog Pane ................................................................................................. 6-15
Channeltron Tool Bar ................................................................................................ 6-15Amplifier Dialog Pane ..................................................................................................... 6-16
Amplifier Tool Bar .................................................................................................... 6-16History Dialog Pane ......................................................................................................... 6-17
History Tool Bar ........................................................................................................ 6-18
6.4 Mass Calibration..................................................................................................................... 6-20Mass Calibration Tool Bar ......................................................................................... 6-20Calibrated Masses ...................................................................................................... 6-22
6.5 Log Files ................................................................................................................................. 6-24Customize Log Files .................................................................................................. 6-25
Diagnostic .................................................................................................................................. 7-1
7.1 Introduction - Diagnostic.......................................................................................................... 7-2Operation of Diagnostic ..................................................................................................... 7-2Standard Bars and Commands ........................................................................................... 7-3
Title Bar ....................................................................................................................... 7-3Menu Bar ..................................................................................................................... 7-3Status Bar ..................................................................................................................... 7-5
Tabbed Pages...................................................................................................................... 7-6
7.2 Dialog Applications.................................................................................................................. 7-7Instrument Status................................................................................................................ 7-7
LED Indication ............................................................................................................ 7-7System Parameters ............................................................................................................. 7-8
Ion Source .................................................................................................................... 7-8High Voltage ................................................................................................................ 7-8Magnet ......................................................................................................................... 7-9Sample Wheel .............................................................................................................. 7-9Samples ...................................................................................................................... 7-10
Filament Control .............................................................................................................. 7-10Motor Control ................................................................................................................... 7-11PCL .................................................................................................................................. 7-12
ThermoELECTRON CORPORATIONvi ________________________ Multicollector Software 3.1 Manual ______________________

Read This First
Welcome to the Finnigan Triton - Multicollector Software!
This manual contains a description of the Multicollector Software, Version 3.1 for your Finnigan Triton mass spectrometer.
It is divided into nine chapters:
Chapter 1: System Startup describes the startup of the hardware and software for the Finnigan Triton.
Chapter 2: Tune takes a closer look at the Tune application and its features.
Chapter 3: Method Editor describes the Method Editor and its options.
Chapter 4: Sequence Editor explains how to setup measurement sequences.
Chapter 5: Evaluation lists the possible evaluations modes available in the Multicollector Software Version 3.1.
Chapter 6: Executive describes the features in the Executive application.
Chapter 7: Diagnostic gives an overview of the control parameters available in the Diagnostic application.
______________________ Multicollector Software 3.1 Manual________________________ viiThermoELECTRON CORPORATION

________________________________________________________ Multicollector Software 3.1
Changes to the ManualTo suggest changes to this manual, please send your comments to:
Thermo Electron (Bremen) GmbH
Finnigan Advanced Mass Spectrometry
Product Marketing
Barkhausenstr. 2
D-28197 Bremen
Germany
e-mail:[email protected]
You are encouraged to report errors or omissions in the text or index.
Thank you.
ThermoELECTRON CORPORATIONviii _______________________ Multicollector Software 3.1 Manual ______________________

Multicollector Software 3.1 ____________________________________________________________
AbbreviationsThe following abbreviations are used in this and other manuals and in the online Help.
A ampere
ac alternating current
ADC analog-to-digital converter
AP acquisition processor
ASCII American Standard Code for Information Interchange
b bit
B byte (8 b)
baud rate data transmission speed in events per second
°C degrees Celsius
cfm cubic feet per minute
CI chemical ionization
cm centimeter
cm3 cubic centimeter
CPU central processing unit (of a computer)
CRM consecutive reaction monitoring
<Ctrl> control key on the terminal keyboard
d depth
Da dalton
DAC digital-to-analog converter
dc direct current
DDS direct digital synthesizer
DEP™ direct exposure probe
DS data system
DSP digital signal processor
EI electron ionization
EMI electromagnetic interference
<Enter> enter key on the terminal keyboard
eV electron volt
f femto (10-15)
______________________ Multicollector Software 3.1 Manual________________________ ixThermoELECTRON CORPORATION

________________________________________________________ Multicollector Software 3.1
°F degrees Fahrenheit
FTP file transfer protocol
g gram
G giga (109)
GND electrical ground
GPIB general-purpose interface bus
GUI graphical user interface
h hour
h height
HPLC high-performance liquid chromatograph
HV high voltage
Hz hertz (cycles per second)
IEC International Electrotechnical Commission
IEEE Institute of Electrical and Electronics Engineers
I/O input/output
k kilo (103, 1000)
K kilo (210, 1024)
kg kilogram
l length
l liter
LAN local area network
LED light-emitting diode
µ micro (10-6)
m meter
m milli (10-3)
M mega (106)
M+ molecular ion
MH+ protonated molecular ion
min minute
ml milliliter
mm millimeter
MS mass spectrometer; mass spectrometry
m/z mass-to-charge ratio
ThermoELECTRON CORPORATIONx_________________________ Multicollector Software 3.1 Manual ______________________

Multicollector Software 3.1 ____________________________________________________________
n nano (10-9)
NIST National Institute of Standards and Technology (USA)
Ω ohm
p pico (10-12)
Pa pascal
PCB printed circuit board
PID proportional / integral / differential
P/N part number
P/P peak-to-peak voltage
ppm parts per million
RAM random access memory
RF radio frequency
RMS root mean square
ROM read-only memory
RS-232 industry standard for serial communications
s second
TCP/IP transmission control protocol / Internet protocol
TIC total ion current
u atomic mass unit
V volt
V ac volts alternating current
V dc volts direct current
vol volume
w width
W watt
Note. Exponents are written as superscripts. In the corresponding online Help, exponents are sometimes written with a caret (^) or with e notation because of design constraints in the online Help. For example:
MSn (in this manual) Ms^n (in the online Help)
105 (in this manual) 10^5 (in the online Help)
______________________ Multicollector Software 3.1 Manual________________________ xiThermoELECTRON CORPORATION

________________________________________________________ Multicollector Software 3.1
Typographical ConventionsTypographical conventions have been established for Thermo Electron Bremen manuals for the following:
• Data input
• Boxed information
• Topic headings
Data InputThroughout this manual, the following conventions indicate data input and output via the computer:
• Messages displayed on the screen are represented by capitalizing the initial letter of each word and by italicizing each word.
• Input that you enter by keyboard is represented in bold face letters. (Titles of topics, chapters, and manuals also appear in bold face letters.)
• For brevity, expressions such as “choose File | Directories” are used rather than “pull down the File menu and choose Directories.”
• Any command enclosed in angle brackets < > represents a single keystroke. For example, “press <F1>” means press the key labeled F1.
• Any command that requires pressing two or more keys simultaneously is shown with a plus sign connecting the keys. For example, “press <Shift> + <F1>” means press and hold the <Shift> key and then press the <F1> key.
• Any button that you click on the screen is represented in bold face letters and a different font. For example, “click on Close”.
ThermoELECTRON CORPORATIONxii________________________ Multicollector Software 3.1 Manual ______________________

Multicollector Software 3.1 ____________________________________________________________
Boxed InformationInformation that is important, but not part of the main flow of text, is displayed in a box such as the one below.
Boxed information can be of the following types:
• Note – information that can affect the quality of your data. In addition, notes often contain information that you might need if you are having trouble or tips that can make a task easier.
• Caution – information necessary to protect your instrument from damage. It is also used to alert against unsafe practices. Each caution is accompanied by a symbol.
• Warning – hazards to human beings. Each Warning is accompanied by a Warning symbol.
Note. Boxes such as this are used to display information.
______________________ Multicollector Software 3.1 Manual_______________________ xiiiThermoELECTRON CORPORATION

________________________________________________________ Multicollector Software 3.1
Topic HeadingsThe following headings are used to show the organization of topics within a chapter:
Chapter 1Chapter Name
1.2 Second Level Topics
Third Level Topics
Fourth Level Topics
Fifth Level Topics
ThermoELECTRON CORPORATIONxiv _______________________ Multicollector Software 3.1 Manual ______________________

Multicollector Software 3.1 ____________________________________________________________
TrainingTo reach a high level of performance with the Multicollector Software 3.1, Thermo Electron Bremen recommends making use of the operator courses provided by us at our facilities in Bremen, and/or on site.
For more information, contact your local Thermo Electron service office or contact directly:
Thermo Electron (Bremen) GmbH
Finnigan Advanced Mass Spectrometry
Product Marketing
Barkhausenstr. 2
D-28197 Bremen
Germany
e-mail:[email protected]
url: http://www.thermo.com
______________________ Multicollector Software 3.1 Manual_______________________ xvThermoELECTRON CORPORATION

________________________________________________________ Multicollector Software 3.1
Reply CardsThermo Electron Bremen manuals contain one or two reply cards. All manuals contain a Customer Registration / Reader Survey card and some contain a Change of Location card. These cards are located at the front of each manual.
The Customer Registration / Reader Survey card has two functions. First, when you return the card, you are placed on the Thermo Electron Bremen mailing list. As a member of this list, you receive application reports and technical reports in your area of interest, and you are notified of events of interest, such as user meetings. Second, it allows you to tell us what you like and do not like about the manual.
The Change of Location card allows us to track the whereabouts of the instrument. Fill out and return the card if you move the instrument to another site within your company or if you sell the instrument. Occasionally, we need to notify owners of our products about safety or other issues.
ThermoELECTRON CORPORATIONxvi _______________________ Multicollector Software 3.1 Manual ______________________

Chapter 1System Startup
The following describes the system status checks of the hardware (Finnigan Triton) and the startup of the Multicollector Software Version 3.1 Finnigan Triton. In addition, it gives an overview of the different application.
• General introduces the applications of the Multicollector Software Version 3.1.
• System Startup describes the system status at start-up and how to start the software.
______________________ Multicollector Software 3.1 Manual______________________ 1-1ThermoELECTRON CORPORATION

System StartupGeneral __________________________________________________ Multicollector Software 3.1
1.1 General The Multicollector Software 3.1 contains ten (eleven) applications, which will be introduced in the following.
Acquisition
Tune
Method Editor
Sequence
Evaluation
The Acquisition application channels the data flow between the applications and all status information from the instrument.
When starting the acquisition, the program automatically opens the System Status application.
The Tune application allows the optimization of most instrument parameters (filament control, transfer lenses, scan control, zoom optics, cup positioning, detector calibration).
Carrying out an analysis requires a measuring program called Method Editor. The Method Editor defines the settings for data collection. It takes into account all the requirements of the analytical application (peak detection, selection of isotopes, interference correction).
Using a sequence enables the user to run a number of sample analyses automatically.
Evaluation enables the user to evaluate the data, to report the results in the desired way after the measurement and to export the raw data to other applications.
ThermoELECTRON CORPORATION1-2 ______________________ Multicollector Software 3.1 Manual ______________________

System StartupMulticollector Software 3.1 ______________________________________________________ General
Executive
Diagnostic
PCL, PCL Diagnostic, PCL Display
Basic ProcedureAnalyses carried out using the Finnigan Triton/ Multicollector Software 3.1 follow the same pattern for the various applications.
The analysis sequence can be summarized for all application by the following, essential contents:
• Connect to Instrument
• Prepare and Load Filaments
• Configure Cups
• Tune Instrument
• Create a Method
• Create a Sequence
• Start Measurement
• Evaluate Measured Data
Executive gives access to basic hardware parameters and the configuration of the instrument. It is similar to a database, which stores the actual system configuration and calibrations.
Note. Diagnostic is designed as a tool for service engineers to set and read hardware parameters of the instrument. Do not use the Diagnostic tool unless you are familiar with this application.
The PCL application allows the user to edit or write PCL scripts. This requires a basic knowledge of programming.
The PCL Display modules are enhancements to the PCL script application.
For more information on the PCL applications refer to the seperate PCL Reference Manual.
______________________ Multicollector Software 3.1 Manual______________________ 1-3ThermoELECTRON CORPORATION

System StartupGeneral __________________________________________________ Multicollector Software 3.1
Figure 1-1. Flow Chart - Using the Multicollector Software 3.1
Check the Instrument Status
Start ACQUISITION
Start TUNE
Tune Instrument(via Filament Control, Source Lensesan Zoom Optics in Tune Application)
Start METHOD EDITOR
Open/ Write a Method
Start SEQUENCE
Open/ Write a Sequence
Start the Sequence
Start the Method
Select Cup Configuration
Heat Filament
Set Mass
EVALUATION of Data
ThermoELECTRON CORPORATION1-4 ______________________ Multicollector Software 3.1 Manual ______________________

System StartupMulticollector Software 3.1 ________________________________________________ System Startup
1.2 System Startup
Hardware System StatusBefore starting the instrument, the hardware system status must be checked. Afterwards, the instrument can be switched on via the software.
We assume that the instrument is in Standby mode and no fault conditions are indicated.
The status of the instrument is indicated at the System Status Panel located at the right side of the instrument, see Figure 1-2. It shows important status information about the vacuum system, power supplies and more.
The illuminated push button next to the key switch indicates whether the mass spectrometer is connected to the Frontend (light on) or not (light off).
Figure 1-2. Finnigan Triton - Front View
Note. Do not press this push button while turning the key switch!
Key Switch
MS: Connection Status
HV On/Off
______________________ Multicollector Software 3.1 Manual______________________ 1-5ThermoELECTRON CORPORATION

System StartupSystem Startup ____________________________________________ Multicollector Software 3.1
The light to the right of the push button indicates the status of the high voltage (HV ON = light on, HV OFF = light off). The small status LEDs at the bottom indicate the function of HV electronics etc.
In Standby mode, the LEDs at the system status panel should appear as indicated in Figure 1-2.
Software System StatusIf the Finnigan Triton is in Standby Mode, the Multicollector Software can be started.
AcquisitionTo start the Multicollector Software, start the Acquisition application.
By default, the Acquisition icon locks into the task bar next to the clock and activates the system status display.
Note. The Analyzer Gate Valve (LED ANALY. GATE) can either be red (closed) or open (green) prior to starting the system.
Figure 1-3. Multicollector Software - Acquisition
Double-Clickto Open
The Acquisition application manages the data flow between applications and all status information from the instrument.
ThermoELECTRON CORPORATION1-6 ______________________ Multicollector Software 3.1 Manual ______________________

System StartupMulticollector Software 3.1 ________________________________________________ System Startup
To exit the system and interrupt the connection to the instrument exit the Acquisition application.
System Status DisplayAfter opening the Acquisitions application, the System Status program is automatically opened and a system status LED is locked into the task bar.
The System Status program informs the user about the current status of the system (instrument).
When starting up the system, the status LED will be gray. The connection to the instrument will be automatically established. The gray LED will then change to either red or green.
The color of the system status LED provides information about the system.
To view more details on the system status additional status LEDs can be displayed by clicking in the System Status window, see next page.
Acquisition System Status
Note. You may also open the display by directly clicking the System Status application in the Multicollector Software.
Note. Do not open the Tune application before the instrument is connected, that is before the LED is either red or green!
Grey: the computer has no communication with the mass spectrometer. Check the network connection.
Red: the system is not ready, e.g. HV is off.
Yellow: not enough disk space (< 100 MB)
Green; the system is ready for use (HV is on).
______________________ Multicollector Software 3.1 Manual______________________ 1-7ThermoELECTRON CORPORATION

System StartupSystem Startup ____________________________________________ Multicollector Software 3.1
Example: System Status Ok
Example: System Fault
Click to Open
Click to Open
ThermoELECTRON CORPORATION1-8 ______________________ Multicollector Software 3.1 Manual ______________________

Chapter 2Tune
This chapter deals with the Tune application of the Multicollector Software Version 3.1 and is divided into three major topics:
• Introduction - Tune gives an overview of the user interface and describes how to access the various features of the application.
• Accessories and Information Dialog Windows lists all dockable windows available in Tune and its controls.
• Instrument Control describes the Tune windows of the application and its settings and controls.
______________________ Multicollector Software 3.1 Manual______________________ 2-1ThermoELECTRON CORPORATION

TuneIntroduction - Tune __________________________________________ Multicollector Software 3.1
2.1 Introduction - TuneTune is a key application for setting up and controlling the Finnigan Triton. The Tune application provides access to most instrument parameters. It enables the user to:
• tune and optimize the ion source,
• position the Faraday cups and ion counting detectors,
• control manual heating of the filament,
• scan a mass spectrum by magnetic field (mass scan), and/ or high voltage (peak scan),
• perform basic detector calibration functions, and
• record selected intensities on chart recorder.
Figure 2-1. Multicollector Software - Tune Application
Double-Click to Open
ThermoELECTRON CORPORATION2-2 ______________________ Multicollector Software 3.1 Manual ______________________

TuneMulticollector Software 3.1 _____________________________________________ Introduction - Tune
Standard Bars and Commands
The Tune application has the following standard bars:
• Title bar
• Menu bar
• Dialog bars (Accessories and Information), and
• Status bar.
Title Bar The Title bar contains the name of the application (Tune) and the name of the currently opened configuration.
Double-click on the Tune icon to open the application. It opens with the most recently used configuration.
Figure 2-2. Method Editor - Bars
Status Bar
Dialog Bar(Information)
Dialog Window
Pane
Dialog Bar(Accessories)
Title Bar
Menu Bar
______________________ Multicollector Software 3.1 Manual______________________ 2-3ThermoELECTRON CORPORATION

TuneIntroduction - Tune __________________________________________ Multicollector Software 3.1
Menu BarThe Menu bar contains the application’s top level command menus.
File Menu
Open Opens an existing Tune file for the selected item (<name>.sle). Existing files can be edited and re-used.
Save Saves the current configuration file. If the current configuration has not been saved, the Save As dialog box opens.
Print Print, Setup, and Display options.
Tune Menu
Autotune ConfigurationOpens the dialog box Autotune Configuration. In this window, the parameters for an Autotune file can be loaded, set and/or saved, refer to section Autofocus on page 2-29.
If an Autotune file is loaded, the system aims at creating maximum intensities for the selected parameters in the file.
View Menu
Status Bar, Toggles the menu bars on and off. If checked, the respective bar will be displayed.
Accessories, InformationShows/ hides the dialog bars. If checked, the respective dialog bar will be displayed.
Help Menu
About Tune... Displays the software information (version number)
Status BarThe Status bar contains information related to the application running in this window. It can be switched on or off via the View menu.
ThermoELECTRON CORPORATION2-4 ______________________ Multicollector Software 3.1 Manual ______________________

TuneMulticollector Software 3.1 _____________________________________________ Introduction - Tune
Dialog WindowsThe Tune application has three window groups:
• Accessories dialog windows,
• Information dialog windows, and
• Instrument Control dialog windows (panes).
Several windows can be viewed at the same time and the user can define the arrangement of the display.
The Instrument Control dialog windows (panes) are always displayed, the others can be hidden, if required.
______________________ Multicollector Software 3.1 Manual______________________ 2-5ThermoELECTRON CORPORATION

TuneAccessories and Information Dialog Windows ______________________ Multicollector Software 3.1
2.2 Accessories and Information Dialog Windows
The Accessories dialog windows and the Information Dialog Windows permit access to selected software and hardware functions. These windows can be placed anywhere in the active program window.
The following dockable dialog windows are available from the Accessories dialog bar in the Tune application:
• Application Start Shortcut to other software programs
• Tune Allows quick access to Tune parameter panes
• Watch Parameter Allows to monitor selected instrument parameters
• File Browser Lists available Tune parameter files
The following dockable dialog windows are available from the Information dialog bar in the Tune application:
• Log viewer Lists recent log files
• Chart recorder Monitors the signal
• Info Lists of system actions
Display Dialog Bars and Windows
Show/Hide Dialog BarsTo show the dialog bars, select the required view from the View menu.
Show/Hide Dialog WindowsTo display the dialog windows, click on the title bar of one of the dialog windows or the dialog bars with the right mouse button and call up the dialog windows Administrate Panel.
Click on List Item to Select View
ThermoELECTRON CORPORATION2-6 ______________________ Multicollector Software 3.1 Manual ______________________

TuneMulticollector Software 3.1 ________________________ Accessories and Information Dialog Windows
The specific information displayed in the Information bar and the Accessories bar is selected by clicking in the Visible field adjacent to the corresponding dialog.
Click OK to confirm the selection or Cancel to exit without making any changes.
In addition, the windows can be minimized (SHRINK), maximized (UNSHRINK), and popped out, if required.
Figure 2-3. Administrate Panels (Accessories and Information)
Note. If no dialog window is opened, click on the empty dialog panes with the right mouse button to open the administrate panel dialog.
Note. If the window was popped out and is closed again, it locks back to the accessories dialog and the information dialog respectively.
HideShrink
Pop Out
Unshrink
______________________ Multicollector Software 3.1 Manual______________________ 2-7ThermoELECTRON CORPORATION

TuneAccessories and Information Dialog Windows ______________________ Multicollector Software 3.1
Application StartThe Start Application window provides quick access to the multicollector software program via the respective program icons.
Tune Dialog WindowThe Tune window allows the user quick access to the instrument controls for the filaments, sample wheel, source lenses, scan control, zoom optics, cup configuration, center cup, and detector calibration in the instrument control window.
The quick access to the control parameters is realized via so-called hotspots in the Tune window. When clicking on a hot spot, the corresponding tabbed page with the instrument control parameters is opened .
Figure 2-4. Dialog Window Application Start
Note. When moving the cursor over a hot spot, the cursor symbol changes to a hand with a pointing finger to indicate the link to the respective control pane and the parameter name appears in the upper left corner of the window.
Figure 2-5. Dialog Window Tune (with Hot Spots)
Click on an Icon to Open Program
Sample Wheel
Filament ControlSource Lenses
Scan Control
Zoom Optics Cup Conf. Center Cup
Detector Calibration
ThermoELECTRON CORPORATION2-8 ______________________ Multicollector Software 3.1 Manual ______________________

TuneMulticollector Software 3.1 ________________________ Accessories and Information Dialog Windows
Watch ParameterThe Watch Parameter window displays the status of the instrument, that is a range of hardware status indicators and instrument parameters can be monitored, according to the user requirements.
The displayed information is updated every 2 seconds.
Figure 2-6. Dialog Window Watch Parameter (Example)
Note. If you move the cursor to a DAC value (analogue signals) in the watch parameter pane, this value is magnified in a separate window. The font size of the magnified value can be set in the Configure Parameter dialog.
______________________ Multicollector Software 3.1 Manual______________________ 2-9ThermoELECTRON CORPORATION

TuneAccessories and Information Dialog Windows ______________________ Multicollector Software 3.1
Edit Watch Parameter To edit the watch parameter dialog, click in the watch parameter window with the right mouse button and open the Configure Parameter dialog.
The left side of the window shows a list of available parameter, which can be added or removed from the user-defined display at the right side.
The LEDs indicate instrument states with a true/false value (green = TRUE, red = FALSE) and are shown in the System Status panel, refer to Hardware System Status on page 1-5. The DAC reads back values of selected parameters and the Intensity bar is used to monitor current intensities of cups. The Buttons allow to switch selected items on and off and the Message field displays information on the system status.If the check box MIC voltages is ticked, the MICs can be switched on and off in the Watch Parameter pane.
Note. If you move the cursor to a cup in the Intensities filed, the intensity value will popout in a small window. This window can be locked for permanent display by clicking in the popout; the popout field turns yellow. It can unlocked again by clicking in the field (the filed turns white again). The font size of the magnified value cannot be changed.
Note. The watch parameter window can be accessed from the Tune application or from the Method Editor, Accessories Dialog Bar on page 3-9.
There is, however, only one configuration active at a time and this configuration is independent of the program from which it is being accessed.
Locked Values
ThermoELECTRON CORPORATION2-10 _____________________ Multicollector Software 3.1 Manual ______________________

TuneMulticollector Software 3.1 ________________________ Accessories and Information Dialog Windows
Figure 2-7. Watch Parameter Configuration Dialog
To select the font size of the DAC values in the popup windows specify an integer (typically from 14-250).
To add a watch parameter from the list of available items, select the desired parameter with a mouse click. Once the parameter is highlighted click on Add. The parameter now appears in the user-defined configuration list.
Note. The user can select a maximum of 5 LEDs, up to a maximum of 5 DAC read-back values and up to 3 buttons
______________________ Multicollector Software 3.1 Manual_____________________ 2-11ThermoELECTRON CORPORATION

TuneAccessories and Information Dialog Windows ______________________ Multicollector Software 3.1
File BrowserThe File Browser dialog window lists all available source parameter files and zoom parameter files. The window contains three tabbed pages: one with a source file directory (*.sle), one with zoom files (*.zop), and one search window.
The Search tab displays files and folders which can be searched for via the context menu of the Source and Zoom tab, see below section.
Edit File BrowserLike all tabbed pages in the Multicollector Software Version 3.1, the display of the tabbed pages in the File Browser can be modified.
To remove a watch parameter from the user-defined configuration, select the watch parameter from either list by clicking it and click on Remove.
The current selection of watch parameters can either be accepted (OK) or cancelled (Cancel).
Figure 2-8. Dialog Window File Browser
To modify the tabbed pages, click on a tab with the right mouse button and open the context menu.
Source Files Search DirectoryZoom Files
ThermoELECTRON CORPORATION2-12 _____________________ Multicollector Software 3.1 Manual ______________________

TuneMulticollector Software 3.1 ________________________ Accessories and Information Dialog Windows
Modify Dialog VisibilityClicking Modify Dialog Visibility opens a dialog box which allows to toggle the tabbed pages on and off.
Hide Dialog Clicking Hide Dialog closes the tabbed page. It can be opened again via the Dialog Visibility dialog.
Pop Out Clicking Pop Out opens the respective list in a new window. Closing the window with the X button will move the window back to the File Browser dialog.
Context Menu File Browser
LogviewerThe data system generates logfiles for many processes which are started within tune, for instance peak center, baseline calibration, gain calibration, yield calibration, dark noise measurement, etc.. These logfiles can be displayed in the logviewer.
The name of the current log file is displayed at the top of the pane, see Figure 2-9.
In addition, the File Browser can be edited via the context menu. The context menu contains a Search option. Folders can be inserted and deleted and the mask, i.e. the type of data to be displayed can be edited.
Click Edit to edit the current log file in the windows text editor.
When the check box Jump to End is ticked, the list will jump to the last entry of the current log file, i.e. the end of the log file list.
______________________ Multicollector Software 3.1 Manual_____________________ 2-13ThermoELECTRON CORPORATION

TuneAccessories and Information Dialog Windows ______________________ Multicollector Software 3.1
Chart RecorderThe chart recorder records and displays intensities as a function of time. The output of the chart recorder can be used to tune the instrument and document a sequence or measurement.
Figure 2-9. Dialog Window Logviewer (with Log File Example )
Figure 2-10. Dialog Windows Chart Recorder
ThermoELECTRON CORPORATION2-14 _____________________ Multicollector Software 3.1 Manual ______________________

TuneMulticollector Software 3.1 ________________________ Accessories and Information Dialog Windows
Start and Stop Chart RecorderThe chart recorder is started when a mass is set in the Scan Control window, refer to Scan Control on page 2-31. To stop the chart recorder, press Break in the Scan Control window, Scan Control on page 2-31.
Edit Chart RecorderThe display of the chart recorder can be controlled via the tool bar in the dialog window.
Zoom functions as well as linear/ log scale are available and the intensities can be normalized. This is helpful to view data for all ion currents on the same intensity scale and this is useful when checking peak overlaps.
Click to create, save, load, export or print a chart record.
Export: The current chart can be reported as a txt-file.
Click Normalization to change the factors and the offset of the chart.
Common: Selects the y-scale to display all traces
Individual: All traces are normalized to the largest intensities
Set Offset: Add user-defined offsets to each trace
Clear Factors/ Clear Offsets:Set all factors and offsets to 0.
Full Plot: Display complete chart
Info: Display chart info
Set background color:Click to select a new background color
Click to scroll the chart backward (Previous) and forward (Next).
Click Last Zoom to return to the last (previous) zoom scale for the chart display.
______________________ Multicollector Software 3.1 Manual_____________________ 2-15ThermoELECTRON CORPORATION

TuneAccessories and Information Dialog Windows ______________________ Multicollector Software 3.1
Click Rescale to set the value for the intensities (y-axis) and the time (z-axis).
Scales:
Chart recording: If this check box is ticked, the chart will be displayed continuously.
Auto Scale Y: If this check box is ticked, the intensity scale is automatically adjusted to display the whole range of values (min. and max).
Note. All intensities are considered for the Autoscale, including those not currently within the selected time interval.
Click to change the intensity to a logarithm scale.
Note that the scale must be >0.
Click to select the counting scale, i.e. if an ion counter is installed, the cps (counts per second can be displayed in the chart recorder.
Note that both intensity scales in volts and cps can be displayed.
ThermoELECTRON CORPORATION2-16 _____________________ Multicollector Software 3.1 Manual ______________________

TuneMulticollector Software 3.1 ________________________ Accessories and Information Dialog Windows
Tick the check box to display the scale.
Note: 1mV ª 62500 cps.
Click Grid to display horizontal grid lines. The lines are related to the Intensity [V] scale.
Click Traces to add or remove a cup trace in the chart recorder.
Select the desired cup and confirm the selection with OK to add the cup to the chart. To remove a cup deselect the desired cup and confirm with OK. Alternatively, click on the cup in the Tool bar and click to open a command list. Select Delete to remove the cup.
In addition, the line style, the offset and the factor for each cup can be set when clicking the cup in the tool bar.
Note. Data within the chart recorder will be saved automatically 24 hours after the start of the chart recorder or after creating a new chart. The chart recorder files are stored in the User/triton/data directory and can be recalled into the display via the File functions button.
______________________ Multicollector Software 3.1 Manual_____________________ 2-17ThermoELECTRON CORPORATION

TuneAccessories and Information Dialog Windows ______________________ Multicollector Software 3.1
Information The information dialog displays a list of instrument log files
The type of information displayed in the window can be edited by the user.
To edit the window, call up the context menu with a right mouse click in the information dialog window.
Figure 2-11. Tune - Information Dialog Window
Call up the Properties window and select the information from the list of filters:
ThermoELECTRON CORPORATION2-18 _____________________ Multicollector Software 3.1 Manual ______________________

TuneMulticollector Software 3.1 ______________________________________________Instrument Control
2.3 Instrument Control The Tune program allows the user to manually control and configure the instrument. This includes source parameters, magnetic field value, magnetic field scanning, and collector configuration.
The parameters are grouped on tabbed pages and can be accessed by clicking directly on the tabs or via the hot spots in the tune dialog window, refer to Tune Dialog Window on page 2-8.
Figure 2-12. Tune Application - Instrument Controls
Tabbed Pages
Note. Like all tabbed pages in the Multicollector Software Version 3.1, the layout of the different control dialogs can be modified via the context menu. Click on the tab with the right mouse button to call up the context menu.
The pages can be shown/ hidden and popped out, also refer to Edit File Browser on page 2-12.
______________________ Multicollector Software 3.1 Manual_____________________ 2-19ThermoELECTRON CORPORATION

TuneInstrument Control __________________________________________ Multicollector Software 3.1
Tabbed PagesThere are eight mass spectrometer functions that are accessed using the Tune application:
Sample Wheel Initialization of sample wheel after loading filaments, selection of sample for analysis
Filament Control Heating and pre-heating of evaporation and ionization filaments
Source Lenses Adjustment of high voltage applied to the ion source lenses
Scan Control Scan and plot mass spectrum by varying the magnetic field or source voltage, and set masses related to selected cups.
Zoom Optics Control of quadrupole lenses to vary dispersion of the ion beams
Cup Configuration Position Faraday cups and (optional) multiple ion counters
Detector CalibrationPerform gain and baseline calibrations for Faraday cup detectors and dark noise and operating voltage measurement for (optional) ion counters.
Center Cup Select between the axial Faraday and ion counter; adjust the voltages applied to the (optional) RPQ lens
The following describes each set of parameters, namely the respective instrument control pane in the natural order, starting with loading the filaments (sample wheel).
ThermoELECTRON CORPORATION2-20 _____________________ Multicollector Software 3.1 Manual ______________________

TuneMulticollector Software 3.1 ______________________________________________Instrument Control
Sample WheelA maximum of 21 samples may be loaded on the sample wheel. Before any analysis may begin, the instrument must calibrate the position of each sample on the carousel. This initialization is done from the Sample Wheel pane.
Wheel Position Enter the desired position number (1-21) in the blank field via the keyboard or via the drop-down list to select the Sample Wheel Position. A green LED indicates when the sample is set. The text field displays the sample name.
Wheel Fine Tuning To adjust the filament contact position manually, the mouse pointer is set onto the slider. A percent value referring to the contact lengths of the filament determined during the initialization procedure indicates the position.
Figure 2-13. Tune - Sample Wheel Pane / Parameters
Slider Cursor
______________________ Multicollector Software 3.1 Manual_____________________ 2-21ThermoELECTRON CORPORATION

TuneInstrument Control __________________________________________ Multicollector Software 3.1
Pressing the left mouse button, the cursor symbol changes and becomes an arrow and the slider can be set/ dragged to the desired position. The position is displayed as the percent value on the slider and in the field to the right. As soon as the mouse button is released, the new position is sent to the instrument. Clicking on + and - increases or decreases the desired value in steps of 0.1 %. The number may be entered directly into the provided field.
Autotune
Initialization
Autotuning of the filament position (also refer to section Source Lenses on page 2-27) is started by clicking the Start button and stopped by clicking the Break button.
The LED is yellow when the sample wheel is in motion and green when the desired position is reached.
Clicking the Initialize button initializes the database of the sample positions on the sample wheel.
The calibration procedure requires approximately six minutes to complete. It can be started at any point after loading the sample wheel in the instrument and starting the pumpdown sequence. After the initialization is complete, a calibration table is displayed, see item Calibration.
Note. The initialization should be performed after each exchange of the sample wheel. Only filament positions determined during this procedure are recognized by the software and can be used for analysis.
When the database is initialized, the Stop button becomes active. Clicking it stops the initialization.
ThermoELECTRON CORPORATION2-22 _____________________ Multicollector Software 3.1 Manual ______________________

TuneMulticollector Software 3.1 ______________________________________________Instrument Control
Ioni Filament and Evap Filament tables show the contact positions and lengths determined during the initialization of the sample wheel. Only positions containing a filament are displayed. Positions marked with an asterisk (*) are invalid and cannot be accessed. Invalid positions arise because the initialization procedure was unable to locate reliable contact positions. A filament can be analyzed provided that one valid position for that filament was located.
Click on Calibration to view the Sample Wheel Calibration table, which consists of four different panes: Ioni Filaments, Evap Filaments, Calibration Table, and Sample ID.
Figure 2-14. Sample Wheel Calibration Table
Note. If no valid positions for a filament are found, repeat the initialization procedure and possibly check the mechanical condition of filaments on the sample wheel.
Note. The field Calibration Table is only used by the software!
______________________ Multicollector Software 3.1 Manual_____________________ 2-23ThermoELECTRON CORPORATION

TuneInstrument Control __________________________________________ Multicollector Software 3.1
With the initialization process in progress, the user can enter the sample ID for the 21 sample positions in the wheel.
Filament ControlThe evaporation and ionization filament currents are manually controlled from the Filament Control pane.
The sample controls are opened by default (check box Sample Control is ticked). In addition, two control sections for the optional preheating positions are available, refer to Preheat 1 Controls/ Preheat 2 Controls (Optional) on page 2-26.
StatusThe Status field displays the position number of the filament(s) to be heated and if a single filament has been loaded (one of the LEDs is green and the other is red ) or if two filaments are in position for a double filament experiment (both EVAP and IONI LEDs are green).
Example
Note. Sample identifiers are used to generate data filenames during sequence acquisition, therefore ensure that only characters that are allowed for Microsoft Windows filenames are used when entering the Sample ID’s for the 21 samples!
Figure 2-15. Tune - Filament Control Pane
Here, a single filament at sample wheel position 7 can be heated (the filament is selected in the sample wheel pane).
In this example, the green EVAP LED indicates that only a single filament is available in the evaporation position.
ThermoELECTRON CORPORATION2-24 _____________________ Multicollector Software 3.1 Manual ______________________

TuneMulticollector Software 3.1 ______________________________________________Instrument Control
Actual ValuesThe actual filament current is indicated in the field at the right of the pane, expressed in milliampere [mA].
Automatic Control The current in the filament is controlled automatically by ramping the current stepwise in time (automatic control) or manually by changing the current in steps of 1, 10, or 100 mA (manual control). Separate control lines are available for ionization and evaporation filaments.
To control the current automatically, proceed as follows:
1. Determine the rate at which the current is to be increased (or decreased).
This can either be done by entering a rate in the Speed box or by clicking and dragging the slider with the mouse. The rate is measured in milliAmperes per minute [mA/min].
2. Increase (a) or decrease (b) current.
a. Enter the maximum values in milliAmperes in the Max Value field. Make sure that the automatic control is set to increase the filament current by clicking the option button directly left of the Max Value box.
Note. Only filaments with a green LED status can be heated.
The Reset buttons are used to zero the corresponding filament current.
Note. The currents displayed in the Actual Values box cannot be edited. To change the filament current, use either the automatic or manual procedure described below.
Note. The Speed Range option boxes arranged above the slider determine the maximum rates that can be selected
______________________ Multicollector Software 3.1 Manual_____________________ 2-25ThermoELECTRON CORPORATION

TuneInstrument Control __________________________________________ Multicollector Software 3.1
OR:
b. Enter a minimum filament current in milliAmperes in the Min Value field. Click the option box to the left of the field to set the automatic control.
3. Click Start to begin the heating program.
Manual Control The filament currents are controlled manually by clicking on the increase or decrease button in the filament dialog box. The magnitude of the change can be 1 mA, 10 mA, or 100 mA per step.
Preheat 1 Controls/ Preheat 2 Controls (Optional)The Finnigan Triton may be optionally configured with two additional preheating positions.
The preheat option will pre-condition the sample and may help to reduce interferences present in those samples. It converts the sample into a usable chemical form on the filament. The preheating filament is controlled from the Preheat 1 and Preheat 2 dialog sections.
The controls (Status, Automatic Control, Manual Control and Actual Values) are similar to those for the sample controls described above.
Note. It is possible to automatically control the current in the filaments at any time, except during a mass scan, automatic source focus, detector calibration routine, background measurement, and cup alignment.
Note. If the filament currents do not change, ensure that the heating program is enabled by checking the option buttons next to the Min Value (decrease current) and Max Value (increase current) fields!
Step: Clicking Up increases the filament current.Clicking Down decreases the filament current.
mA/Step: Selecting 1, 10, or 100 indicates the increase/ decrease in mA per step.
Check option boxes to display control dialogs.
ThermoELECTRON CORPORATION2-26 _____________________ Multicollector Software 3.1 Manual ______________________

TuneMulticollector Software 3.1 ______________________________________________Instrument Control
Source LensesThe high voltages applied to the source lenses must be optimized for every sample analyzed. Generally, one adjusts the individual potentials to achieve maximum signal intensity and optimum peak shape. The particular voltages will depend on the kind of experiment (analysis of a single or a double filament experiment) and the position of the sample on the filament. The focus settings may be saved and recalled for future use.
The Source Lens pane allows one to perform an automatic focus of the source, switch the accelerating voltage on or off, open and close the analyzer gate valve, and select between the low resolution and (optional) high resolution source slit.
Figure 2-16. Tune - Source Lens Pane/ Parameter
Note. The name of the last Tune file loaded is displayed at the top of the pane (file name in blue).
______________________ Multicollector Software 3.1 Manual_____________________ 2-27ThermoELECTRON CORPORATION

TuneInstrument Control __________________________________________ Multicollector Software 3.1
Optimize the High Voltage (Source Lenses)1. Open an existing source focus file by clicking on the folder icon at the top
left corner of the Source Lens pane.
2. Adjust the source lens voltage.
The voltage applied can be adjusted by dragging the slider control with the mouse, by clicking + or - to the right and left of the slider control, by entering a value directly into the text box to the right of the slider control followed by pressing the <Tab> key, or by using the left and right arrow keys on the keyboard. When the keyboard is used, select the lens by clicking next to the slider; the slider background color changes to white.
3. Once the signal has been optimized, the voltage settings can be saved by clicking on the disk icon.
Note. If the numerical value appears red, the desired voltage is not applied to that particular lens.
This will occur, for example, when the analyzer gate valve is closed. In this case, the x-symmetry lens is set automatically to -450 V to prevent the ion beam from striking the surface of the isolation valve. In this case, the red color indicates a mismatch between the requested and the actual value. When the analyzer gate valve is opened, the requested value is set and the text turns to black.
Note. It is also possible to save several focus settings using different filenames. Therefore, one can have quick access to separate settings depending on the element analyzed. Also, in case the source is completely defocused, one can return to a more successful source setting.
VoltageDown
Slider Control VoltageUp
Text Boxfor Voltage [V]
Save Lens Settings
ThermoELECTRON CORPORATION2-28 _____________________ Multicollector Software 3.1 Manual ______________________

TuneMulticollector Software 3.1 ______________________________________________Instrument Control
AutofocusThe source can be focused automatically using a pre-programmed algorithm. The order in which the lenses are adjusted is determined by this built-in procedure.
To start the autofocus procedure for all selected lenses click on the large Auto button at the left of the Source Lenses pane.
It is possible to remove a lens from the autofocus procedure by clicking in the checkbox located to the left of the particular lens.
Create an Autofocus Procedure
Alternatively, the user can define an autofocus procedure. This may prove useful, for example, if it is only necessary to adjust only a few of the lenses leaving the others untouched.
1. Open the Autotune Configuration window from the Tune menu, refer to Tune Menu on page 2-4.
If you want to perform an autofocus procedure for one source lens only, click on the Auto button located to the left of the lens name.
If you want to stop the autofocus procedure, click on the Break button.
Note. The Autofocus procedure will optimize the ion current as selected in the Peak Scan window, refer to Scan Control on page 2-31.
The intensity required for the Autofocus procedure is defined in the System Table, refer to System Table on page 6-7. A value of 1 mV or 10 cps is recommended.
Tick to Select for Autofocus
______________________ Multicollector Software 3.1 Manual_____________________ 2-29ThermoELECTRON CORPORATION

TuneInstrument Control __________________________________________ Multicollector Software 3.1
2. Select the desired lens from the parameter list at the left and add it to the order field by clicking Add. The parameters are listed in the order in which they will be adjusted to optimize the signal intensity. To change the order, select the required lens and click the Up and Down buttons to the left of the list.
To changed or removed the set parameters, select the item from the order list and click Remove.
3. Save selected items the Save (file) icon in the tool bar of the window. Previously saved configurations can be opened via the Open (file) icon.
Figure 2-17. Tune - Autotune Configuration
Note. The resulting autotune file can be recalled in the Source Lenses window (via Auto User Defined, see below) and in the method file, refer to chapter 4: Method Editor, section Tuning on page 3-27.
To load a user-defined autofocus file, use the file browser to select a file.
When the file was loaded, click on Auto User Defined to focus the source using the selected Autotune Configuration.
ThermoELECTRON CORPORATION2-30 _____________________ Multicollector Software 3.1 Manual ______________________

TuneMulticollector Software 3.1 ______________________________________________Instrument Control
Source Controls
Scan ControlScan control is used to scan a mass range, to check peak shapes and the coincidence of the ion beams, to center the ion beam into the collectors, and to start and stop the chartrecorder. It is also used to perform a mass calibration, refer to Chapter 6: Executive.
The scan control is divided into two sections; Peak Control and Mass Scan.
This procedure scans the entire range of each lens.
It should only be used if no signal can be found using normal auto-focus procedure or other saved source lens settings.
Click the check boxes to switch on the high voltage, to open the analyzer gate valve and to select the resolution of the source slit (option).
Figure 2-18. Tune - Scan Control Parameter
______________________ Multicollector Software 3.1 Manual_____________________ 2-31ThermoELECTRON CORPORATION

TuneInstrument Control __________________________________________ Multicollector Software 3.1
Peak control allows the user to select the mass that is incident on a particular cup or ion counter (also the cup and mass used for peak centering and autofocusing of the source). The Mass Scan section allows the user acquire a plot of ion current intensities over a user-defined mass range
The software plots ion current intensities as functions of mass and the user has considerable flexibility to customize the appearances of these graphs.
Peak ControlThe mass designated in the Peak Control window is used for both the Peak Scan and Peak Center functions.
It is selected in one of three ways:
a. By entering the exact mass in atomic mass units (for example, enter 141.91 to set 142Nd at the designated collector).
b. By entering the chemical symbol of the ion species (for example, 142Nd to choose the isotope of neodymium 142Nd). If no isotope is specified, the most abundant natural isotope of the element is selected automatically (for example entering Nd will set 142Nd in the designated cup).
Note. The details regarding the graphical window are explained in section Edit Chart Recorder on page 2-15.
Figure 2-19. Scan Control Pane - Peak Control Section
Note. Molecular ions are entered as per a) or b) with a period “.” to separate the isotopes.
For example, to set 11B16O2 type “11B.16O2”. Or 187OsO3 is entered as “187Os.O3”. In the latter case, the most abundant isotope of oxygen (16O) is used.
ThermoELECTRON CORPORATION2-32 _____________________ Multicollector Software 3.1 Manual ______________________

TuneMulticollector Software 3.1 ______________________________________________Instrument Control
c. By selecting the isotope from the Elements dialog box:
Click Element to open the Select Element window. The list is sorted either by the elements’ mass or name. Click a particular element in the Element list to show its naturally occurring isotopes in the Isotope list. Click a particular mass in the list to select that isotope.
The selected mass may be incident on any of the available Faraday cup detectors and ion counters. The particular combination of Selected Mass and Selected Cup is used for both Peak Center and Auto Focus functions in the Tune application.
Choose the specific detector (Faraday cup or ion counter) from the dropdown list, which opens when clicking the arrow next to the Selected Cup field.
______________________ Multicollector Software 3.1 Manual_____________________ 2-33ThermoELECTRON CORPORATION

TuneInstrument Control __________________________________________ Multicollector Software 3.1
Peak Center
Peakcenter is used for mass calibration. The high voltage (HV) is scanned forward and backward and both scans are averaged to determine the center of the peak. An entry in the mass calibration table is then made.
The difference between the previous peakcenter recorded in the mass calibration table, refer to Mass Calibration on page 6-20, and the measured peakcenter is determined and an Offset is calculated. This offset is compared with the user-defined parameter Peakcenter Mass Difference % (accessed via the Executive application, refer to Chapter 6: Executive). If the offset is larger than the user-defined value, the peakcenter is repeated up to three times.
The tool bar icons are similar to those of the chart recorder, refer to Chart Recorder on page 2-14.
The forward HV scan is plotted in orange and the reverse scan is plotted in purple. The average of the two is shown in green (the colors can be changed in the Executive, refer to Customize on page 6-4).The peakcenter value taken from the mass calibration table is plotted as a red vertical line. The measured peakcenter value is plotted as a pink vertical line.
Note. Only ion counters defined within the current cup configuration can be selected. This does not apply to the axial secondary electron multiplier (SEM).
Note. The center cup is either the Faraday cup or axial SEM. The particular detector used is selected in the Center Cup pane, refer to Center Cup on page 2-55.
Click on SET to set the mass into the selected cup and start the chart recorder.
Click on Break to stop the chart recorder.
Click on the Peakcenter button to start the scan across the selected isotope.
Clicking on the Mass Scan icon next to the Peakcenter button opens the graphical display.
ThermoELECTRON CORPORATION2-34 _____________________ Multicollector Software 3.1 Manual ______________________

TuneMulticollector Software 3.1 ______________________________________________Instrument Control
Figure 2-20. Graphical Display Mass Scan (Peakcenter)
Note. The peakcenter procedure can be performed using any peak. However, the value recorded in the mass calibration table is always relative to the center cup. Thus, the peakcenter procedure is independent of the cup configuration chosen.
Measured Peakcenter Value
Peakcenter Value fromCalibration Table
______________________ Multicollector Software 3.1 Manual_____________________ 2-35ThermoELECTRON CORPORATION

TuneInstrument Control __________________________________________ Multicollector Software 3.1
Peakscan
A peakscan is performed by changing the high voltage that accelerates the ion beam through the ion source.
Click on the Peakscan button to start a high voltage scan over the peak specified in the Peak Control window. The range is determined in the System Table of the Executive, refer to System Table on page 6-7.
Clicking on the adjacent icon button opens the Scan Control window (graphical window). It generates a plot of the ion beam intensities versus mass.
Figure 2-21. Graphical Display Peak Scan
Individual:All traces normalized to largest intensity
ThermoELECTRON CORPORATION2-36 _____________________ Multicollector Software 3.1 Manual ______________________

TuneMulticollector Software 3.1 ______________________________________________Instrument Control
The tool bar icons are similar to those of the chart recorder, refer to Chart Recorder on page 2-14. Normally, if the mass calibration is correct, the scanned peak fits into the window.
Echo Traces: Selecting a cup from the list of cups adds a collector, refer to Edit Chart Recorder on page 2-15. Selecting a cup with the extension echo displays the previous scan.
Mass Scan Mass scans are performed by varying the magnetic field over a user-defined mass range. Typically, one uses a mass scan to establish the approximate isotope pattern of elements and to check for interferences, to scan over a large mass range to locate an ion beam, to check the peak overlap defined in a cup configuration.
Figure 2-22. Scan Control Pane - Mass Scan Section
Click on Start to initiate a mass scan.
______________________ Multicollector Software 3.1 Manual_____________________ 2-37ThermoELECTRON CORPORATION

TuneInstrument Control __________________________________________ Multicollector Software 3.1
Select Mode
Select the mode of a mass scan by checking the respective box. To perform a single scan, both boxes should be unchecked.
The Continuous mode is used to tune the peak shape or to optimize the peak overlap of a certain cup configuration using the Zoom optics.
If the signal is very noisy, then it might be advantageous to use the Integration mode. In this case the average of all previous scans is displayed in the echo traces in the mass spectrum and the signal stabilities are averaged and the peak shape can be evaluated even with a very noisy signal.
Click on Stop to stop the mass scan.
Continuous Mode If the check box is ticked, the mass scan will be repeated continuously until the Stop button is clicked.
Integration Mode If the check box is ticked, all previous scans (i.e. echoes) will be integrated. This only works if the Continuous Mode check box is also checked, i.e. in continuous mode. That is, the integrated signals of the scans performed for previously will be displayed as echo traces.
Figure 2-23. Graphical Display Mass Scan
ThermoELECTRON CORPORATION2-38 _____________________ Multicollector Software 3.1 Manual ______________________

TuneMulticollector Software 3.1 ______________________________________________Instrument Control
Zoom OpticsTwo sets of quadrupole lenses comprising the Zoom Optics of the Finnigan Triton are positioned before and after the magnet. These enable the user to adjust the dispersion of the instrument and achieve optimum peak overlap for simultaneous ion current measurement.
Generally, after optimizing peak overlap with the Dispersion Quad, the ion beams must be re-focused using the Focus Quad. The voltage for the dispersion and focus quadrupole lenses are typically adjusted in opposite directions, for example if the focus quadrupole lens requires positive voltages, the dispersion quadrupole lens are set to negative voltages.
Setting the Voltage
The voltage of the Focus Quad and Dispersion Quad can be adjusted by dragging the respective slider control with the mouse, by clicking + or - to the right and left of the slider control or by entering a value directly into the text box to the right of the slider control followed by pressing the <Tab> key.
Figure 2-24. Tune - Zoom Optics Parameter
Previously saved parameters can be loaded into the pane by clicking the Open File icon. The filename then appears in the File: field.
The set voltages can be stored in a separate file. Click the diskette icon to save the parameters.
VoltageDown
Slider Control VoltageUp
Text Boxfor Voltage [V]
______________________ Multicollector Software 3.1 Manual_____________________ 2-39ThermoELECTRON CORPORATION

TuneInstrument Control __________________________________________ Multicollector Software 3.1
Cup Configuration The Cup Configuration window is used to position the Faraday cups (or ion counters). A mass must be assigned to the fixed center cup.
Note. It is only necessary to assign a mass or ion species to the detectors required for a particular experiment. When using ion counters, only those detectors that were assigned a mass or ion species are enabled allowing their operating voltage to be switched on.
Figure 2-25. Tune - Cup Configuration Parameters
Actual Cup Positions Configuration
Sub- Config.
Zoom Optics
ThermoELECTRON CORPORATION2-40 _____________________ Multicollector Software 3.1 Manual ______________________

TuneMulticollector Software 3.1 ______________________________________________Instrument Control
Actual Cup PositionThe Actual Cup Positions section displays several columns:
Cup Number Lists the cups (from L4 to H4) and the selected ion counters
Species/ Mass The desired mass or isotope is selected in the second column using the dropdown listbox on top of the column (amu if entering mass, species in case of isotopes).
Target Position The third column displays the target (cup) position in mm distance from the center cup. When the user sets a new configuration for the first time, he must fill in the species or masses in the second column and drag this field onto the field for the target position. The software calculates a first approximation for the target position. If the values is beyond the mechanical cup motor limits, an error message is displayed (refer to Chapter 7: Diagnostic to view the cup motor limits). The estimated values may be improved by doing mass scans to check peak overlap and to correct for misalignment.Within the Mass Scan window, the scale in mm can be calibrated by taking the FWHM (Full Width Half Maximum) of the peaks in the mass spectrum to be 1.78 mm (when measuring with the Faraday cups or axial ion counters).From this value, the scale for the adjustments of the cups can be determined and all target values for the cup positions can be manually updated by the user.
Actual Position The fourth column indicates the current position of the cup in mm distance from the center cup.
Single Cup Positioning
Dragging (using a clamp for L4 and H4) and pushing (L4, L2, H2, and H4) the motorized cups moves and positions the remaining collectors.
When the Advanced mode (see below) is ticked, the Set button in the fifth column only sets the selected cup to the target position.
Note. Consider the cup motor limits and the setting order of the cups! Only four cups, two at each side of the axial position (L3, L2, H1, and H3) are motorized.
Note. For most accurate positioning use the Set Collection button.
______________________ Multicollector Software 3.1 Manual_____________________ 2-41ThermoELECTRON CORPORATION

TuneInstrument Control __________________________________________ Multicollector Software 3.1
Status
Configuration
The LED in the sixth column is illuminated GREEN when the current position and target position agree.
The LED in the sixth column is illuminated GREY when the current position and target position do not agree.
The LED in the sixth column is illuminated YELLOW when the cup is running
This button becomes active when the cups are moving. Clicking Break stops the motors.
The Set Collection button first moves all cups to their innermost positions and then moves each to their target position. This ensure the most accurate positioning of all cups to obtain the desired configuration.The button changes to Stop to stop the process.
Clicking on Reset High resets the cups on the high mass side (H1 to H4) to the reset position.
Ticking the Advanced check box enables the movement of one single cup.
Create a New, Open, Save or Print a cup configuration (*.ccf). The file name will then appear in the grey field below the icons.
Note. Cup configuration data can only be saved when the collection has been set.
ThermoELECTRON CORPORATION2-42 _____________________ Multicollector Software 3.1 Manual ______________________

TuneMulticollector Software 3.1 ______________________________________________Instrument Control
Sub-Configuration
To set a new sub-configuration, click on New and enter the name for the sub-configuration (Mass Set Name) and the Center Cup Mass.
Zoom Optics (Cup Configuration)Use the Zoom Optics sections to adjust the zoom optics voltages. For every main and sub-configuration, Focus and Dispersion Quad voltages can be entered.
Sub-configurations can be defined using the New button.
They can be deleted or renamed selecting the required item from the list and clicking Delete or Rename.
Note. The configuration Main cannot be deleted or renamed.
Note. The cups used in the Main configuration cannot be moved to obtain peak overlap for the cups used in the sub-configuration. To achieve optimum peak overlap the Dispersion Quad and consequently the Focus Quad must be used.
Clicking Read reads the current zoom optic voltages as set in the Zoom Optics window, refer to Zoom Optics on page 2-39.
Clicking Set sets the zoom optics voltages in the Zoom Optics window.
______________________ Multicollector Software 3.1 Manual_____________________ 2-43ThermoELECTRON CORPORATION

TuneInstrument Control __________________________________________ Multicollector Software 3.1
Setting up a Cup Configuration1. Click on the icon New in the configuration section to open a new mass
set. Enter the configuration name and the center cup mass and confirm your selection with OK.
2. Enter the masses to be detected in the respective cup fields (L1 to L4 and H1 to H4), and, if required, ion counters into column 1 of the cup configuration editor.
3. Drag and drop the masses to column 2, Target Position.
4. Click the Set Collection button to move the cups.
5. Check the peak overlap by a mass scan and measure the mismatch of the cup positions.
Clicking Open Files loads zoom parameter files which were previously stored in the Zoom Optics window.
Drag & Drop
ThermoELECTRON CORPORATION2-44 _____________________ Multicollector Software 3.1 Manual ______________________

TuneMulticollector Software 3.1 ______________________________________________Instrument Control
In this case, the reference cup is the fixed center cup, because it cannot be moved. All other cups have to be positioned relative to this cup.
Use the Ruler application to measure the mismatch of the overlap.
The instrument scans from high mass to low mass. At the time the signal starts to enter the center cup, there already is a signal in H1, but not yet in H2 and L2. To get a perfect overlap of all signals, the positions of the H1, H2, and L2 cups have to be adjusted as shown in the following figures.
Direction of Scanning
______________________ Multicollector Software 3.1 Manual_____________________ 2-45ThermoELECTRON CORPORATION

TuneInstrument Control __________________________________________ Multicollector Software 3.1
6. Enter the new target positions for the collectors and press the Set Collection button.
7. Perform a mass scan to check the peak overlap. If required, repeat step 5 and step 6.
Figure 2-26. Measuring and Adjusting the Mismatch of Cup Positions
Note. The calibration of the ruler can be derived by adjusting the ruler to 1.7 mm at FWHM of the peaks. Then use this calibrated ruler to measure the mismatch of peak overlap in mm scale and update the target position for all cups.
ThermoELECTRON CORPORATION2-46 _____________________ Multicollector Software 3.1 Manual ______________________

TuneMulticollector Software 3.1 ______________________________________________Instrument Control
Detector CalibrationClicking on the Detector Calibration tab or on the respective hot spot in the Tune window (refer to Tune Dialog Window on page 2-8) will open the detector calibration parameters.
Two types of detectors are displayed, the Faraday cup and ion counter.
Faraday Cups The Faraday cups calibration section includes the determination of Baseline and Gain.
Figure 2-27. Tune - Detector Calibration Parameter
Clicking List displays the amplifier settings and baselines, etc.
The data displayed in the table can be selected via the context menu of the table.
______________________ Multicollector Software 3.1 Manual_____________________ 2-47ThermoELECTRON CORPORATION

TuneInstrument Control __________________________________________ Multicollector Software 3.1
Figure 2-28. Tune - Faraday Cup List (Example)
To modify the data displayed in the table, open the context menu of the table with a right mouse click anywhere in the table. Select the item Columns and tick the check box to display the data.
Note. For information on the other items in the context menu refer to Context Menus Graphical/ Numerical View on page 5-13.
Clicking Rotate switches the assignment of Faraday Cups and amplifiers. This is implemented using the virtual amplifier.
Clicking Reset resets the connection so that amplifier 1 is again connected to cup 1, amplifier 2 is connected to cup 2 and so on.
ThermoELECTRON CORPORATION2-48 _____________________ Multicollector Software 3.1 Manual ______________________

TuneMulticollector Software 3.1 ______________________________________________Instrument Control
Clicking Print prints the Faraday Cup list and clicking Hide closes the list.
Recalibrate
Electronic Baseline The baseline is measured in Defocused mode:Check the defocused box. The First Mass and Second Mass will then be grayed out. The ion beam is defocused in the ion source so that no ions reach the detector.
Analytical Baseline The baseline is measured between peaks at half mass. In this way, any stray ions will hit the detectors. Enter the half masses on either side of the peak as First Mass and Second Mass. The baseline value will be the average of the baseline measured on both sides of the peak. Ensure that the Defocused box is unchecked.
There are two ways of measuring a baseline: Electronic and Analytical.
______________________ Multicollector Software 3.1 Manual_____________________ 2-49ThermoELECTRON CORPORATION

TuneInstrument Control __________________________________________ Multicollector Software 3.1
Ion CounterThe ion counter calibration section includes the determination of the Yield, Plateau Voltage, and Dark Noise Level.
During a gain calibration, the gain for each ion current amplifier is determined.
Note. It is recommended that a gain calibration is performed at least once or twice a week.
Clicking List displays a table with the installed ion counters with their yield, operation voltage, dark noise, etc.
The data displayed in the table can be selected via the context menu of the table.
Figure 2-29. Tune - Ion Counter List (Example)
To modify the data displayed in the table, open the context menu of the table with a right mouse click anywhere in the table. Select the item Columns and tick the check box to display the data.
ThermoELECTRON CORPORATION2-50 _____________________ Multicollector Software 3.1 Manual ______________________

TuneMulticollector Software 3.1 ______________________________________________Instrument Control
Clicking Print prints the Faraday Cup list and clicking Hide closes the list.
Recalibrate
Note. For information on the other items in the context menu refer to Context Menus Graphical/ Numerical View on page 5-13.
Click on Yield to open the Recalibrate Yield window. The SEM operating voltage must be entered before a yield calibration is started.
The yield calibration is an Automatic Scale calibration between axial Faraday and axial SEM. It is advisable to use a sample solution that yields ~ 5 mV on the Faraday detector (corresponding to ~ 300000 counts on the SEM) to minimize the effect of the Faraday noise.
Note. Before performing a yield calibration, the detector plateau voltage should be determined. The detector plateau voltage must be set as a parameter in the yield calibration.
______________________ Multicollector Software 3.1 Manual_____________________ 2-51ThermoELECTRON CORPORATION

TuneInstrument Control __________________________________________ Multicollector Software 3.1
Note. To perform a yield calibration, the signal must be stable. The ion beam will be measured on the Faraday and SEM. The analog signal is then compared to the ion counting signal and the yield calibration factor is calculated.
Figure 2-30.Yield Calibration Table
Clicking Plateau Voltage opens a window called Recalibrate Plateau, where the voltage range for every counter to be calibrated must be filled in.
A PCL script is used to determine the plateau calibration curve (counts/seconds vs. voltage) of the SEM and/or channeltron. For determination of the plateau voltage, an appropriate signal is focused on the ion counter. The plateau curve of the ion counter is determined by stepwise increasing the operation voltage of the counter and recording the corresponding signal in counts per seconds. The resulting plateau curve is displayed graphically and the detector plateau determined from the graph.
ThermoELECTRON CORPORATION2-52 _____________________ Multicollector Software 3.1 Manual ______________________

TuneMulticollector Software 3.1 ______________________________________________Instrument Control
Figure 2-31. Plateau Voltage Curve
Note. The operation voltage must be entered and saved in the channeltron table in the Executive application, refer to Chapter 6: Executive.
Clicking Dark Noise Level opens a window called Select Measure Time, where the measurement time for every counter to be calibrated must be filled in.
During the dark noise measurement, the analyzer gate valve is closed, so that no ions enter the detectors. A typical integration time for measurement of the dark noise is 5 minutes. The measured dark noise is automatically entered in the Channeltron table in the Executive application, refer to Chapter 6: Executive.
______________________ Multicollector Software 3.1 Manual_____________________ 2-53ThermoELECTRON CORPORATION

TuneInstrument Control __________________________________________ Multicollector Software 3.1
Figure 2-32. Dark Noise Determination Report
ThermoELECTRON CORPORATION2-54 _____________________ Multicollector Software 3.1 Manual ______________________

TuneMulticollector Software 3.1 ______________________________________________Instrument Control
Center Cup Clicking on the Center Cup in the Tune window (refer to Tune Dialog Window on page 2-8) will open the Center Cup parameters.
The center cup can be either a Faraday cup or the axial ion counter (SEM). Ticking the check box Faraday activates the Faraday collector. Unchecking the Faraday check box activates the SEM detector.
Retarding Potential Quadrupole LensIf a retarding potential quadrupole lens (RPQ) is installed, the decelerator voltage and the suppressor voltage are also displayed.
The RPQ is a highly selective filter to prevent ions that have suffered kinetic energy losses due to collisions from entering the collector. The RPQ lens improves the abundance sensitivity by a factor 10. The stray particles with disturbed energies and/ or changed trajectories are filtered out before they reach the SEM.
Figure 2-33. Tune - Center Cup Parameters
Note. The RPQ parameters can be adjusted from the Center Cup dialog, but they must be updated in the Executive, refer to Chapter 6: Executive.Once optimized, these parameters will remain constant and further tuning should not be required.
SEM
FaradayCup
______________________ Multicollector Software 3.1 Manual_____________________ 2-55ThermoELECTRON CORPORATION


Chapter 3Method Editor
This chapter deals with the Method Editor application and is divided into four sections:
• Introduction - Method Editor describes the function and layout of the Method Editor.
• Acquisition Parameter describes the cup configuration table.
• Acquisition Control lists the filament heating parameters, interblock actions and the PCL run script function.
• Evaluation Pane describes the evaluation pane with the different protocols and function for calculating isotope abundance data.
______________________ Multicollector Software 3.1 Manual______________________ 3-1ThermoELECTRON CORPORATION

Method EditorIntroduction - Method Editor ___________________________________ Multicollector Software 3.1
3.1 Introduction - Method EditorThe Method Editor is used to define the acquisition and data evaluation parameters for an isotope ratio measurement. The user must first select a cup configuration and the ratios to be measured. Then, isotope abundance ratios, normalization and interference corrections, interblock actions, calibration, and data evaluation procedures can be chosen.
The method can be used for a single measurement or be included in a sequence acquisition, refer to Chapter 4: Sequence Editor.
A copy of the method is stored in the data file. Thus, all sample parameters are archived with the results of the measurement and the data may be re-evaluated using modified evaluation parameters. For example, this could include adding new isotope ratios to the isotope ratio list; changing the interference corrections and ratio normalizations; or creating or editing formulae. The data is then loaded into the Evaluation application, refer to Chapter 5: Evaluation, to generate new results according to the modified parameters.
Figure 3-1. Finnigan Triton Software - Method Editor Application
Double-Click to Open
ThermoELECTRON CORPORATION3-2 ______________________ Multicollector Software 3.1 Manual ______________________

Method EditorMulticollector Software 3.1 ______________________________________ Introduction - Method Editor
Creating a Method The following steps are required when creating a method:
Figure 3-2. Creating A Method
Select a Cup Configuration
Static Mode / Dynamic Mode
Select a Single Mass Set Line
Set Integration Time
Select Multiple Mass Set Lines
Set Integration and Idle Times
Select Number of Cycles and Number of Blocks
Select Interblock ActionParameters (Amplifier, Tun-ing, Intensity Control)
Construct Isotope Ratios and Interfering Isotope Parameters
Select Evaluation Parameters(Outlier Test, Normalization,AW% etc.)
Automated Heating
Define Heating Parameters
Automated Analysis ofSeveral Filaments
Use Method in Sequence Press Start
Single Acquisition
YES
NO
NO
YES
______________________ Multicollector Software 3.1 Manual______________________ 3-3ThermoELECTRON CORPORATION

Method EditorIntroduction - Method Editor ___________________________________ Multicollector Software 3.1
Standard Bars and Commands
The Method Editor window has the following bars:
• Title bar,
• Menu bar,
• Dialog bars (Accessories and Information)
• Status bar.
Double-click on the Method Editor icon to open the application. The Method Editor opens with a blank page.
Note. The dialog bars are described in detail in Chapter 2: Tune, Accessories and Information Dialog Bars.
Figure 3-3. Method Editor - Start Window
Title BarMenu Bar
Tool Bar
Dialog Bar
Editor Pane
Status Bar
Dialog Bar
Dialog Window
ThermoELECTRON CORPORATION3-4 ______________________ Multicollector Software 3.1 Manual ______________________

Method EditorMulticollector Software 3.1 ______________________________________ Introduction - Method Editor
Title Bar The Title bar contains the name of the application (Method Editor) and the name of the current method file.
Menu BarThe Menu bar contains the application’s top level command menus. When no method is active, only three menus are shown. When a method is active (loaded or newly created) the Menu bar is extended.
File Menu
New Opens a blank document for creating a new method.
Open Opens an existing method
Save Saves the current method with the file extension .met.
Save As... Opens the Save Method dialog box . After saving the file, the name of the method file appears in the title bar.
Print Prints the current method information including the Cup Configuration Table, Acquisition Parameters, Interblock Actions, Evaluation pane with specified isotope ratios and interference element corrections, as well as the evaluation protocols.
Close Closes the current method file.
Print Preview Displays the information described under Print as a preview screen.
Print Setup.. Opens the standard dialog box for selecting printer options.
Exit Closes the Method Editor.
Edit Menu
Delete, Copy, Paste Line(s)Deletes or copies one or more lines in the Cup Configuration Table. Select a line in the table to activate the commands.
Header DataOpens the Header Data window, where information on the sample must be entered, for example the sample ID from the sample wheel calibration table. This information will be saved in the data file.
______________________ Multicollector Software 3.1 Manual______________________ 3-5ThermoELECTRON CORPORATION

Method EditorIntroduction - Method Editor ___________________________________ Multicollector Software 3.1
Execute Menu
Start, Stop, Resume, TerminateControl the running of a method.
View Menu
Status Bar Toggles the status bar on and off.
Accessories, InformationThe dialog bars are toggled on and off.
Display Logfile Opens the log file of the data acquisition.
Display Data EvaluationOpens the evaluation application, refer to Chapter 5: Evaluation.
Settings Menu
Start Eval AutomaticallyIf this is checked, the Evaluation application is automatically started when a method starts.
Reload Last File If checked, the Method Editor opens the most recently used method file when starting up.
External Trigger The external trigger is not used for TIMS analysis.
Display Masses The option is not implemented.
ThermoELECTRON CORPORATION3-6 ______________________ Multicollector Software 3.1 Manual ______________________

Method EditorMulticollector Software 3.1 ______________________________________ Introduction - Method Editor
Tool BarThe Tool bar contains a collection of shortcuts (tool icons). They provide quick access to frequently used commands. The Tool bar can be switched on or off.
Opens a new empty method file.
Loads a saved method file.
Saves the newly created method.
Controls the running of a method:• Start - Go: starts the running of a method. It is only
active if all settings are correct. Otherwise, a error message is displayed in the Status bar.
• Stop/ Resume: pauses the running method. Pressing the icon again after a method was stopped will resume the run.
• Terminate: click to completely stop the method.
Opens the Data Evaluation application using the current data set
Pressing this icon opens the Report Parameter window, where the evaluation settings can be preselected, see the next paragraph.
______________________ Multicollector Software 3.1 Manual______________________ 3-7ThermoELECTRON CORPORATION

Method EditorIntroduction - Method Editor ___________________________________ Multicollector Software 3.1
Report Parameter
The report parameter windows allows the user to choose the data to be evaluated in the Evaluation application, see Chapter 5: Evaluation.
All lines and isotope ratios of the current measurement are displayed at the left side of the window and can be selected by ticking the check box next to the respective item. In addition, values such as dead time, baseline and gain, etc. can be preselected here for the Evaluation application.
The sections Mode, View and Output allow a preselection of the measurement mode and view in the Evaluation. The sections ASCII Export and Invalid Values can be used to preselect export and print settings for the data evaluation.
For a description of the function of the different items refer to section Data Evaluation and Organization on page 5-11.
Status BarThe Status bar contains status information or error messages related to the application running in this window, for example “Ready to Start Method” or “Header Data not Complete”.
Figure 3-4. Method Editor - Report Parameters Window
ThermoELECTRON CORPORATION3-8 ______________________ Multicollector Software 3.1 Manual ______________________

Method EditorMulticollector Software 3.1 ______________________________________ Introduction - Method Editor
Editor PaneAs soon as the user opens or creates a method, this area displays all input fields and information required.
Dialog BarsAdditional information in the Method Editor can be displayed via the Accessories and Information dialog bars. These bars contain different panels, which can be displayed and arranged as required.
Accessories Dialog BarThe Accessories dialog bar allows the selection of three additional panels:
• Application Start
• Watch Parameters
• File Browser
The different panes can be switched on and off via the context menu of the Accessories dialog bar: open the context menu with a right mouse click in the accessories field and select Administrate Panels.
Figure 3-5. Method Editor - Administrate Panels Accessories
Note. The above dialog windows are described in detail in Accessories and Information Dialog Windows on page 2-6.
______________________ Multicollector Software 3.1 Manual______________________ 3-9ThermoELECTRON CORPORATION

Method EditorIntroduction - Method Editor ___________________________________ Multicollector Software 3.1
Information Dialog BarThe Information dialog bar allows the selection of three additional panels:
• Log viewer
• Chartrecorder
• Info
The different panes can be switched on and off via the context menu of the Information dialog bar: open the context menu with a right mouse click in the information field and select Administrate Panels.
Figure 3-6. Method Editor - Administrate Panels Information
Note. The above dialog windows are described in detail in Accessories and Information Dialog Windows on page 2-6.
ThermoELECTRON CORPORATION3-10 _____________________ Multicollector Software 3.1 Manual ______________________

Method EditorMulticollector Software 3.1 ______________________________________ Introduction - Method Editor
PanesThe Method Editor contains all parameters required for the analysis.
This is summarized on the following panes:
• Acquisition Parameter,
• Acquisition Control, and
• Evaluation
The Acquisition Parameter pane displays the cup configuration, the abort criteria, and the number of cycles and blocks to be collected. The Acquisition Control parameters determine how the data are acquired. The Evaluation parameters define in detail how the calculation of isotope compositions should be performed: the isotope ratios that will be calculated, the application of normalizing ratios and interference corrections, and specific data evaluation procedures, such as multi-dynamic procedures or user-defined formulas.
______________________ Multicollector Software 3.1 Manual_____________________ 3-11ThermoELECTRON CORPORATION

Method EditorAcquisition Parameter________________________________________ Multicollector Software 3.1
3.2 Acquisition ParameterThe Acquisition Parameter pane displays the cup configuration, the abort criteria, and the number of blocks and cycles.
Each run through the cup configuration table is defined as a cycle. A complete measurement consists of number of ratios = the number of blocks multiplied by the number of cycles. The measurement will stop when the defined number of data points has been acquired.
To set up a method, first load a cup configuration into the Acquisition Parameter pane:
Cup Configuration TableClick on the Cup Configuration box and select one of the previously stored configurations.
Figure 3-7. Method Editor - Acquisition Parameter Pane
Cup Configuration Table Acquisition Parameter
Note. To load a cup configuration into the Method Editor, the cup configuration must have been defined and saved in the Tune application, refer to Chapter 2: Tune.
All cup configurations defined in Tune can be selected from the dropdown list in the Method Editor.
ThermoELECTRON CORPORATION3-12 _____________________ Multicollector Software 3.1 Manual ______________________
Method EditorMulticollector Software 3.1 ___________________________________________ Acquisition Parameter
Once a cup configuration is selected, the main configuration is loaded and displayed in line 1 of the Cup Configuration table. Only detectors that are used in the cup configurations are displayed by default.
Static, Dynamic and Multidynamic MeasurementsThe user can choose to perform either a static or a dynamic measurement.
A static measurement is a method that uses only a single line within the cup configuration table. All of the isotopic currents required are collected simultaneously and the magnetic field is not changed during the analysis.
In case of dynamic measurement, the magnetic field is switched for every line and different isotopic ion currents are focused into the detectors. Thus, the user must define more than one line in the cup configuration table. Isotope ratios can be constructed from ion currents measured in different lines. Since these measurements were not made simultaneously, a quadratic drift correction is applied.
It is possible to define the integration time, the number of integrations, and the idle time differently for each line in the cup configuration table. Also the channels for peak center and peak focus can be selected for each line.
Multidynamic measurements are dynamic measurements that eliminate possible gain errors in the calculated isotope abundance ratios. The isotope ratios are normalized to a known isotope ratio of the isotopic system. This normalizing isotope ratio is measured in different detectors of the multicollector array and it is used for fractionation control as well as for detector cross calibration.
Note. A static measurement offers optimum speed, precision, and accuracy for isotope ratio determinations. Signal drift or fluctuations show up on all isotopes simultaneously and do not affect isotope abundance ratios.
Note. Only simultaneously measured isotopes are used for calculation. Therefore, signal drift corrections are not applied.
Note. In the past, multi-dynamic measurements were performed to cancel out cup factors between Faraday cup detector. This is no longer required on the Finnigan Triton because of the high performance Faraday cups and the application of the Virtual Amplifier (Matrix Rotation) for high precision data.
Nevertheless, this measurement option is still available.
______________________ Multicollector Software 3.1 Manual_____________________ 3-13ThermoELECTRON CORPORATION

Method EditorAcquisition Parameter________________________________________ Multicollector Software 3.1
Pre-programmed multi-dynamic routines for Nd and Sr measurements are provided under the tab Multidynamic Evaluation in the Evaluation pane, refer to Evaluation Pane on page 3-31. The pre-programmed multi-dynamic methods distinguish themselves according to element measured and number of cups (hence lines) used.
When a static measurement is carried out, only one line of a cup configuration is selected in the cup configuration table.
When performing a dynamic measurement, several lines are used, each line describing a sub-configuration. These configurations will be measured one after the other, starting at Line 1.
Table Columns Center SEM/RPQ If the data are collected using the secondary electron
multiplier [SEM, with or without Retarding Potential Quadrupole Lens (RPQ)] instead of the Faraday cup, click in the isotope field for the center cup. The field turns red if the SEM is selected.
Integration Time Length of time to integrate ion current or the counting time for a Channeltron or SEM. Click in the Integration Time field to select the length of time in seconds during which the ion currents are measured. Individual lines may use different integration times.
Note. This does not have to be the main line of the cup configuration. Any cup of the sub-configurations can be used.
Note. SEM and RPQ are optional components of the Finnigan Triton.
Faraday Cup
SEM
ThermoELECTRON CORPORATION3-14 _____________________ Multicollector Software 3.1 Manual ______________________

Method EditorMulticollector Software 3.1 ___________________________________________ Acquisition Parameter
Number of IntegrationsThe number of integrations on peak may be entered as an integer. A typical value for a static measurement is 1. The total integration is calculated as Integration Time multiplied by the Number of Integrations.
Idle Time Idle Time is the time needed for the magnetic field and the Faraday cup detectors to settle when jumping from one mass to another (during dynamic measurements). It defines the waiting time in seconds prior to the start of measuring the new line in the cup configuration table. The default setting is 3 seconds. This value is recommended for the measurements using the Faraday cups to ensure that the amplifiers have sufficient time to stabilize. In case only ion counting detectors are used, shorter idle times can be selected (down to 0.1 s).
Control Cup PeakcenterA peakcenter can be performed in each line to ensure that the ion beams are centered at the detectors. If a peakcenter is requested, a control cup must be selected. The ion current will be centered in this cup.
Choose a cup from the drop-down list box. Only cups defined for that particular line are listed in the box.
Note. In the case of static measurement, when only one line is chosen, a selected idle time of for example 3 seconds is only used at the beginning of each block.
Note. Peakcenter during a measurement must be defined as an interblock action in the Acquisition Control pane, refer to Interblock Actions on page 3-26.
______________________ Multicollector Software 3.1 Manual_____________________ 3-15ThermoELECTRON CORPORATION

Method EditorAcquisition Parameter________________________________________ Multicollector Software 3.1
Control Cup Focus Lens and filament focus may be selected as interblock actions in the Acquisition Control pane, refer to Interblock Actions on page 3-26. Similar to the control cup for peakcenter, it is necessary to select which signal is optimized by the autofocus procedure.
Select the detector cup that is used from the drop-down list box by clicking in the field. Only cups defined for that particular line are shown in this list. In an experiment containing several lines, it is not necessary to focus for every line. In this case, set the Control Cup Focus to None.
Editing the TableNew line Click in the Mass Set field to add an additional line
from the current cup configuration. A drop-down box will appear showing the main and sub-configurations available. When a configuration is selected, the isotope fields for each cup in use are automatically updated with the mass/ isotope information. Up to 30 lines may be entered.
Line Width To change the widths of the columns, point the cursor between two cells at the headline; the cursor symbol changes to a divider. Press the left mouse button and resize the width with the divider. If you double-click between two columns, the width is fitted automatically.
Selection of Single LinesSelect a single line with a left mouse click on the line number in the column “Line No.”. The color of the line turns to dark blue. To deselect the line, click again.
Note. It is generally advisable to perform peak centering using the ion current with the largest signal within a cup configuration.
In case of a multicollector measurement, first verify peak overlap using the Tune application. Peak center cannot correct for poor peak coincidence.
ThermoELECTRON CORPORATION3-16 _____________________ Multicollector Software 3.1 Manual ______________________

Method EditorMulticollector Software 3.1 ___________________________________________ Acquisition Parameter
Selection of Multiple LineThere are three ways to select more than one line:
- Press the left mouse button and hold it while moving over the column “Line No.”. Release the mouse button when the selection is completed.
- Press <CTRL> and click on the line numbers you want to add to the selection.
- To select all lines, click on the box “Line No.“ in the upper left corner.
To deselect a row, click on the corresponding row.
Moving Lines To change the order of lines, use the drag&drop procedure. Press the left mouse button on a line number that you have selected already. Drag the line to the desired position. The selected lines are placed above the target line. A destination in between selected lines is not valid. After changing the order of lines, all ratios will be updated, refer to Evaluation Pane on page 3-31.
Deleting Lines Selected lines are deleted when the <Delete> key is pressed. If any ratio is involved, a warning will appear before deletion.
Acquisition ParametersOnce a cup configuration and single or dynamic sequence have been defined, the total number of ratios to be acquired is selected. Optionally, a statistical threshold to end the run can also be selected.
Each pass through the cup configuration table is defined as a cycle. A block is a set of cycles. Thus, the complete measurement consists of the number of blocks multiplied by the number of cycles.
______________________ Multicollector Software 3.1 Manual_____________________ 3-17ThermoELECTRON CORPORATION

Method EditorAcquisition Parameter________________________________________ Multicollector Software 3.1
Data Structure
Cycles A cycle is one part of the measurement, which starts with the first line and ends with the last line defined in the cup configuration table within the method. A cycle can be interrupted while method is running.
Blocks A block is defined as a set of cycles.
Abort Criteria Under normal circumstances, the measurement will stop when the total number of data points has been acquired. However, the user can choose to abort the run when the standard error of a specific isotope ratio is better than a user-defined value or if the signal intensity falls below a minimum threshold.
Figure 3-8. Acquisition Parameters - Data Structure of The Measurement
A block can be interrupted by pressing the pause button in the Tool bar. This is useful to optimize source focus or change the filament temperature during an acquisition. If the measurement is resumed, the interrupted block starts with the first cycle again. Data already acquired in the interrupted block are discarded. This is done to maintain the integrity of the data because measurements made within one block should be under identical instrumental conditions. In case the entire run is terminated, the data from incomplete blocks are saved.
Block 1 Block J
Cycle 1 Cycle 1
Cycle N Cycle N
.
...
Integrations
Integrations
Integrations
Integrations
Integrations
Integrations
Integrations
Integrations
Line 1..Line K
Line 1..Line K
Line 1..Line K
Line 1..Line K
. .
ThermoELECTRON CORPORATION3-18 _____________________ Multicollector Software 3.1 Manual ______________________

Method EditorMulticollector Software 3.1 ___________________________________________ Acquisition Parameter
Note. The isotope ratios must be defined in the Evaluation pane before they can be used to end the run, refer to Evaluation Pane on page 3-31.
When the check box is ticked, the measurement will be aborted when the signal intensity falls below the specified threshold in Volts [V]. The intensity is taken from the Control Cup Peakcenter specified in Line 1 of the cup configuration table.
When the check box is ticked, the measurement will be aborted when the standard error of a specified ratio is reached:
Select the isotope ratio to be used for the StdErr test from the drop-down box.
______________________ Multicollector Software 3.1 Manual_____________________ 3-19ThermoELECTRON CORPORATION

Method EditorAcquisition Control __________________________________________ Multicollector Software 3.1
3.3 Acquisition Control The Acquisition Control pane is divided into three sections: Filament Heating, Interblock Actions and PCL Run Script.
Filament HeatingControls in the Filament Heating pane are used to automatically control the currents of the evaporation and ionization filaments before and during a measurement.
SettingsThe Settings section is used to tell the software which isotope ion current to monitor when controlling the evaporation (EVA) and ionization (ION) filaments and the maximum filament current (Max. Current in mA) allowed for each filament. The pilot masses used for controlling the evaporation and ionization filaments may be different.
Figure 3-9. Method Editor - Acquisition Control
Filament Heating Interblock Actions Run ScriptInterblock Actions Run Script
ThermoELECTRON CORPORATION3-20 _____________________ Multicollector Software 3.1 Manual ______________________

Method EditorMulticollector Software 3.1 _____________________________________________ Acquisition Control
For example, in a double filament experiment to measure U using Re filament material, one could control the ionization filament current and use 187Re as the pilot mass to perform source focus, etc. Then, once the required ionization filament temperature has been reached, one could warm the evaporation filament and monitor the 238U ion current.
Pilot masses are typed into the fields as isotopes (mass# Element symbol, i.e. 187Re) or as exact masses. They do not have to appear in the cup configuration table. In this case, the pilot mass is measured in the center cup. If the pilot mass does appear in the first line of the cup configuration, the corresponding cup from the cup configuration table is used.
Summed Intensities
The SUMI (summed intensity) function is particularly useful when measuring samples with unknown isotopic patterns, for example spiked samples. Instead of monitoring the ion current intensity in a single collector, the summed ion currents over several collectors are monitored.
SUMI Cups is enabled as a “function” in the Filament Heater program, refer to Columns on page 3-23.
Note. Before the cups can be selected, a cup configuration must be loaded in the cup configuration table!
Clicking on the SUMI Cups button opens the Select Cups dialog window. Click on the collectors to be summed together and select if the axial Faraday cup or ion counter should be used for the SUMI cups.
______________________ Multicollector Software 3.1 Manual_____________________ 3-21ThermoELECTRON CORPORATION

Method EditorAcquisition Control __________________________________________ Multicollector Software 3.1
Filament Heater ProgramAutomatic heating of the filaments is possible using the Filament Heater application accessed via the Filament Heating pane. This application is used to program the final filament current and/or temperatures, the rate of filament current increase, and control specific instrument functions including opening and closing the analyzer isolation valve, focusing the source and centering peaks.
In the Filament Heating pane, tick the Program check box and then click on Edit button to open the Filament Heater application.
Menu bar
The Filament Heater menu bar contains the menus File, Edit, Execute, View, and Help.
File The commands in the File menu open and store the heating routines.
Edit Using the commands in the Edit menu manages the lines of the filament heating.
Execute Using the commands in the Execute starts, stops, resumes, and terminates the filament heating routine.
Figure 3-10. Filament Heater Program - Example
ThermoELECTRON CORPORATION3-22 _____________________ Multicollector Software 3.1 Manual ______________________

Method EditorMulticollector Software 3.1 _____________________________________________ Acquisition Control
Focus
A user- defined source file can be used during an automatic filament heating program. These files are created in the Tune application, refer to Autofocus on page 2-29.
Columns
The columns in the Filament Heater table can be filled in by clicking in the field and either selecting the required item from a drop-down list or entering the value via the keyboard.
Line The lines are numbered sequentially.
Start Time Calculated duration of the Filament Heater program.
Valve Open Select to open or close the analyzer isolation valve during execution of that line.
Filament Type Selection of evaporation (EVA) or ionization (ION) filament to control in that line.
Function Executable functions are listed in a drop-down list box and include:
WAIT sets a defined idle time. Actions can be performed during this period.
FILC sets a current for the filament, defined in Filament Type columns. The value is defined in the Value column (mA, mV). The slope is calculated automatically for the Slope column depending on the time set.
IONC sets an ion beam intensity in mV or cps. Its value is defined in the Value column (mA, mV).
TEMC sets a filament temperature (the pyrometer must be switched on). The value is defined in the Value column.
YIELD performs a yield calibration. All other columns are inactive.
GAIN performs a gain calibration. All other columns are inactive.
SUMI heats the filament according to the summed intensities defined using the SUMI Cups button in the Filament Heating pane. The value that the sum of ion beam intensities should reach (either in mV or counts per second) is defined in the Value column.
______________________ Multicollector Software 3.1 Manual_____________________ 3-23ThermoELECTRON CORPORATION

Method EditorAcquisition Control __________________________________________ Multicollector Software 3.1
Time The time allocated to perform the function. The time is entered in seconds and displayed in the form mm:ss.
Value The desired final value of the ion current (mA), filament current (mV), temperature (°C), or counts per second.
Slope A slope may be entered if the filed is white. Otherwise, the slope is calculated automatically (shaded field).
Steps Number of readings within the given time.
Action 1 to 5 The action that is performed when the defined value of the function and the time limit is reached. Available actions are listed in a drop-down list box.
NONE: no action is performed.
MONITOR: not implemented yet.
PEAKCENTER performs a peak center.
FOCUS performs a complete lens focus.
ZFOCUS performs only a Z-focus lens.
FILFOCUS performs a sample wheel focus.
Note. This is only used for intensity controlled heating. Increasing the number of steps increases the number of times the ion current intensity is monitored during the heating process.
ThermoELECTRON CORPORATION3-24 _____________________ Multicollector Software 3.1 Manual ______________________

Method EditorMulticollector Software 3.1 _____________________________________________ Acquisition Control
Total EvaporationTotal evaporation is a measurement protocol whereby the filament is heated rapidly and the entire sample is evaporated completely. The intensities of each isotope are acquired in static mode only.
During acquisition, the temperature of a filament is continuously increased depending on the signal of a pilot mass or the sum of signals of user-selected masses. A typical intensity versus time is shown in the below figure:
This mode is enabled by clicking in the Total Evaporation check box.
Figure 3-11. Schematic Acquisition Procedure of the Total Evaporation Process
Select the filament to be controlled (EVA or ION) from the drop-down box. Enter the maximum Pilot Signal [mV] and the Intensity Offset for Stop [mV].
Click the Select Cups button to choose which cup(s) is(are) used to monitor for maximum pilot signal intensity.
______________________ Multicollector Software 3.1 Manual_____________________ 3-25ThermoELECTRON CORPORATION

Method EditorAcquisition Control __________________________________________ Multicollector Software 3.1
If multiple cups are selected from the Select Cups window, the sum of intensities over the cups will be monitored. As soon as the selected intensities drop below the intensities at the start of the run plus the intensity offset, the run will stop.
The Heatslope [mA/Cycle] is the increase in the filament current per every cycle to maintain the evaporation profile.
Interblock ActionsThe interblock actions include heating the filaments to maintain the ion current within a preset window; optimization of source focus; peak centering; calibration of ion counters; and gain, rotation, and baseline measurements for the Faraday cup detectors.
Interblock actions are enabled by checking the associated check box.
HeatingThe Heating interblock actions are used to maintain a constant ion current by increasing either the temperature of ionization and/or the evaporation filaments within a user-defined range, relative to the ion current set at the start of the run.
Note. Before the cups can be selected, a cup configuration must be loaded in the cup configuration table and the Settings and the Filament Heating field must be filled in.
Note. The actual filament current during Total Evaporation cannot exceed the maximum current set in the Filament Heating pane, refer to (Filament Heating) Settings on page 3-20.
Note. Many interblock actions can be performed at the start of the run, the start and end of a run, or after every n’th block, where n is an integer from 1 to the total number of blocks.
Select the filament type by ticking the check box.
The range can be entered via the keyboard.
Note. For a single filament experiment, only the evaporation filament (EVA) is adjusted.
ThermoELECTRON CORPORATION3-26 _____________________ Multicollector Software 3.1 Manual ______________________

Method EditorMulticollector Software 3.1 _____________________________________________ Acquisition Control
The ion current intensities monitored are selected in the Filament Heating pane, refer to (Filament Heating) Settings on page 3-20.
Counter CalibrationCounter Calibration interblock actions are employed to determine the Dark Noise of ion counters or Yield of the axial ion counter that are used in the cup configuration.
TuningTuning interblock actions include Peak Center, Filament Focus, and Lens Focus. Both the Peak Center and the Lens Focus will optimize the signals using the control cup defined in each line of the cup configuration table, refer to Cup Configuration Table on page 3-12.
Note. Automatic determination of plateau voltage is not supported by this version of the software.
Select the required action by ticking the check box.
Select when the action should be performed from the drop-down list box (either at the start or end or both start and end of the measurement).
Select the required action by ticking the check box.
Select when the action should be performed from the drop-down list box (either at the start or end or both start and end of the measurement).
Note. If the Lens Focus is selected, a user-defined lens focus procedure can be loaded in the method, refer also to Autotune Configuration, Tune Menu on page 2-4.
______________________ Multicollector Software 3.1 Manual_____________________ 3-27ThermoELECTRON CORPORATION

Method EditorAcquisition Control __________________________________________ Multicollector Software 3.1
AmplifierAmplifier interblock actions include Rotation of the virtual amplifier matrix (Rotate), a Gain Calibration and Baseline measurement.
Rotate: Checking the box Rotate activates the virtual amplifier. The rotation direction can either be clockwise (Right) or counter-clockwise (Left), where counter-clockwise rotation means that cup 1 is connected sequentially to amplifier1, then amplifier 2 and so on.
The virtual amplifier matrix rotates the amplifier after each data block between all Faraday cups using a relay matrix.
Baseline The Baseline can be determined in two different ways; either with defocused source (electronic baseline) or at half mass positions (analytical baseline). Typically, 30 measurements of the baseline are made, each with a 1.05 s integration time. The baseline script will filter the data with a 2 sigma (stdev) outlier test.
Select the required action by ticking the check box .
The rotation sense and gain calibration and/or baseline measurements are selected from the drop-down list.
Note. Amplifier rotation is recommended when the gain calibration bias of the current amplifiers limits the attainable precision, for instance < 10 ppm.
A method using rotation must have as many blocks as ion current intensities specified in the cup configuration table.
Note. When initiating the rotate function as an interblock action, a baseline measurement must be made every block.
Note. It is usually sufficient to perform a gain calibration every few days, as the 24-hour stability of the Faraday cup amplifiers is better than 10 ppm.
Click on Baseline Parameters to select the baseline measurement settings.
ThermoELECTRON CORPORATION3-28 _____________________ Multicollector Software 3.1 Manual ______________________

Method EditorMulticollector Software 3.1 _____________________________________________ Acquisition Control
Analytical Baseline: The baseline is measured between peaks, typically at half mass. Enter the baseline masses on either side of a center cup mass as First Mass and Second Mass, usually ~0.5 amu either side of a peak. In this case, the backgrounds at the First Mass and Second Mass are measured and the average is taken as the baseline value for data evaluation. Ensure that the Defocus box is unchecked.
The baseline measurements are made on all Faraday cups.
Electronic Baseline: The baseline is measured using a defocused source such that no ions reach the detector. The first mass and the second mass will be grayed out.
Once the parameters are selected, click OK to save the them in the measurements as interblock actions.
Note. For TI-MS measurements DEFOCUS is preferred because there is typically no background and only a determination of the electrical baseline of the amplifiers is required.
______________________ Multicollector Software 3.1 Manual_____________________ 3-29ThermoELECTRON CORPORATION

Method EditorAcquisition Control __________________________________________ Multicollector Software 3.1
Run ScriptTicking the check boxes After Block or After Run enables the user to implement scripts, which are executed after the measurement of a block and/or a run.
For example, a script could be selected to reset the filament current and close the analyzer isolation valve at the end of a run. Executable PCL scripts are located in the directory C:\Triton\User\triton\pcl\User) and have a .pex extension.
Figure 3-12. Run Script - Example List
ThermoELECTRON CORPORATION3-30 _____________________ Multicollector Software 3.1 Manual ______________________

Method EditorMulticollector Software 3.1 _______________________________________________ Evaluation Pane
3.4 Evaluation PaneThe Evaluation pane can be selected by clicking on the Evaluation tab. It contains three fields: the Isotope Ratios and Interference Correction field on the left and the evaluation protocols on the right. Within the evaluation protocol are tabbed windows for defining Evaluation Parameters, Multidynamic Evaluation, At. & Weight %, C-Factor, and the Formula Editor.
Isotope RatiosThe Isotope Ratios to be evaluated are assembled from the measured isotopes in the cup configuration table and inserted in the isotope ratios field using drag&drop. The numerator is defined as “Isotope 1“ and the denominator as “Isotope 2“. Several isotope ratios can be constructed. Ratios can be constructed from any of the measured ion currents. The isotopes used in a given ratio do not have to come from the same line. Ratios calculated from ion currents in different lines are automatically recognized as dynamic measurements.
Clicking on the corresponding ratio number in the Ratio column and pressing <Delete> will delete the ratio. An isotope can be replaced by dragging and dropping a different isotope into position.
Refer to Example: Defining Isotope Ratios and IEC on page 3-32.
Figure 3-13. Method Editor - Evaluation Pane
Isotope Ratios Interference Correction Evaluation Protocols
______________________ Multicollector Software 3.1 Manual_____________________ 3-31ThermoELECTRON CORPORATION

Method EditorEvaluation Pane____________________________________________ Multicollector Software 3.1
Interference Element Correction (IEC)Isotope ratios can be corrected for isobaric interferences using Interference Element Corrections (IEC). Refer to Example: Defining Isotope Ratios and IEC on page 3-32.
The IEC column in the Isotope Ratio table must be checked for those ratios that require correction.
Example: Defining Isotope Ratios and IECIn the following example, a method for the static measurement of Sr will be defined. An interference correction for the 87Sr isobar 87Rb will also be included.
1. Load a cup configuration file in the cup configuration table.
2. Enter the ratio in the Isotope Ratio field by selecting the desired isotopes from the cup configuration table and inserting them in the field via drag and drop.
Note. The correction value (Corr. Val) must be defined for an interference correction. A value of zero means no correction is applied.
ThermoELECTRON CORPORATION3-32 _____________________ Multicollector Software 3.1 Manual ______________________

Method EditorMulticollector Software 3.1 _______________________________________________ Evaluation Pane
The first ratio has 1:88Sr as the numerator. The number 1 refers to Line 1 of the cup configuration table.
3. Enter the denominator via drag and drop from the cup configuration table.
Repeat the above for all required isotope ratios. In our example, the completed field looks as follows:
4. Enter the interference element correction.
In our example, 87Rb interferes on 87Sr. The presence of 87Rb will increase the measured 87Sr/86Sr ratio. However, assuming that the isotopic composition of rubidium is known, it is possible to calculate the
Drag&Drop
______________________ Multicollector Software 3.1 Manual_____________________ 3-33ThermoELECTRON CORPORATION

Method EditorEvaluation Pane____________________________________________ Multicollector Software 3.1
relative amount of 87Rb present and substract it from the measured 87Sr intensities. It is required that at least one interference-free isotope of rubidium is defined in the cup configuration table, e.g. 85Rb. In this example, 85Rb must be placed in the Interference Correction field. Again, this is done by drag and drop.
A ratio will appear with a correction value (Corr. Val.) set to “0.000000“. Click on the ratio to reveal a drop-down list with the possible isotope ratios of this element. Select the appropriate ratio and enter the corresponding isotope abundance ratio. In most cases, this would be the natural value as reported by IUPAC. However, if the isotope abundance ratio of the interference is known exactly, this can be entered as the correction value.
Finally, click the IEC column in the Isotope Ratio field for the respective ratio.
The Isotope Ratios filed would look as follows. Notice that in this example two 87Sr/86Sr ratios will be calculated; one with interference correction for 87Rb and one without.
Drag&Drop
ThermoELECTRON CORPORATION3-34 _____________________ Multicollector Software 3.1 Manual ______________________

Method EditorMulticollector Software 3.1 _______________________________________________ Evaluation Pane
Evaluation ParameterThe Evaluation Parameter includes the Outlier Test and Int. Standard Normalization pane.
Figure 3-14. Example of Isotope Ratios 87Sr/ 86Sr with and without Interference Correction
Figure 3-15. Method Editor - Evaluation Parameter
Ratio Calculation with IEC
Ratio Calculation without IEC
Outlier Test
Int. StandardNormalization
______________________ Multicollector Software 3.1 Manual_____________________ 3-35ThermoELECTRON CORPORATION

Method EditorEvaluation Pane____________________________________________ Multicollector Software 3.1
Outlier TestThe Outlier Test criteria can be defined for:
Integration: Ticking the Integration check box applies the outlier test to the individual integrations made for every line in the cup configuration table. Using the drop-down list box selects the rigidity of the outlier test from 1 Sigma to 3 Sigma or a Dixon test from 70 % to 99.5 %. Applying an outlier test over integrations is only reasonable if many integrations are performed.
A 1 sigma Outlier test will reject all values that are greater than ±1 sigma from the mean values. After the test, the mean is re-calculated without the rejected value.
For example, if 5 integrations have been entered for a cycle or line, the outlier test will be performed for these 5 integrations. The average of the 5 integrations will be reported for this cycle.
Cycles: Ticking the Cycles check box enables an outlier test for the data collected over all cycles. The cycle data are the averages of the integrations. Using the dropdown box selects the rigidity of the outlier test from 1 Sigma to 3 Sigma or a Dixon test from 70 % to 99.5 %. The number of cycles should be reasonably high (usually 10 to 50).
Blocks: Ticking the check box Blocks performs an outlier test on the block means within a run. This is the third level for statistical evaluation of raw data. The rigidity of the outlier test is selected from the drop-down box. Options include 1 Sigma, 2 Sigma, and 3 Sigma or a Dixon test from 70 % to 99.5 %. The number of blocks should be reasonably high within a run (5, but higher when using the amplifier rotation option).
The statistical evaluation parameters for the Outlier Test, e.g. 1 Sigma, 2 Sigma, 3 Sigma or 70 % to 99.5 % Dixon is documented in the literature1.
Note. Dixon tests can only be performed for n<25.
Note. Integrations x Cycles x Blocks = total number of individual data.
Note. In most cases the 2-sigma Outlier test is carried out.
1Dixon, W.J. (1951) Ratios Involving Extreme Values, Annuals of Math. Stat. 22,68-78; Dixon, W.J. (1953) Processing Data for Outliers, Biometrics 9, 74-89
ThermoELECTRON CORPORATION3-36 _____________________ Multicollector Software 3.1 Manual ______________________

Method EditorMulticollector Software 3.1 _______________________________________________ Evaluation Pane
Internal Standard NormalizationThe user may define two different normalizing ratios: Normalizing Ratio 1 and Normalizing Ratio 2. To activate the normalization for a certain isotope ratio as defined in the Isotope Ratio field, the boxes Int. Standard Normalization and the columns labeled “Norm 1“ and “Norm 2” in the Isotope Ratios field should be checked.
Enter Normalizing Ration 1 and/or Normalizing Ratio 2, the type of Correction Law, and True Value 1 for normalizing ratio 1 and True Value 2 for normalizing value 2.
Normalizing Ratio 1/ Normalizing Ratio 2:In the dropdown list under Normalizing Ratio 1 and Normalizing Ratio 2, the user has to select the ratio to be used for mass bias correction. All isotope ratios that are defined in the Isotope Ratio field are available.
True Value 1/ True Value 2:The true values of the normalizing ratios must be entered.
Figure 3-16. Normalization: Check Boxes and Columns
Note. A zero “True Value” means no normalization or mass bias correction.
______________________ Multicollector Software 3.1 Manual_____________________ 3-37ThermoELECTRON CORPORATION

Method EditorEvaluation Pane____________________________________________ Multicollector Software 3.1
Correction Law:The user can choose between three different correction laws: Power Law, Exponential Law, and Rayleigh Law. The algorithms are documented in detail in the literature2. In general, the exponential law is the most appropriate correction law.
Once the normalization algorithm is defined, it can be applied to one or more of the isotope ratios defined in the Isotope Ratio field. When normalization is required, the columns “Norm 1“ and/or “Norm 2“ must be checked for the relevant isotope ratios. Correction is always performed at the end of all calculations (after the baseline, gain, and interference corrections).
The isotope abundances provided by IUPAC may not be identical with the numbers measured by the instrument because of the fractionation mass bias. Abundances based on IUPAC data are located in the file C:\Triton\User\triton\Libraries\Element.els. Corrections can be performed if two isotopes of the interfering element are measured and this isotope ratio is defined to be a normalizing ratio.
Example
Two normalization ratios may be applied to the measured data; most applications will required only one normalizing ratio. However, in the following example for the measurement of calcium isotopes, two normalizations are performed for measurements made in two different lines.
2Hart S.R. and Zindler A. (1989) Isotope Fractionation Laws: A Test Using Cal-cium. International Journal of Mass Spectrometry and Ion Processes 89, 287-301
Figure 3-17. Example of Int. Standard Normalization for Ca
ThermoELECTRON CORPORATION3-38 _____________________ Multicollector Software 3.1 Manual ______________________

Method EditorMulticollector Software 3.1 _______________________________________________ Evaluation Pane
Multidynamic Evaluation MDThe aim of the Multidynamic Evaluation is to systematically eliminate the influence of individual channel biases. It can be applied for all elements where one ratio is known and can be used as an internal correction ratio, for example Sr (88Sr/86Sr is known) and Nd (146Nd/144Nd) is known.
Correction Modes: The user can select from a set of predefined multidynamic correction modes.
The equations used for the calculation are shown in the bitmap of the Multidynamic Evaluation pane.
The isotopes used for the multidynamic procedure must appear in the Isotope Ratio field exactly as shown in the algorithms in the Multidynamic Evaluation pane. This includes the line numbers and isotope from the Cup Configuration table. If the ratios needed are not defined, an error message is
Figure 3-18. Multidynamic Evaluation: Example of a Sr Double Collector Evaluation
Note. Clicking Auto Fill automatically enters predefined ratios to be calculated.
______________________ Multicollector Software 3.1 Manual_____________________ 3-39ThermoELECTRON CORPORATION

Method EditorEvaluation Pane____________________________________________ Multicollector Software 3.1
displayed. The ratios for calculation may also be entered manually into the appropriate field of the Multidynamic Evaluation pane or by dragging it directly from the Isotope Ratio field.
Atom & Weight %For nuclear applications, it is often required to measure the composition of the isotopes in terms of Atom % or Weight % rather than to calculate isotope abundance ratios. These calculations are enabled through the At. & Weight % pane.
K-Factor: Usually for nuclear samples, all isotopic abundances are unknown and there is no known internal normalizing isotope ratio, which could be used for internal fractionation correction. However, an external fractionation correction may be used.
A so-called K-Factor can be derived from the measurement of several known samples. The K-factor describes the mass discrimination per atomic mass unit (amu). Assuming that the mass fractionation of the known sample and the unknown samples are very similar, the K-factor derived from the known sample may then be used to correct the measured isotope ratios of the unknown samples. This K-factor can be entered in the respective edit field in the pane. The K-factor is applied per mass unit, for example +0.001 is equal to 0.1 % bias per amu, that is an increase in the ratio of 0.1 % per increase in mass of the isotope.
Example If we measure a typical uranium sample, which has 4 isotopes, then the following equations can be defined:
(1)
(2)
The three ratios of the At% on the left hand side of equation 2 are identical with the measured isotope ratios. Therefore, equation 2 can be rewritten to:
(3)
At% (234) At% (235) At% (236) At% (238)+ + + 100%=
At%(234)At% (238)------------------------- At% (235)
At% (238)------------------------- At% (236)
At% (238)------------------------- 1+ + + 100%
At% (238)-------------------------=
234U238U------------- 235U
238U------------- 236U
238U------------- 1+ + + ΣR 1+ 100%
AT% (238)---------------------------= =
ThermoELECTRON CORPORATION3-40 _____________________ Multicollector Software 3.1 Manual ______________________

Method EditorMulticollector Software 3.1 _______________________________________________ Evaluation Pane
The sum of R is identical to the sum of all measured isotope ratios.
Then the At. % of the individual isotopes can be calculated as follows:
If the K-Factor is applied, the individual ratios are corrected for fractionation using a linear approximation.
Note. At this point, it is essential that all isotopic ion currents are measured, otherwise the normalization to 100% in equation 1 would not be correct.
Note. The ratios can be entered in the respective field in the At. & Weight % pane by drag&drop.
At% (238) 100%ΣR 1+----------------=
At% (236)
236U238U-------------
ΣR 1+----------------=
At% (235)
235U238U-------------
ΣR 1+----------------=
At% (234)
234U238U-------------
ΣR 1+----------------=
Figure 3-19. At. & Weight % Pane: Example of U Isotope Analyses
Note. Only ratios with the same denominator can be used for the calculation.
______________________ Multicollector Software 3.1 Manual_____________________ 3-41ThermoELECTRON CORPORATION

Method EditorEvaluation Pane____________________________________________ Multicollector Software 3.1
C-FactorThe C-Factor can be used in the evaluation of standard sample sequences. The C fractionation factor is determined from the measurement of a known standard and is applied to the measurement of the unknown sample. The measured isotope ratios of the standard are compared with the known true isotope ratios entered in the C-Factor pane and a correction factor (C-Factor) is calculated.
The correction factor is defined to be the True Isotope Ratio divided by the Measured Isotope Ratio of the Standard.
For each isotope ratio one C-Factor will be calculated. The C-Factor determined for the standard is then applied to measured isotope ratios to yield the corrected isotope abundance ratio.
It is possible to calculate C-Factors that are determined from measurements of the standard before and after sample measurements. This is done using the Sequence Editor, refer to Chapter 4: Sequence Editor. In this case, the isotope ratio in the sample measurement will be corrected using the average of the C-Factor calculated from the measurements of the two standards.
Note. The correction factor is defined to be the True Isotope Ratio divided by the Measured Isotope Ratio of the Standard.
The default ratios according to the IUPAC table can be loaded by clicking on Default Ratios.
Clicking on Clear All deletes all entries in the C-Factor pane.
Note. The default ratios in the C-Factor pane are derived from the abundances in the element table. This table is located in C:\Triton\User\triton\Libraries\Element.els.
These default abundances are based on IUPAC (International Union of Pure and Applied Chemistry) data. However, the Elements.els file can be edited by the user and the IUPAC values can be overwritten by values which seem to be more appropriate to the user.
ThermoELECTRON CORPORATION3-42 _____________________ Multicollector Software 3.1 Manual ______________________

Method EditorMulticollector Software 3.1 _______________________________________________ Evaluation Pane
Formula EditorThe Formula Editor provides a convenient and powerful means for performing calculations using ion current intensities and isotope ratios within a cycle. Results from calculations are presented along with the raw data in the Evaluation application (refer to Chapter 5: Evaluation).
The variables for the formulas are first entered as ion currents, isotope ratios, or constants. Formulas are then defined using the variable names. Results from one formula can be used as in subsequent formulas.
The formula can be saved (pressing Export Formula Data) and then used in another method file (pressing Import Formula Data).
The following operations and functions may be used in the formula:
Figure 3-20. Method Editor - Formula Editor
Clicking on the Import Formula Data icon opens a formula data set in the Formula Editor.
Clicking on the Export Formula Data icon saves a formula for use in another method files.
Operators + | - | * | /
Power Operator
**
Functions sqrt | log | ln | exp | expn | sin | cos | tan | neg | atan | acos | asin | sinh | cosh| tanh
______________________ Multicollector Software 3.1 Manual_____________________ 3-43ThermoELECTRON CORPORATION

Method EditorEvaluation Pane____________________________________________ Multicollector Software 3.1
Example: Defining an Online-Calculation using the Formula EditorSuppose one wants to perform an interference correction using the online formula editor with the Sr configuration used in the proceeding examples.
Enter Variables
One must first define all the variables for the equation in the Variable table using the ratios in the Isotope Ratio table or measured ion current intensities.
1. Click on the number for the ratio and drag it to the variable table. The ratios will be given a name automatically (R1... Rn).
2. Individual ion currents are incorporated into the variable table by dragging and dropping them from the cup configuration table. These are given the name “ISO1... ISOn“. The variable names can be changed by the user.
Special Functions
Isotope abundance in %: ABUN, for example:ABUN(144Nd) returns the isotopic abundance of 144Nd according the IUPAC element list.
Atomic weight of isotopes: AW, for example:AW(144Nd) returns the atomic weight of 144Nd according to the IUPAC list.
Note. The variable names are case-sensitive.
Drag&Drop
ThermoELECTRON CORPORATION3-44 _____________________ Multicollector Software 3.1 Manual ______________________

Method EditorMulticollector Software 3.1 _______________________________________________ Evaluation Pane
3. Additionally, constants can be included in the variable table. Enter the value of the constant in the Variable Value column via the keyboard.
A text descriptor for each variable in the column on the right can be entered.
Enter Formulas
Formulas are entered in the table at the right.
4. Click in the cell to enter a name in the Formula Name field. The text entered will appear as the column header in the Evaluation application.
5. Click in the cell to enter the formulas themselves in the Formula field.
Drag&Drop
______________________ Multicollector Software 3.1 Manual_____________________ 3-45ThermoELECTRON CORPORATION

Method EditorEvaluation Pane____________________________________________ Multicollector Software 3.1
When the method is saved, the formula is saved along with it. The formula can also be saved on its own to be used later in other methods.
However, when loading a formula in another method the user must fill in the column the variable values again. This can be done via the keyboard or drag- and drop. Only the constant value will be entered automatically.
Note. Formulas do not begin with “=”. Make sure that the variable name appears in the formula exactly as it did in the Variable Name column.
Figure 3-21. Method Editor - Formula Editor
ThermoELECTRON CORPORATION3-46 _____________________ Multicollector Software 3.1 Manual ______________________

Chapter 4Sequence Editor
This chapter deals with the Sequence Editor of the Multicollector Software Version 3.1 and contains the following sections:
• Introduction - Sequence Editor describes the basic layout and the top commands in the Sequence Editor.
• Sequence Table introduces the main feature of the Sequence Editor and describes how to setup a sequence.
______________________ Multicollector Software 3.1 Manual______________________ 4-1ThermoELECTRON CORPORATION

Sequence EditorIntroduction - Sequence Editor _________________________________ Multicollector Software 3.1
4.1 Introduction - Sequence EditorThe Sequence Editor enables the user to set up a sequence of analyses of samples and standards.
A sequence consists of one or more samples that are heated and measured automatically according to user-defined methods, refer to Chapter 3: Method Editor.
All events during the run and the progress will be reported and displayed in the Sequence Log file. During the run of a sequence, the results of the isotope measurement can be viewed using the Evaluation application (refer to Chapter 5: Evaluation).
Figure 4-1. Finnigan Triton Software - Sequence Editor Application
Double-Click to Open
ThermoELECTRON CORPORATION4-2 ______________________ Multicollector Software 3.1 Manual ______________________

Sequence EditorMulticollector Software 3.1 ____________________________________ Introduction - Sequence Editor
Standard Bars and Commands
The Sequence Editor has the following bars:
• Title bar,
• Menu bar,
• Sample Type bar,
• Dialog bars (Accessories and Information) and
• Status bar.
Title Bar The Title bar contains the name of the application (Sequence Editor) and the name of the current sequence file.
Double-click on the Sequence Editor icon to open the application. It opens with an empty page with no sequence loaded.
Figure 4-2. Sequence Editor - Start Window
Title BarMenu Bar
Sample Type BarTool Bar
Dialog Bar(Accessories) (Accessories)
Dialog Window
Dialog Bar(Information)
Editor Pane
Status Bar
______________________ Multicollector Software 3.1 Manual______________________ 4-3ThermoELECTRON CORPORATION

Sequence EditorIntroduction - Sequence Editor _________________________________ Multicollector Software 3.1
Menu BarThe Menu bar contains the application’s top level command menus. When no sequence is active, the menu bar only contains three items.
When a sequence is loaded or newly created the Menu bar is extended to include the commands Edit, Execute, Settings, and Window.
Sequence Menu
New Opens a blank document for creating a new sequence.
Open Opens an existing sequence file (<name>.seq). Existing sequence files can be edited and re-used.
Close Closes the current sequence file. If the file has been modified or is not yet saved, the software will ask the user whether or not the file should be saved.
Save Saves the current sequence file. If the current sequence has not been saved, the Save As dialog box opens.
Save As... Opens the dialog box Save As. After saving the file, the name of the sequence file appears in the title bar.
Print Print, Setup, and Display options.
Edit Menu
Delete Line(s), Copy Line(s), Paste Line(s)Moves or deletes one or more lines in the Sequence Table.
Filename PreferencesAllows the user to edit data file names. When the Autofill option is used, the software will automatically create datafile names for each sample type defined in the sequence table. The characters used in the file name are chosen according to what is defined in the Filename Preferences. The user is able to incorporate a number of characters from the Seq. Name (sequence name), Sample ID, Run Number, and Free Characters to be incorporated in the data file names. Moreover, the user can define the order of characters.
ThermoELECTRON CORPORATION4-4 ______________________ Multicollector Software 3.1 Manual ______________________

Sequence EditorMulticollector Software 3.1 ____________________________________ Introduction - Sequence Editor
In the following example, the filename will consist of the first 4 characters of the Seq. Name, the first character from the Sample ID, and the first 2 characters of the Run Number.
Execute Menu
Start, Stop, Resume, TerminateControl the running of a sequence, see section Tool Bar on page 4-6.
Reset Filament at EndIf this is checked, the filament currents will be set to zero at the end of the measurements independent of the settings in the corresponding method.
View Menu
View Preheater 1, View Preheater 2not implemented in version 3.1
View Filament HeatingIf this is selected, a new window is opened for editing the parameters of the filament heating sequence. Filament Heating is described in Chapter 3: Method Editor, section Filament Heating on page 3-20.
Display Data EvaluationThe Evaluation application will be opened.
Status Bar, Sample Bar/ Available Objects (Sample Type Bar)Toggles the menu bars on and off. If checked, the respective bar will be displayed.
Accessories, InformationShows/ hides the dockable windows. If checked, the respective window will be displayed.
______________________ Multicollector Software 3.1 Manual______________________ 4-5ThermoELECTRON CORPORATION

Sequence EditorIntroduction - Sequence Editor _________________________________ Multicollector Software 3.1
Settings Menu
Start Eval AutomaticallyIf this is checked, the Evaluation application is auto-matically started when a sequence run starts and data become available.
Reload Last File If checked, the Sequence Editor opens the most recently used sequence file when starting up.
Tool BarThe Tool bar contains a collection of shortcuts (tool icons). They provide quick access to frequently used commands. The Tool bar can be switched on or off (show or hide).
Opens a new empty sequence file.
Loads a saved sequence file.
Saves the newly created sequence .
Controls the running of a sequence:• Start - Go: starts the running of a sequence. It is only
active if all settings are correct. Otherwise, a error message is displayed in the Status bar.
• Stop/ Resume: pauses the running sequence. Pressing the icon again after a sequence was stopped will resume the run.
• Terminate: click to completely stop the sequence.
• Terminate Line: click to stop the currently running line. The sequence will proceed to the next line.
Opens the log viewer dialog window with the current log file(s), if any.
Opens the Data Evaluation application using the current data set
ThermoELECTRON CORPORATION4-6 ______________________ Multicollector Software 3.1 Manual ______________________

Sequence EditorMulticollector Software 3.1 ____________________________________ Introduction - Sequence Editor
Sample Type BarThe Sample Type bar can be used to enter the sample type in the Sequence table via drag&drop.
Status BarThe Status bar contains information related to the application running in this window. It can be switched on or off via the View menu.
Editor PaneAs soon as the user opens a previously saved sequence (or creates a new sequence), this area displays all input fields and information required to create or modify the method.
Type: SAMPLE
Type: BLANK (not used for Finnigan Triton!)
Type: STANDARD
______________________ Multicollector Software 3.1 Manual______________________ 4-7ThermoELECTRON CORPORATION

Sequence EditorIntroduction - Sequence Editor _________________________________ Multicollector Software 3.1
Dialog BarsAdditional information in the Sequence Editor can be displayed via the two dialog bars Accessories and Information. These bar contain different panels, which can be displayed and arranged as required by the user.
Accessories Dialog BarThe Accessories dialog bar allows the selection of two additional dialog windows:
• Application Start
• File Browser
The dialog windows can be switched on and off via the context menu of the Accessories dialog bar: open the context menu with a right mouse click in the accessories field and select Administrate Panels.
Figure 4-3. Sequence Editor - Administrate Panels Accessories
Note. The above dialog windows are described in detail in Accessories and Information Dialog Windows on page 2-6.
ThermoELECTRON CORPORATION4-8 ______________________ Multicollector Software 3.1 Manual ______________________

Sequence EditorMulticollector Software 3.1 ____________________________________ Introduction - Sequence Editor
Information Dialog BarThe Information dialog bar allows the selection of one additional panel:
• Info
The pane can be switched on and off via the context menu of the Information dialog bar: open the context menu with a right mouse click in the accessories field and select Administrate Panels.
Figure 4-4. Sequence Editor - Information Dialog
Note. The above dialog window Info is described in detail in Accessories and Information Dialog Windows on page 2-6.
______________________ Multicollector Software 3.1 Manual______________________ 4-9ThermoELECTRON CORPORATION

Sequence EditorIntroduction - Sequence Editor _________________________________ Multicollector Software 3.1
PanesThe Sequence Editor contains two panes:
• Header Data, and
• Sequence Table.
The order in which the samples, blanks, and/or standards are to be measured is determined in the Sequence Table.The Header Data contains general information on the run.
Figure 4-5. Sequence Editor - Panes
Header Data Sequence Table
ThermoELECTRON CORPORATION4-10 _____________________ Multicollector Software 3.1 Manual ______________________

Sequence EditorMulticollector Software 3.1 _______________________________________________ Sequence Table
4.2 Sequence Table To create a sequence, the user must define the order in which the filaments will be run and how the results of the measurement should be evaluated. This is done in the Sequence Table.
Columns in the Sequence TableThe sequence table consists of various columns that contain analytical parameters related to the measurements.
Run Number The sequence starts by default at line 1. The line number cannot be edited.
Sample Type The type is either SMP (sample) or STD (standard). A sample type must be designated when measuring delta values or C-factor, refer to Chapter 3: Method Editor.
Wheel Pos. The number of the filament’s position on the sample carousel.
Sample ID User’s sample identification, which is also used for the name of the data file.
Filename The name of the file in which the data are saved.
Figure 4-6. Sequence Editor - Sequence Table
Note. The sample type BLK (blank) has no analytical function for TIMS analysis on the Finnigan Triton.
Note. The filename can be entered manually by clicking and typing a name for each sample or it can be filled in automatically according to the Filename Preferences, refer to the Edit Menu on page 4-4.
______________________ Multicollector Software 3.1 Manual_____________________ 4-11ThermoELECTRON CORPORATION

Sequence EditorSequence Table____________________________________________ Multicollector Software 3.1
Standard Files Data files to be used when external normalization is required. These columns are only visible if a Sample Type was defined.
Description (comments)User can enter information on particular samples
Method File Name of the method file used for a measurement, refer to Chapter 3: Method Editor. Different samples within a sequence may use different methods.
Tune Parameter File containing the source lens tune parameters to be used for the measurement.
Status Allows the user to view and set the status of a particular sample. It is particularly useful when the data need to be re-evaluated after finishing the sequence. The status can be set to:Enable: sample will be analyzed and evaluated.Disable: sample will be skipped during the sequence measurement.Evaluate: the results of the analysis will be re-evaluated.
Re-Evaluation of Data already Acquired
The data generated during a sequence can be re-evaluated after the run is complete. These data are stored in a directory which is automatically created by the software once the sequence has started. If the data are re-evaluated, the software locates the data files in this particular directory and overwrites the old data files. If it is necessary to retain a copy of the older evaluated data, then copy all old data files (including the files with the “.TDT“ extension) to a new folder. Perform the re-evaluation using the original folder.
Note. If C-factor or delta value are made and different methods are used, the user must ensure that identical isotope ratios are defined in the method files.
Note. The user should not change the directory name of the sequence! This path is used to save all acquired data. If this name is changed, i.e. copied into another location, the software will not be able to locate the data files.
Note. Re-evaluation of the data via the Sequence Editor will only affect the calculation of the delta values or C-factors.
If it is necessary to re-evaluate measurements using modified interference or normalization corrections, outlier test or formulas, this must be done on each individual data file using the Method Editor.
ThermoELECTRON CORPORATION4-12 _____________________ Multicollector Software 3.1 Manual ______________________

Sequence EditorMulticollector Software 3.1 _______________________________________________ Sequence Table
Example: Setting up A SequenceThe following example describes how to set up a measurement sequence:
1. Enter the Sample Type: This can be done via drag&drop from the Sample Type bar into the empty field at the Sequence Table or by selecting the sample type from the drop-down list in the cell.
Autofill: Click on the Autofill symbol in the column header to select one sample type for the complete column.
Note. For most TIMS applications, no Sample Type must be defined and the field can be left blank. “Standard” and “Sample” are used for C-Factor and δelta value calculations.
The Blank type has no analytical meaning for TIMS analysis and should not be used.
If both Standard and Sample types are defined, the software will always report Delta values. To calculate ratios, the standard with known isotope ratios must be defined using the C-Factor in the Method Editor (refer to C-Factor on page 3-42). The same method may be used for both standard and sample measurements and the software will recognize which data file to use to calculate the C-Factor and which data file will be corrected using this C-Factor.
To determine a delta value for a particular sample, at least one standard has to be measured in the Sequence Editor. The result is expressed in permil (parts per thousand) using the delta notation
δ (‰) = [(IRSample - IRStandard) / IRStandard] x 1000
where IR is the isotope ratio.
Drag & Drop
or
Open Drop-downList to select type
______________________ Multicollector Software 3.1 Manual_____________________ 4-13ThermoELECTRON CORPORATION

Sequence EditorSequence Table____________________________________________ Multicollector Software 3.1
One can assign one or two standards to normalize each sample (using either δelta values or C-Factors). For example, one could assign one before the sample analysis, one after the sample analysis, or both, to check for any drifts in either sensitivity or mass bias. The sample may be normalized using the standard measured before and/or after the sample. When two standards are measured it will average both for normalization.
2. Enter the position number of the filament on the sample carousel: Click on Autofill symbol in the column header Wheel Position to automatically assign a position to the samples in the complete table.
3. Enter the Sample ID for the sample in the order that they will be analyzed: Click in the empty cell and type in the required identification.
Autofill: Click on the Autofill symbol in the cell header to automatically complete the column with the designations defined in the sample wheel calibration table.
4. Enter the File name:Click in a single cell to type in a filename, or use the Autofill feature of the software.
Autofill: To automatically fill in the file name, click on the Autofill symbol in the column header. The file name will be entered according to the Filename Preferences defined in the Edit menu.
5. Select the Method file to be used for acquisition and evaluation: Click on the folder icon in the required cell in the column Method File to open the file browser Select Method File From Directory. Select a file and confirm by clicking the OPEN button.
Autofill: To automatically fill in all fields of the Method file column with the same method, click on the folder icon in the and select the required file from the directory. The method name will be entered automatically.
Note. It is possible to use the same filament (same wheel position) in different lines in the Sequence. In this case, at the end of the first run, the filament currents are not automatically reset to zero. The analysis of the sample can be continued in the following run using a different method (including filament heating, isotope ratio measurement and data evaluation.
ThermoELECTRON CORPORATION4-14 _____________________ Multicollector Software 3.1 Manual ______________________

Sequence EditorMulticollector Software 3.1 _______________________________________________ Sequence Table
6. Enter the Tune Parameter file: Click on the folder icon in the requried cell in the column Tune Parameter and a file browser will open from which the appropriate tune parameter file can be selected.
Autofill: To automatically fill in all fields of the Tune Parameter column with the same file, click on the folder icon in the column header Tune Parameter. The files will be entered automatically.
7. Set the Status: Click on the respective Status cell and select the required item from the drop-down list. The default status is enable, which means the sample will be analyzed and evaluated according to the method file. When disable is selected, the sample will be skipped and the sequence will continue with the next sample with an “enable” status.
8. Enter a Sequence name and save the sequence (<name>.seq).
Note. The method file(s) are defined by clicking on the folder icon in the column header to select a new method for Autofill (same method for all runs). To define a new method for only one run, click in the respective cell and select a new method via the Browse option.
Note. If no tune parameter is selected, the sample will be measured using the source lens tune parameters active at the time the sequence was started.
Note. Without a sequence name, the sequence cannot be started. The software uses the sequence name together with the date to create a directory in which the data files of the sequence are stored.
Click to Select
______________________ Multicollector Software 3.1 Manual_____________________ 4-15ThermoELECTRON CORPORATION

Sequence EditorSequence Table____________________________________________ Multicollector Software 3.1
9. Click on Start-Go in the Tool bar to start the sequence. A window called Sequence Online Setting will pop up.
Sequence Online Settings
Online ASCII Export: When the option Online ASCII Export is selected (ticked), data files generated during a sequence will be automatically exported to an export file in ASCII format. The data that are exported are defined via the Report Parameter in the Method Editor, refer to Report Parameter on page 3-8.
Figure 4-7. Example: Complete Sequence
Figure 4-8. Sequence Online Settings
ThermoELECTRON CORPORATION4-16 _____________________ Multicollector Software 3.1 Manual ______________________

Sequence EditorMulticollector Software 3.1 _______________________________________________ Sequence Table
Online Print: When the option Online Print is selected, the results of the evaluation (refer to Chapter 5: Evaluation) are printed.
Both actions (export and print) are carried out following the analysis of each line of the sequence.
______________________ Multicollector Software 3.1 Manual_____________________ 4-17ThermoELECTRON CORPORATION


Chapter 5Evaluation
This chapter deals with the Evaluation application of the Multicollector Software Version 3.1 and contains the following sections:
• Introduction - Evaluation describes the function and basic commands of the application.
• Data Evaluation and Organization describes the operation of the Evaluation application with its different views.
______________________ Multicollector Software 3.1 Manual______________________ 5-1ThermoELECTRON CORPORATION

EvaluationIntroduction - Evaluation ______________________________________ Multicollector Software 3.1
5.1 Introduction - Evaluation The Evaluation application performs online evaluation as well as re-evaluation of stored data. This application displays and prints ion current intensities, isotope ratios, delta values, isotope dilution results, and formula calculations with descriptive statistics.
Data can be displayed in two independent dockable display areas and the user can choose between graphical display and numerical display.
Standard Bars and Commands
Note. To re-evaluate data using different evaluation parameters, for example including interference corrections and normalizing ratios, the data file must be first loaded into the Method Editor and then re-evaluated with the modified parameters.
Figure 5-1. Finnigan Triton Software - Evaluation Application
Double-Clickto Open
Double-click on the Evaluation icon to open the application. When it is first opened, no data file is loaded. By default, the window opens with two empty display panes.
ThermoELECTRON CORPORATION5-2 ______________________ Multicollector Software 3.1 Manual ______________________

EvaluationMulticollector Software 3.1 _________________________________________ Introduction - Evaluation
Title Bar The Title bar contains the name of the application (Data Evaluation) and the name of the current data file.
Menu BarThe Menu bar contains the application’s top level command menus.
File Menu
Open Opens a data file (<name>.dat).
Close Closes the current data file.
Print Configures printer access.
Exit Quits the Evaluation application.
Figure 5-2. Evaluation Application - Start Window (No Data Loaded)
Title Bar
Menu Bar
Dialog Bar
Dialog Window
Display Panes
Dialog Bar
Status Bar
(Information)
(Accessories)
Note. The Display Pane with the docking control will be discussed in a separate chapter. The following deals with the standard bars.
______________________ Multicollector Software 3.1 Manual______________________ 5-3ThermoELECTRON CORPORATION

EvaluationIntroduction - Evaluation ______________________________________ Multicollector Software 3.1
View Menu
Status Bar Toggles the status bar on and off.
Accessories, InformationToggles the dialog bars on and off.
Settings Menu
Start Online Evaluation AutomaticallyIf the Start Online Evaluation Automatically item is checked, the incoming (acquired) data will automatically be processed and evaluated. The Evaluation application searches for the corresponding online date file, whenever a measurement is started from the Method Editor or Sequence Editor. If a valid data file is found, the data will be displayed after a first full cycle is completed.
Deadtime ParameterThe Deadtime Parameters can be entered in the dialog window called Deadtime Parameter, refer to section Deadtime Parameter on page 5-5.
Status BarThe Status bar contains information related to the application running in this window. It can be switched on or off, see View Menu.
ThermoELECTRON CORPORATION5-4 ______________________ Multicollector Software 3.1 Manual ______________________

EvaluationMulticollector Software 3.1 _________________________________________ Introduction - Evaluation
Deadtime ParameterThe Deadtime Parameters can be entered in the dialog window Deadtime Parameter, which can be opened via the Settings menu.
Deadtime CorrectionThe software incorporates an effective Deadtime Correction. It considers the electronic deadtime and the characteristics of the individual SEM.
Deadtime correction is necessary because of the frequency limit at which signals from the SEM can be processed by the electronics of the ion counting system. The output pulse of the SEM is detected and amplified on the pulse amplifier board, which is directly connected to the output of the SEM. Whenever the output signal from SEM is higher than a pre-set discriminator level (typically 3 mV), the pulse amplifier produces a digital pulse of about 1.5 V, which goes into the pulse counting electronics of the instrument.
The electronics have a certain deadtime: that is an interval during which they are unable to process additional incoming signals. If a signal from the SEM is detected, the pulse amplifier needs about 20 ns to output the processed digital pulse. During this time, it is not ready to accept another pulse separated by less than 20 ns time (i.e. 20 ns deadtime). With increasing count rates, the probability increases of the appearance of two adjacent ion pulses separated by less than 20 ns. As a consequence, the second pulse is rejected and the measured count rate is smaller than the true count rate. However, this effect can be properly corrected using a standard deadtime correction formula. The electronic deadtime is typically set to 20 ns (70 ns for the miniaturized ion counters) and is set on the electronic pulse amplifier board.
Note. Usually, the Deadtime Parameters have been determined during the installation of the instrument and there is no need to change them.
Note. This correction applies only to data measured by ion counters and not to data measured by Faraday detectors.
______________________ Multicollector Software 3.1 Manual______________________ 5-5ThermoELECTRON CORPORATION

EvaluationIntroduction - Evaluation ______________________________________ Multicollector Software 3.1
In addition to this electronic deadtime correction, there are effects related to the individual characteristics of the SEM itself. Based on empirical data, one can deduce a more elaborated deadtime correction algorithm, which also considers two more parameters to correct for non-linearity of the SEM itself. These two parameters are the Base Frequency and the Deadtime Factor.
Base FrequencyThe Base Frequency is the count rate above which the non-linearity effects specific for one individual SEM appear and hence a linearity correction in addition to the electronic deadtime correction is needed. A typical value for the Base Frequency is between 50 000 and 100000 cps.
FactorThe Deadtime Factor accounts for the non-linearity of the SEM when the count rate exceeds the Base Frequency. A typical value for the Deadtime Factor ranges from 0.002 to 0.007.
The Base Frequency and the Deadtime Factor need to be measured during the linearity calibration of the SEM. Usually, this is done once as these correction factors are stable over the lifetime of the SEM3.
Deadtime FormulaIf the user wants to use a different Deadtime Formula, this can be entered in the Formula column. Under normal operating conditions, however, this is not needed.
Variables in the Deadtime Formula can include:TD = DeadTime CPS= Measured intensities in cpsBF = Base FrequencyM = FactorPI = Constant π (3.1415927)
General Formula for Deadtime Correction:
Ccorrected = Cmeasured / (1-Cmeasured * TD)
If the measured counts per second exceed the Base Frequency, a correction for the non-linearity of the SEM comes into play:
Ccorrected = [Cmeasured / (1-Cmeasured * TD)] * (1 + M*(log (BF) - log (CPS)))
electronic deadtime accounts for the effects non-linearity of the SEM
3For more information refer to Richter et al. (2001) [S. Richter, S.A. Goldberg,P.B. Mason, A.J. Traina, and J.B. Schwieters (2001) Linearity Tests for Second-ary Electron Multipliers Used in Isotope Ratio Mass Spectrometry, InternationalJournal of Mass Spectrometry, 206, 105-127]
ThermoELECTRON CORPORATION5-6 ______________________ Multicollector Software 3.1 Manual ______________________

EvaluationMulticollector Software 3.1 _________________________________________ Introduction - Evaluation
Dialog BarsAdditional information in the Evaluation application can be displayed via the dialog bars Accessories and Information. These bars contain different panels, which can be displayed at the same time and arranged as required by the user.
Accessories Dialog BarThe Accessories dialog bar allows the selection of two additional panels:
• Application Start and
• File Browser
The two windows can be switched on and off via the View menu or via the context menu of the Accessories dialog bar: open the context menu with a right mouse click in the accessories field and select Administrative Panels.
Figure 5-3. Evaluation Editor - Administrative Panels Accessories
Note. The above dialog windows are described in detail in Accessories and Information Dialog Windows on page 2-6.
______________________ Multicollector Software 3.1 Manual______________________ 5-7ThermoELECTRON CORPORATION

EvaluationIntroduction - Evaluation ______________________________________ Multicollector Software 3.1
Information Dialog BarThe Information dialog bar allows the selection of one additional panel:
• Info
The windows can be switched on and off via the View menu or via the context menu of the Information dialog bar: open the context menu with a right mouse click in the information field and select Administrative Panels.
Figure 5-4. Evaluation Editor - Information Panels Accessories
Note. The above dialog windows are described in detail in Accessories and Information Dialog Windows on page 2-6.
ThermoELECTRON CORPORATION5-8 ______________________ Multicollector Software 3.1 Manual ______________________

EvaluationMulticollector Software 3.1 _________________________________________ Introduction - Evaluation
Display Panes The evaluation data are displayed in the Display pane.
The Display pane consists of four control bar section sections and the displayed pane itself, where data are evaluated according to the settings chosen by the user.
Navigation Bars
Select Data Evaluation and Organization
Figure 5-5. Display Panes Control and Navigation Bars
Navigation BarsData Evaluation and Organization View Control
Online EvaluationPrint + Export data
Navigation bar for Block Control. The buttons are used to switch between the blocks, refer to Block View (B) on page 5-22.
Navigation bar for Cycle Control.The buttons are used to switch between the cycles, refer to Data View (D) on page 5-23.
Control bar for Data Evaluation. The buttons are used to select the required evaluation mode, refer to Data Evaluation on page 5-18.
Control bar for Data Organization. The buttons are used to select the required view of the data, refer to Data Organization on page 5-20.
______________________ Multicollector Software 3.1 Manual______________________ 5-9ThermoELECTRON CORPORATION

EvaluationIntroduction - Evaluation ______________________________________ Multicollector Software 3.1
Select View Control
Miscellaneous Control
Control bar for Graphical View and Numerical View respectively, refer to View Control on page 5-11.
Miscellaneous Controls for online evaluation, print, data export, default layout settings, and opening the Method Editor.
ThermoELECTRON CORPORATION5-10 _____________________ Multicollector Software 3.1 Manual ______________________

EvaluationMulticollector Software 3.1 _________________________________ Data Evaluation and Organization
5.2 Data Evaluation and Organization
View Control View control allows the user to display the data either numerical or graphically and to configure how the data are displayed.
View Control Icons
Note. For a better understanding, the view control icons and settings are explained before describing the evaluation parameters and options.
Note. Some buttons are only available in the graphical view and some are only available in the numerical view!
Use the View Parameter icon to choose how the data are evaluated.
Click on the Grid view icon to display the numerical representation of the data.
Click on the Graphics icon to display the data graphically.
Di shows the measured (numeric) datai shows the information section, refer to
Information Section on page 5-12σ shows the statistical section, refer to
Statistical Section on page 5-12These icons are only enabled for Grid View.
Log display sets the vertical axis to logarithmic scale. Logarithmic display is only possible if the (zoomed) y-axis values are >0. Negative and zero values bring up an error message.
Zoom Options (left to right):Zoom backgoes back to the previous zoomX-Zoom zooms the x-axis Y-Zoom zooms the y-axisX and Y Zoom are combined by selecting the area with the left mouse button. Drag to desired zoom area.
Lg and Zoom are only enabled for Graphical View.
______________________ Multicollector Software 3.1 Manual_____________________ 5-11ThermoELECTRON CORPORATION

EvaluationData Evaluation and Organization _______________________________ Multicollector Software 3.1
Information Section
The Information Section contains several rows displaying the cups used, acquisition and evaluation information, and Blank and Standard information. When a standard-sample bracketing sequence is made, the information section contains additional lines (one for blanks and/or one for standards) displaying the mean data of blanks and/or standard measurements used for correction and/or normalization.
Info Line
The last line in the information section is the Info Line. It contains abbreviated information concerning the evaluation itself.
Statistical Section
The Statistical Section contains mean values, absolute and relative standard errors and deviations and the number of valid values.
Valid values are the total number of data points required minus the outliers (red) and the invalid values (blue).
Only valid values are included in the calculation of the statistics.
Small abbreviations are intensity related:
t Deadtime corrected (ion counting only)
b Baseline/ darknoise corrected
d Darknoise corrected
g Amplifier gain/ yield corrected
y Amplifier yield corrected
c Display in counts instead of volts(ion counting only)
Capitalized abbreviations are ratio related
O outlier correction performed:
St Static Evaluation
Dy Dynamic Evaluation
N Ratio is fractionation corrected (normalized)
I1...In Ratio is interference corrected
Note. The Ext. Err calculation is not implemented in this version of the software.
ThermoELECTRON CORPORATION5-12 _____________________ Multicollector Software 3.1 Manual ______________________

EvaluationMulticollector Software 3.1 _________________________________ Data Evaluation and Organization
Context Menus Graphical/ Numerical View
Context Menu Grid/ Numerical View
Context Menu Graphical View
Note. To call up the context menu, click in the grid or graphical display with the right mouse button.
Columns Click to open the View Configuration parameters, also refer to View Parameters on page 5-14.
Fit Cells to Grid/ Fit Cells to TextSelect to shrink or enlarge cells, if required.
Calculate Click to re-evaluated a selection of cells, also refer to Statistics on Selected Data on page 5-24.
Font Click to change the font of the grid layout.
Print Click to open printer options and to print the grid.
Export Select the respective format from the list with a left mouse click. A Save As dialog box opens and the file can be saved in the required directory.
Note. To call up the context menu, click in the grid or graphical display with the right mouse button.
Traces Click to open the View Configuration parameters, also refer to View Parameters on page 5-14.
Hide Toolbar Click to hide/show the docking controls (navigation bar, view control , etc.).
Autosize Click to adjust the display to full plot.
______________________ Multicollector Software 3.1 Manual_____________________ 5-13ThermoELECTRON CORPORATION

EvaluationData Evaluation and Organization _______________________________ Multicollector Software 3.1
View Parameters The View Parameter tool is accessible from both Grid Display (numerical view) and Graphical Display.
In the Parameters window specific corrections can be switched on and off and an immediate recalculation of the data is performed. This is useful if the user wants to analyze or export data with only specific corrections enabled.
Calculation Parameters
Deadtime Deadtime correction of ion counting signals can be switched on and off. By default, all ion counting signals are deadtime corrected. Deadtime parameters can be changed via the Settings menu, refer to Deadtime Parameter on page 5-5.
Click on the View Configuration icon to open the Parameters dialog window.
Figure 5-6. View Parameters
Note. The Correction Parameters are only listed if Blank and Standard Lines have been included in the Sequence.
Note. Parameters will be exported according to the configuration specified in the Parameter list.
ThermoELECTRON CORPORATION5-14 _____________________ Multicollector Software 3.1 Manual ______________________

EvaluationMulticollector Software 3.1 _________________________________ Data Evaluation and Organization
Baseline/ Darknoise Using the check boxes, baseline (Faraday cups) and darknoise (ion counters) correction can be switched on and off. By default, all signals are baseline and darknoise corrected.
Gain/ Yield By default, all gain calibration factors (Faraday detectors) and the yield factors (ion counters) are applied to ensure proper cross calibration of the detectors. The user can choose to bypass these corrections by deselecting the check box. The data are automatically recalculated with or without gain and yield factors, as selected.
Correction Parameters
Standard1, Standard2Data that have been acquired within a sequence (refer to Chapter 4: Sequence Editor) may be evaluated with or without Standard Normalization. The user can select to calculate the isotope composition of the sample using all, none, or only some of the available standard measurements. The assignment of standard measurements is done using the Sequence Editor.
View ConfigurationThe display can be configured to show all or only one selected portion of the acquired data. All ratios and intensities, which are defined within the Method Editor can be selected.
To open the View Configuration pane, click in the data/ graphics display with the right mouse button to call up the Context menu, refer to Context Menus Graphical/ Numerical View on page 5-13. Select Columns or Traces respectively:
Note. The sample type BLK (blank) has no analytical function for TIMS analysis on the Finnigan Triton.
Note. The View Configuration can be defined within the Method Editor prior to the start of an acquisition, refer to Report Parameter on page 3-8.
______________________ Multicollector Software 3.1 Manual_____________________ 5-15ThermoELECTRON CORPORATION

EvaluationData Evaluation and Organization _______________________________ Multicollector Software 3.1
The left pane (view parameter) lists the data which are displayed both in Grid View and in Graphical View. The right pane (graphical parameter) allows to determine how the data are plotted in the graphical view.
View Parameter
To choose a value, select the respective check box with a left mouse click in the check box.
Measured Data To view the intensities of each measured isotope, check the box located next to the particular species. By default, the intensity of the center cup is displayed.
The selected view cab be saved as default by clicking the Save as default button.
The acquired parameters will then be displayed according to the default view saved in the application.
ThermoELECTRON CORPORATION5-16 _____________________ Multicollector Software 3.1 Manual ______________________

EvaluationMulticollector Software 3.1 _________________________________ Data Evaluation and Organization
Ratios To view the isotope ratios defined in the associated method file, check the box located next to the particular ratio. The ratios include multidynamic ratios and delta values. Any number of such data specified in the Method Editor may be viewed in the report. Isotope ratios calculated using the C-Factor can also be displayed.
Filament To display the filament currents in the evaporation and ionization filaments, check the box located next to the particular item. If a pyrometer is available, the filament temperature can also be displayed.
Graphics Parameter
The Graphics Parameter field shows the labels, line styles, and colors of the traces that are plotted in the Graphical View. Colors and Line parameters can be set for each trace via the drop-down combo boxes.
Statistics: Enabled/ Disabled
• For Run Number View (RN) this means that all individual data (cycles) are displayed including the mean and Std Dev of all data.
• For Run Block View (RB) this means that all block means are displayed including the mean and Std Dev of all blocks.
• For Block View (B) this means that all cycles of one particular block are displayed including the mean and Std Dev of that particular block.
Additional Parameter
If the view configuration window was opened via the context menu item Traces in the graphical view, the following parameter can also be found:
Plot Background used to set the background color of the plot area via the dotted button.
Plot Limits used for fine-tuning the zoom of the plot area.
If the list box item Enabled is selected in the Graphical Parameter pane the data will be displayed including the mean and Std Dev.
______________________ Multicollector Software 3.1 Manual_____________________ 5-17ThermoELECTRON CORPORATION

EvaluationData Evaluation and Organization _______________________________ Multicollector Software 3.1
Data EvaluationData can be evaluated in static, dynamic, and multi-dynamic mode. The selection of the appropriate evaluation mode is critical.
The respective mode can be selected via the buttons in the Display pane Control bar, see Figure 5-5.
Static Evaluation (St)
Dynamic Evaluation (Dy)
Total Evaporation (TE)
Note. If both static and dynamic ratios must be calculated, select the Dynamic Evaluation mode!
Static Evaluation evaluates data acquired in static mode.The static evaluation mode should be chosen for methods containing only one line per cycle such that isotopic ion currents were measured simultaneously.
Note. In a static evaluation, no drift corrections are made.
Dynamic Evaluation evaluates data in dynamic mode.A quadratic drift correction is applied to the ion currents in the isotope ratio that were measured at different times, i.e. different lines in the Cup Configuration Table, refer to Chapter 3: Method Editor.
Note. If ratios were measured simultaneously, no drift correction is applied in the Dynamic Evaluation mode.
In Total Evaporation mode, the signal intensities are integrated and the isotope ratios are calculated from the integrated intensities. There are no statistics calculated for a Total Evaporation measurement.
ThermoELECTRON CORPORATION5-18 _____________________ Multicollector Software 3.1 Manual ______________________

EvaluationMulticollector Software 3.1 _________________________________ Data Evaluation and Organization
Multidynamic Evaluation (MD)
Multidynamic Evaluation evaluates the data acquired in multi-dynamic mode. It supports the special algorithms for Sr and Nd measurements, refer to Chapter 3: Method Editor.
Note. The Multi-Dynamic Evaluation (MD) mode is enabled by first selecting the Static Evaluation mode (St) then the MD mode.
______________________ Multicollector Software 3.1 Manual_____________________ 5-19ThermoELECTRON CORPORATION

EvaluationData Evaluation and Organization _______________________________ Multicollector Software 3.1
Data Organization Data can be evaluated in Run Block view, Run Number view, Block view and Data view.
The respective views are selected via the buttons in the Display pane Control bar, see Figure 5-5.
Run Block View (RB)
For detailed information about blocks, double-click in the row or click the button B to switch to Block View.
The Run Block view shows the mean value(s) for every block and the statistics of the total blocks measured. Entries in red are outliers. Entries in blue are invalid data points.
Note. Invalid data points are not counted as valid values and are not included in statistical calculations. A data point may be invalid for example because normalization could not be calculated because the normalizing ratios has not yet been measured.
Additionally, in a dynamic measurement, a ratio may be invalid because a drift correction could not be applied.
Figure 5-7. Evaluation Application - Run Block View
ThermoELECTRON CORPORATION5-20 _____________________ Multicollector Software 3.1 Manual ______________________
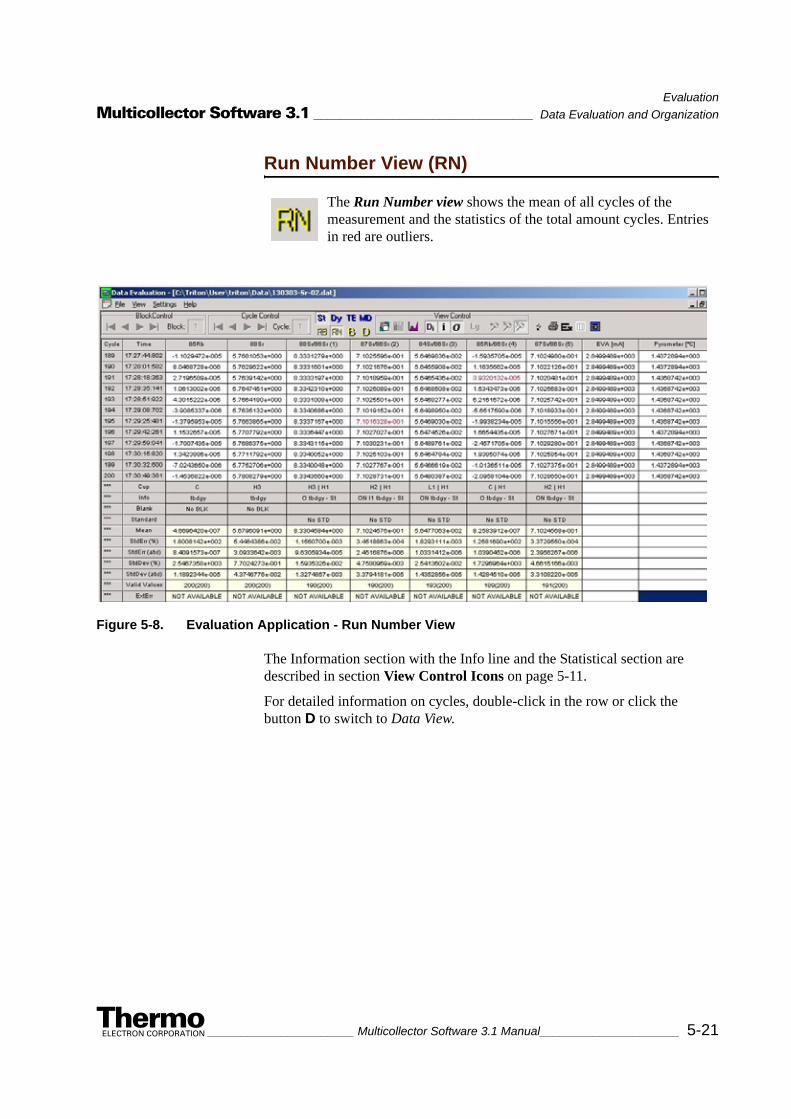
EvaluationMulticollector Software 3.1 _________________________________ Data Evaluation and Organization
Run Number View (RN)
The Information section with the Info line and the Statistical section are described in section View Control Icons on page 5-11.
For detailed information on cycles, double-click in the row or click the button D to switch to Data View.
The Run Number view shows the mean of all cycles of the measurement and the statistics of the total amount cycles. Entries in red are outliers.
Figure 5-8. Evaluation Application - Run Number View
______________________ Multicollector Software 3.1 Manual_____________________ 5-21ThermoELECTRON CORPORATION

EvaluationData Evaluation and Organization _______________________________ Multicollector Software 3.1
Block View (B)
Block Control Button
Information Section The Information Section contains information about baseline, gain, amplifier, and cups, refer to View Control on page 5-11.
Statistical Section The mean value in the Statistical Section is the mean of one particular block.
For a detailed view of the data within a block, double-click in the row or click the button D to switch to Data View.
The Block view shows all cycles of one particular block and the statistics of this block. Entries in red are outliers.
Figure 5-9. Evaluation Application - Block View
Use the Block Control button in the Navi-gation bar to switch between the blocks.
ThermoELECTRON CORPORATION5-22 _____________________ Multicollector Software 3.1 Manual ______________________

EvaluationMulticollector Software 3.1 _________________________________ Data Evaluation and Organization
Data View (D)
If the cycle consists of several integrations, the statistics are calculated for these integrations and a separate outlier test can be done on each set of integration within a cycle.
Example
It is possible within the Method Editor to subdivide a cycle of 4 s integration time into 40 integrations of 0.1 s each. Within the Data view, the user could view each individual integration. If an outlier test on integrations is selected within the Method Editor, the integrations within every single cycle will be adjusted for outliers. This mode may be useful for the measurement of very small signals when the detector noise is the limiting factor and the data need to be filtered carefully for outliers. However, the data file may grow rapidly if many short integration cycles are used.
Block Control/ Cycle ControlWith the Block Control and Cycle Control buttons, the user can switch between single blocks and cycles.
Statistical Section The mean value in the Statistical Section corresponds to the value of one cycle. If the cycle consists of only one integration, then no statistics are calculated.
The Data view shows the data over one cycle.
Figure 5-10. Evaluation Application - Data View
______________________ Multicollector Software 3.1 Manual_____________________ 5-23ThermoELECTRON CORPORATION

EvaluationData Evaluation and Organization _______________________________ Multicollector Software 3.1
Statistics on Selected DataIt is possible to calculate statistics on a selected set of data, either in one column or across several columns. This feature is useful for time resolved analysis of the data. The user may deselect certain data, such as outliers, from the marked data range as well.
In any view you can select one or more data cells, i.e. Cycles or Block Means:
1. Highlight the selected data cells by pressing the left mouse button and dragging it over the cells. .
2. Select several data ranges while pressing the <CTRL> key.If you click on the marked cells again using the left mouse button, the respective cells will become unmarked.
3. When all data of interest have been marked, click in the selected area once with the right mouse button.
4. A dialog box appears. Click on Calculate and a dialog containing descriptive statistics for the selected cells will pop up.
These statistical data can also be exported.
Figure 5-11. Evaluation - Calculate Data Cell
Note. If requested, the data will be exported according to the view configuration specified in the Parameter list.
ThermoELECTRON CORPORATION5-24 _____________________ Multicollector Software 3.1 Manual ______________________

EvaluationMulticollector Software 3.1 _________________________________ Data Evaluation and Organization
Online Evaluation
To deselect the online evaluation, click on the button. During Online Evaluation, the lightning icon is yellow.
When Online Evaluation is active, data are processed immediately after they are acquired. Thus, the user is able to see the latest results of the measurement.
Export
Click on the Online Evaluation button to activate Online Evaluation. This option can also be selected via the Menu bar, refer to Settings Menu on page 5-4.
Click on the printer button to open the Print Configuration dialog box..
Note. To identify those values which are designated as outliers or invalid values, it is recommended to select the Marked option.
The default setting is Marked: all outliers are labeled with an X.
Choosing the Empty Cell option button prints the data without the outliers (leave the cell empty).
Click on the Export button the open the Export Dialog box. This feature allows the export of data in numerical format to an ASCII text file <name.exp>.
______________________ Multicollector Software 3.1 Manual_____________________ 5-25ThermoELECTRON CORPORATION

EvaluationData Evaluation and Organization _______________________________ Multicollector Software 3.1
Full Export Activating the Full Export check box saves the data in block structure. If the run is set up with 10 blocks, the Full Export file will list all data of the 10 blocks including the block means and the statistics of the block means.
If the Full Export check box is not ticked, the data will be exported as shown in the numerical display of Evaluation.
Header Checking the Header check box adds a header to the exported data that contains information about the measurement, for example name data file, date and time of analysis.
Time in Seconds The Time in Seconds value is the number of seconds that have elapsed since midnight, January 1, 1970, coordinated universal time, according to system clock. This feature is implemented to support a time format that can be interpreted by spreadsheet programs. For some applications, like drift correction or other time resolved measurements, a precise timescale may be important.
After all export parameters have been selected, click OK and a second window will open asking under which name to save the export file.
Default Layout
The user can select a Full Export of the displayed data, the inclusion of a descriptive Header, and the Time in Seconds (instead of hour - minute - second format).
The handling of Invalid Values is similar to that in the Print Configuration dialog.
Click to open or save default layout for the columns or traces.
The user can change the layout of the data display via the context menu, refer to Context Menus Graphical/ Numerical View on page 5-13 and save the layout as default via the Save as Button. Alternatively, the layout can be saved via the Save Default Layout item.
ThermoELECTRON CORPORATION5-26 _____________________ Multicollector Software 3.1 Manual ______________________

EvaluationMulticollector Software 3.1 _________________________________ Data Evaluation and Organization
To load the default layout click on Load Default Layout.
When the item Use Default Layout is ticked, the selected layout is applied every time the data file is opened. When the item is not ticked, the data file will use the layout as defined in the Method Editor, refer to Report Parameter on page 3-8.
Method Editor
If this button is clicked, the Method Editor is opened with the current method.
______________________ Multicollector Software 3.1 Manual_____________________ 5-27ThermoELECTRON CORPORATION


Chapter 6Executive
This chapter deals with the Executive application of the Multicollector Software Version 3.1 and is divided into the following sections:
• Introduction - Executive gives an overview of the user interface and describes how to access the features.
• System Table describes the System Table and its function
• Dialog Panes describes the dialog panes Collector, Channeltron, Amplifier, and History.
• Mass Calibration takes a look at the most important feature of the Executive application
• Log Files describes the Log File pane and its options
______________________ Multicollector Software 3.1 Manual______________________ 6-1ThermoELECTRON CORPORATION

ExecutiveIntroduction - Executive ______________________________________ Multicollector Software 3.1
6.1 Introduction - ExecutiveThe Executive application gives access to basic hardware parameters and the configuration of the instrument. It is similar to a database, which stores the actual system configuration and calibrations, and displays some logfiles.
The Executive application displays and allows the modification of system parameters, such as :
• Mass calibration,
• Amplifier configuration,
• System table,
• Baseline and gain history,
• Collector configuration, and
• Log files display.
Figure 6-1. Finnigan Triton Software - Sequence Editor Application
Double-Click to Open
ThermoELECTRON CORPORATION6-2 ______________________ Multicollector Software 3.1 Manual ______________________
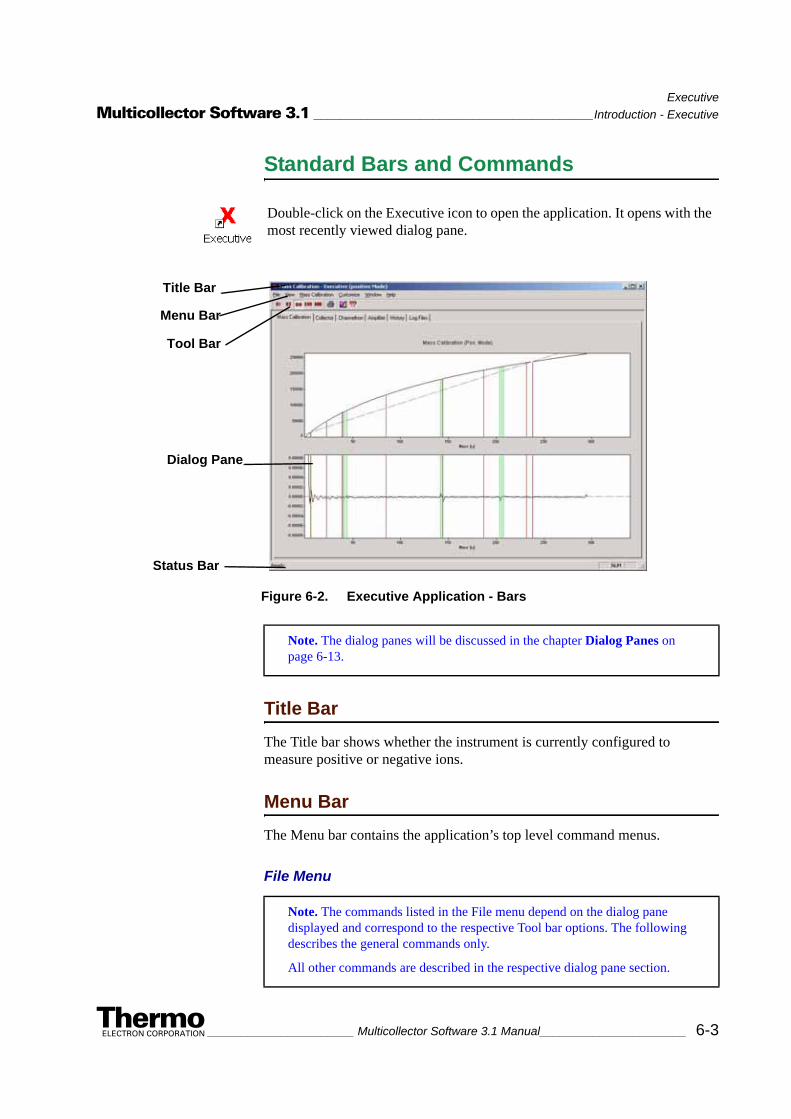
ExecutiveMulticollector Software 3.1 __________________________________________Introduction - Executive
Standard Bars and Commands
Title Bar The Title bar shows whether the instrument is currently configured to measure positive or negative ions.
Menu BarThe Menu bar contains the application’s top level command menus.
File Menu
Double-click on the Executive icon to open the application. It opens with the most recently viewed dialog pane.
Figure 6-2. Executive Application - Bars
Title Bar
Menu Bar
Tool Bar
Dialog Pane
Status Bar
Note. The dialog panes will be discussed in the chapter Dialog Panes on page 6-13.
Note. The commands listed in the File menu depend on the dialog pane displayed and correspond to the respective Tool bar options. The following describes the general commands only.
All other commands are described in the respective dialog pane section.
______________________ Multicollector Software 3.1 Manual______________________ 6-3ThermoELECTRON CORPORATION

ExecutiveIntroduction - Executive ______________________________________ Multicollector Software 3.1
Exit all Triton Applications..All opened applications can be closed and exited via the Exit all Triton Applications... command. After selecting this command, a dialog box appears asking the user to confirm the exit before closing the program.
Exit The Executive application can be exited via the Exit command.
View Menu
Tool Bar, Status BarToggles the menu bars on and off. If checked, the respective bar will be displayed.
Customize
Data Directory, Method Directory, Sequence DirectoryAllows the user to select the default directory for storing data, method, and sequence files.Enter the directory path directly or search the location using the Browse button.
System Table... Opens the System Table dialog box, refer to System Table on page 6-7.
Note. All directory paths in the Executive application point to existing directories only. You cannot create new directories using this tool. To create new directories, first use the Windows Explorer.
ThermoELECTRON CORPORATION6-4 ______________________ Multicollector Software 3.1 Manual ______________________

ExecutiveMulticollector Software 3.1 __________________________________________Introduction - Executive
Edit Colors... Opens the Color Custom Template dialog box where the color settings for the Faraday cups and ion counters and their traces in the chart recorder, peak and mass scan can be defined.
Log Files... Allows the selection of log file settings, refer to section Log Files on page 6-24.
Click Set Color to Object to apply selected color to object.
Note. Log files are often useful diagnostic tools. In this case, it is important to make sure that you have enough space available on the hard disk. In particular LAN logging (in the Diagnostic application) can occupy a significant amount of disk space.
Color for Echo (previous) traces of a Faraday cup or an ion counter
Color for Faraday cupsand ion counters
Colors used during Peak Center
______________________ Multicollector Software 3.1 Manual______________________ 6-5ThermoELECTRON CORPORATION

ExecutiveIntroduction - Executive ______________________________________ Multicollector Software 3.1
MIC Reset The total number of counts detected on the ion counters are displayed and can be edited.
Tool BarsThe Tool bars change according to the dialog selected. In all cases, however, the system table icon appears. Clicking this icon will open the system table, refer to System Table on page 6-7.
Status BarThe Status bar contains information related to the application running in this window. It can be switched on or off via the View menu.
ThermoELECTRON CORPORATION6-6 ______________________ Multicollector Software 3.1 Manual ______________________

ExecutiveMulticollector Software 3.1 _________________________________________________ System Table
6.2 System TableThe System Table contains the actual hardware configuration and allows the modification of the system hardware configuration and the system parameters.
The System Table contains two lists:
• System Parameter list
• User Parameter list
It can be opened via the System Table icon in the Tool bar or via Customize>System Table....
Figure 6-3. Executive Application - System Table
______________________ Multicollector Software 3.1 Manual______________________ 6-7ThermoELECTRON CORPORATION

ExecutiveSystem Table______________________________________________ Multicollector Software 3.1
System Parameter ListThe System Parameter list contains information about the installed instrument hardware, including the number and type of installed detectors (Faraday cups and ion counters). The system parameters describe the instrument configuration and are valid for and may be edited by all users.
Installed HardwareA double-click on the item Installed Hardware will display hardware components available for selection. When components are installed and need to be initiated, check the corresponding field.
Amplifier BoxIn the lower part of the System Parameter list, a box with all amplifiers installed in the instrument is displayed.
If the amplifier number appears red, the current amplifier is already connected to a particular Faraday cup. If the number appears green, the amplifier is available for use and can be connected to any Faraday cup.
Note. Changing these parameters affect fundamental instrument operation.
Note. The Installed Hardware parameters should be edited by Authorized Personnel only.
Figure 6-4. System Table - Installed Hardware List
Pyrometer is installed (Yes is ticked)
ThermoELECTRON CORPORATION6-8 ______________________ Multicollector Software 3.1 Manual ______________________

ExecutiveMulticollector Software 3.1 _________________________________________________ System Table
The ion current amplifier system is connected through a relay network to the Faraday cups in the variable multicollector. By means of the relay network, the user is free to define any connection scheme of the current amplifiers to the Faraday cups. This may be useful for some diagnostic purposes or if one amplifier exhibits poor performance and needs to be exchanged.
Changing the Amplifier
If the user wants to exchange one current amplifier with another on a given Faraday cup, the following steps are necessary:
1. Click on the required detector position in the parameter list and delete the amplifier that is currently connected using the <Delete> key.The amplifier will disappear from the detector position and the amplifier number in the amplifier box will turn green.
2. Drag&drop a free amplifier number (green) from the amplifier box to the empty detector position in the parameter list.
Figure 6-5. System Table - Amplifier Box
Note. All instruments are equipped with ten Faraday cup amplifiers. Therefore, depending on the number of installed Faraday cup detectors, one to three amplifiers are available for assignment.
All amplifiers areavailable for use(green)
Drag
Drop
______________________ Multicollector Software 3.1 Manual______________________ 6-9ThermoELECTRON CORPORATION

ExecutiveSystem Table______________________________________________ Multicollector Software 3.1
This will connect the amplifier to this particular Faraday cup and the amplifier number becomes red again, indicating that this amplifier is in use.
3. Click OK.
A dialog box will ask if the System Table should be updated with the new settings. Click Yes to accept changes. Click No to keep the original configuration. Another dialog box will prompt the user to close all applications.
4. Restart the system to load the new configuration by opening the Acquisition program (refer to Acquisition on page 1-6).
5. Perform a gain calibration using the new configuration, refer to Detector Calibration on page 2-47.
Channeltron BoxA box with all ion counting channels supported by the system is displayed in the bottom part of the System Parameter list, .
Integrating the Channeltron
The Channeltron are normally attached on the sides of the Faraday cups. Thus, the Faraday cup plus the attached ion counters are installed on the same adjustable detector platform and can be moved as a package along the focal plane of the mass spectrometer. This method has the advantage that the ion counting channels can be installed in addition to the Faraday cups and no Faraday cup is given up for an ion counting channel.
The user can enter the new configuration in the System Table by dragging a free Channeltron number from the Channeltron box to the desired detector position, similar as described in Changing the Amplifier on page 6-9. It can be dropped on either side of the Faraday cup. The side on which the ion
Note. Wait until the connection (Acquisition Icon in the Task bar, refer to Acquisition on page 1-6) has been terminated before proceeding to the next step.
Figure 6-6. System Table - Channeltron Box
Note. IC1 is normally assigned to the Secondary Electron Multiplier (if available).
ThermoELECTRON CORPORATION6-10 _____________________ Multicollector Software 3.1 Manual ______________________

ExecutiveMulticollector Software 3.1 _________________________________________________ System Table
counter is attached is indicated by a red arrow, as shown in the figure below. It is also possible to attach more than one Channeltron to each side of the Faraday cup.
The configuration of the mass spectrometer can be updated any time, when the hardware is added (for example an RPQ or one or more ion counting detectors) or existing hardware is modified.
Updating to a new version of the software does not change the System Tables. All tables and parameters remain valid and unchanged.
Note. Make sure to place the Channeltron on the correct high or low mass side of the Faraday cup so that it corresponds to the actual configuration in the instrument.
Note. Normally, the system parameters contents only needs to be changed when the hardware configuration changes.
Field service engineers perform such changes and update the system table.
The software is dependent on the system table. There is no cross check as to whether the hardware is really installed or not. Errors in the system table, in particular in the system parameter list may result in error messages if the hardware is not present.
Drag
Drop
______________________ Multicollector Software 3.1 Manual_____________________ 6-11ThermoELECTRON CORPORATION

ExecutiveSystem Table______________________________________________ Multicollector Software 3.1
User Parameter ListThe selection of positive or negative ion analysis is done via the Polarity entry in the User Parameter list.
To switch the instrument from one mode to another, proceed as follows:
1. Click on the item Polarity to call up the two modes. Select the desired polarity and confirm with Ok.
A dialog box will ask if the System Table should be updated with the new settings. Click Yes to accept changes. Click No to keep the original configuration. Another dialog box will prompt the user to close all applications.
2. Restart the system to load the new configuration by opening the Acquisition program (refer to Acquisition on page 1-6).
3. Perform a gain calibration using the new configuration, refer to Detector Calibration on page 2-47.
Figure 6-7. System Table (Detail)
Note. Separate mass calibration, amplifier, channeltron and history tables are maintained for positive and negative modes.
Note. Wait until the connection (Acquisition Icon in the Task bar, refer to Acquisition on page 1-6) has been terminated before proceeding to the next step.
Note. Use only the Polarity entry in the User Parameter list to switch between modes. Do NOT use other application, for example Diagnostic!
ThermoELECTRON CORPORATION6-12 _____________________ Multicollector Software 3.1 Manual ______________________

ExecutiveMulticollector Software 3.1 __________________________________________________Dialog Panes
6.3 Dialog PanesThe Executive application contains six tabbed pages or dialog panes:
• Mass calibration,
• Collector,
• Channeltron,
• Amplifier,
• History, and
• Log Files.
Note. Separate mass calibration, amplifier, channeltron and history tables are maintained for positive and negative modes.
Therefore, it may be necessary to update settings like ion counter operation voltage after switching between positive and negative ion polarities.
The Mass Calibration pane and the Log File pane are discussed in separate sections.
______________________ Multicollector Software 3.1 Manual_____________________ 6-13ThermoELECTRON CORPORATION

ExecutiveDialog Panes ______________________________________________ Multicollector Software 3.1
Collector Dialog Pane
The Collector table defines how many Faraday cups and ion counters are installed and at which position they are built into the variable multicollector system.
Collector Tool Bar
Note. The user should NOT edit the Collector table.
Figure 6-8. Executive - Collector Dialog Pane
Reload Data loads the corresponding configuration data set from the system data base ...\System\Database\triton.tdp.
Save Data renames the existing data set to <date>&<filename> (for example 8-8-2001_triton.tdp) and stores the current data set as ...\System\Database\triton.tdp.
Print Data prints the displayed data.
Change System Table opens the System Table dialog box, also refer to System Table on page 6-7.
ThermoELECTRON CORPORATION6-14 _____________________ Multicollector Software 3.1 Manual ______________________

ExecutiveMulticollector Software 3.1 __________________________________________________Dialog Panes
Channeltron Dialog PaneA number of parameters, such as the deadtime and the operation voltage of ion counters, can be entered in the Channeltron table.
Channeltron Tool Bar
Note. The Load, Save, and Print commands are also available from the File menu.
Note. After performing a plateau calibration, the new operation voltage must be entered in the Channeltron table and the updated table must be saved.
Figure 6-9. Executive - Channeltron
Reload Data loads the corresponding configuration data set from the system data base ...\System\Database\triton.tdp.
Save Data renames the existing data set to <date>&<filename> (for example 8-8-2001_triton.tdp) and stores the current data set as ...\System\Database\triton.tdp.
Print Data prints the displayed data.
Change System Table opens the System Table dialog box, also refer to System Table on page 6-7.
______________________ Multicollector Software 3.1 Manual_____________________ 6-15ThermoELECTRON CORPORATION

ExecutiveDialog Panes ______________________________________________ Multicollector Software 3.1
Amplifier Dialog PaneMost of the data present in the Amplifier table are generated during calibration procedures and entered automatically by the software, e.g. baseline data and gain factors.
Amplifier Tool Bar
Note. The Load, Save, and Print commands are also available from the File menu.
Note. Most of these parameters are important for diagnostics only.
Input currents of the amplifiers, the electrical capacitance of the Faraday cups and the resistance of the entire signal path are measured and provide useful data for diagnostic purposes.
In case an electronic amplifier performance test (using Eltest PCL script) is performed, the decay DAC values in the Amplifier table are overwritten and the new values (determined by the test procedure) must be entered and the data saved.
Figure 6-10. Executive - Amplifier
Reload Data loads the corresponding configuration data set from the system data base ...\System\Database\Triton.tdp.
ThermoELECTRON CORPORATION6-16 _____________________ Multicollector Software 3.1 Manual ______________________

ExecutiveMulticollector Software 3.1 __________________________________________________Dialog Panes
History Dialog PaneThe History dialog pane shows a list of all baseline and gain calibration data for the Faraday cups and the count history of the ion counters archived by the system. Every baseline and gain measurement is recorded in the data history set. These data can be used to monitor the long-term stability of the system.
Either the baseline (B), the absolute gain (G) (actual measured voltage), the relative gain (GR) (gain normalized to the gain calibration voltage, 33.33 V in positive mode and 12 V in negative mode), or the counts history absolute (C) can be displayed.
Save Data renames the existing data set to <date>&<filename> (for example 8-8-2001_triton.tdp) and stores the current data set as ...\System\Database\Triton.tdp.
Print Data prints the displayed data.
Change System Table opens the System Table dialog box, also refer to System Table on page 6-7.
Note. The Load, Save, and Print commands are also available from the File menu.
Note. Large discrepancies in the baseline or gain measurement might indicate an instrument problem or are the result of a change in the configuration of the instrument.
______________________ Multicollector Software 3.1 Manual_____________________ 6-17ThermoELECTRON CORPORATION

ExecutiveDialog Panes ______________________________________________ Multicollector Software 3.1
History Tool Bar
Figure 6-11. Executive - History (Baseline History)
Baseline History displays the contents of the log file Baseline History.
Gain History Absolute displays the contents of the log file Gain History.
Gain History Relative displays the contents of the log file Gain History Rel.
Counts History Absolute displays the absolute amount of counts of the ion counters installed from the log file Counting History.
Delete Baseline History deletes the contents of the log file Baseline History.
Delete Gain History Absolute deletes the contents of the log file Gain History.
ThermoELECTRON CORPORATION6-18 _____________________ Multicollector Software 3.1 Manual ______________________

ExecutiveMulticollector Software 3.1 __________________________________________________Dialog Panes
Delete Gain History Relative deletes the contents of the log file Gain History Rel.
Delete Counts History Absolute deletes the contents of the log file Counting History.
Change System Table opens the System Table dialog box, also refer to System Table on page 6-7.
Reset Counts allows the user to enter the number of counts for each ion counter channel.
Note. The individual display options can also be selected from the File menu.
______________________ Multicollector Software 3.1 Manual_____________________ 6-19ThermoELECTRON CORPORATION

ExecutiveMass Calibration ___________________________________________ Multicollector Software 3.1
6.4 Mass CalibrationIn the Mass Calibration dialog pane, the characteristics of mass versus magnet DAC is shown in a graph.
Mass Calibration Tool BarThe following tools are available in the Mass Calibration tool bar:
E1...E100 displays the graph of the Conversion Error magnified by a factor 1 to 100.It is used to check the quality of the mass calibration.
Print Data prints the calibration graph.
Edit Calibrated Masses displays the reference masses used to calculate the mass calibration curve. The user may edit the list of reference masses, refer to Calibrated Masses on page 6-22.
In conjunction with the Peak Center procedure of the Tune application, it is used to modify or update the Mass Calibration curve.
Change System Table opens the System Table dialog box, also refer to System Table on page 6-7.
Note. The conversion error and the Calibrated Mass dialog box can also be selected from the menu item Mass Calibration.
ThermoELECTRON CORPORATION6-20 _____________________ Multicollector Software 3.1 Manual ______________________

ExecutiveMulticollector Software 3.1 _______________________________________________ Mass Calibration
In the Mass Calibration dialog pane, the characteristics of mass versus magnet DAC is shown in a graph. The graphical display shows every entry of the mass calibration as a vertical line.
Masses used for the calibration are shown in red; these masses are the Reference entries (indicated by REF in the Calibrated Masses table). They are used to interpolate the mass calibration over the whole mass range. The mass calibration needs at least four reference points to calculate the mass calibration over the whole mass range. Masses shown in green are the result of a Peak Center routine. They are not reference points and do not alter the mass calibration curve.
When a reference mass (red line) is centered, the line color changes to green, but the reference mass is still used as reference. In this case, the table shows REF next to OFS.
The Offset entries (OFS) are the differences between the Peak Center value and the theoretical value from the mass calibration curve. Peak Center values (green) lines can be edited to become reference points. Then the mass calibration fit will be changed based on the new set of calibration points.
Figure 6-12. Executive - Mass Calibration
______________________ Multicollector Software 3.1 Manual_____________________ 6-21ThermoELECTRON CORPORATION

ExecutiveMass Calibration ___________________________________________ Multicollector Software 3.1
Calibrated Masses Open the Calibrated Masses dialog box via the Mass Calibration menu or the respective icon in the Tool bar.
The Calibrated Mass table shows every entry that contains a mass number, the corresponding DAC values (coarse and fine) and the type of entry. Each line in the list represents an entry of the currently used mass calibration.
If you highlight one line in the Calibrated Masses table, the mass and the DAC value show up in the edit fields next to the Apply button.
Now, you can assign a different mass to the peak by changing the entry in the Mass field, or you can change the magnet DAC by changing the DAC value. When clicking on the Apply button, these values will update the Calibrated Mass table. The field accepts exact masses, as well as isotope names, for example 87.90562 or 88Sr. A further click on the selected line and Update allocates it as a REF point.
Figure 6-13. Calibrated Masses Table (Dialog Box)
Note. You need to run the Peak Center procedure (in the Tune application) to add an entry into the list. The new entry will be of type OFS (Offset). To allow easy identification of the new entry in the list, the entry will be highlighted.
ThermoELECTRON CORPORATION6-22 _____________________ Multicollector Software 3.1 Manual ______________________

ExecutiveMulticollector Software 3.1 _______________________________________________ Mass Calibration
When clicking on the Apply button, the modified values in the fields Mass and DAC will update the Calibrated Mass table.
The Update button is active for Offset (peak center type) entries only.
In addition, it converts the OFS type entry into a reference type (REF). Reference entries are used to calculate the calibration curve and for interpolation between reference points. The vertical line in the graphical display changes color from green to red.
The Delete button deletes the selected entry from the list of calibrated masses. This may be necessary when too many masses have been calibrated in a relatively narrow mass region.
The Close button saves changes and closes the dialog box.
______________________ Multicollector Software 3.1 Manual_____________________ 6-23ThermoELECTRON CORPORATION

ExecutiveLog Files _________________________________________________ Multicollector Software 3.1
6.5 Log FilesThe Log Files dialog pane can display the Instrument log file or the LAN logfile.
Instrument Log The instrument log file stores all instrument communi- cation actions such as Start, Acquisition tables etc.
LAN Logfile This file stores each single parameter that has been sent via the network. This information is only valuable for diagnostic purposes.
Log Files Tool Bar
Figure 6-14. Executive - Log Files
Note. The required file can be loaded or deleted via the Tool bar buttons or via the File menu.
Load Instrument Logfile displays the contents of the file ...\System\Logfiles\inst.log.
Load LAN Logfile displays the contents of the file ...\User\Triton\Logfiles\lan.log.
ThermoELECTRON CORPORATION6-24 _____________________ Multicollector Software 3.1 Manual ______________________

ExecutiveMulticollector Software 3.1 _____________________________________________________ Log Files
Customize Log FilesLog files can be customized. The maximum file length of the log file can be specified, for example if 5 000 lines have been entered, the last 5 000 actions of the instrument will be listed.
Open the menu item Customize > Log files.... Select the required log file type from the list and enter the required number of lines (actions) in the Max. Size [Lines] field.
Delete Instrument Logfile completely deletes the instrument log file from.
Delete LAN Logfile completely deletes the LAN log file.
Change System Table opens the System Table dialog box, also refer to System Table on page 6-7.
About Executive displays comprehensive information about the Executive application and its modules.
Note. The commands are also available in the File menu.
The Clear button clear the selected log file. It is de-activated (grayed out) if no log file is available.
______________________ Multicollector Software 3.1 Manual_____________________ 6-25ThermoELECTRON CORPORATION

ExecutiveLog Files _________________________________________________ Multicollector Software 3.1
Note. In case of any instrument problems, the log files can contain valuable information and should be made available for service calls.
Log files are often useful diagnostic tools. In this case, it is important to make sure that you have enough space available on the hard disk. In particular LAN logging (in the Diagnostic application) can occupy a significant amount of disk space.
A file length of more than 10000 lines should only be selected for a specific diagnostic in case of hardware problems. Longer file lengths could affect the speed of the data system dramatically.
ThermoELECTRON CORPORATION6-26 _____________________ Multicollector Software 3.1 Manual ______________________

Chapter 7Diagnostic
This chapter deals with the Diagnostic application of the Multicollector Software Version 3.1 and contains the following sections:
• Introduction - Diagnostic describes the basic layout and the main commands of theDiagnostic application.
• Dialog Applications gives a brief overview of the dialog panes in the application.
Note. Diagnostic is designed as a tool for service engineers to set and read hardware parameters of the instrument.
Do not use the Diagnostic application unless you know exactly what to do.
______________________ Multicollector Software 3.1 Manual______________________ 7-1ThermoELECTRON CORPORATION

DiagnosticIntroduction - Diagnostic ______________________________________ Multicollector Software 3.1
7.1 Introduction - Diagnostic The general purpose of the Diagnostic application is to enable the operator to control much of the instrument’s hardware at a very basic level. Also, the operator can monitor practically all voltages, pressure, temperatures, interlock states, etc.
The user must first connect to the instrument before data can be sent or read from the mass spectrometer. This is realized by selecting Connect to MS from the Instrument menu, refer to Instrument Menu on page 7-3
Operation of DiagnosticThis is how the Diagnostic works:
First Phase: The startup of the program: Diagnostic determines the status and setting of all accessible parameters.
Second Phase: Allows the user to access all hardware parameters and functions in a given range.
Figure 7-1. Finnigan Triton Software - Diagnostic Editor Application
Note. Do not use the Diagnostic application unless you know exactly what to do. Diagnostic is designed as a tool for service engineers to set and read hardware parameters of the instrument.
Double-Click to Open
ThermoELECTRON CORPORATION7-2 ______________________ Multicollector Software 3.1 Manual ______________________

DiagnosticMulticollector Software 3.1 _________________________________________ Introduction - Diagnostic
Third Phase: Closing the program initiates the third phase. Diagnostic resets all parameters to the settings found when first started. Then the program shuts down.
Standard Bars and CommandsDouble-click on the Diagnostic application icon to open the application.
Title Bar The Title bar contains the name of the application (Diagnostic).
Menu BarThe Menu bar contains the application’s top level command menus.
File Menu
Exit Diagnostic can be exited via the Exit command.(All parameters are reset to settings found when first started)
View Menu
Tool Bar, Status BarToggles the menu bars on and off. If checked, the respective bar will be displayed.
Instrument Menu
Connect/ Disconnect MSConnects / disconnects to the mass spectrometer to send or read data from the instrument.
LAN Logging If ticked, a LAN logfile is created .
Motor Logging If ticked, a motor logfile is created.
Expert Mode not implemented
Figure 7-2. Method Editor - Bars
Title Bar
Menu BarTool Bar
Tabbed Pages
Status Pane
______________________ Multicollector Software 3.1 Manual______________________ 7-3ThermoELECTRON CORPORATION

DiagnosticIntroduction - Diagnostic ______________________________________ Multicollector Software 3.1
Display Last DAC ValuesShows a dialog box with the last DAC and user values.
Display Last BIT ValuesShows a dialog box with the last BIT values.
ThermoELECTRON CORPORATION7-4 ______________________ Multicollector Software 3.1 Manual ______________________

DiagnosticMulticollector Software 3.1 _________________________________________ Introduction - Diagnostic
Cup Motors Limits...Shows a dialog box with the cup motor limits.
Send Single Command to MS...The engineer can send a single command to the instrument.
Status BarThe Status bar contains information related to the application running in this window. It can be switched on or off via the View menu.
______________________ Multicollector Software 3.1 Manual______________________ 7-5ThermoELECTRON CORPORATION

DiagnosticIntroduction - Diagnostic ______________________________________ Multicollector Software 3.1
Tabbed PagesThe Diagnostic application contains 9tabbed pages or Dialog applications:
• Instrument Status,
• Ion Source,
• High Voltage
• Magnet,
• Sample Wheel
• Samples
• Motor Control
• Filament Control
• PCL.
By default, the Diagnostic application opens at the Instrument Status page.
ThermoELECTRON CORPORATION7-6 ______________________ Multicollector Software 3.1 Manual ______________________

DiagnosticMulticollector Software 3.1 _____________________________________________ Dialog Applications
7.2 Dialog Applications There are a number of Dialog applications available within Diagnostic. The Diagnostic program enables the direct alteration of range of instrument parameters.
Instrument StatusThe Instrument Status dialog displays information regarding the electronic configuration.
LED Indication
A green LED indicates : Status ON/ OPEN
A red LED indicates : Status OFF/ CLOSE
Figure 7-3. Instrument Status Dialog Pane
______________________ Multicollector Software 3.1 Manual______________________ 7-7ThermoELECTRON CORPORATION

DiagnosticDialog Applications__________________________________________ Multicollector Software 3.1
System Parameters
Ion Source
High Voltage
Figure 7-4. Ion Source Dialog Pane
Figure 7-5. High Voltage Dialog Pane
ThermoELECTRON CORPORATION7-8 ______________________ Multicollector Software 3.1 Manual ______________________

DiagnosticMulticollector Software 3.1 _____________________________________________ Dialog Applications
Magnet
Sample Wheel
Figure 7-6. Magnet Dialog Application
Figure 7-7. Sample Wheel Dialog Pane
______________________ Multicollector Software 3.1 Manual______________________ 7-9ThermoELECTRON CORPORATION

DiagnosticDialog Applications__________________________________________ Multicollector Software 3.1
Samples
Filament Control
Figure 7-8. Samples Dialog Pane
Figure 7-9. Filament Control Dialog Application
ThermoELECTRON CORPORATION7-10 _____________________ Multicollector Software 3.1 Manual ______________________

DiagnosticMulticollector Software 3.1 _____________________________________________ Dialog Applications
Motor ControlRelease Collision If cups have collided, the collision can be released by
clicking on Release Collision.
Initialize (Determine Inner and Outer Cup Motor Limit)When the collector array has been rearranged, for example by addition of ion counters, the cup motor limits must be determined again. This is started by pressing the Initialize (Determine Inner and Outer Cup Motor Limits) button.
Figure 7-10. Motor Control Dialog Pane
______________________ Multicollector Software 3.1 Manual_____________________ 7-11ThermoELECTRON CORPORATION

DiagnosticDialog Applications__________________________________________ Multicollector Software 3.1
PCL
Figure 7-11. PCL Dialog Pane
Note. Within PCL, a selection can be made from predefined, prewritten PCL scripts, for example baking procedure. The user can also start a self-written script.
Refer to the PCL Manual for further information.
(Drop-Down List)
ThermoELECTRON CORPORATION7-12 _____________________ Multicollector Software 3.1 Manual ______________________

IndexMulticollector Software 3.1 ____________________________________________________________
Index
Aabort criteria, 3-18absolute gain (executive), 6-17accessories and information dialog windows (tune), 2-6acquisition
icon, 1-6start, 1-6
acquisition application, 1-6acquisition control, 3-20
interblock actions, 3-26acquisition parameter, 3-12
block, 3-17cycle, 3-18
actual cup position, 2-41actual cup position (tune), 2-41amplifier (method editor), 3-28amplifier box (executive), 6-8amplifier dialog pane(executive), 6-16amplifier interblock actions, 3-28amplifier table (executive), 6-16analytical baseline (method editor), 3-29application start, 2-8atom% or weight %, 3-40autofill (sequence table), 4-4autofocus, 2-29autofocus (tune), 2-29autotune configuration, 2-4
Bb (abbr.), 5-22base frequency (evaluation), 5-6baseline (executive), 6-17baseline (method editor), 3-28baseline history (executive), 6-18basic procedure, 1-3blk (abbr.), 4-11block, 3-18
definition, 3-17block control (evaluation), 5-9block view, 5-22block view (b), 5-22
Ccalculation parameters (evaluation), 5-14calibrated masses (executive), 6-22calibration table, 2-23center cup (tune), 2-55c-factor, 3-42change system table, 6-14changes to the manual, 1-viiichanging the amplifier (executive), 6-9channeltron box (executive), 6-10channeltron table (executive), 6-15chart recorder, 2-14
normalization, 2-15
tool bar, 2-15collector dialog pane, 6-14collector table (executive), 6-14columns, 3-23columns in the sequence table, 4-11configuration, 2-42context menu file browser, 2-13context menu grid/ numerical view, 5-13context menus graphical/ numerical view, 5-13continuous mode (tune), 2-38conversion error (executive), 6-20corr. val., 3-34correction factor, 3-42correction parameters (evaluation), 5-15counter calibration, 3-27counter calibration interblock action, 3-27counter calibration interblock actions, 3-27counts history (executive), 6-17counts history absolute (executive), 6-18creating a method, 3-3creating an autofocus procedure, 2-29cup configuration, 2-40cup configuration (method editor), 3-12cup configuration (tune), 2-40cup configuration table, 3-13
add line, 3-16center SEM/RPQ, 3-14columns, 3-12control cup focus, 3-16control cup peakcenter, 3-15edit lines, 3-16idle time, 3-15integration time, 3-14number of integrations, 3-15
customize layout, 6-4customize log files, 6-25cycle, 3-18
definition, 3-12cycle control, 5-9cycles, 3-36
Dd (abbr.), 5-23dark noise, 3-27data
organization, 5-20data evaluation, 5-18data evaluation and organization, 5-11data organization, 5-9, 5-20
info line, 5-12information section, 5-12statistical section (B), 5-22statistical section (D), 5-23statistical section (RB), 5-12statistics on selected data, 5-24
data structure, 3-18data view, 5-23data view (d), 5-23
______________________ Multicollector Software 3.1 Manual_________________________ 1ThermoELECTRON CORPORATION

Index________________________________________________________ Multicollector Software 3.1
deadtime, 5-6deadtime correction, 5-5deadtime factor, 5-6deadtime of electronics, 5-5deadtime parameter (Evaluation), 5-4
deadtime correction, 5-5deadtime factor, 5-6deadtime formula, 5-6deadtime parameter, 5-5default settings
idle time (cup configuration table), 3-15delete baseline history, 6-18delete counts history absolute, 6-19delete gain history absolute, 6-18delete gain history relative, 6-19delete instrument logfile, 6-25delete lan logfile, 6-25detector calibration, 2-47diagnostic, 1-3diagnostic application, 7-2dialog windows, 2-5dispersion, 2-39dispersion quad, 2-39display (evaluation), 5-14display dialog bars and windows, 2-6dy (abbr.), 5-18dynamic evaluation, 5-18dynamic evaluation (dy), 5-18dynamic measurement, 3-13
Eedit calibrated masses, 6-20edit chart recorder, 2-15edit cup configuration table, 3-16edit file browser, 2-12edit watch parameter, 2-10editing the table, 3-16electronic baseline (method editor), 3-29enter formulas (method editor), 3-45enter variables (method editor), 3-44error message
mechanical cup motor limits, 2-41eva, 3-20evaluation, 1-2, 3-31
automatic start online evaluation, 5-4calculation parameters, 5-14correction parameters, 5-15dialog windows, 5-7dynamic evaluation, 5-18export data, 5-25multi-dynamic evaluation, 5-19navigation bar, 5-9online evaluation, 5-25static evaluation, 5-18total evaporation, 5-18view configuration, 5-14
evaluation application, 1-2, 5-2evaluation pane, 3-31
C-Factor, 3-42evaluation parameter, 3-35formula editor, 3-43
interference element corrections, 3-32isotope ratios, 3-31K-Factor, 3-40
evaluation parameter, 3-35multidynamic evaluation, 3-39
evap filament, 2-23example
Defining an Online-Calculation using the Formula Editor, 3-44
Defining Isotope Ratios and IEC, 3-32Setting up A Sequence, 4-13
executive, 1-3, 6-1executive application, 1-3export, 5-25external fractionation, 3-40
Ffaraday cups, 2-47faraday cups (tune), 2-47filament control (diagnostic), 7-10filament control (tune), 2-24filament focus, 3-27filament heater, 3-22filament heater program, 3-22filament heating, 3-20file browser, 2-12filename preferences (sequence), 4-4first mass, 2-49focus (method editor), 3-23focus quad, 2-39formula (evaluation), 5-6formula editor, 3-43
Ggraphical view (evaluation), 5-10graphics parameter (evaluation), 5-17grid view (evaluation), 5-11
Hhardware system status, 1-5header data, 4-10heating, 3-26heating interblock action, 3-26help menu, 2-4high voltage (diagnostic), 7-8
Iidle time, 3-15iec (abbr.), 3-32info line (evaluation), 5-12information, 2-18information section (evaluation), 5-22installed hardware, 6-8instrument control, 2-19instrument menu (diagnostic), 7-3instrument status (diagnostic), 7-7integrating the channeltron, 6-10
ThermoELECTRON CORPORATION2_________________________ Multicollector Software 3.1 Manual ______________________

IndexMulticollector Software 3.1 ____________________________________________________________
integration, 3-36integration mode, 2-38intensity offset for stop, 3-25interblock action
amplifier, 3-28counter calibration, 3-27heating, 3-26tuning, 3-27
interblock actions, 3-26interference element correction (iec), 3-32interference element corrections (iec), 3-32internal correction ratio, 3-39internal standard normalization, 3-37introduction, 2-2ion, 3-20ion counter, 2-50ion counter (tune), 2-50ion source (diagnostic), 7-8ioni filament (tune), 2-23ioni filaments, 2-23isobaric interferences, 3-32isotope ratios, 3-31iupac, 3-42
International Union of Pure and Applied Chemistry, 3-42
Kk-factor, 3-40
Lled
system status, 1-7led indication (diagnostic), 7-7lens focus, 3-27log file
sequence log file, 4-2logviewer, 2-13
Mheatslope, 3-26magnet (diagnostic), 7-9manual control, 2-26manual control (tune), 2-26mass calibration, 6-20mass scan, 2-31
continuous mode, 2-38definiton, 2-37integration mode, 2-38
max. current in ma, 3-20md (abbr.), 5-19measurement
dynamic (Method Editor), 3-13multidynamic (Method Editor), 3-13
method editor, 3-2dialog windows, 3-9evaluation pane, 3-31interblock actions, 3-26panes, 3-11
motor control (diagnostic), 7-11multi-dynamic evaluation, 5-19multidynamic evaluation, 3-39, 5-19multi-dynamic evaluation (md), 5-19multidynamic evaluation md, 3-39multidynamic measurement, 3-13
Nnavigation bars (evaluation), 5-9normalization (chart recorder), 2-15number of integrations, 3-15numerical view (evaluation), 5-10
Ooffset, 2-34offset entries, 6-21online ascii export, 4-16online evaluation, 5-25online print, 4-17operation of diagnostic, 7-2optimize the high voltage (source lenses), 2-28outlier test, 3-36
blocks, 3-36cycles, 3-36integration, 3-36
Ppanes, 3-11pcl (diagnostic), 7-12pcl, pcl diagnostic, pcl display, 1-3peak center (method editor), 3-27peak center (tune), 2-34peak center routine, 6-21peak control (tune), 2-32peak scan, 2-36peakcenter (method editor), 3-15peakcenter (tune), 2-34pilot signal, 3-25plateau voltage
recalibrate, 2-52preheat 1 controls/ preheat 2 controls (optional), 2-26
Qquad, 2-39
Rrb (abbr.), 5-20recalibrate
plateau voltage, 2-52yield, 2-51
recalibrate (tune), 2-49reference entries, 6-21relative gain (executive), 6-17report parameter, 3-8reset counts, 6-19
______________________ Multicollector Software 3.1 Manual_________________________ 3ThermoELECTRON CORPORATION

Index________________________________________________________ Multicollector Software 3.1
retarding potential quadrupole lens, 2-55retarding potential quadrupole lens (rpq), 3-14rotate, 3-28routines
multidynamic routines for Nd and Sr measurements, 3-14
run block view (rb), 5-20run number, 4-4run number view (rn), 5-21run script, 3-30
Ssample id (sequence), 4-4sample id (tune), 2-23sample type
BLK, 4-11SMP, 4-11STD, 4-11
sample type (sequence editor), 4-11sample wheel (diagnostic), 7-9sample wheel (tune), 2-21sample wheel position, 2-21scan control, 2-31second mass, 2-49secondary electron multiplier (sem), 3-14select data evaluation and organization, 5-9sem (abbr.), 3-14sequence editor, 4-1
accessories dialog bar, 4-8dialog bars, 4-8filename preferences, 4-4header data, 4-10information dialog bar, 4-9sample type, 4-11sequence table, 4-11standard bars and commands, 4-3
sequence log file, 4-2sequence menu, 4-4sequence online settings, 4-16sequence table, 4-11
columns, 4-11sequencec editor
setting up a sequence, 4-13setting the voltage, 2-39setting up a cup configuration, 2-44settings menu, 3-6settings menu (sequence), 4-6smp (abbr.), 4-11software system status, 1-6source controls, 2-31source lenses, 2-27st (abbr.), 5-18start and stop chart recorder, 2-15start online evaluation automatically, 5-4static evaluation (st), 5-18static measurement, 3-13static, dynamic and multidynamic measurements, 3-13statistical section (b), 5-22statistical section (d), 5-23statistical section (evaluation), 5-12statistical section (rb), 5-12
statistics on selected data (evaluation), 5-24status, 2-24std (abbr.), 4-11sub-configuration, 2-43summed intensities (sumi), 3-21system parameter list, 6-8system parameters (diagnostic), 7-8system startup, 1-1system status, 1-7
LED, 1-7LED colors, 1-7
system status application, 1-7system status display, 1-7system status panel, 1-5system table (executive), 6-7
Ttabbed pages, 2-20te (abbr.), 5-18total evaporation, 5-18total evaporation (evaluation), 5-18total evaporation (method editor), 3-25total evaporation (te), 5-18tune, 2-2
autotune configuration, 2-4tune dialog window, 2-8tuning, 3-27tuning interblock action, 3-27tuning interblock actions, 3-27
Uuser parameter list (executive), 6-12
Vview
block view, 5-22data view, 5-23run block view, 5-20run number view, 5-21
view configuration (evaluation), 5-14
Wwatch parameter, 2-9window
recalibrate plateau, 2-52recalibrate yield, 2-51
Yyield, 3-27
recalibrate, 2-51
Zzoom optics, 2-39zoom optics (cup configuration), 2-43
ThermoELECTRON CORPORATION4_________________________ Multicollector Software 3.1 Manual ______________________