fire-sale fdi and liquidity crises
TRANSCRIPT
Fire-Sale FDI and Liquidity Crises¤
Mark Aguiar
University of Chicago, GSB
Gita Gopinath
University of Chicago, GSB
August 12, 2002
Abstract
In placing capital market imperfections at the center of emerging market crises, the
theoretical literature has associated a liquidity crisis with low foreign investment and the
exit of investors from the crisis economy. However, a liquidity crisis is equally consistent
with an in°ow of foreign capital in the form of mergers and acquisitions (M&A). To
support this hypothesis, we use a ¯rm-level dataset to show that foreign acquisitions
increased by 88% in East Asia between 1996 and 1998, while intra-national merger
activity declined. Firm liquidity plays a signi¯cant and sizeable role in explaining
both the increase in foreign acquisitions and the decline in the price of acquisitions
during the crisis. This e®ect is most prominent in the tradable sectors and represents a
signi¯cant departure from the pattern of M&A observed both before and after the crisis.
Quantitatively, the observed decline in liquidity can explain nearly 30% of the increase
in foreign acquisition activity in the tradable sectors. We argue that the nature of M&A
activity during the crisis contradicts productivity-based explanations of the East Asian
crisis.
¤Contact information: 1101 E. 58th Street, Chicago, IL 60637. email: [email protected],
[email protected]. We thank Bruce Blonigen, Ricardo Caballero, John Cochrane, Jon Guryan,
Erik Hurst, Anil Kashyap, Amil Petrin, Raghu Rajan, Per Stromberg, Raghu Venugopalan, and Alwyn
Young for comments and suggestions.
1
1 Introduction
There is a growing theoretical literature that places capital market imperfections at the cen-
ter of emerging market crises. A deterioration in access to liquidity is shown to induce and
exacerbate a real crisis in emerging markets, even in the absence of a shock to fundamentals
(Aghion, Bacchetta, and Banerjee (2000), Calvo and Mendoza (2000), Chang and Velasco
(2001), Schneider and Tornell (2001), and Caballero and Krishnamurthy (2001).) This lit-
erature associates liquidity crises with low foreign investment and an exit of investors from
the crisis economy. However, an equally plausible consequence of a liquidity crisis would
involve the buy-out of domestic ¯rms by foreign ¯rms, an option that is usually ruled out or
omitted from the recent crisis models. In this paper, we empirically investigate the behav-
ior of mergers and acquisitions (M&A), both domestic and foreign, in East Asia during the
crisis of 1997-98. We ¯nd that M&A activity is consistent with the tightening of liquidity
constraints for domestically owned ¯rms but runs counter to scenarios featuring a decline in
fundamentals. Speci¯cally, nations su®ering dramatic reversals in portfolio equity and debt
°ows simultaneously experience an increase in foreign acquisitions, particularly of liquidity
constrained ¯rms, a phenomenon we describe as ¯re-sale foreign direct investment (FDI).
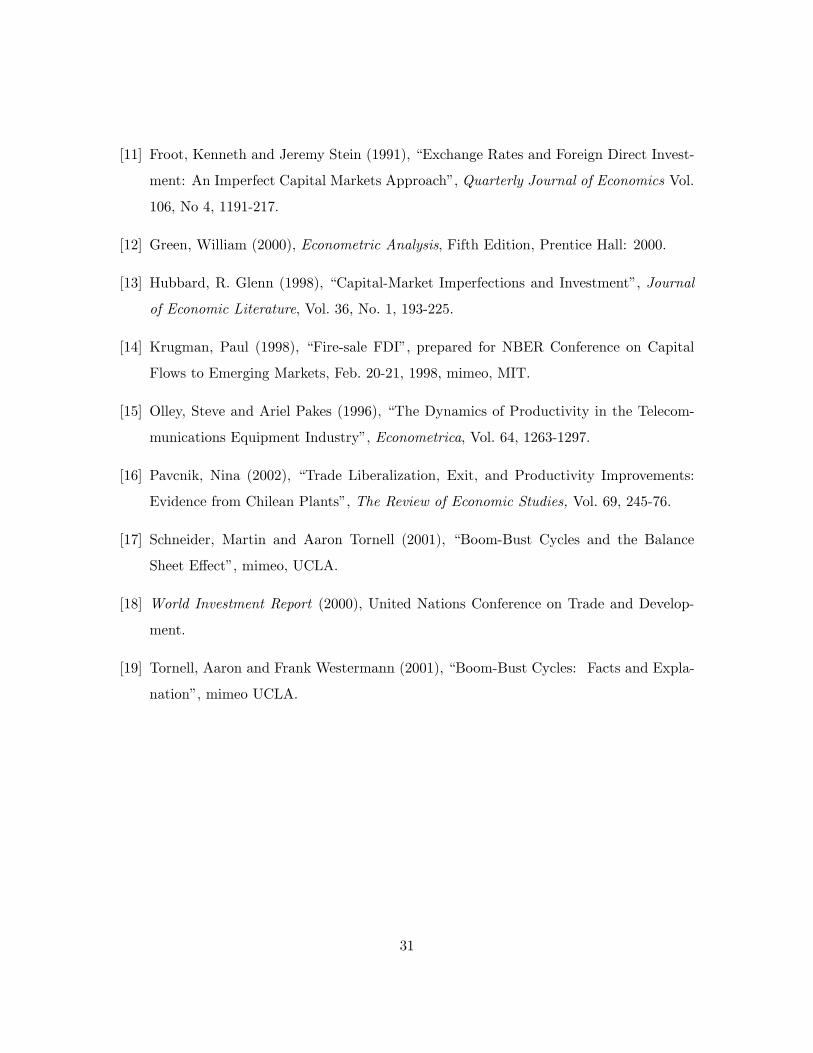
Since the reversal of capital °ows constitutes the de¯ning feature of recent crises in
emerging markets, understanding the behavior of these °ows is crucial to identifying the
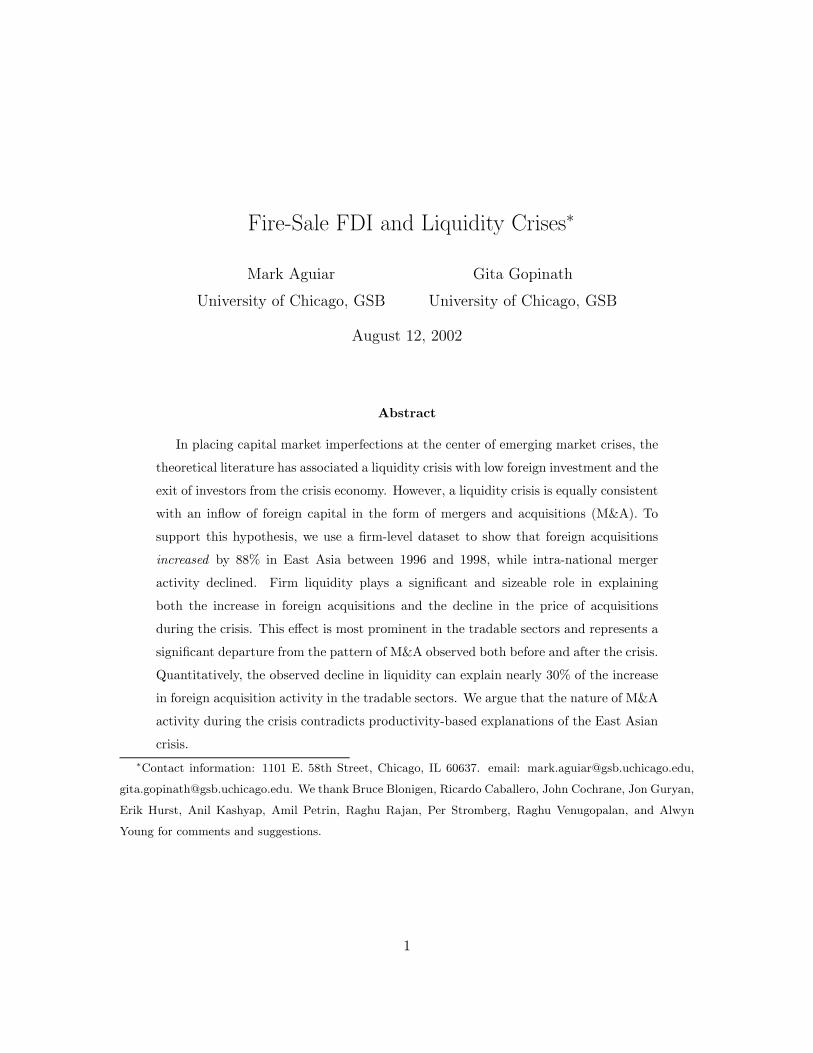
precipitating shocks. Any such analysis needs to confront the surprising stability of foreign
direct investment in°ows into emerging markets during crisis years, a sizeable component
of which are M&A's (see Appendix D). This stability contrasts with the sharp reversals in
portfolio °ows and bank lending (see ¯gure 1).
We begin our analysis in Section 2 by deriving testable implications for the behavior
of mergers and acquisitions in response to a deterioration in liquidity. For this purpose,
we introduce a stylized model of foreign acquisitions in emerging markets. An impor-
tant assumption we make is that foreign ¯rms bring access to greater liquidity than would
otherwise be available to the acquired ¯rm. We argue that foreign ownership brings trans-
parency, relationships, and management that help bridge the gap between emerging markets
2
and deeper overseas ¯nancial markets. Such bene¯ts are unlikely to result from portfolio
°ows due to the small and dispersed nature of portfolio transactions. The premise that a
large foreign ownership stake mitigates capital market imperfections therefore implies an
important distinction between portfolio capital and FDI.
The model of Section 2 generates several predictions regarding the number and prices of
acquisitions during a liquidity crisis, both at the aggregate level and across ¯rms. To test
these predictions, we employ a ¯rm level dataset on mergers and acquisitions that records
all cross-border and within-country mergers and acquisitions from 1986 through 2001. The
dataset includes ¯rm level ¯nancial characteristics of the target ¯rm and acquisition prices,
providing us with a rich information set to analyze acquisition behavior. The empirical
literature on cross-border mergers and acquisitions has been limited to developed country
capital markets (Froot and Stein (1991) and Blonigen (1997)) and, to our knowledge, the
nature of mergers and acquisitions in emerging markets has not been studied in detail.
The results of our empirical analysis are presented in Section 3. We ¯nd that the number
of foreign mergers and acquisitions in East Asia increased by 88% between 1996 and the
crisis year of 1998. Signi¯cantly, over the same period, domestic mergers and acquisition
declined by 28%. In support of the liquidity hypothesis, we ¯nd that the e®ect of liquidity
(proxied by cash °ow or sales) on the probability of being acquired changes signi¯cantly
during the crisis year. While during non-crisis years high cash °ow is weakly associated with
acquisition, in 1998 additional cash implies a lower probability of acquisition. A natural
prediction of the model is that liquidity constraints should have a greater impact on ¯rms
in high-growth sectors. While the large real devaluation of East Asian currencies in 1997-98
and the simultaneous collapse of the domestic economies limited the cash °ow of ¯rms in
the nontradable sectors, they also severely reduced the ¯rms' growth prospects (Schneider
and Tornell (2001) document the relatively quick recovery in the tradable sectors). Cor-
respondingly, we ¯nd stronger and more consistent evidence of liquidity-based M&A in the
tradable sectors. Our estimates indicate that the decline in ¯rm liquidity between 1996
and 1998 can account for nearly 30% of the observed increase in acquisition activity in the
3
tradable sectors.
In regard to the price paid for an acquired ¯rm, the median ratio of o®er price to book
value declined from 3.3 in 1996 to 1.3 in 1998. In support of the hypothesis that cash-
strapped ¯rms sell at a steeper discount during a liquidity crisis, cross-sectional regressions
¯nd that an additional dollar of cash has a larger impact on sale price in 1998 than in
other years.1 In fact, the elasticity of price-to-book with respect to cash °ow is roughly 0.7
in 1998 while negligible during the other years of the sample. We ¯nd that the recorded
change in ¯rm liquidity can plausibly explain 37% of the observed drop in price between
1996 and 1998.
We also ¯nd that liquidity considerations were more important in driving foreign-
domestic acquisitions than domestic-domestic acquisitions, consistent with our underlying
premise regarding the advantages of foreign ownership. Finally, we divide our sample into
sub-periods to determine the role of liquidity over time and ¯nd that liquidity e®ects are
most prominent in 1998 and disappear by the year 2000. Given that liquidity shocks are
typically thought to be short-lived, particularly in contrast to productivity shocks, we argue
this is further support for the liquidity-sale hypothesis.
2 Model
This section presents a simple two-period model to spell out intuitively robust implications
of a liquidity crisis . The goal of the model is to formalize testable predictions regarding
the behavior of foreign acquisitions during a liquidity crisis.
The model makes a distinction between foreign ownership and domestic ownership. A
domestic ¯rm that is acquired by a foreign ¯rm is assumed to gain access to superior tech-
nology and deeper credit markets. The ¯rst distinction captures the conventional wisdom
1The possibility that ¯rms were being sold at a discount due to illiquidity was raised early on by Krugman
(1998) based on anecdotal evidence on acquisitions.
4
that foreign direct investment from industrialized countries to emerging markets involves
signi¯cant technology transfer and improves the productivity of domestic industry.2 As
noted in the introduction, the second distinction rests on the premise that capital markets
are deeper in industrialized countries and ¯rms that are headquartered in such markets
have greater access to outside funding. There are numerous theoretical models that provide
microfoundations for borrowing constraints, such as imperfect and asymmetric information
(see Bernanke, Gertler and Gilchrist (1998) for a survey of capital market imperfections
and macroeconomics). As the goal of the paper is not to add to this already large theo-
retical literature, we will take as given that ¯rms may face a borrowing constraint and this
constraint is tighter for emerging market ¯rms.
At the start of period one, a domestically owned ¯rm, j; is characterized by an initial
capital stock Kj;1, a borrowing constraint ¹Dj , and period-one pro¯ts ¼j;1. In period 1, the
¯rm chooses its optimal investment, I; subject to the borrowing constraint and anticipated
period-two productivity, Aj;2 (we assume perfect foresight). Firms are price takers and the
price of additional capital is normalized to one. Any di®erences across ¯rms in the price of
output are folded into Aj;2 (in particular, the di®erential impact of a real devaluation across
¯rms will be captured by di®erences in Aj;2). To simplify expressions, we assume that the
interest rate and discount rate are zero.
The value of a ¯rm under domestic ownership, V D; can then be expressed as (dropping
subscript j):
V D(K1; A2; ¼1; ¹D) = maxIf¼1 ¡ I +A2F (K2) + (1¡ ±)K2g (1)
s.t. K2 = (1¡ ±)K1 + II · ¹D + ¼1;
2Empirical evidence is however mixed. See Blomstrom and Wol® (1994) and Aitken and Harrison (1999).
For the main predictions of our liquidity hypothesis the crucial assumption is the di®erence in access to
liquidity. The assumption regarding productivity allows for acquisition of non-liquidity constrained ¯rms in
equilibrium.
5
where F 0 > 0, F 00 < 0, and ± 2 (0; 1) is the rate of capital depreciation. The di®erencebetween current pro¯ts and investment (¼1 ¡ I) represents retained earnings (if positive)or (the negative of) debt due in the ¯nal period. The ¯rst constraint is a standard capital
accumulation equation. The second constraint captures the borrowing constraint.
The value to a foreign owner, V F ; of the same ¯rm is given by
V F (K1; A2; ¼1) = maxIf¼1 ¡ I + ÁA2F (K2) + (1¡ ±)K2g (2)
s.t. K2 = (1¡ ±)K1 + I
where Á > 1 captures the superior productivity associated with foreign ownership and
foreign owners are not subject to a borrowing constraint.3 Clearly, V F > V D; 8j. However,the transfer of ownership to the foreign acquiror entails a ¯xed reorganization cost °, which
may vary across domestic ¯rms.4 A foreign ¯rm then acquires a domestic ¯rm as long as
the acquisition generates a positive surplus, that is S ´ V F ¡ V D ¡ ° ¸ 0. If acquired, theprice paid for the ¯rm is determined according to a Nash-bargaining solution :
P = ¯S + V D = ¯¡V F ¡ V D ¡ °¢+ V D; (3)
where ¯ 2 (0; 1) captures the domestic owners bargaining power and V D is the outside
option for the domestic ¯rm5.
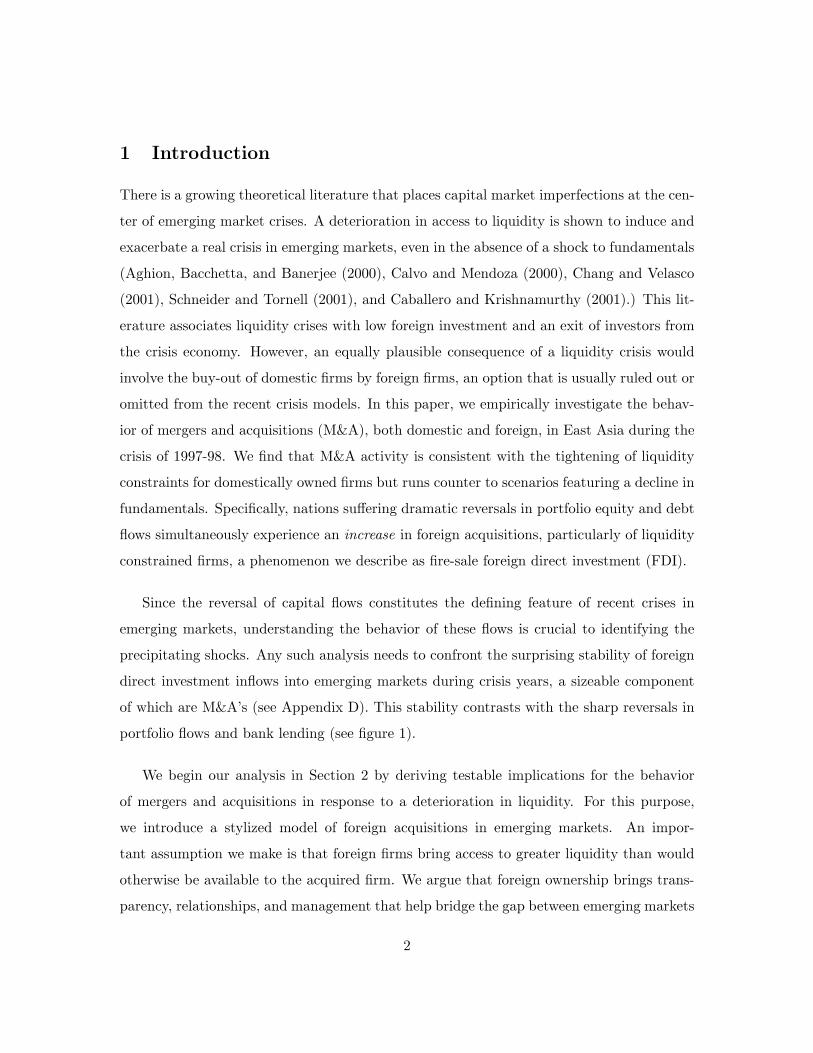
Figure 2 identi¯es the range of ¯rms acquired. The solid line denotes the combinations
of future productivity (A2) and liquidity (l ´ ¼1+ ¹D) which imply zero acquisition surplus,
all else equal. Firms that lie above this line will be acquired. For high enough A2, a domestic
¯rm will be acquired regardless of liquidity due to the superiority (and complementarity with
3We assume no constraint on foreign ownership's debt, but the important point is that the foreign ¯rm
enjoys a higher debt limit than the domestically owned ¯rm.4We assume the cost of reorganization does not vary according to foreign partner to avoid complications
arising from optimal matching.5Recall that the zero outside option for the foreign investor is only a simplifying assumption.
6
A2) of foreign technology. As we reduce available liquidity for a given A2, a domestically
owned ¯rm will eventually become constrained and have to forego pro¯table investment
opportunities. This widens the gap between V F and V D, making the acquisition e±cient.
In regard to price, an increase in A2, all else equal, increases VF more than V D due
to the superior technology employed by foreign ownership. This raises the surplus of the
acquisition and therefore increases the price of the acquired ¯rm. Similarly, extending
additional liquidity to a constrained ¯rm increases V D, reducing the gap between V F and
V D and raising the acquisition price. Of course, to an unconstrained ¯rm additional liquidity
has zero e®ect on the acquisition surplus.
2.1 Liquidity Crises and Testable Implications
Conceptually, we consider a liquidity crisis as a ceteris paribas decline in liquidity available to
domestically owned ¯rms. That is, conditional on ¯rm characteristics, domestically owned
¯rms as a group ¯nd it di±cult to borrow during the crisis, a premise that is consistent
with (but not necessarily implied by) the drop in capital in°ows depicted in ¯gure 1. We
do not model the origins of this capital market imperfection and why it may have been
exacerbated in 1997-1998, but instead derive its implications for cross-border acquisitions.
To be precise, we de¯ne a liquidity crisis as a \leftward shift" in the distribution of l
across ¯rms. Speci¯cally, let G0(l) denote the benchmark or \normal-period" cumulative
distribution of liquidity, conditional on A2, °, and other ¯rm-speci¯c characteristics (such
as K1), which we summarize as \µ". If G1(l) is the equivalent distribution during a liquidity
crisis, then our de¯nition implies that G0 \¯rst order stochastically dominates" (fosd) G1.
That is, G1(l) · G0(l) 8l, with a strict inequality for a set of l with positive probability.An equivalent de¯nition of fosd which we will use repeatedly is that
Rf(l)dG1 ·
Rf(l)dG0
for every nondecreasing function f(l).
Our ¯rst comparative static involves the number of acquisitions. Let Ni denote the
fraction6 of ¯rms acquired under Gi, i = 0; 1, where 1 is the crisis distribution. That is,
6We use terms such as \fraction" or \probability" of acquisition interchangeably with \number" of ac-
7
Ni ´Z Z
S¸0dGi(l)dH(A2; °; µ); (4)
where H is the distribution of ¯rm characteristics (A2; °; µ).
Proposition 1 If G0 fosd G1, then N0 · N1.
Proof: Let 1fxg equal one if x is true and zero otherwise. Then
Ni =
Z Z1fS¸0gdGi(l)dH(A2; °; µ): (5)
Conditional on other ¯rm characteristics, 1fS¸0g is nonincreasing in l. The de¯nition of
fosd implies thatR1fS¸0gdG0(l)¡
R1S¸0dG1(l) · 0. Integrating over other ¯rm-speci¯c
characteristics preserves this inequality, implying that N0 · N1.
The intuition is straight forward: as more ¯rms become constrained, more ¯rms will
be willing to pay the cost ° to gain access to foreign liquidity. While we do not model
portfolio investment explicitly, it is clear that the increase in acquisitions derived above
does not extend immediately to portfolio investment. As noted previously, we presume that
portfolio investment does not relax liquidity constraints due to the small and anonymous
nature of the transactions. Therefore, it would not be able to exploit the wedge between
foreign and domestic borrowing constraints.
We will discuss alternatives to liquidity shocks as the source of crises in Section 4.
However, in anticipation, we mention that the implications for N are the opposite if one
interprets the Asian crisis as a productivity slowdown. Given that 1fS¸0g is nondecreasing
in A2, a fosd shift down in productivity reduces the number of acquired ¯rms. As will
be discussed in Section 4, the dichotomy between a decline in liquidity versus a decline in
productivity holds for many of the implications derived in this section.
quisitions. The implication is that the measure of ¯rms is held constant across comparative statics.
8
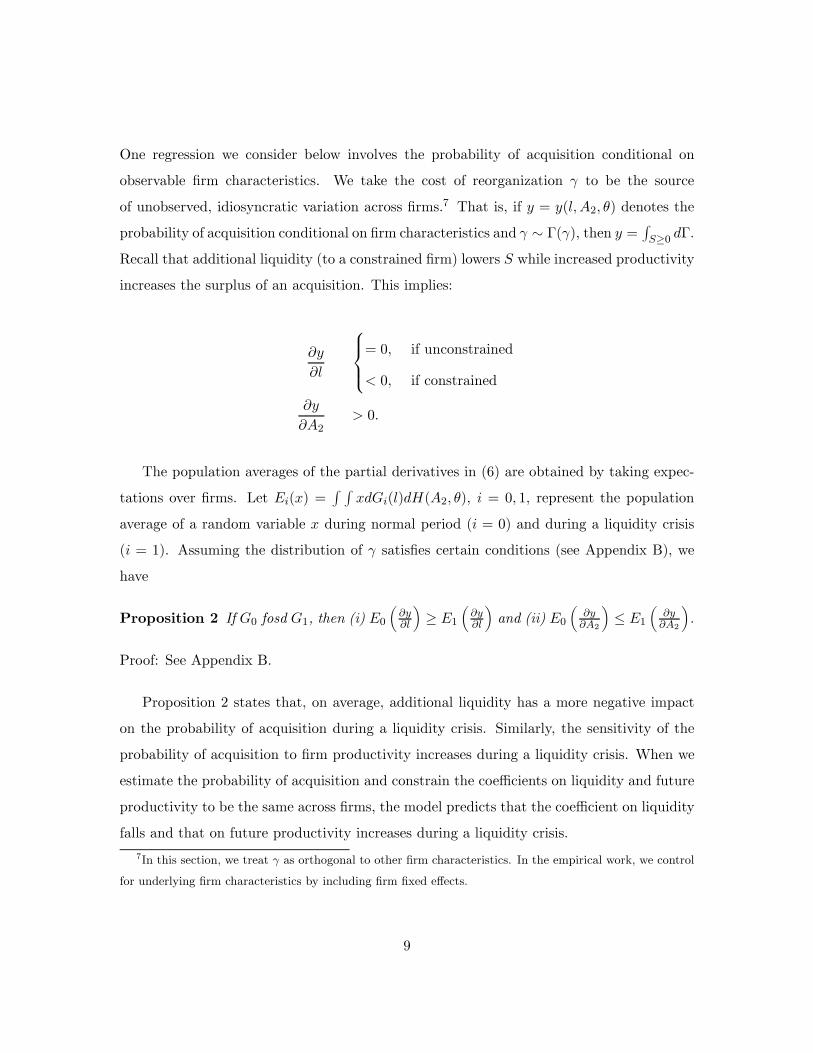
One regression we consider below involves the probability of acquisition conditional on
observable ¯rm characteristics. We take the cost of reorganization ° to be the source
of unobserved, idiosyncratic variation across ¯rms.7 That is, if y = y(l; A2; µ) denotes the
probability of acquisition conditional on ¯rm characteristics and ° » ¡(°), then y = RS¸0 d¡.Recall that additional liquidity (to a constrained ¯rm) lowers S while increased productivity
increases the surplus of an acquisition. This implies:
@y
@l
8><>:= 0; if unconstrained
< 0; if constrained
@y
@A2> 0:
The population averages of the partial derivatives in (6) are obtained by taking expec-
tations over ¯rms. Let Ei(x) =R R
xdGi(l)dH(A2; µ), i = 0; 1, represent the population
average of a random variable x during normal period (i = 0) and during a liquidity crisis
(i = 1). Assuming the distribution of ° satis¯es certain conditions (see Appendix B), we
have
Proposition 2 If G0 fosd G1, then (i) E0
³@y@l
´¸ E1
³@y@l
´and (ii) E0
³@y@A2
´· E1
³@y@A2
´.
Proof: See Appendix B.
Proposition 2 states that, on average, additional liquidity has a more negative impact
on the probability of acquisition during a liquidity crisis. Similarly, the sensitivity of the
probability of acquisition to ¯rm productivity increases during a liquidity crisis. When we
estimate the probability of acquisition and constrain the coe±cients on liquidity and future
productivity to be the same across ¯rms, the model predicts that the coe±cient on liquidity
falls and that on future productivity increases during a liquidity crisis.
7In this section, we treat ° as orthogonal to other ¯rm characteristics. In the empirical work, we control
for underlying ¯rm characteristics by including ¯rm ¯xed e®ects.
9
In terms of the price of an acquisition, a liquidity crisis will lead to a fall in the average
price of the domestic ¯rm. That is, constrained ¯rms have a less valuable outside option
(V D), all else equal, and thus a lower price. The more constrained ¯rms in the popula-
tion, the lower the average price all else equal. Moreover, as noted at the end of the last
subsection, liquidity in°uences the surplus of an acquisition only if the domestic ¯rm is
constrained. Thus, the average sensitivity of price to liquidity increases during a liquidity
crisis. Conversely, an increase in A2 has a limited impact on VD if a ¯rm is constrained
as it cannot make full use of the improved productivity. As the sensitivity of V F to A2
remains the same regardless of domestic liquidity, the average price of an acquired ¯rm is
less sensitive to growth prospects during a liquidity crisis. Speci¯cally:
Proposition 3 If G0 fosd G1, then (i) E0¡@P@l
¢ · E1 ¡@P@l ¢ and (ii) E0 ³ @P@A2
´¸ E1
³@P@A2
´.
Proof: See Appendix B.
The empirical implication of proposition 3 concerns a regression of price on liquidity and
growth prospects, conditional on other ¯rm characteristics. The coe±cient on liquidity
should increase and that on future productivity should decrease during a liquidity crisis.
Given the above discussion, the empirical predictions of a liquidity crisis can be sum-
marized as follows.
(i) The number of acquisitions increases during a liquidity crisis;
(ii) On average, the sensitivity of the conditional probability of acquisition to ¯rm liquidity
declines (becomes more negative) during a liquidity crisis;
(iii) On average, the sensitivity of the conditional probability of acquisition to future pro-
ductivity increases during a liquidity crisis;
(iv) The average price of an acquisition declines during a liquidity crisis;
(v) On average, the sensitivity of the price of an acquisition to ¯rm liquidity increases during
a liquidity crisis;
10
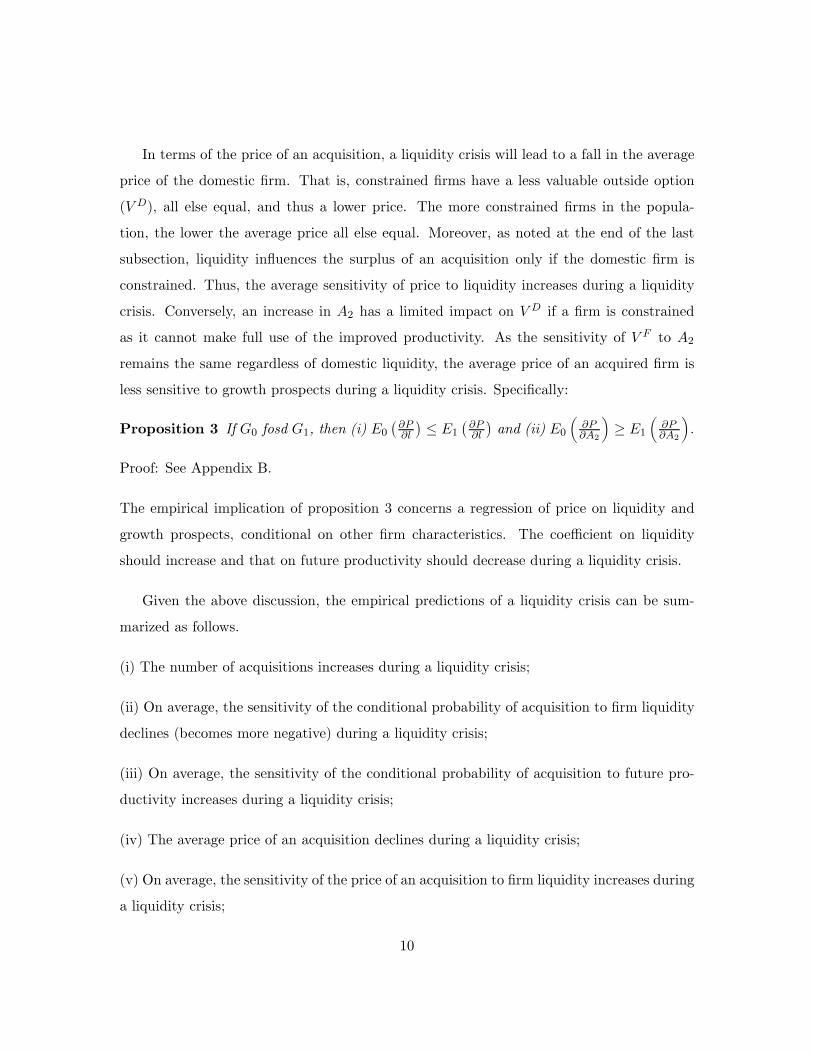
(vi) On average, the sensitivity of the price of an acquisition to future productivity declines
during a liquidity crisis.
3 Empirical Results
3.1 A brief chronology of the Asian crisis
Our empirical work focuses on ¯ve East Asian nations: South Korea, Thailand, Indonesia,
Malaysia, and the Philippines. These were the nations hit hardest by the Asian crisis of
1997. As background, these ¯ve countries experienced relatively high growth rates in the
1980s and the ¯rst half of the 1990s (see Corsetti, Pesenti, and Roubini (1998)). This growth
was accompanied by gradual but signi¯cant increases in foreign capital °ows. Moreover,
domestic bank lending increased dramatically in the early 1990s. In 1997, the domestic
¯nancial systems began to weaken in many East Asian economies, a development followed
by large capital out°ows. Thailand abandoned its currency peg in July of 1997, quickly
followed by devaluations in Indonesia, Malaysia, and the Philippines. South Korea initially
avoided the capital out°ows experienced by the Southeast Asian countries. However, capital
began to °ow out of Korea in the fall of 1997 and it was forced to devalue its currency in
November of that year. In all cases except the Philippines (which recorded zero growth),
output contracted substantially in 1998, ranging from a 6% drop in Korea to a dramatic
decline of 13% in Indonesia.
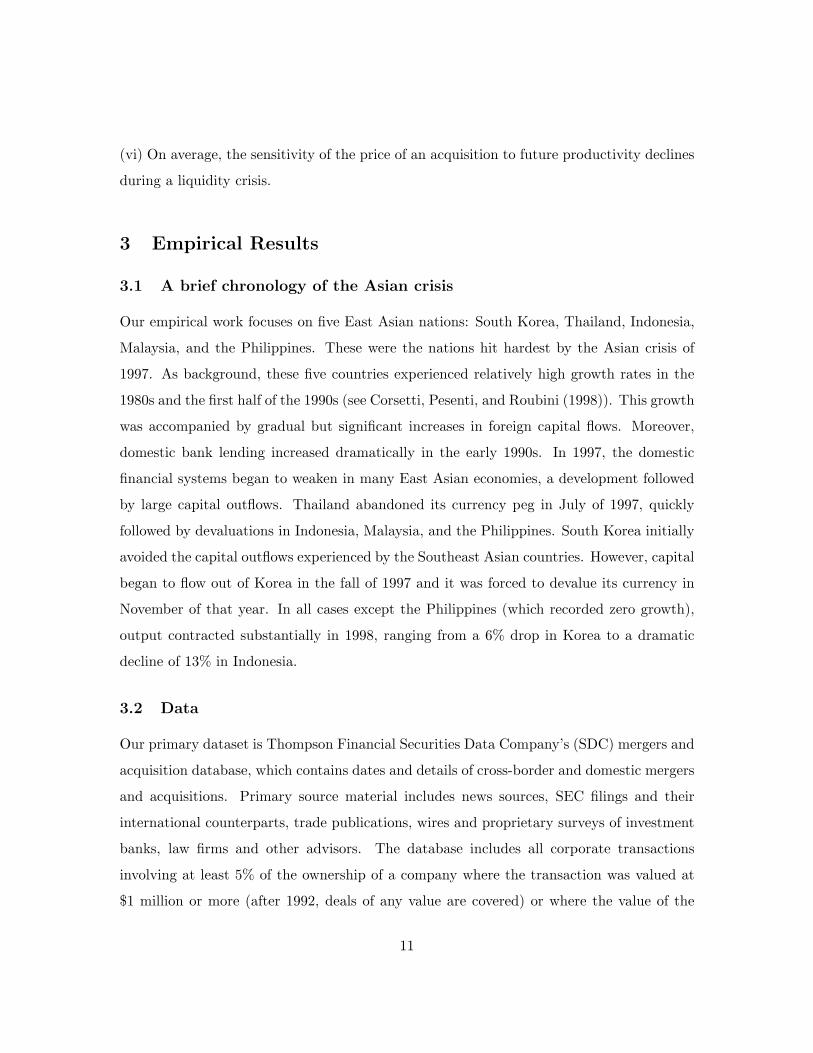
3.2 Data
Our primary dataset is Thompson Financial Securities Data Company's (SDC) mergers and
acquisition database, which contains dates and details of cross-border and domestic mergers
and acquisitions. Primary source material includes news sources, SEC ¯lings and their
international counterparts, trade publications, wires and proprietary surveys of investment
banks, law ¯rms and other advisors. The database includes all corporate transactions
involving at least 5% of the ownership of a company where the transaction was valued at
$1 million or more (after 1992, deals of any value are covered) or where the value of the
11
transaction was undisclosed. Public and private transactions are covered. SDC also reports
numerous details about the target and acquiring ¯rm, including income and balance sheet
items, industry, and ownership. For each ¯rm acquired, SDC reports ¯ve years of historical
data, allowing the construction of a panel of acquired ¯rms.
We begin our sample in 1986 (the ¯rst year for which data is available) and include all
mergers and acquisitions through the end of 2001. The start date is not highly restrictive
given that very few mergers occurred prior to this year. In total, we have close to 6,000
completed deals, roughly one third of which involve a foreign acquiror.8 Forty-¯ve percent
of deals involve a private target, with public ¯rms and subsidiaries accounting for a quarter
each. The remainder consists of government ¯rms (1%) and joint-ventures (4%). Many of
the regressions below require income statement and balance sheet data that are unavailable
for privately held ¯rms. Therefore, the regression samples are weighted towards publicly
held ¯rms.
We take the announcement date as the date of the merger or acquisition. Although
mergers may, in theory, be considered a mutual acquisition, SDC always identi¯es a \target
¯rm" and acquiring ¯rm(s). We use the term acquisition loosely to describe all purchases
contained in the database, even though many transactions involve only a fraction of shares
outstanding. Table 1 reports the distribution of the shares involved in cross-border acqui-
sitions. The median purchase involves 49% of the ¯rm, with over a quarter involving the
entire ¯rm. Ten percent of the deals fall short of meeting the usual FDI de¯nition of 10%
of outstanding equity.
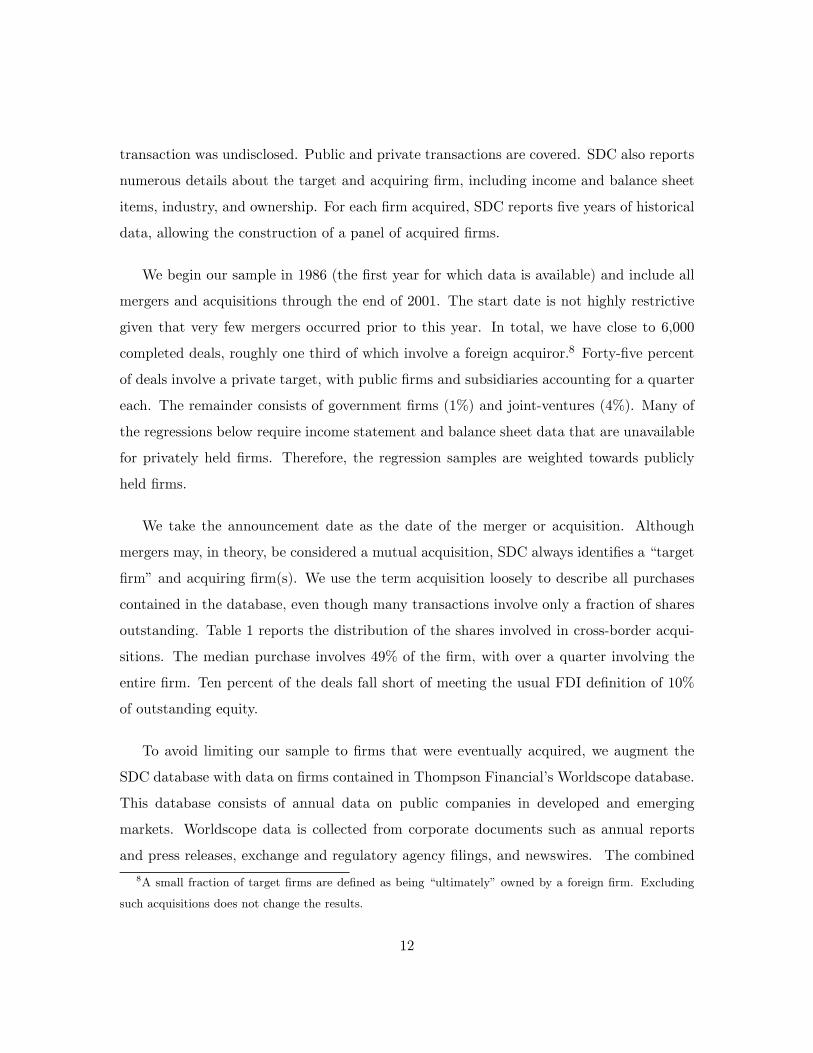
To avoid limiting our sample to ¯rms that were eventually acquired, we augment the
SDC database with data on ¯rms contained in Thompson Financial's Worldscope database.
This database consists of annual data on public companies in developed and emerging
markets. Worldscope data is collected from corporate documents such as annual reports
and press releases, exchange and regulatory agency ¯lings, and newswires. The combined
8A small fraction of target ¯rms are de¯ned as being \ultimately" owned by a foreign ¯rm. Excluding
such acquisitions does not change the results.
12
sample contains over 6,500 ¯rms. We feel this set of ¯rms accurately re°ects the universe
of ¯rms relevant for a study of cross-border acquisition { the omitted ¯rms being privately
held enterprises that were never involved in an acquisition or smaller publicly held ¯rms
that do not merit inclusion in an international database.
Table 2 summarizes key ¯nancial details of the ¯rms used in the regressions below. All
variables are reported in (log) million dollars and the precise de¯nitions of accounting terms
are provided in Appendix A.
3.3 The Probability of Acquisition
The ¯rst prediction of our theoretical model is that the number of cross-border acquisitions
should increase during a liquidity crisis. A simple plot of the number of acquisitions supports
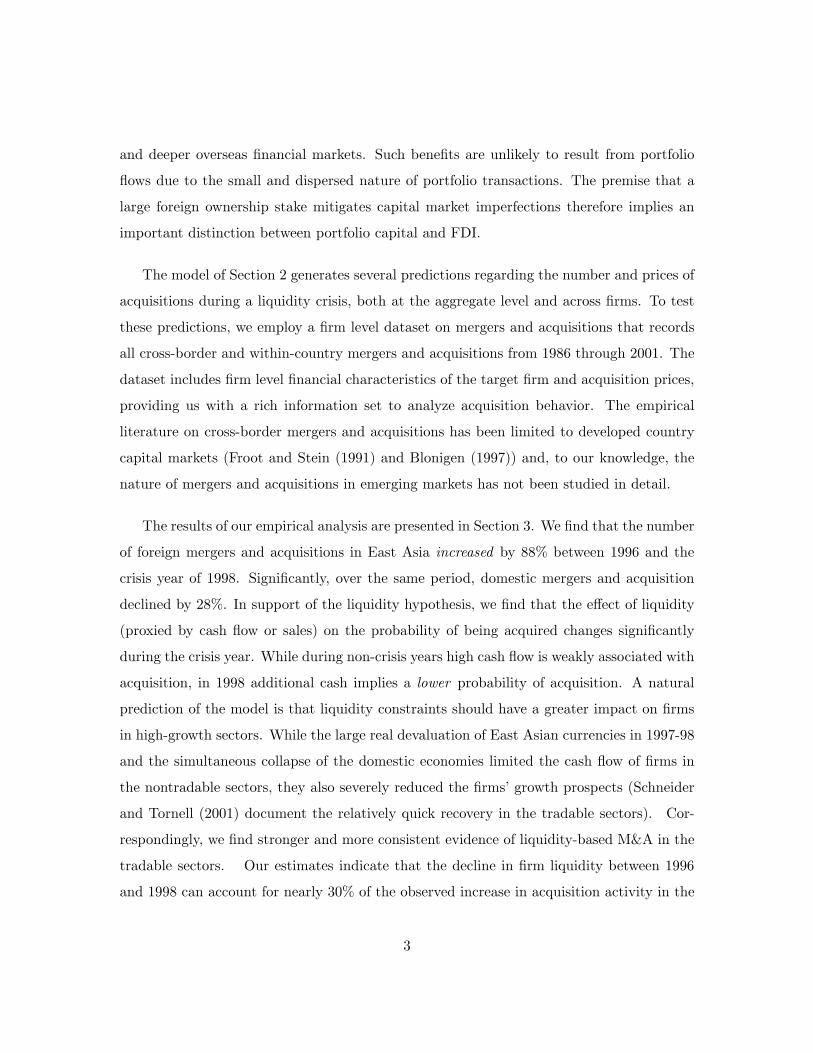
this prediction. Figure 3 plots the number of acquisitions of domestic ¯rms by foreign
companies (solid line) summed over the ¯ve Asian countries9 and arranged by the year
in which the acquisitions were announced.10 The dashed line reports the number of
acquisitions of domestic ¯rms by domestic companies for comparison. The upward trend
in mergers and acquisitions from the start of the period is apparent in the plot. Moreover,
there is a sharp uptick in acquisitions by foreign companies in 1998, the ¯rst full year
immediately after the onset of the crises in mid- and late-1997. There is an 88% increase
in foreign acquisitions between 1996 and 1998, with most of the increase taking place in
1998. Interestingly, the number of acquisitions by other domestic ¯rms declines by 28% over
this same period. While not explicitly modeled in Section 2, a straight forward extension
indicates that the drop in domestic-domestic acquisitions follows if the binding constraint
on the number of domestic mergers is the pool of potential acquiring ¯rms located within
9The country-level times series of acquisitions look substantially like the aggregated data. Two exceptions
are the fact that foreign acquisitions in Indonesia are constant between 1997 and 1998 and domestic-domestic
acquisitions increase in Korea in 1998.10Figure 3 includes all completed acquisitions. We include all purchases of the target's equity, regardless
of the percentage of shares involved, as this value is missing for many acquisitions. Restricting to deals in
which over ¯fty percent of the target's equity is purchased yields a similar picture.
13
the country.
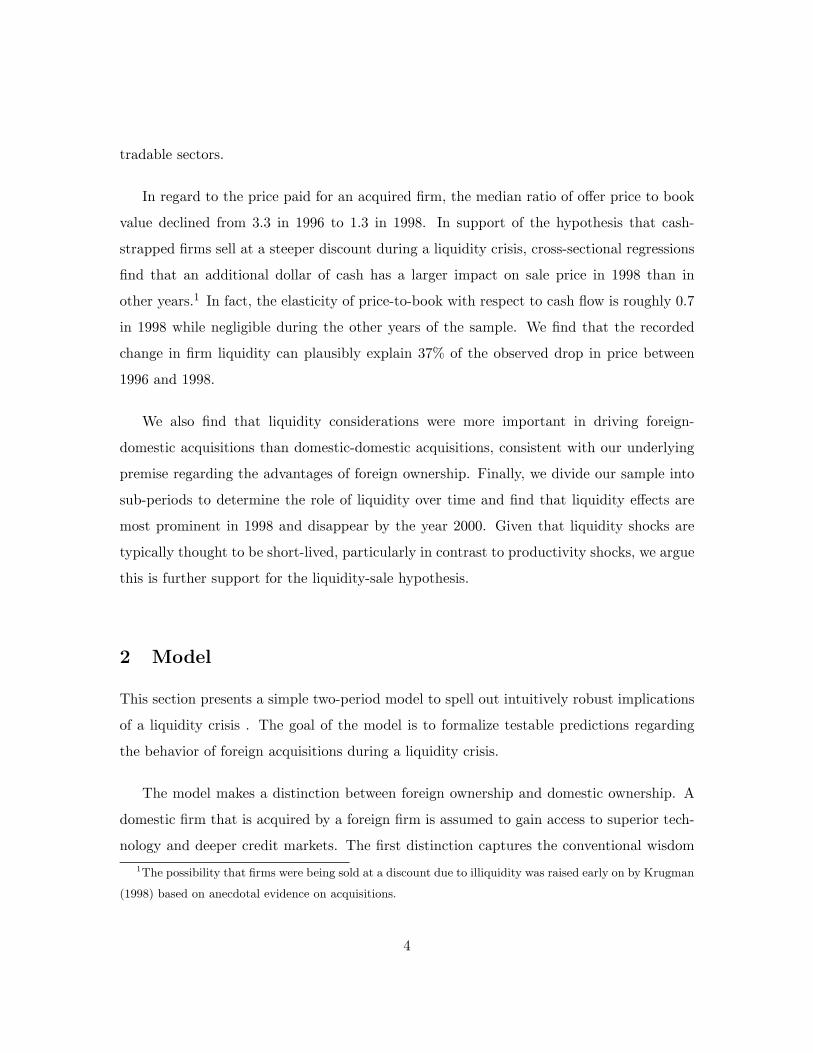
Figure 4 plots the number of foreign-domestic acquisitions according to whether the
target ¯rm is involved in tradable (solid line) versus nontradable production. We de¯ne
tradable sectors as manufacturing (3-digit SIC codes 200-399) and nontradable as the re-
maining sectors. While admittedly crude, this distinction captures the traditional wisdom
that real devaluations impact manufacturing di®erently than services, retail, etc. One may
consider such nonmanufacturing sectors as agriculture and natural resources to be tradable,
but these sectors are a negligible percentage of the sample. Both tradable and nontradable
sectors experience an increase in acquisitions in 1998, however, the number and percentage
increase in foreign acquisitions in the tradable sectors (137%), was far greater than the
increase in the nontradable sectors (63%). The large devaluation combined with the drop
in domestic demand reduced cash °ow for nontradable ¯rms but also restricted investment
opportunities, limiting the role for foreign capital despite the reduced sales revenue.
To explore more systematically whether liquidity is driving the patterns observed in
¯gure 3, we estimate a number of linear probability regressions using the panel of ¯rms
described in Section 3.2. (See Appendix C for the results of logit and conditional logit
regressions. The results stay substantially the same). Our probability regressions take the
form:
yjict = ®0 + ®Xjict + ±Xjict ¤D98 +Djict + "jict: (6)
The dependent variable yjict is an indicator variable which takes the value one if ¯rm j
in industry i in country c is acquired in year t by a foreign ¯rm, and takes the value
zero otherwise.11 We explore acquisitions by other domestic ¯rms in Section 3.5.2. Our
regressors X are measures of ¯rm liquidity and potential growth while D is a vector of
11SDC identi¯es the status of the acquisition at the date of announcement, with the vast majority of
the sample being coded \Completed" or \Pending". The results are similar if we include all announced
acquisitions or include only those identi¯ed as completed. In our probability regressions, we report results
for the sample restricted to completed acquisitions only.
14
\¯xed-e®ect" dummy variables. We will discuss the content ofX andD below. The variable
D98 is a dummy variable for the year 1998. We take that year { the ¯rst full year after
the devaluations of mid- and late-1997 { as our crisis period. In Section 3.5.1 we explore
whether the crisis includes additional years as well. The vector ± therefore represents the
change in acquisition sensitivity to ¯rm liquidity and growth during the crisis.
Our primary measure of ¯rm liquidity is log cash °ow reported for the most recent ¯scal
year. Cash °ow is a traditional measure of liquidity and represents the °ow of cash from
operations available to a ¯rm during a given year.12,13 The de¯nition of cash °ow di®ers
slightly between the SDC and Worldscope databases (see de¯nitions in Appendix A). To
verify this di®erence does not in°uence our estimates, we include results using net sales
in place of cash °ow. Net sales has a common de¯nition in both databases and is highly
correlated with cash °ow. (Appendix C reports results using net worth as an alternative
measure of liquidity.) One concern with the use of cash °ow or sales as a measure of liquidity
is that it may also be associated with other relevant (but unobserved) ¯rm characteristics.
We will correct for some of this omitted variable bias through ¯xed e®ects discussed below.
To the extent that ¯rm type is time varying and correlated with cash °ow, higher cash
°ow may be associated with a higher probability of acquisition if it signals strong ¯rm
fundamentals. On the other hand, our liquidity model implies that higher cash °ow should
have a negative e®ect on the probability of being acquired, as the surplus generated form
a merger is lower. To isolate the e®ect due to liquidity, we will compare the change in the
coe±cient of cash °ow during the crisis year to the coe±cient estimated from the rest of
the sample.
Capital expenditures (investment) is used as a proxy for growth opportunities (as in
Olley and Pakes (1996) and Pavcnik (2002)). That is, we assume that a ¯rm that is
investing in new physical capital faces relatively strong growth prospects. We do not use
12Replacing log cash °ow with the log ratio of cash °ow to assets does not signi¯cantly change the analysis,
but does reduce the sample size due to the fact that assets are not reported for every year. In any event,
the ¯rm ¯xed e®ects discussed below control for the average size of the ¯rm.13For surveys, see Bernanke et al (1998) and Hubbard (1998).
15

the more traditional measure of Tobin's Q as many of our ¯rm's are not listed and the
market prices we do observe are in°uenced by the potential/announcement e®ect of an
acquisition. Replacing capital expenditures with sales growth to measure growth prospects
yields similar results.
The probability of an acquisition obviously may vary with other characteristics of the
¯rm not contained in the database. To limit the impact of omitted variables we include
¯rm and year ¯xed e®ects, i.e. D = (Dj ;Dt) is a vector of ¯rm and year dummies. Thus
we only use the time series variation in ¯rm characteristics in predicting the probability of
acquisition. The ¯xed e®ect will not be su±cient if liquidity is correlated with omitted time-
varying ¯rm characteristics (year dummies control for any time-varying aggregate variables).
However, we will compare the coe±cient on cash °ow for the crisis year with other years,
di®erencing out the general correlation with omitted variables. The remaining bias, if any,
will result from changes to the correlation in the crisis year (a possibility we will discuss in
Section 4).
As an alternative to ¯rm ¯xed e®ects, we also specify D to be a vector of indicator
variables fDictg representing the triplet of (industry, country, year). That is, we includeindicator variables for industry (at the 3-digit SIC level), country and year and all interac-
tions of these variables. This ¯xed e®ect controls for any changes in government policies,
relative prices, economic prospects and other such omitted variables that may vary across
industries, countries and across time.
Note that the two alternative ¯xed e®ects, Dj and Dict, imply very di®erent regressions
{ the former is essentially comparing a ¯rm to itself over time, the latter exploits the cross-
section of companies in a particular 3-digit industry in a particular country in a particular
year. Despite this di®erence, we show below that the conclusions from the two ¯xed-e®ect
speci¯cations are substantially the same.
The model of liquidity introduced in Section 2, and summarized in statements (ii) and
(iii) at the end of Section 2.1, implies ±cash °ow < 0 and ±capital expenditures > 0. Tables 3
16
and 4 report the results of the benchmark probability regressions speci¯ed in (6). Standard
errors adjusted for heteroscedasticity are reported in parentheses. In each table, columns (1)
and (3) utilize ¯rm and year ¯xed e®ects while (2) and (4) control for industry¤nation¤yearinteractions. Table 3 includes all completed foreign acquisitions and table 4 restricts the
sample to acquisitions in which the target ¯rm is in a tradable sector.
In speci¯cations using all sectors, the dummy for 1998 interacted with liquidity is always
negative, with the di®erence exceeding standard signi¯cance levels in two of four cases.
The magnitude of the decline is similar across all speci¯cations, as well. This pattern is
much stronger in both magnitudes and statistical signi¯cance in the traded sectors (table
4). While liquidity plays a positive or negligible role in predicting acquisition in noncrisis
years, liquidity's e®ect becomes signi¯cantly more negative in 1998. (The total e®ect of
liquidity on acquisition is signi¯cantly negative in speci¯cations 2-4 of table 4.)
Capital expenditure is intended to capture the growth prospects of a ¯rm. The model
predicts that the coe±cient on this variable should increase during the crisis year. As
with liquidity, the results are strongest for the tradable sectors. As predicted, the role of
capital expenditure signi¯cantly increases during the crisis year in table 4. The magnitude
of the increase in this relationship during the crisis, ±capital expenditure, relative to the base
coe±cient tends to be large.
3.4 Price of acquisitions
An important element of liquidity-forced sales is that constrained ¯rms are being sold at a
discount. In terms of Section 2's model, liquidity constrained ¯rms have diminished outside
options, reducing the Nash bargaining price of acquisition. Figure 5 plots the median ratio
of the price of acquisition (o®er price) to book value of assets against year of acquisition
(solid line). The dashed line is the ratio of o®er price to market price, where market price is
de¯ned as the closing share price four weeks prior to the announcement of the acquisition.
The plot clearly indicates that the price of acquired ¯rms (relative to book value) declines
17
dramatically in 1998. The market price also declines sharply, leaving the ratio of o®er price
to market price largely unchanged.
To determine whether liquidity plays a role in this price decline, we estimate for an
acquired ¯rm j in industry i in country c at time t;
pjict = ¯0 + ¯Xjict + µXjict ¤D98 +Dict + ujict: (7)
The dependent variable, pjict; is the log ratio of o®er price to book value reported by SDC
and X, as before, represents cash °ow (or sales) and capital expenditures. As before, we
control for industry, time, country variations by including an indicator for each variable
and all its interactions. Since we have only one price observation per ¯rm, we cannot use
¯rm level ¯xed e®ects. However, we scale by log assets to control for the size of ¯rms.
According to statements (iv) and (v) in Section 2, we should expect µcash °ow > 0 and
µcapital expenditures > 0.14
Table 5 reports the results. Columns (1)-(3) use all acquisitions and columns (4)-(6)
restrict the sample to tradable ¯rms.15 In all speci¯cations, the evidence supports the
importance of liquidity during the crisis. Consistent with our probability regressions, the
e®ect is largest in the tradable sectors. In particular, the base coe±cients on log cash °ow
and log sales are never signi¯cantly di®erent from zero. However, the interaction with the
1998 dummy is always large and signi¯cantly positive, indicating that relative liquidity in
1998 exerted an unusually strong in°uence on the cross-section of prices.
14Of course, the sample for our price regressions is restricted to ¯rms that have been sold. However, this
conditionality is explicit in the derivation of statements (iv) and (v) in Section 2.15Since not every acquisition reports a transaction price, we augment the regression sample by pooling all
(foreign and domestic) acquisitions for which there is data.
18
3.5 Further Tests
3.5.1 Testing across Sub-periods
To test if liquidity plays a role outside of 1998, we divide our tradable sample into sub-
periods and estimate separate regressions for the periods 1986-1996, 1997, 1998, 1999, and
2000-2001.16 The results, reported in Table 6, indicate that 1998 is indeed a unique year.
This year is the only year in which both sales and capital expenditure enter signi¯cantly
in the pattern predicted by our model. The coe±cient on sales is large and negative in
1998. The only other year in which sales plays a signi¯cantly negative role is 1999 and the
magnitude is reduced relative to that of 1998. As one would expect of a liquidity crisis
(and unlike a shock to productivity), the e®ects are short-lived and are no longer present
by 2000.
3.5.2 Domestic and Nontradable Acquisitions
Table 7 explores the role of liquidity and growth in acquisitions by domestic ¯rms and ac-
quisitions of ¯rms in nontradable sectors. Recall from ¯gure 3 that the number of foreign
acquisitions increased in 1998, while domestic-domestic acquisitions declined. Similarly, ta-
ble 7 documents additional di®erences between the two types of acquisitions. In particular,
the change in the coe±cient on sales during the crisis is negative, but smaller than those
reported for foreign acquisitions in table 3 and not signi¯cantly di®erent from zero. Simi-
larly, the signi¯cantly positive increase in sensitivity to capital expenditures seen in foreign
acquisitions during the crisis is not apparent in domestic acquisitions. These results suggest
that liquidity considerations were more important in driving foreign-domestic acquisitions
relative to domestic-domestic acquisitions. Similarly, liquidity and capital expenditures
have little predictive power in regard to foreign acquisition of ¯rms in nontradable sectors,
as reported in columns (3) and (4) of table 7.
16We only estimate industry¤nation¤year ¯xed e®ects as our year-by-year speci¯cations have no time-seriesdimension.
19
3.5.3 Magnitudes
To assess the quantitative importance of the drop in liquidity in driving the increase in acqui-
sition between 1996 and 1998, consider that the unconditional (tradable sample) probability
of acquisition increased from 0.3% to 3.3%, an increase of 3 percentage points. Over the
same period, median (and mean) log sales fell by roughly 0.35 (i.e. sales fell 35%). Ac-
cording to the 1998 estimates reported in table 6, this drop in log sales predicts an increase
in the probability of acquisition of 0.8 percentage points, or roughly 27% of the observed
increase.
From the price regressions, we have that the median log price to book declined from 1.54
in 1996 to 0.47 in 1998. If we use log(sales/assets), where we normalize by assets to control
for the size of the acquisition, the price regression sample median declines by 44% between
1996 and 1998. Table 5 reports an elasticity of 0.83, implying a drop in log price to book
of 0.36, or 34% of the observed fall in log price. The median log price to book declined by
0.8 in the tradable sample, with a corresponding decline of 0.50 in log(sales/assets). Our
estimated elasticity of 1.8 implies a predicted decline of 0.9 in log price to book, or more
than 100% of the observed fall. The estimated magnitude of the e®ect of liquidity on
the price of acquisitions, however, should be viewed cautiously, given that the regression
sample for which we have price data is limited17 and the change in liquidity for all the ¯rms
acquired can be very di®erent from that in the regression sample. For instance, median
log(cash/assets) declined by 50% in the sample of ¯rms that were acquired in 1998, as
compared to 1996. However, in our regression sample log(cash/assets) increases slightly.
This anomaly re°ects the small number of ¯rms that report a price and cash °ow number.
17While we have over 1,000 foreign and domestic deals (including both completed and pending deals) in
1996 and 1998, we have 61 ¯rms in 1996 and 67 in 1998 that report both price and cash °ow (for sales, the
respective numbers are 67 and 81).
20
4 Discussion
The preceeding section documents that the behavior of mergers and acquisitions during the
Asia crisis is consistent with a liquidity crisis as de¯ned in Section 2. One striking feature
of the pattern of M&A is that liquidity e®ects are most prominent in acquisition of ¯rms in
the tradable sectors. Both in our sample of ¯rms and in the economies in general, tradable
sectors experienced relatively rapid recoveries in 1998 and 1999, as predicted by textbook
models of real devaluations. As noted in Section 2, growth prospects are important in
determining whether liquidity constraints bind. While nontradable sectors faced a drop in
sales during the crisis, their weak prospects make them relatively less appealing to foreign
acquirors.
Undoubtedly, tradable ¯rms possess some advantages in attracting foreign investors. It
might be argued that tradable ¯rms were able to expand because they enjoyed continued
access to foreign capital markets, making it problematic to argue such ¯rms were constrained
(e.g. Tornell and Westermann (2001)). However, our results are not inconsistent with this
scenario. We test whether liquidity predicts which tradable ¯rms are acquired in a crisis
and ¯nd a large and signi¯cant e®ect. The fact that tradable ¯rms were able to record
relatively healthy growth rates in the years immediately after the devaluations implies that
these ¯rms were (at least partially) able to overcome any capital market imperfections;
our results show that mergers with foreign ¯rms was one mechanism through which ¯rms
ensured access to foreign capital markets.
In arguing that our results support a liquidity crisis interpretation of the Asian crisis,
we need to consider whether alternative explanations explain the same set of facts. One
plausible alternative hypothesis would be that the crisis was in response to a shock to
productivity. This includes explanations based on herding, such as Chari and Kehoe (2001),
in which investors perceive a negative shock to fundamentals.
In the terminology of Section 2, we can de¯ne a productivity crisis as a fosd shift down
in the distribution of A2. Such a drop in productivity leads to a fall in acquisitions as
21
few ¯rms have su±cient potential to make it e±cient to assess the superior technology or
liquidity o®ered by a foreign partner.18 Instead, we observe a dramatic increase in the
number of acquisitions.
Similarly, a productivity crisis yields counterfactual implications for the coe±cients in
our linear probability regressions. In particular, a general decline in productivity implies an
increase in the coe±cient on liquidity during the crisis. The intuition rests on the fact that
a productivity crisis limits investment opportunities, reducing the number of ¯rms that are
liquidity constrained (holding constant the distribution of liquidity). As constrained ¯rms
exhibit a negative relationship between acquisition and cash °ow, a reduction in the number
of constrained ¯rms leads to an increase in the average relationship between liquidity and
acquisition.19 The fact that the coe±cient on liquidity falls during the crisis runs counter
to this hypothesis.
Moreover, while a drop in productivity is consistent with the decline in the average
sale price, it fails to predict that cash °ow becomes more important during the crisis, as is
the case empirically. Again, in a productivity crisis, few ¯rms ¯nd themselves constrained,
making cash °ow less important in determining the price of a ¯rm. However, our estimates
indicate the role of liquidity in determining the price of an acquisition is enhanced during
the Asian crisis.
A second concern with our interpretation of the data may be the imperfect proxies for
liquidity and growth potential. In particular, as noted in Section 3, cash °ow is correlated
with ¯rm fundamentals other than liquidity. The ¯rm ¯xed e®ect controls for constant ¯rm
attributes. Of course, any time-varying omitted factors that are correlated with cash °ow
will be re°ected in the base coe±cient. However, the focus of this study is the change in
the coe±cient during 1998, which is sensitive only to the change in the corelation between
18The proof of this follows directly from the fact that the surplus of a match is nondecreasing in A2.
Therefore, a fosd shift down in the distribution of A2 leads to a fall in the average surplus.19To see this formally, note that in the model of Section 2, @2y
@A2@l· 0. Therefore, a fosd shift down in the
distribution of A2 increases the average@y@l.
22
cash °ow and omitted variables. While such a change in the relationship between cash °ow
and ¯rm fundamentals may occur, a mechanism that produces such a change as well as
accounts for the other empirical results presented above is not readily apparent.
For instance, it is plausible that cash °ow serves as a signal of the underlying productivity
of a ¯rm. This signal may become more informative during a crisis, perhaps due to the
fact that performance in an extreme environment yields a better signal of the strength
of a ¯rm. That is, high cash °ow in a crisis becomes a very positive signal about ¯rm
fundamentals. While this would accord with the price regressions in which cash-rich ¯rms
sold at an increased premium in 1998, the negative coe±cient on crisis cash °ow in table
3 would then imply that the increase in acquisitions in 1998 was motivated by increased
purchases of ¯rms suddenly revealed to be low productivity. Therefore, this mechanism
not only rests on the hypothesized change in correlation, but additionally and less plausibly
requires that foreign ¯rms shop for low quality partners. (See Aitken and Harrison (1999)for
evidence that foreign ¯rms target high productivity domestic partners.) In general, we ¯nd
hypotheses regarding cash °ow as proxy for fundamentals fail to plausibly explain the entire
set of facts documented in this paper.
Lastly, an issue to bear in mind is that government policies changed in the wake of the
crisis, particularly regarding foreign capital. For example, South Korea relaxed many re-
strictions regarding foreign direct investment while Malaysia imposed additional controls on
portfolio °ows. This may have some impact on the aggregate M&A numbers. However, in
our cross-sectional regressions, we include dummies for country*year*industry interactions.
This controls for any policy changes at the (3-digit) industry level, allowing us to identify
the e®ects of liquidity holding constant macro policies.
5 Conclusion
In this paper we investigate the relationship between liquidity crises and foreign acquisition
activity. In the existing theoretical literature, this incentive for capital in°ows has typically
23
been ruled out or omitted. We ¯nd that in the case of cross-border M&A in East Asian
economies liquidity played a signi¯cant and sizeable role in explaining the dramatic increase
in foreign acquisition activity and the consequent continued in°ow of FDI during the Asian
crisis. Similarly, ¯rm liquidity is shown to predict the price of acquisition, linking the
sharp fall in the median price of acquisitions to the decline in liquidity observed during
the crisis. The e®ects are most prominent in the tradable sectors. Moreover, proxies for
liquidity have a greater impact on the probability of acquisition and the price of acquisition
in 1998 than in other years in the sample. This is consistent with a liquidity crisis being
a short-term phenomenon. Lastly, as noted above, the implications of a liquidity crisis are
directly contrary to that of a productivity slowdown, either real or perceived, and this latter
hypothesis is thus contradicted by the data on M&A.
24

Appendix
A De¯nition of SDC Accounting Terms
Assets: Total balance sheet assets including, current assets, long-term investments and
funds, net ¯xed assets, intangible assets, and deferred charges, as of the date of the most
current ¯nancial information prior to the announcement of the transaction (million US$).
Equals total liabilities plus shareholders' equity plus minority interest.
Capital Expenditure: Gross purchases of property, plant, and equipment (million
US$). Does not include acquisition of other companies.
Cash Flow: SDC: Earnings before interest, taxes, depreciation and amortization for
the most recent ¯scal year prior to the announcement of the transaction (million US$).
Worldscope: Earnings before extraordinary items and preferred and common dividends,
but after operating and non-operating income and expense, reserves, income taxes, minority
interest and equity in earnings, plus all non-cash charges or credits.
Liabilities: All debt and obligations owed to creditors, including all current and long-
term liabilities (million US$).
Net Worth: Assets minus liabilities (million US$).
O®er Price/Book Value: O®ering price in the deal divided by target's book value
per share as of the date of the most current ¯nancial information prior to the announcement
of the transaction.
O®er Price/Market Value: Premium of o®er price to target trading price 4 weeks
prior to the original announcement date.
Sales: Primary source of revenue after taking into account returned goods and al-
lowances for price reductions (million US$). If not available, total revenues are used. For
banks, net sales equals interest income plus non-interest income.
25
B Additional Proofs
Proof of Proposition 2:
De¯ne °¤ ´ f°jS = 0g to be the ¯xed cost at which the surplus of a match is zero. Thatis, °¤ = V F¡V D. Then y = RS¸0 d¡ = R °¤° d¡ = ¡(°¤), where we assume that °¤ always lies
in the interior of the support of °. Di®erentiation implies @y@l = ¡0(°¤)
³@V F
@l ¡ @V D
@l
´· 0.
Di®erentiating again implies @2y@l2
= ¡1fconstrainedgA2F 00(K2)¡0(°¤) + ¡00(°¤)(¡0(°¤))2
³@y@l
´2. The
¯rst term is nonnegative (and positive if the ¯rm is constrained and ¡ is increasing). The
second term has the sign of ¡00. In the case that ° has a uniform distribution, ¡00 = 0.
More generally, as long as ¡00 is small over the support of °¤ (which is a subset of the
support of °), then @2y@l2
¸ 0. The usual stochastic dominance argument then implies (i)
in proposition 2. Similarly, @y@A2
= ¡0(°¤)¡ÁF (KF
2 )¡ F (KD2 )¢, which is strictly positive
(the superscripts on K2 indicate the capital stock under foreign and domestic ownership,
respectively). Di®erentiating with respect to l gives: @2y@l@A2
= ¡1fconstrainedgF 0(KD)¡0(°¤)+¡00(°¤)(¡0(°¤))2
³@y@l
´³@y@A2
´. The ¯rst term is nonpositive and strictly negative when the ¯rm is
constrained. Again, assuming that ¡ is close to linear, then @2y@l@A2
· 0 and our stochasticdominance assumption then implies (ii).
Proof of Proposition 3:
Recall that P = ¯S + V D = ¯¡V F ¡ V D ¡ °¢ + V D. An increase in ¼ raises V F and
an unconstrained V D one for one by the amount of additional pro¯t. If constrained, V D
increases by an additional (A2F0(l)¡ ±). Similarly, an increase in ¹D leaves V F unchanged,
but increases a constrained domestic ¯rm by (A2F0(l) ¡ ±). Given the concavity of F ,
this latter term is strictly decreasing in l over the constrained region (and zero otherwise).
Therefore, @P@l is nonincreasing in l and strictly decreasing over the constrained range. Our
fosd assumption then implies (i). Similarly, @P@A2
= ¯(F (KF ) + (1 ¡ ¯)F (KD), and so
@2P@l@A2
= 1constrained(1 ¡ ¯)(F 0(l)) ¸ 0, with a strict inequality if constrained. Our fosd
assumption then implies (ii).
26
C Additional Regressions
In this appendix we present additional regression results to complement those presented in
table 3. Table A1 includes log net worth as an alternative measure of liquidity in explaining
the probability of acquisition. Net worth captures the general health of the ¯rm's balance
sheet; a large literature links the balance sheet of a ¯rm on the ability to borrow in external
capital markets.20 While the amount of outstanding debt on a ¯rm's balance sheet may
also re°ect access to credit markets (as large debt implies ability to borrow), the ¯rm ¯xed
e®ect will control for any permanent cross-sectional heterogeneity in access to credit.
As in table 3, the dependent variable equals one when a ¯rm is acquired and zero
otherwise. The independent variables are as de¯ned in Appendix A. The ¯rst two columns
of table A1 replace log sales with log net worth, using ¯rm and industry¤nation¤year ¯xede®ects, respectively. The last two columns include both log sales and log net worth. In all
speci¯cations, the point estimates support our earlier results { the coe±cient on liquidity
falls during a crisis and the coe±cient on capital expenditures increases . The change in
the coe±cient on log net worth is signi¯cant when log sales is not included. If log sales
is included, precision falls due to the correlation between the two measures of liquidity.
Moreover, comparing table A1 with table 3, the estimated coe±cients on log sales and log
capital expenditures (both in normal periods and during the crisis) remain largely invariant
to the inclusion of log net worth as an additional regressor.
Table A2 presents the results from logit and conditional logit regressions to complement
the linear probability results presented in table 3. The ¯rst column con¯rms that the
sensitivity to liquidity and capital expenditure changes signi¯cantly during the crisis. For
each coe±cient we have computed the sample average of the implied slope (i.e. @y@X).
21
20See Bernanke et al (1998).21As is now standard, we compute the slope taking the sample average of the marginal e®ect evaluated
at each observation (see Green (2000) p. 816). The alternative procedure uses the density evaluated at the
average value of the independent variables. This latter calculation yields nearly identical marginal e®ects
for our sample.
27
These marginal e®ects are similar (although slightly smaller in magnitude) to the slopes
obtained in the linear probability regressions (table 3).
The conditional logit speci¯cation estimates the probability of acquisition conditional
on the number of acquisitions observed within the group, where column 2 uses the ¯rm to
de¯ne a group and column 3 uses industry¤nation¤year triplets as the group. One issuewith the conditional logit is that all groups in which the total number of acquisitions is
zero are dropped, limiting the sample size and reducing e±ciency if there is no underlying
group heterogeneity. In column 2 we see that sensitivities to liquidity change signi¯cantly
during the crisis in a manner that support the results of table 3. In both speci¯cations of
the conditional logit, the point estimates are very close to those in the unconditional logit.
In this regard, the conditional logit estimates do not indicate a bias in the unconditional
logit and a Hausman test fails to reject that the estimates are identical.22
D M&A and FDI
This appendix compares the magnitude of M&A activity to total FDI in°ows, highlighting
the di±culties in making a direct comparison. FDI in°ow is de¯ned as the purchase by
a foreign entity of 10% or more of outstanding equity of a domestic ¯rm, plus additional
in°ows from the foreign parent to the domestic ¯rm (through debt or equity) once the
initial equity purchase occurs. FDI encompasses the establishment of new ¯rms (green¯eld
investment) as well as purchases of existing ¯rms. Conceptually, one may consider a cross-
border acquisition that involves 10% or more of equity as FDI. However, it may not be
treated as such in balance of payments (BoP) accounting. For example, if an acquisition
uses funds raised in the domestic market (a debt out°ow matched by an equity in°ow) or
involves a swap of equity (an equity out°ow matched by an equity in°ow), the net e®ect
on the BoP is zero and the transaction is not registered as FDI. Therefore, M&A is not a
strict subset of FDI. (See World Investment Report (2000) for a full discussion).
22A Hausman test is the appropriate test in this context as the logit is e±cient in the absence of group
heterogeneity but inconsistent otherwise, while the conditional logit is consistent in either case.
28
In table A3, we express the value of M&A (that involve more than 10% of equity) as a
fraction of FDI. As discussed in the previous paragraph, this ratio is not bounded above by
one. The ¯rst two columns of numbers are taken from the UN's World Investment Report
(2000). The ¯nal two columns uses the amount of the acquisition price that was paid in
cash as reported by SDC. This excludes any equity swaps, but may include locally raised
cash. By both measures, M&A as a percentage of FDI was substantial for the East Asian
Economies during the crisis. The share is also higher for the year 1998 as compared to the
average of the 3 years.
29
References
[1] Aghion, Philippe, Philippe Bacchetta and Abhijit Banerjee (2000), \A simple model
of monetary policy and currency crises", European Economic Review, Vol. 44, 728-738.
[2] Aitken, Brian and Anne Harrison (1999), \Do Domestic Firms Bene¯t from Direct
Foreign Investment? Evidence from Venezuela", American Economic Review, Vol. 89,
No 3, 605-18.
[3] Bernanke, Ben, Mark Gertler and Simon Gilchrist (1998), \The Financial Accelerator
in a Quantitative Business Cycle Framework", NBER Working Paper 6455.
[4] Blomstrom, Magnus and Edward Wol® (1994), \Multinational Corporations and Pro-
ductivity Convergence in Mexico", in Convergence of productivity: Cross-national stud-
ies and historical evidence, Oxford University Press: 1994, 263-84.
[5] Blonigen, Bruce (1997), \Firm-Speci¯c Assets and the Link between Exchange Rates
and Foreign Direct Investment", American Economic Review, Vol. 87, No. 3, 447-65
[6] Caballero, Ricardo and Arvind Krishnamurthy (2001), \International and Domestic
Collateral Constraints in a Model of Emerging Market Crises", Journal of Monetary
Economics, Vol. 48, No 3, 513-48.
[7] Calvo, Guillermo and Enrique Mendoza (2000), \Capital-Market Crisis and Economic
Collapse in Emerging Markets: An Informational Frictions Approach", American Eco-
nomic Review, Papers and Proceedings, Vol. 90, No. 2, 59-64.
[8] Chang, Roberto and Andres Velasco (2001), \A Model of Financial Crises in Emerging
Markets", Quarterly Journal of Economics, Vol. 116, No 2, 489-517.
[9] Chari, V.V. and Patrick Kehoe (1997), \Hot Money", NBER Working Paper 6007.
[10] Corsetti, Giancarlo, Paolo Pesenti, and Noriel Roubini, \What Caused the Asian Cur-
rency and Financial Crisis? Part I: A Macroeconomic Overview" NBERWorking Paper
6833.
30
[11] Froot, Kenneth and Jeremy Stein (1991), \Exchange Rates and Foreign Direct Invest-
ment: An Imperfect Capital Markets Approach", Quarterly Journal of Economics Vol.
106, No 4, 1191-217.
[12] Green, William (2000), Econometric Analysis, Fifth Edition, Prentice Hall: 2000.
[13] Hubbard, R. Glenn (1998), \Capital-Market Imperfections and Investment", Journal
of Economic Literature, Vol. 36, No. 1, 193-225.
[14] Krugman, Paul (1998), \Fire-sale FDI", prepared for NBER Conference on Capital
Flows to Emerging Markets, Feb. 20-21, 1998, mimeo, MIT.
[15] Olley, Steve and Ariel Pakes (1996), \The Dynamics of Productivity in the Telecom-
munications Equipment Industry", Econometrica, Vol. 64, 1263-1297.
[16] Pavcnik, Nina (2002), \Trade Liberalization, Exit, and Productivity Improvements:
Evidence from Chilean Plants", The Review of Economic Studies, Vol. 69, 245-76.
[17] Schneider, Martin and Aaron Tornell (2001), \Boom-Bust Cycles and the Balance
Sheet E®ect", mimeo, UCLA.
[18] World Investment Report (2000), United Nations Conference on Trade and Develop-
ment.
[19] Tornell, Aaron and Frank Westermann (2001), \Boom-Bust Cycles: Facts and Expla-
nation", mimeo UCLA.
31
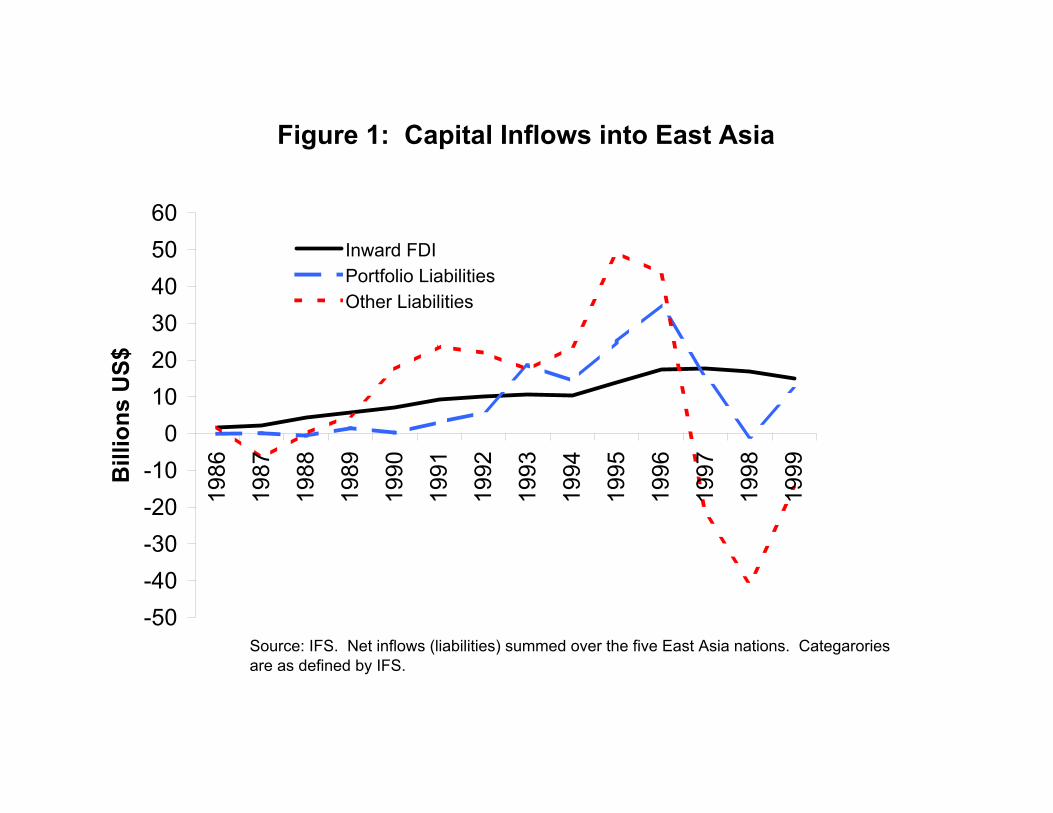
Figure 1: Capital Inflows into East Asia
-50-40-30-20-10
0102030405060
1986
1987
1988
1989
1990
1991
1992
1993
1994
1995
1996
1997
1998
1999Bill
ions
US$
Inward FDIPortfolio LiabilitiesOther Liabilities
Source: IFS. Net inflows (liabilities) summed over the five East Asia nations. Categarories are as defined by IFS.
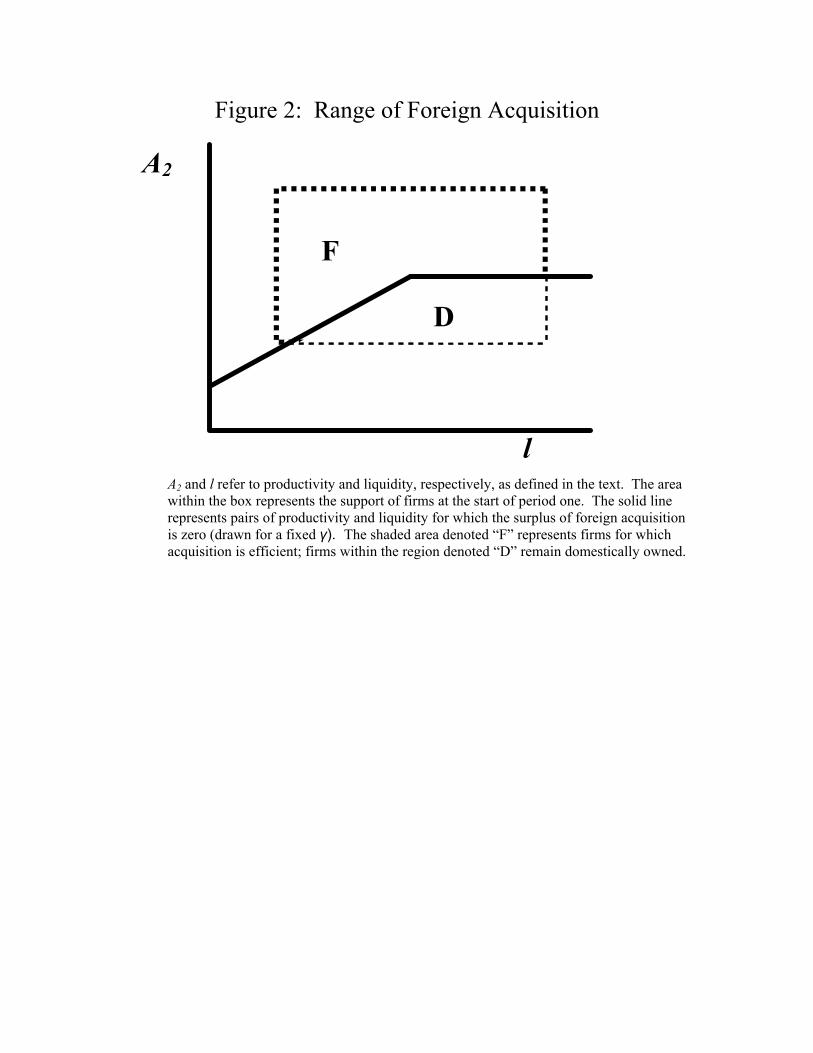
Figure 2: Range of Foreign Acquisition
l
A2
F
D
A2 and l refer to productivity and liquidity, respectively, as defined in the text. The area within the box represents the support of firms at the start of period one. The solid line represents pairs of productivity and liquidity for which the surplus of foreign acquisition is zero (drawn for a fixed γ). The shaded area denoted “F” represents firms for which acquisition is efficient; firms within the region denoted “D” remain domestically owned.
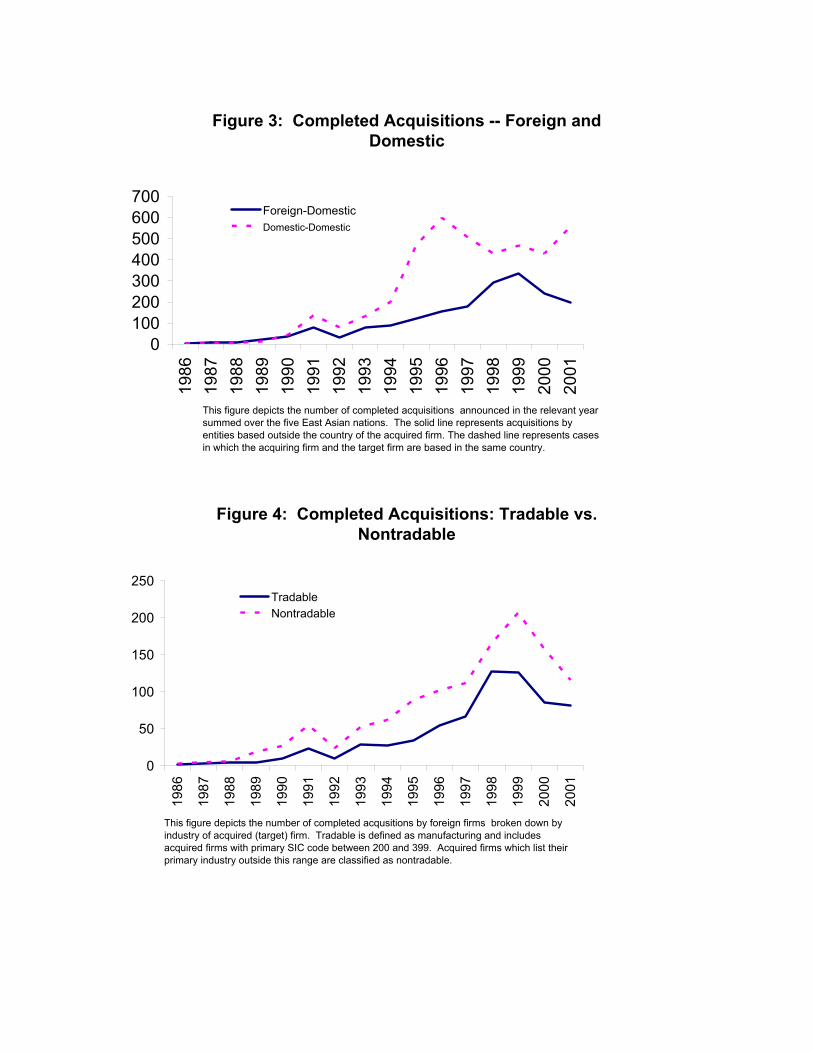
Figure 3: Completed Acquisitions -- Foreign and Domestic
0100200300400500600700
1986
1987
1988
1989
1990
1991
1992
1993
1994
1995
1996
1997
1998
1999
2000
2001
Foreign-DomesticDomestic-Domestic
This figure depicts the number of completed acquisitions announced in the relevant year summed over the five East Asian nations. The solid line represents acquisitions by entities based outside the country of the acquired firm. The dashed line represents cases in which the acquiring firm and the target firm are based in the same country.
Figure 4: Completed Acquisitions: Tradable vs. Nontradable
0
50
100
150
200
250
1986
1987
1988
1989
1990
1991
1992
1993
1994
1995
1996
1997
1998
1999
2000
2001
TradableNontradable
This figure depicts the number of completed acqusitions by foreign firms broken down by industry of acquired (target) firm. Tradable is defined as manufacturing and includes acquired firms with primary SIC code between 200 and 399. Acquired firms which list their primary industry outside this range are classified as nontradable.
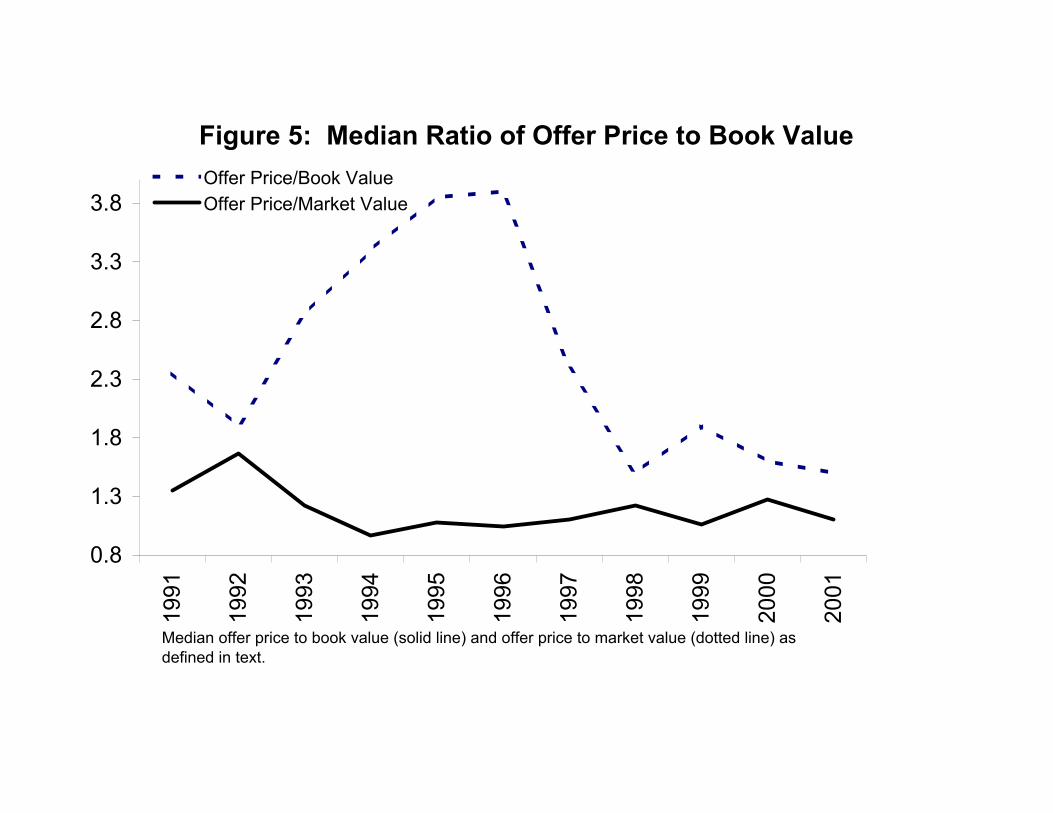
Figure 5: Median Ratio of Offer Price to Book Value
0.8
1.3
1.8
2.3
2.8
3.3
3.819
91
1992
1993
1994
1995
1996
1997
1998
1999
2000
2001
Offer Price/Book ValueOffer Price/Market Value
Median offer price to book value (solid line) and offer price to market value (dotted line) as defined in text.
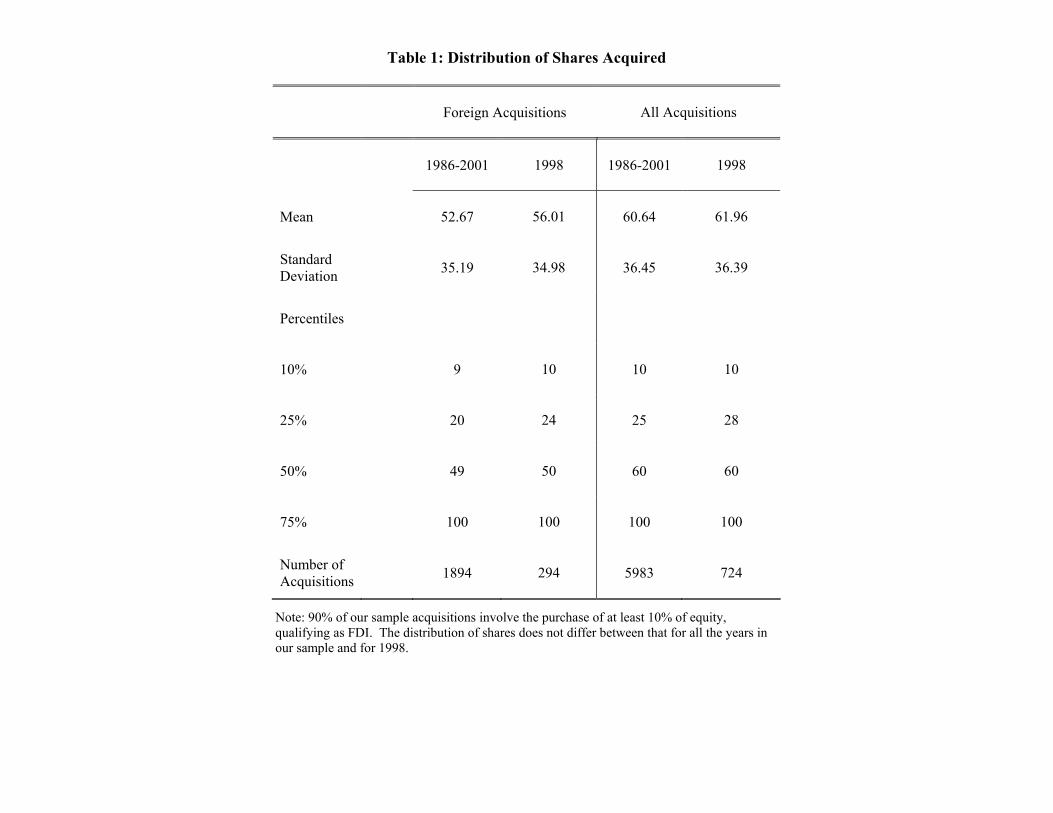
Table 1: Distribution of Shares Acquired
Foreign Acquisitions
All Acquisitions
1986-2001
1998 1986-2001
1998
Mean 52.67
56.01 60.64
61.96
Standard Deviation 35.19
34.98 36.45
36.39
Percentiles
10% 9
10 10
10
25% 20
24 25
28
50% 49
50 60
60
75% 100
100 100
100
Number of Acquisitions 1894
294 5983
724
Note: 90% of our sample acquisitions involve the purchase of at least 10% of equity, qualifying as FDI. The distribution of shares does not differ between that for all the years in our sample and for 1998.
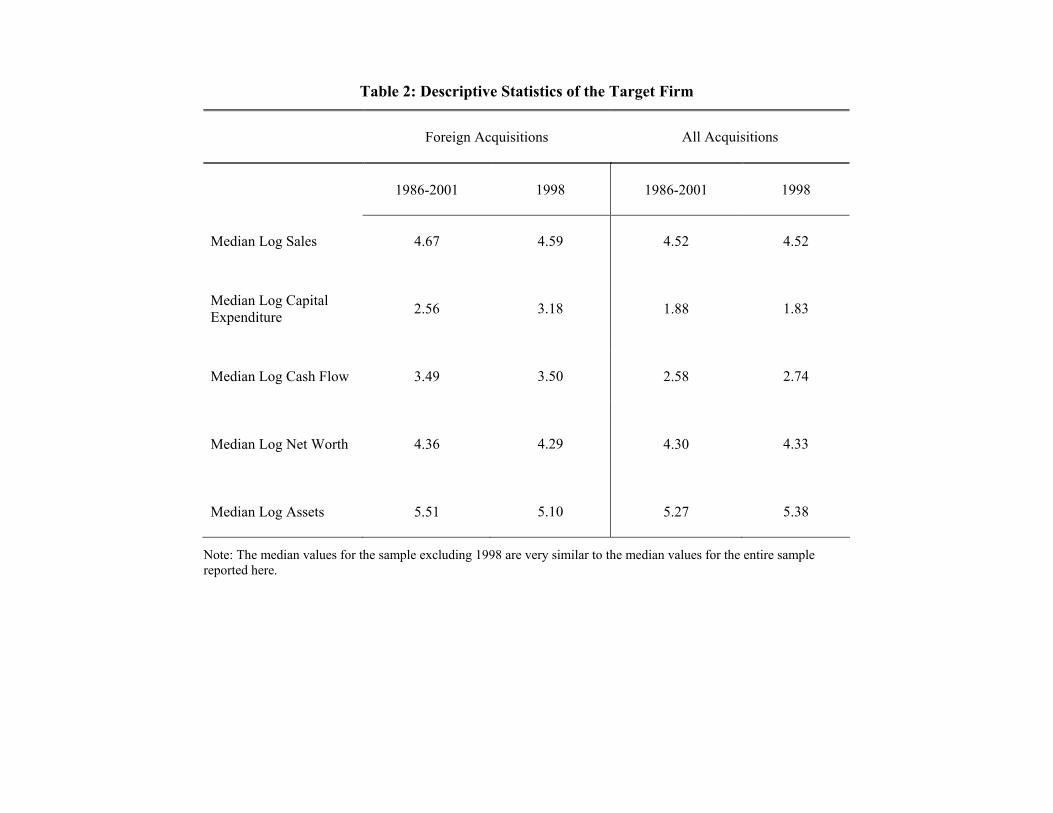
Table 2: Descriptive Statistics of the Target Firm
Foreign Acquisitions
All Acquisitions
1986-2001
1998 1986-2001
1998
Median Log Sales 4.67
4.59
4.52
4.52
Median Log Capital Expenditure 2.56
3.18 1.88
1.83
Median Log Cash Flow 3.49
3.50 2.58
2.74
Median Log Net Worth 4.36
4.29 4.30
4.33
Median Log Assets 5.51
5.10 5.27
5.38
Note: The median values for the sample excluding 1998 are very similar to the median values for the entire sample reported here.
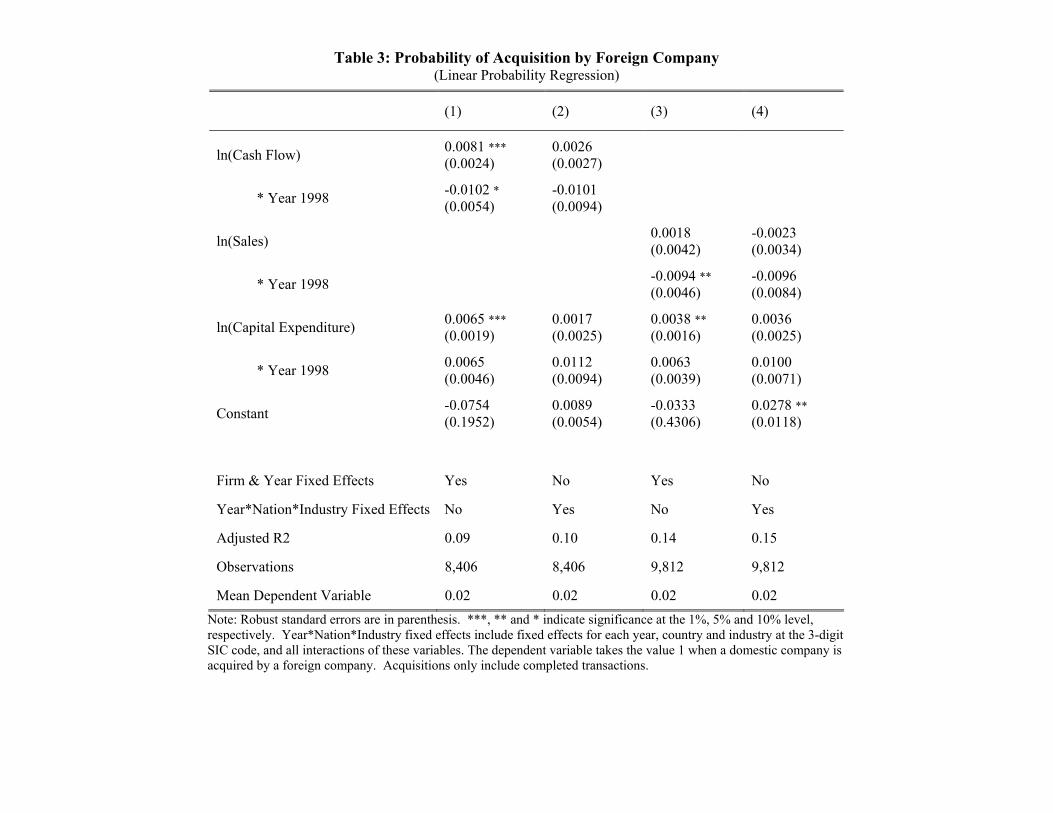
Table 3: Probability of Acquisition by Foreign Company (Linear Probability Regression)
(1) (2) (3) (4)
ln(Cash Flow) 0.0081 *** (0.0024)
0.0026 (0.0027)
* Year 1998 -0.0102 * (0.0054)
-0.0101 (0.0094)
ln(Sales) 0.0018 (0.0042)
-0.0023 (0.0034)
* Year 1998 -0.0094 ** (0.0046)
-0.0096 (0.0084)
ln(Capital Expenditure) 0.0065 *** (0.0019)
0.0017 (0.0025)
0.0038 ** (0.0016)
0.0036 (0.0025)
* Year 1998 0.0065 (0.0046)
0.0112 (0.0094)
0.0063 (0.0039)
0.0100 (0.0071)
Constant -0.0754 (0.1952)
0.0089 (0.0054)
-0.0333 (0.4306)
0.0278 ** (0.0118)
Firm & Year Fixed Effects Yes No Yes No
Year*Nation*Industry Fixed Effects No Yes No Yes
Adjusted R2 0.09 0.10 0.14 0.15
Observations 8,406 8,406 9,812 9,812
Mean Dependent Variable 0.02 0.02 0.02 0.02 Note: Robust standard errors are in parenthesis. ***, ** and * indicate significance at the 1%, 5% and 10% level, respectively. Year*Nation*Industry fixed effects include fixed effects for each year, country and industry at the 3-digit SIC code, and all interactions of these variables. The dependent variable takes the value 1 when a domestic company is acquired by a foreign company. Acquisitions only include completed transactions.
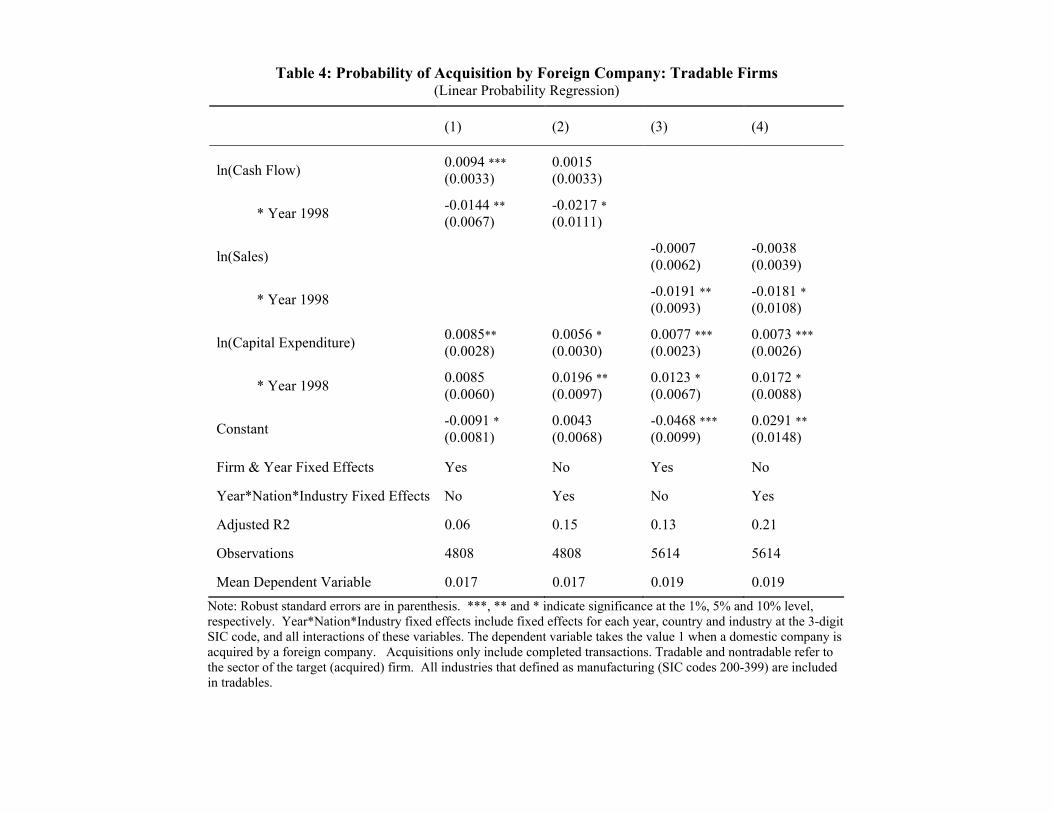
Table 4: Probability of Acquisition by Foreign Company: Tradable Firms
(Linear Probability Regression)
(1) (2) (3) (4)
ln(Cash Flow) 0.0094 *** (0.0033)
0.0015 (0.0033)
* Year 1998 -0.0144 ** (0.0067)
-0.0217 * (0.0111)
ln(Sales) -0.0007 (0.0062)
-0.0038 (0.0039)
* Year 1998 -0.0191 ** (0.0093)
-0.0181 * (0.0108)
ln(Capital Expenditure) 0.0085** (0.0028)
0.0056 * (0.0030)
0.0077 *** (0.0023)
0.0073 *** (0.0026)
* Year 1998 0.0085 (0.0060)
0.0196 ** (0.0097)
0.0123 * (0.0067)
0.0172 * (0.0088)
Constant -0.0091 * (0.0081)
0.0043 (0.0068)
-0.0468 *** (0.0099)
0.0291 ** (0.0148)
Firm & Year Fixed Effects Yes No Yes No
Year*Nation*Industry Fixed Effects No Yes No Yes
Adjusted R2 0.06 0.15 0.13 0.21
Observations 4808 4808 5614 5614
Mean Dependent Variable 0.017 0.017 0.019 0.019 Note: Robust standard errors are in parenthesis. ***, ** and * indicate significance at the 1%, 5% and 10% level, respectively. Year*Nation*Industry fixed effects include fixed effects for each year, country and industry at the 3-digit SIC code, and all interactions of these variables. The dependent variable takes the value 1 when a domestic company is acquired by a foreign company. Acquisitions only include completed transactions. Tradable and nontradable refer to the sector of the target (acquired) firm. All industries that defined as manufacturing (SIC codes 200-399) are included in tradables.
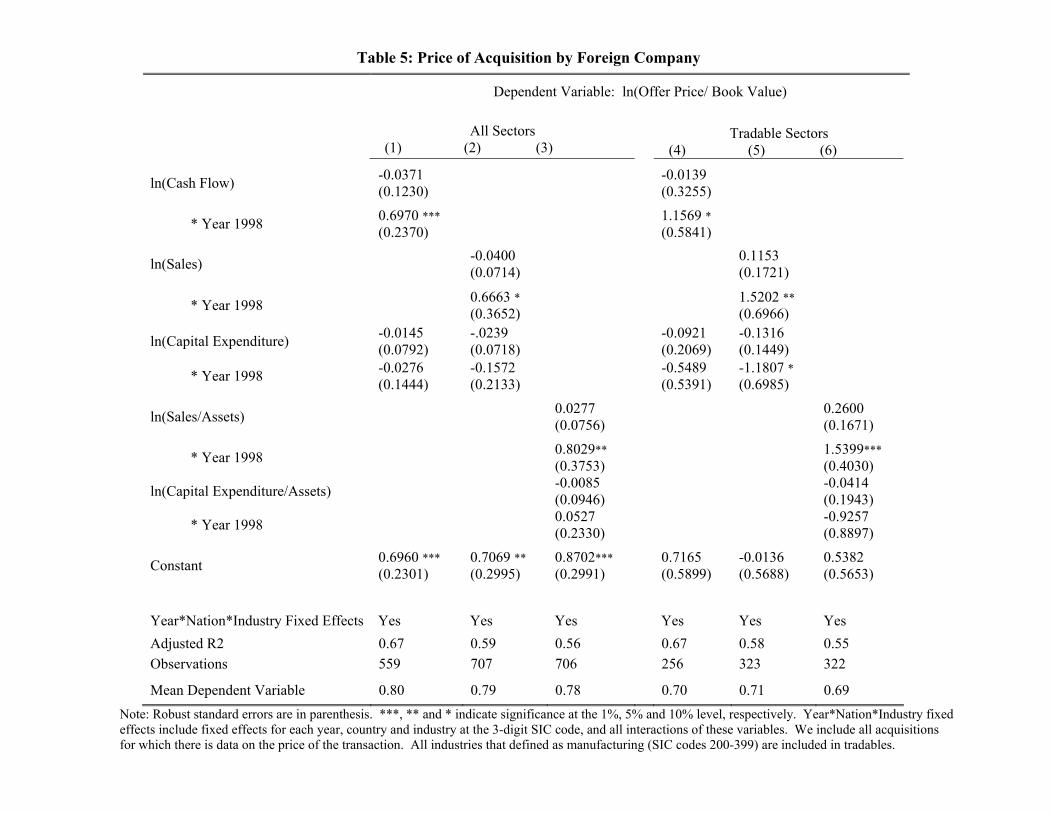
Table 5: Price of Acquisition by Foreign Company
Dependent Variable: ln(Offer Price/ Book Value)
All Sectors (1) (2) (3)
Tradable Sectors
(4) (5) (6)
ln(Cash Flow) -0.0371 (0.1230) -0.0139
(0.3255)
* Year 1998 0.6970 *** (0.2370) 1.1569 *
(0.5841)
ln(Sales) -0.0400 (0.0714) 0.1153
(0.1721)
* Year 1998 0.6663 * (0.3652) 1.5202 **
(0.6966)
ln(Capital Expenditure) -0.0145 (0.0792)
-.0239 (0.0718) -0.0921
(0.2069) -0.1316 (0.1449)
* Year 1998 -0.0276 (0.1444)
-0.1572 (0.2133) -0.5489
(0.5391) -1.1807 * (0.6985)
ln(Sales/Assets) 0.0277 (0.0756) 0.2600
(0.1671)
* Year 1998 0.8029** (0.3753) 1.5399***
(0.4030)
ln(Capital Expenditure/Assets) -0.0085 (0.0946) -0.0414
(0.1943)
* Year 1998 0.0527 (0.2330) -0.9257
(0.8897)
Constant 0.6960 *** (0.2301)
0.7069 ** (0.2995)
0.8702*** (0.2991) 0.7165
(0.5899) -0.0136 (0.5688)
0.5382 (0.5653)
Year*Nation*Industry Fixed Effects Yes Yes Yes Yes Yes Yes Adjusted R2 0.67 0.59 0.56 0.67 0.58 0.55 Observations 559 707 706 256 323 322
Mean Dependent Variable 0.80 0.79 0.78 0.70 0.71 0.69 Note: Robust standard errors are in parenthesis. ***, ** and * indicate significance at the 1%, 5% and 10% level, respectively. Year*Nation*Industry fixed effects include fixed effects for each year, country and industry at the 3-digit SIC code, and all interactions of these variables. We include all acquisitions for which there is data on the price of the transaction. All industries that defined as manufacturing (SIC codes 200-399) are included in tradables.
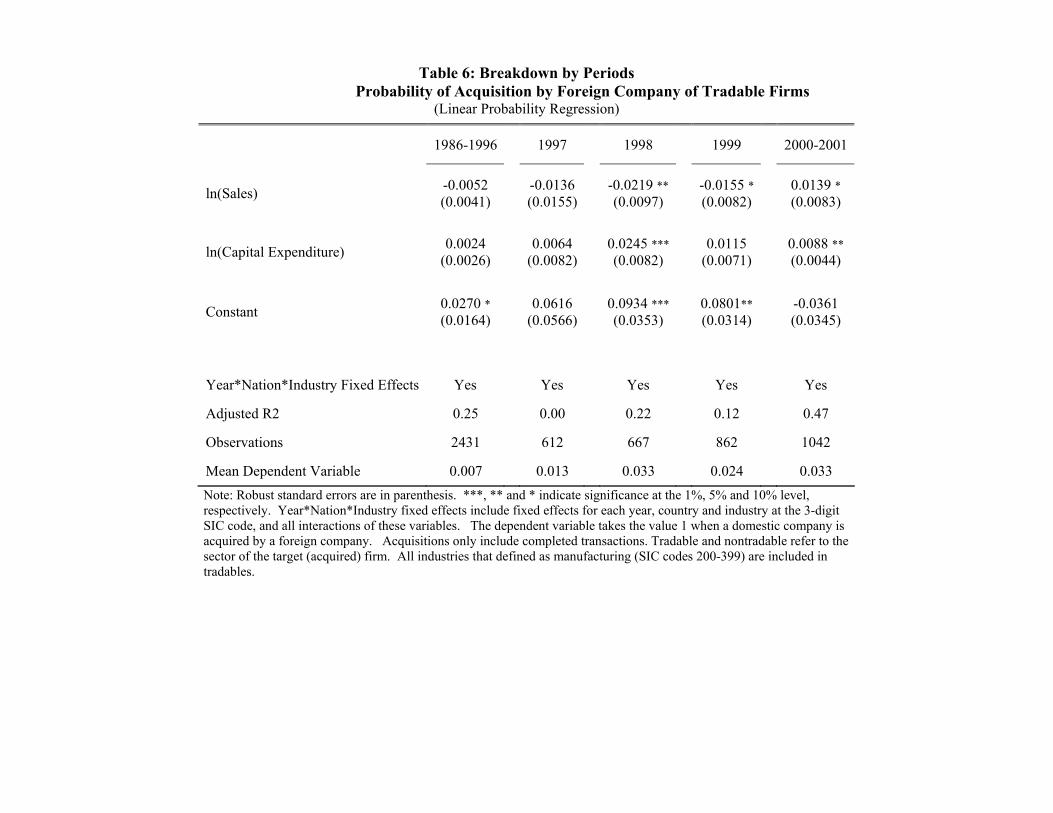
Table 6: Breakdown by Periods
Probability of Acquisition by Foreign Company of Tradable Firms (Linear Probability Regression)
1986-1996 1997 1998 1999 2000-2001
ln(Sales) -0.0052 (0.0041) -0.0136
(0.0155) -0.0219 **(0.0097) -0.0155 *
(0.0082) 0.0139 * (0.0083)
ln(Capital Expenditure) 0.0024 (0.0026) 0.0064
(0.0082) 0.0245 ***(0.0082) 0.0115
(0.0071) 0.0088 **(0.0044)
Constant 0.0270 * (0.0164) 0.0616
(0.0566) 0.0934 ***(0.0353) 0.0801**
(0.0314) -0.0361 (0.0345)
Year*Nation*Industry Fixed Effects Yes Yes Yes Yes Yes
Adjusted R2 0.25 0.00 0.22 0.12 0.47
Observations 2431 612 667 862 1042
Mean Dependent Variable 0.007 0.013 0.033 0.024 0.033 Note: Robust standard errors are in parenthesis. ***, ** and * indicate significance at the 1%, 5% and 10% level, respectively. Year*Nation*Industry fixed effects include fixed effects for each year, country and industry at the 3-digit SIC code, and all interactions of these variables. The dependent variable takes the value 1 when a domestic company is acquired by a foreign company. Acquisitions only include completed transactions. Tradable and nontradable refer to the sector of the target (acquired) firm. All industries that defined as manufacturing (SIC codes 200-399) are included in tradables.
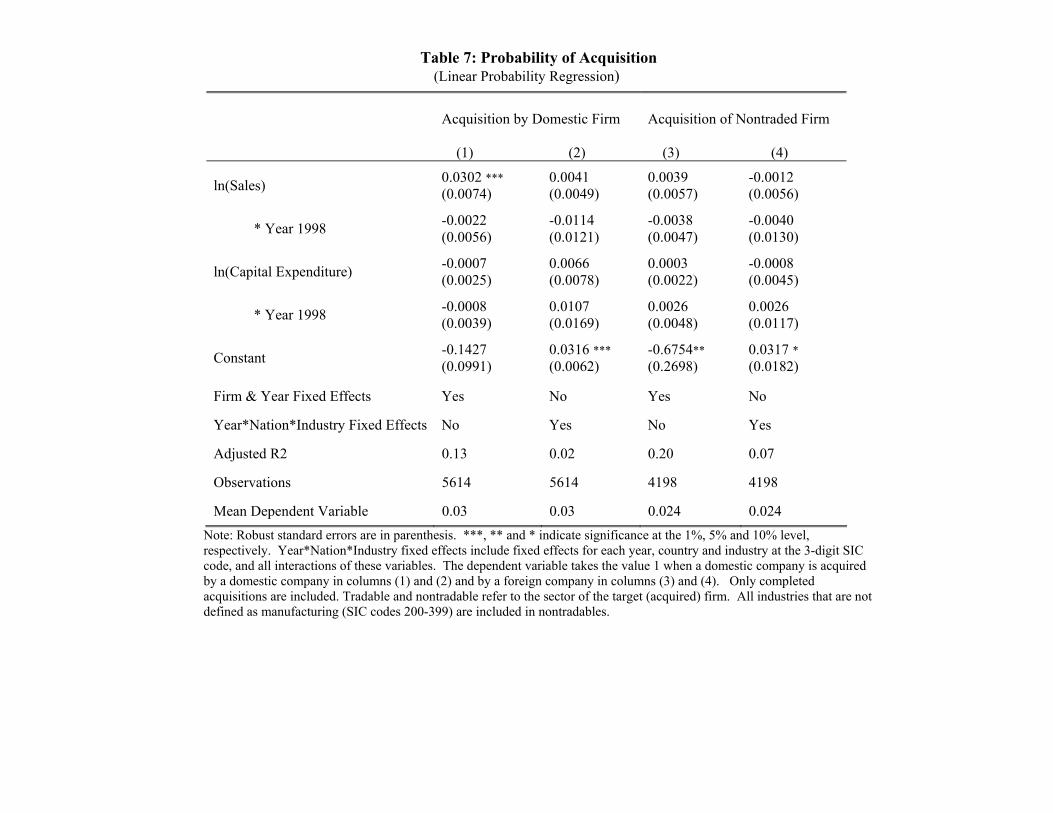
Table 7: Probability of Acquisition (Linear Probability Regression)
Acquisition by Domestic Firm (1) (2)
Acquisition of Nontraded Firm (3) (4)
ln(Sales) 0.0302 *** (0.0074)
0.0041 (0.0049)
0.0039 (0.0057)
-0.0012 (0.0056)
* Year 1998 -0.0022 (0.0056)
-0.0114 (0.0121)
-0.0038 (0.0047)
-0.0040 (0.0130)
ln(Capital Expenditure) -0.0007 (0.0025)
0.0066 (0.0078)
0.0003 (0.0022)
-0.0008 (0.0045)
* Year 1998 -0.0008 (0.0039)
0.0107 (0.0169)
0.0026 (0.0048)
0.0026 (0.0117)
Constant -0.1427 (0.0991)
0.0316 *** (0.0062)
-0.6754** (0.2698)
0.0317 * (0.0182)
Firm & Year Fixed Effects Yes No Yes No
Year*Nation*Industry Fixed Effects No Yes No Yes
Adjusted R2 0.13 0.02 0.20 0.07
Observations 5614 5614 4198 4198
Mean Dependent Variable 0.03 0.03 0.024 0.024 Note: Robust standard errors are in parenthesis. ***, ** and * indicate significance at the 1%, 5% and 10% level, respectively. Year*Nation*Industry fixed effects include fixed effects for each year, country and industry at the 3-digit SIC code, and all interactions of these variables. The dependent variable takes the value 1 when a domestic company is acquired by a domestic company in columns (1) and (2) and by a foreign company in columns (3) and (4). Only completed acquisitions are included. Tradable and nontradable refer to the sector of the target (acquired) firm. All industries that are not defined as manufacturing (SIC codes 200-399) are included in nontradables.
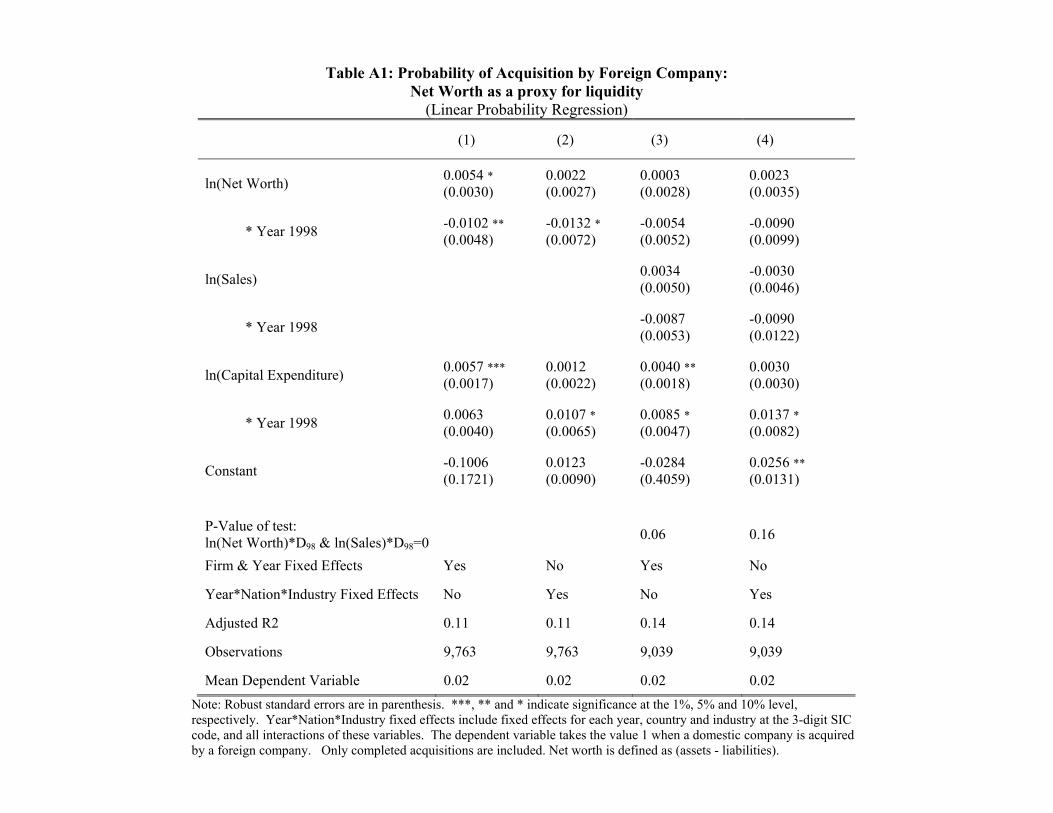
Table A1: Probability of Acquisition by Foreign Company:
Net Worth as a proxy for liquidity (Linear Probability Regression)
(1) (2) (3) (4)
ln(Net Worth) 0.0054 * (0.0030)
0.0022 (0.0027)
0.0003 (0.0028)
0.0023 (0.0035)
* Year 1998 -0.0102 ** (0.0048)
-0.0132 * (0.0072)
-0.0054 (0.0052)
-0.0090 (0.0099)
ln(Sales) 0.0034 (0.0050)
-0.0030 (0.0046)
* Year 1998 -0.0087 (0.0053)
-0.0090 (0.0122)
ln(Capital Expenditure) 0.0057 *** (0.0017)
0.0012 (0.0022)
0.0040 ** (0.0018)
0.0030 (0.0030)
* Year 1998 0.0063 (0.0040)
0.0107 * (0.0065)
0.0085 * (0.0047)
0.0137 * (0.0082)
Constant -0.1006 (0.1721)
0.0123 (0.0090)
-0.0284 (0.4059)
0.0256 ** (0.0131)
P-Value of test: ln(Net Worth)*D98 & ln(Sales)*D98=0 0.06 0.16
Firm & Year Fixed Effects Yes No Yes No
Year*Nation*Industry Fixed Effects No Yes No Yes
Adjusted R2 0.11 0.11 0.14 0.14
Observations 9,763 9,763 9,039 9,039
Mean Dependent Variable 0.02 0.02 0.02 0.02 Note: Robust standard errors are in parenthesis. ***, ** and * indicate significance at the 1%, 5% and 10% level, respectively. Year*Nation*Industry fixed effects include fixed effects for each year, country and industry at the 3-digit SIC code, and all interactions of these variables. The dependent variable takes the value 1 when a domestic company is acquired by a foreign company. Only completed acquisitions are included. Net worth is defined as (assets - liabilities).
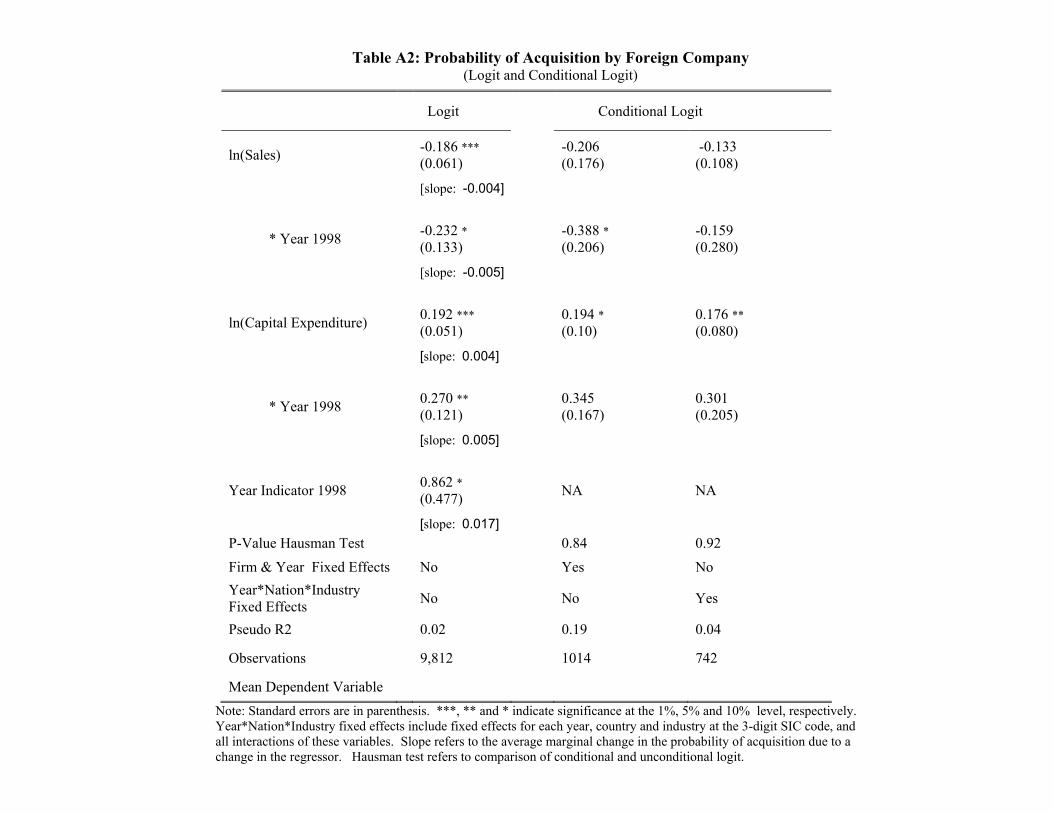
Table A2: Probability of Acquisition by Foreign Company (Logit and Conditional Logit)
Logit
Conditional Logit
ln(Sales) -0.186 *** (0.061) -0.206
(0.176) -0.133 (0.108)
[slope: -0.004]
* Year 1998 -0.232 * (0.133) -0.388 *
(0.206) -0.159 (0.280)
[slope: -0.005]
ln(Capital Expenditure) 0.192 *** (0.051) 0.194 *
(0.10) 0.176 ** (0.080)
[slope: 0.004]
* Year 1998 0.270 ** (0.121) 0.345
(0.167) 0.301 (0.205)
[slope: 0.005]
Year Indicator 1998 0.862 * (0.477) NA NA
[slope: 0.017] P-Value Hausman Test 0.84 0.92 Firm & Year Fixed Effects No Yes No Year*Nation*Industry Fixed Effects No No Yes
Pseudo R2 0.02 0.19 0.04
Observations 9,812 1014 742
Mean Dependent Variable Note: Standard errors are in parenthesis. ***, ** and * indicate significance at the 1%, 5% and 10% level, respectively. Year*Nation*Industry fixed effects include fixed effects for each year, country and industry at the 3-digit SIC code, and all interactions of these variables. Slope refers to the average marginal change in the probability of acquisition due to a change in the regressor. Hausman test refers to comparison of conditional and unconditional logit.
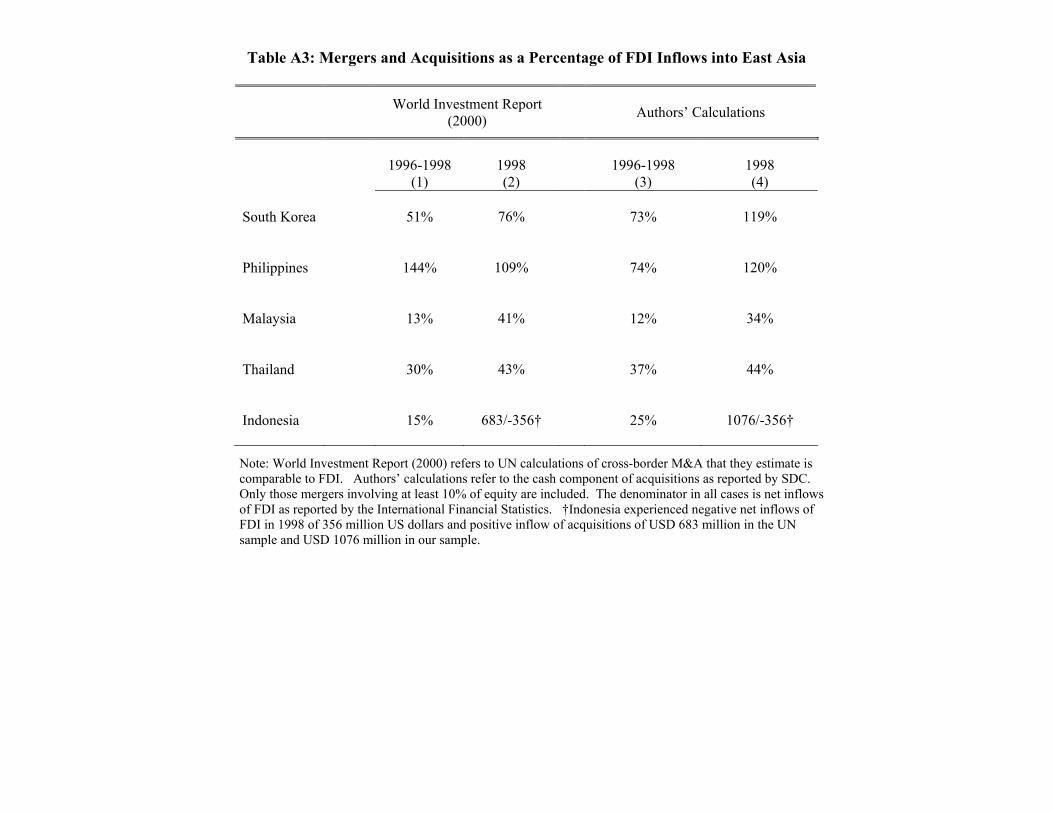
Table A3: Mergers and Acquisitions as a Percentage of FDI Inflows into East Asia
World Investment Report (2000)
Authors’ Calculations
1996-1998 (1)
1998 (2)
1996-1998
(3)
1998 (4)
South Korea 51%
76%
73%
119%
Philippines 144%
109%
74%
120%
Malaysia 13%
41%
12%
34%
Thailand 30%
43%
37%
44%
Indonesia 15%
683/-356†
25%
1076/-356†
Note: World Investment Report (2000) refers to UN calculations of cross-border M&A that they estimate is comparable to FDI. Authors’ calculations refer to the cash component of acquisitions as reported by SDC. Only those mergers involving at least 10% of equity are included. The denominator in all cases is net inflows of FDI as reported by the International Financial Statistics. †Indonesia experienced negative net inflows of FDI in 1998 of 356 million US dollars and positive inflow of acquisitions of USD 683 million in the UN sample and USD 1076 million in our sample.