first gulf bank profile - fgb · financial performance trends ... energy and real estate. ... -...
TRANSCRIPT

First Gulf BankProfile
1/30
Profile
Based on September’ 2011 Financials

First Gulf Bank Overview Incorporated in 1979 and headquartered in Abu Dhabi. Majority
owned by ruling family of Abu Dhabi representing an ownershipof 67%
A strong network of 19 branches across the UAE, with a staff strengthof 897. The bank has approximately 1,250 outsourced sales agentsfor Retail Products
Awarded “The UAE Bank of the Year 2009 and 2010” by The BankerAwards UK, and “The UAE 2009 Strongest Bank” by the AsianBanker
Core Banking activities: Corporate Banking, Treasury &Investments, Retail Banking, Islamic Banking and Corporate Finance
Listed on the Abu Dhabi Securities Exchange as of June2002, Market capitalization of AED 21 billion
Contributions from Business Segments Ownership Structure
Source: FGB Financial Statements
Contributions from Business Segments Ownership Structure
Source: FGB Financial Statements 2/30
Abu DhabiRulingFamily,67.0%
PublicShareholding
33.0%
40 % 41 % 45 %
25 %8 %
12 %
24 %45 %
45 %
5 % 2 %2 %6 % 4 %
-4 %
-20.0%
0.0%
20.0%
40.0%
60.0%
80.0%
100.0%
120.0%
Assets Operating Income Profit
Corporate Banking Treasury & Investments Retail Banking
Real Estate Other Operations

3.02.7 2.5 2.3
1.40.9
0.0
0.5
1.0
1.5
2.0
2.5
3.0
3.5
NBAD FGB ADCB ENBD UNB ADIB
AE
DB
illi
on
s
196.4
155.8
124.2102.0
55.7 48.4
183.6
142.6
108.096.0
52.5 54.4
0
50
100
150
200
250
ENBD NBAD ADCB FGB UNB ADIB
AE
Dbill
ions
Loans & Advances Customer Deposits
FGB in the UAE Context – Q3’ 11
Loans & Advances and Customer Deposits Net Profit
30.4
21.5 21.5
16.4
7.7 7.6
0.0
5.0
10.0
15.0
20.0
25.0
30.0
35.0
NBAD ENBD FGB ADCB UNB ADIB
AE
DB
illi
on
s
2.4%2.3%
1.9% 1.8%1.7%
1.1%
14.4% 14.8%16.3% 15.9% 15.1%
9.0%
0%
2%
4%
6%
8%
10%
12%
14%
16%
18%
0.0%
0.5%
1.0%
1.5%
2.0%
2.5%
3.0%
FGB UNB ADCB NBAD ADIB ENBD
(%)
ROAA ROAE
ROAA and ROAE Market Capitalisation
Source: FGB and other banks’ financial statements 3/30
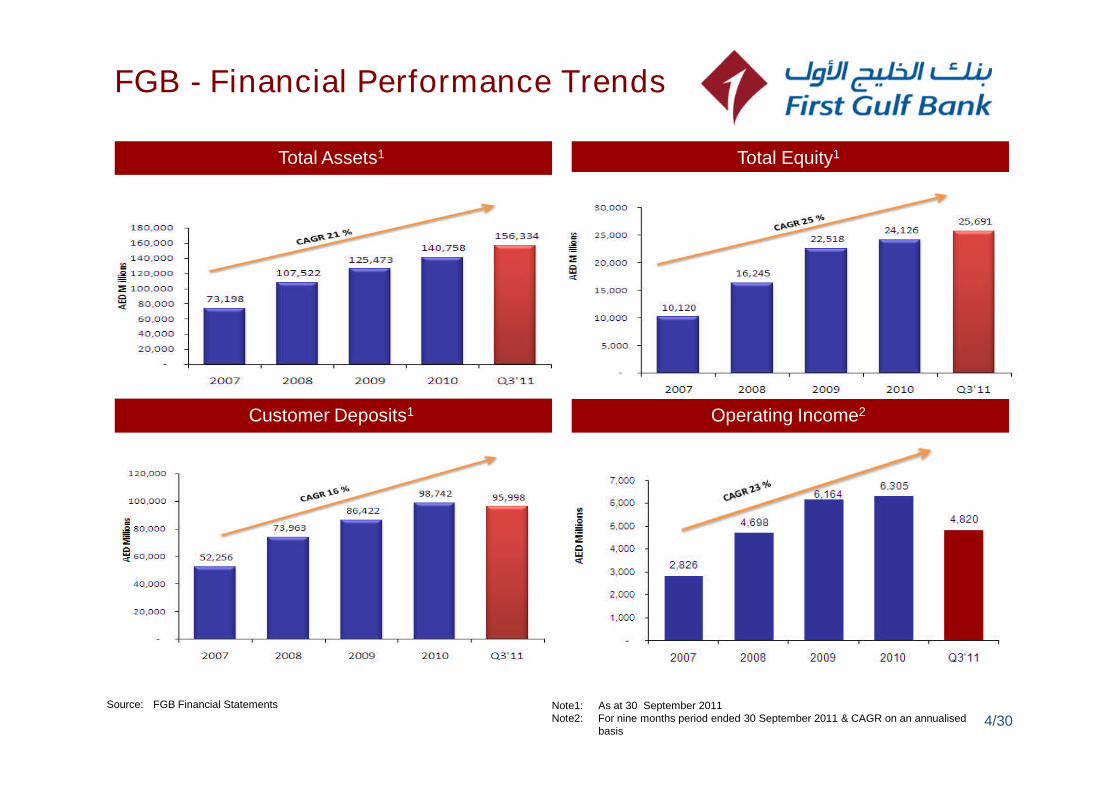
FGB - Financial Performance Trends
Total Assets1 Total Equity1
Customer Deposits1 Operating Income2
Source: FGB Financial Statements
4/30Note1: As at 30 September 2011Note2: For nine months period ended 30 September 2011 & CAGR on an annualised
basis

Financial Performance Trends (Cont’d)
Net Interest Margin2 Interest Income / Total Income2
Cost / Income Ratio2 Loans / Deposits Ratio1
Source: FGB Financial Statements
5/30
Note1: As of 30 September 2011Note2: For nine months period ended 30 September 2011

2011 – Performance Analysis
September 2010 (AED)
Assets (Bn) 137.5
Loans & Advances (Bn) 95.6
Deposits (Bn) 92.3
Shareholders’ Equity (Bn) 23.7
Revenue (Mn) 4,672.4
Expense (Mn) 803.3
Provisions (Mn) 1,309.8
Net Profit (Mn) 2,555.3
September 2011 (AED)
Assets (Bn) 156.3
Loans & Advances (Bn) 102.0
Deposits (Bn) 96.0
Shareholders’ Equity (Bn) 25.7
Revenue (Mn) 4,820.1
Expense (Mn) 879.7
Provisions (Mn) 1,249.3
Net Profit (Mn) 2,685.8
Growth
+ 14%
+ 7%
+ 4%
+ 8%
+ 3%
+ 10%
- 5%
+ 5%
One of the largest UAE listed banks
2nd by Net Profit
3rd by Equity
3rd by Market Capitalisation
4th by Assets and Loans
Position in the UAE – Sep’11
Amongst the leading Abu Dhabi listed banks
2nd by Net Profit
2nd by Equity
2nd by Market Capitalisation
3rd by Assets
21% market share of customer loans and21% of customer deposits
6/30
EPS (AED) 1.56 EPS (AED) 1.69+ 8%

Key Ratios 2007 – Q3’11
Ratio (%) 2007 2008 2009 2010 Q3-11
Return On Average Assets 3.3 3.3 2.8 2.6 2.4
Return On Average Equity 21.0 22.5 16.8 14.7 14.4
Non-Interest Income / Total Income 50.3 41.7 37.3 33.1 22.5
Net Interest Margin 2.7 3.1 3.7 3.6 3.7
7/30
Solid Balance Sheet reflected in very strong Ratios
* With effect from 2009, NPL’s are based on 90 days over due
Cost to Income Ratio 21.6 24.2 17.5 17.8 18.3
Loan to Deposit Ratio 85.0 107.3 104.6 96.8 106.2
NPLs To Gross Loans 1.0 0.6 3.3 3.7 3.4
Provision Coverage 144.6 232.9 81.7 89.4 105.1
Capital Adequacy 14.8 14.1 22.6 22.9 22.3

Overall Strategy
Organic Growth of Core
Banking Activities
Establishment of Associated
Companies and Subsidiaries
International and Targeted
Regional Growth
A leading financial institution in the UAE by focusing on sustainablegrowth
Build on opportunities with strategicpartners and key economic playersof the 2030 plan
Continue to target large
Separate subsidiaries to undertakeproperty development and privateequity investment for better focuson these businesses
Continue the geographicdiversification through:
- an expansion strategy for ourphysical presence in Singaporeand Qatar
Continue to target largecreditworthy UAE-based corporatebanking customers
Focus on the quality of service andrange of products it can offer asfactors that distinguish FGB fromits competitors
Focus on the fee income businessthrough property management andequity brokerage services
Aseel Finance to provide Shariah-compliant mortgages to purchasersof developments undertaken bystrategic partners
and Qatar
- a progressive built strategy ofthe representative offices(London and Mumbai)
Focus on key UAE trade partnercountries in priority
Position the bank to take advantageof new available growthopportunities beyond theinternational and regionalfinancial crisis
8/30
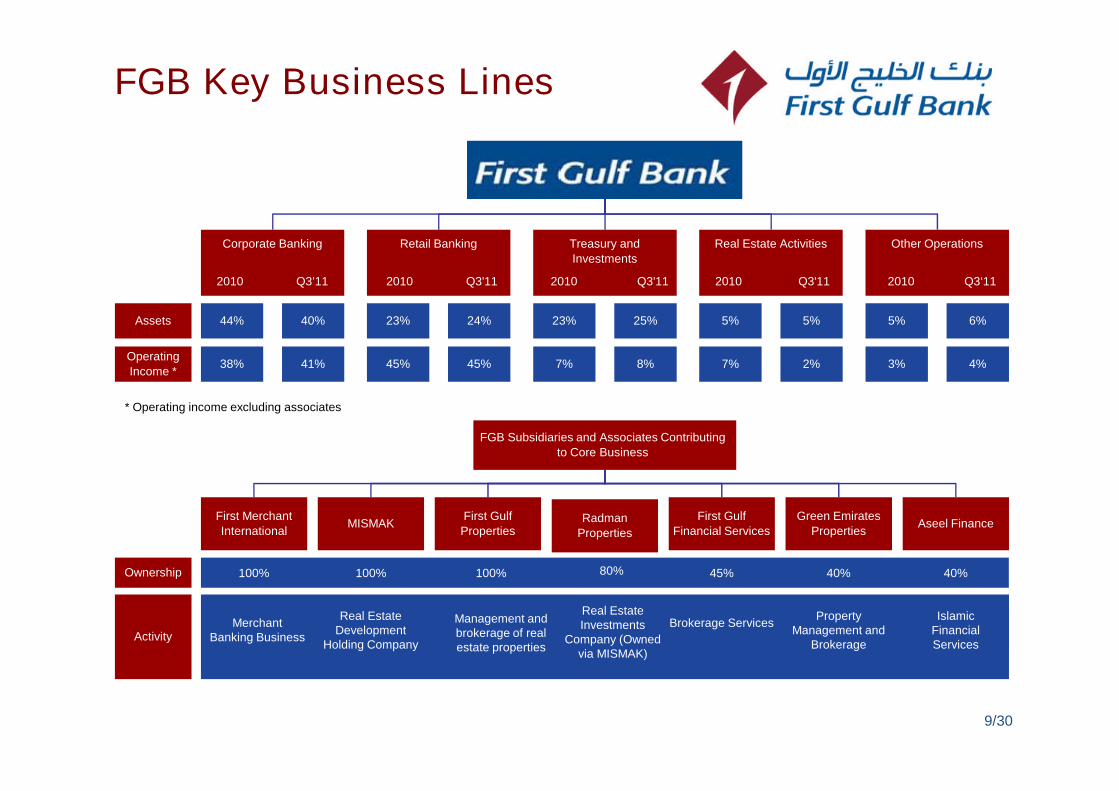
FGB Key Business Lines
Corporate Banking
2010 Q3’11
Retail Banking
2010 Q3'11
44% 40%
41%38%
23% 24%
45% 45%
Treasury and
Investments
2010 Q3'11
Real Estate Activities
2010 Q3'11
Other Operations
2010 Q3‘11
23% 25%
7% 8%
5% 5%
7% 2%
5% 6%
3% 4%
Assets
Operating
Income *
Green Emirates
Properties
First Gulf
Financial Services
First Gulf
PropertiesMISMAK
First Merchant
InternationalAseel Finance
FGB Subsidiaries and Associates Contributing
to Core Business
Ownership 100% 45% 40% 40%100%100%
PropertyManagement and
Brokerage
Brokerage ServicesReal Estate
DevelopmentHolding Company
MerchantBanking Business
Real EstateInvestments
Company (Ownedvia MISMAK)
IslamicFinancialServices
Activity
* Operating income excluding associates
9/30
Radman
Properties
80%
Management andbrokerage of realestate properties

Business Lines — Corporate Banking
Corporate Banking has been FGB’s core activitysince inception offering a range of financial services tocorporates. Focus industries include oil &gas, manufacturing, energy and real estate.
Offers a spectrum of financial services:
- Institutional Banking: focus is on FIs, international andregional syndications, structured deals, IPOs
- Private Banking Group: offers customized and diversifiedrange of products to high net worth individuals
- Islamic Banking window: offers various Shari’acompliant products
Assets 1
Operating Income 2
Corporate Gross Loan Portfolio (Q3’ 11) 1
Profit 2
Source: FGB and FGB Financial StatementsNote1: As of 30 September 2011Note2: For nine months period ended 30 2011 10/30
Corporate Gross Loan Portfolio (Q3’ 11) 1
Government &Public
Sector, 9%
Abu DhabiPrivate
Sector, 65%
Dubai PrivateSector, 15%
Other UAEPrivate
Sector, 4%
Non UAEbased
Corporates, 7%

Business Lines — Corporate Banking
Corporate bankingQ4’ 08 Q1’09 Q2’ 09 Q3’ 09 Q4’09 Q1’10 Q2’ 10 Q3’10 Q4’10 Q1’11 Q2’ 11 Q3’11
(AED Mn)
Assets 59,221 61,139 61,547 64,386 63,406 64,000 62,713 62,584 61,887 61,071 61,634 63,315
% Growth 1% 3% 1% 5% -2% 1% -2% -2% -1% -1% 1% 3%
Operating income 392 454 548 566 558 614 583 623 604 621 630 701
% Growth -11% 16% 21% 3% -1% 10% -5% 7% -3% 3% 1% 11%
11/30
Controlled growth of the Corporate Loans in 2011, combined with growth in Revenues and Net Profits
% Growth -11% 16% 21% 3% -1% 10% -5% 7% -3% 3% 1% 11%
Profit 225 302 383 223 31 392 323 374 392 377 366 455
% Growth -40% 34% 27% -42% -86% 1164% -18% 16% 5% -4% -3% 24%
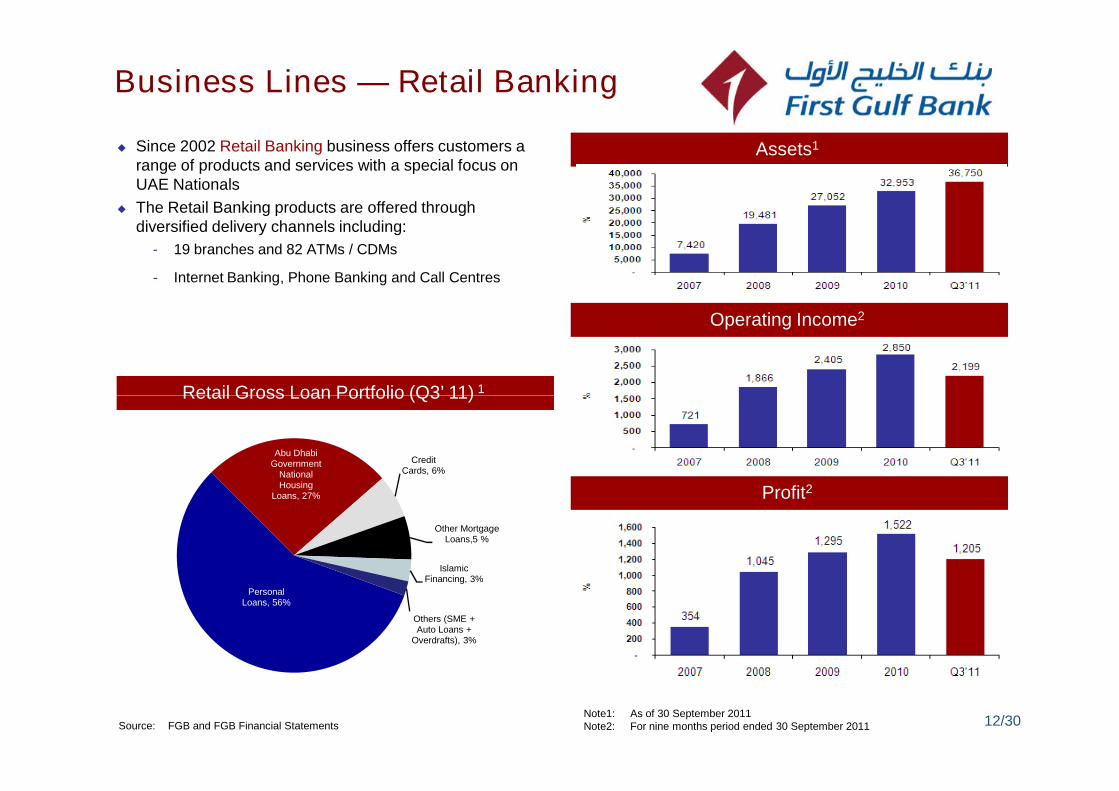
Business Lines — Retail Banking
Since 2002 Retail Banking business offers customers arange of products and services with a special focus onUAE Nationals
The Retail Banking products are offered throughdiversified delivery channels including:
- 19 branches and 82 ATMs / CDMs
- Internet Banking, Phone Banking and Call Centres
Retail Gross Loan Portfolio (Q3’ 11) 1
Assets1
Operating Income2
Retail Gross Loan Portfolio (Q3’ 11) 1
Profit2
Source: FGB and FGB Financial StatementsNote1: As of 30 September 2011Note2: For nine months period ended 30 September 2011 12/30
PersonalLoans, 56%
Abu DhabiGovernment
NationalHousing
Loans, 27%
CreditCards, 6%
Other MortgageLoans,5 %
IslamicFinancing, 3%
Others (SME +Auto Loans +
Overdrafts), 3%

Business Lines — Retail Banking
Retail bankingQ4’08 Q1’09 Q2’09 Q3’09 Q4’09 Q1’10 Q2’10 Q3’10 Q4’10 Q1’11 Q2’11 Q3’11
(AED Mn)
Assets* 19,481 21,914 24,216 25,775 27,052 29,017 30,964 32,788 32,953 35,284 36,081 36,750% Growth 14% 12% 11% 6% 5% 7% 7% 21% 1% 7% 2% 2%
Operating income 498 570 614 624 597 659 712 767 711 782 707 710% Growth -3% 14% 8% 2% -4% 10% 8% 8% -7% 10% -10% 0%
Profit 194 347 366 339 244 379 414 435 294 453 368 385
13/30
Consistent growth in Retail Loans over the quarters with focus on lending to UAE nationals (proportion by end of
Sep’11 is 88% Nationals, 12% expatriates)
Profit 194 347 366 339 244 379 414 435 294 453 368 385% Growth -39% 78% 5% -7% -28% 55% 9% 5% -32% 54% -19% 5%
* Including NHL Loans2,579 3,708 4,831 5,689 6,416 7,408 8,281 9,006 8,344 8,905 9,451 9,920

Business Lines — Treasuryand Investments Established in 2001, the Treasury & Investments Division
offers key corporates a set of products across a range ofasset classes and geographic markets
Mainly manages the group’s liquidity
Support the key client needs for the treasury productsand services
Offers a range of treasury products
Manage a proprietary investment book of treasuries,bonds, equities, and funds
Treasury and Investments Portfolio (Q3’ 11) 1
Assets2
Operating Income2
Treasury and Investments Portfolio (Q3’ 11) 1
Profit2
Source: FGB and FGB Financial StatementsNote1: As of 30 September 2011Note2: For nine months period ended 30 September 2011 14/30
Liquid Assets44%
Other FixedIncome Bonds
26% US TreasuryBills23%
Funds &Equities
5%
Others2%

Business Lines – Treasuryand Investments
Treasury & Investments (AED Mn) Q4’ 08 Q1’ 09 Q2’ 09 Q3’09 Q4’ 09 Q1’ 10 Q2’ 10 Q3’10 Q4’10 Q1’ 11 Q2’11 Q3’11
Assets 18,483 15,562 21,469 22,193 22,013 26,978 25,049 29,061 31,708 31,585 34,612 39,312
Liquid Assets 7,842 3,362 9,794 9,927 8,553 12,307 8,230 13,846 16,654 13,717 17,860 17,181
US Treasury Bills 3,660 5,500 5,505 5,504 7,344 9,175 11,014 9,176 9,178 11,015 7,344 9,182
Other Fixed Income Bonds 4,298 4,337 4,164 5,046 4,555 3,729 3,741 3,846 3,813 4,878 7,020 10,119
Funds & Equities (Hedge Funds,Private Equity Funds, Local Equity)
2,021 1,730 1,633 1,722 1,567 1,599 1,482 1,577 1,733 1,846 1,975 1,919
Others 662 633 373 -6 -6 168 582 615 330 129 413 911
15/30
67% of the Treasury & Investment assets are liquid instruments (cash, reserves with Central bank, short term
placement with banks, US Treasuries...)
Others 662 633 373 -6 -6 168 582 615 330 129 413 911
Operating Income 11 246 70 230 209 140 56 73 162 114 136 117
Net Interest Income 155 187 70 80 93 79 67 72 86 93 117 150
Non Interest Income -144 59 0 150 116 61 -11 1 76 21 19 -33
Profit -11 186 35 196 192 128 42 58 149 101 122 103

Business Lines — Real Estate Activities
Investments Properties (Q3’ 11) 1
Assets2
Operating Income2
The Real Estate Activities business line was spun offin 2007
Primary activities include investment, development,leasing, brokerage,
management and resale of properties
Investment properties of AED 7.5 billion represent 5% oftotal assets
Rental income yield is 3.4% per annum
86% of the group’s real estate assets are either located inAbu Dhabi or generate rental income
Investments Properties (Q3’ 11) 1
Profit2
Source: FGB and FGB Financial StatementsNote1: As of 30 September 2011Note2: For nine months period ended 30 September 2011 16/30

Net Profit Analysis: BusinessSegment Contribution
2009 2010
Sources ofIncome 2009
% ofTotal
2010% ofTotal
Q3’11% ofTotal
(AED Mn)Core Banking Activities 2,496 75% 3,170 93% 2,608 97%
Subsidiaries andAssociate Companies
814 25% 251 7% 78 3%
TOTAL 3,310 100% 3,420 100% 2,686 100%
Subsidiariesand
AssociateCompanies
Subsidiariesand
AssociateCompanies
3%
Q3’11
17/30
CoreBankingActivities
93%
Companies7%
Steady increase in reliance on Core Banking Business over the years
CoreBankingActivities
75%
Subsidiariesand
AssociateCompanies
25%
CoreBankingActivities
97%
3%
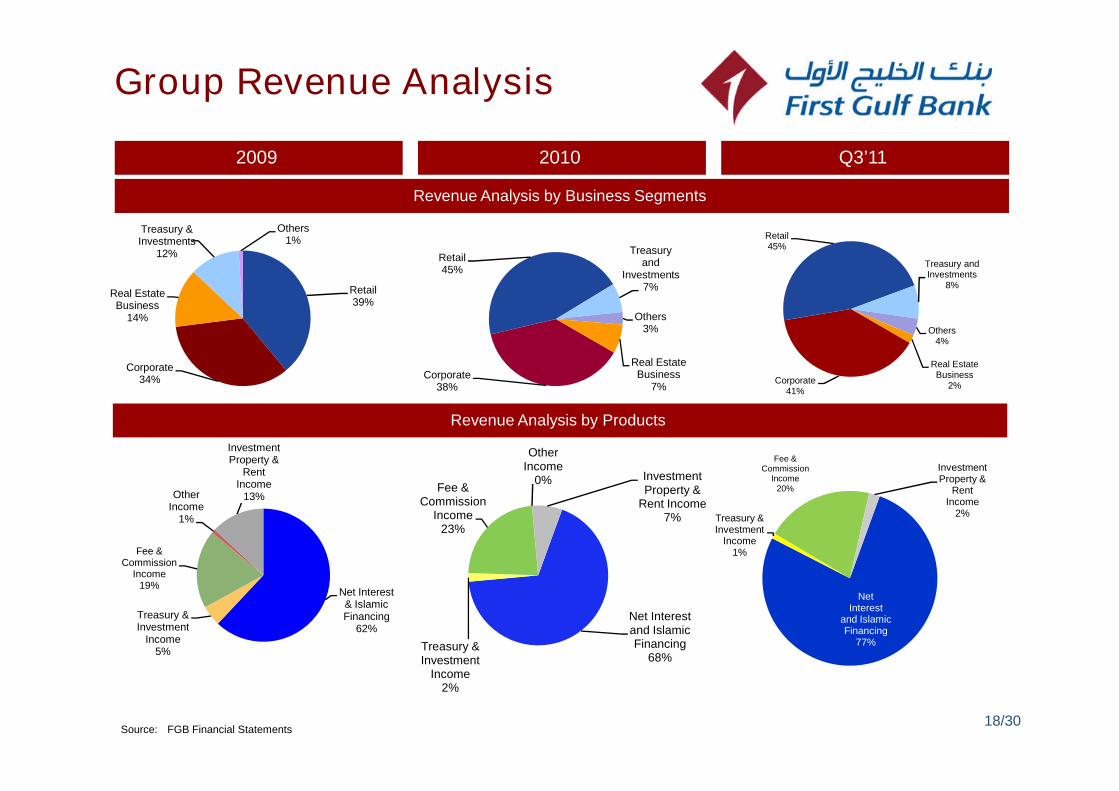
Group Revenue Analysis
2009 2010 Q3’11
Revenue Analysis by Business Segments
Retail39%
Corporate34%
Real EstateBusiness
14%
Treasury &Investments
12%
Others1%
Corporate38%
Retail45%
Treasuryand
Investments7%
Others3%
Real EstateBusiness
7%Corporate
41%
Retail45%
Treasury andInvestments
8%
Others4%
Real EstateBusiness
2%
Revenue Analysis by Products
Source: FGB Financial Statements
Net Interest& IslamicFinancing
62%
Treasury &Investment
Income5%
Fee &Commission
Income19%
OtherIncome
1%
InvestmentProperty &
RentIncome
13%
Net Interestand IslamicFinancing
68%Treasury &Investment
Income2%
Fee &Commission
Income23%
OtherIncome
0% InvestmentProperty &
Rent Income7%
18/30
NetInterest
and IslamicFinancing
77%
Treasury &Investment
Income1%
Fee &Commission
Income20%
InvestmentProperty &
RentIncome
2%
41%
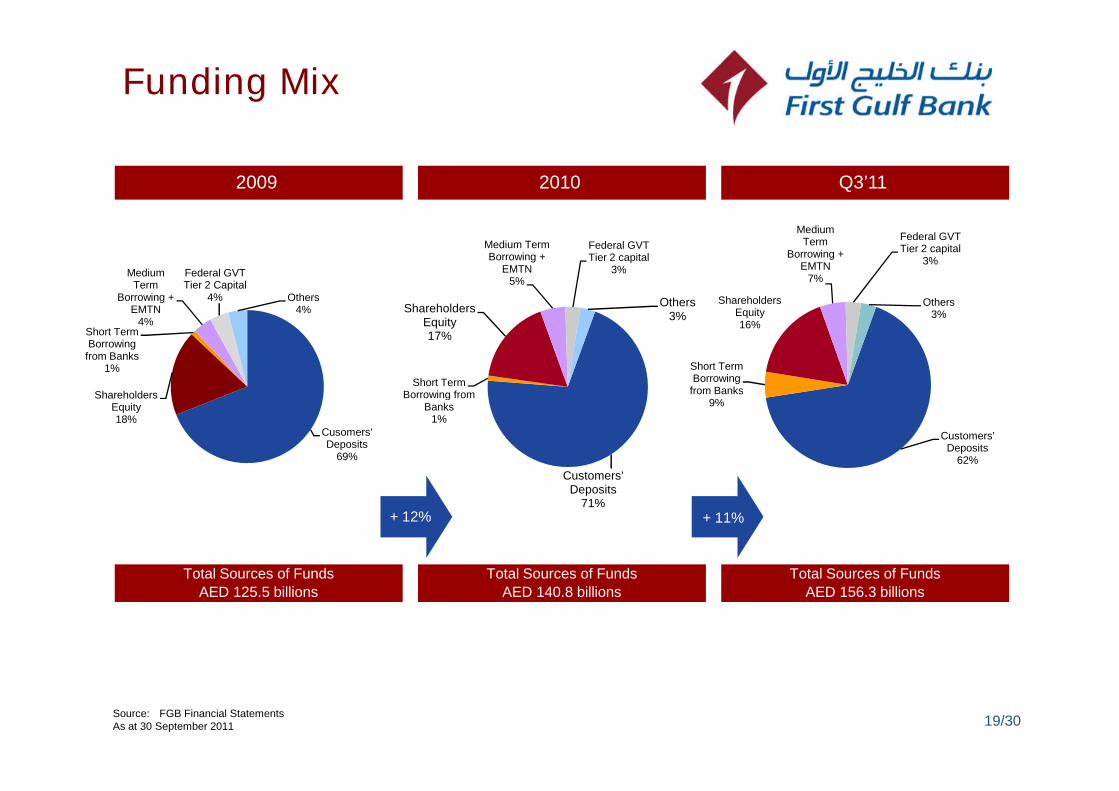
Short TermBorrowing from
ShareholdersEquity17%
Medium TermBorrowing +
EMTN5%
Federal GVTTier 2 capital
3%
Others3%
Funding Mix
2009 2010 Q3’11
Shareholders
Short TermBorrowing
from Banks1%
MediumTerm
Borrowing +EMTN
4%
Federal GVTTier 2 Capital
4% Others4%
Short TermBorrowing
from Banks
ShareholdersEquity16%
MediumTerm
Borrowing +EMTN
7%
Federal GVTTier 2 capital
3%
Others3%
Customers'Deposits
71%
Borrowing fromBanks
1%
Total Sources of Funds
AED 125.5 billions
Total Sources of Funds
AED 140.8 billions
Total Sources of Funds
AED 156.3 billions
Source: FGB Financial StatementsAs at 30 September 2011
+ 11%+ 12%
Cusomers'Deposits
69%
ShareholdersEquity18%
19/30
Customers'Deposits
62%
from Banks9%

Assets Mix
2009 2010 Q3’11
Optimizing efficiency of asset allocation while managing appropriate liquidity level
Loans &Advances
71%Investments
5%
Short TermTreasury
Instruments6%
InvestmentProperties
5%
Investmentin
Associates1%
OtherAssets
4%
LiquidAssets
8%
Loans &Advances
68%Investments
4%
Short TermTreasury
Instruments7%
InvestmentProperties
5%
Investment inAssociates
1%
Other Assets2%
Liquid Assets13%
Liquid Assets13%
Short termTreasury
Loans &Advances
Investments8%
InvestmentProperties
5%
Investment inAssociates
1%
Other Assets3%
PersonalRetail30%
PersonalOthers
8%
Government1%
ShareFinancing
5%
Real Estate19%
Public Sector7%
Services16%
Manufacturing3%
Trading4%
Construction6% Transport
1%Agriculture
0%
Energy1%
Trading4%
Construction5%
Transport2%
Personal –Retail35%
Personal -Others
5%
Government1%
Share financing3%
Real estate17%
Public Sector7%
Services16%
Manufacturing4%
Source: FGB and FGB Financial Statements
Loan Portfolio — Consistent, Balanced Growth and Diversification Amongst Sectors
Personal —Retail34%
Personal —Others
6%Government
1%Share
Financing4%
Real Estate19%
Public Sector6%
Services16%
Manufacturing3%
Trading4%
Construction5%
Transport1% Energy
1%
4%
20/30
Instruments6%
Advances65%

Loan Portfolio Analysis
AED millions 2009 2010 Q3'11
Performing Loans 89,818 95,236 102,144
Non Performing Loans 3,097 3,687 3,546
Total Gross Loans 92,915 98,923 105,690
Specific Provisions 584 2,523 2,419
General Provisions 1,945 771 1,307
Total Provisions 2,529 3,295 3,725
NET LOANS 90,386 95,628 101,964
NPL's / Gross Loans 3.3% 3.7% 3.4%
Non Performing Loan - Key Indicators
21/30
Provision Coverage 82% 89% 105%
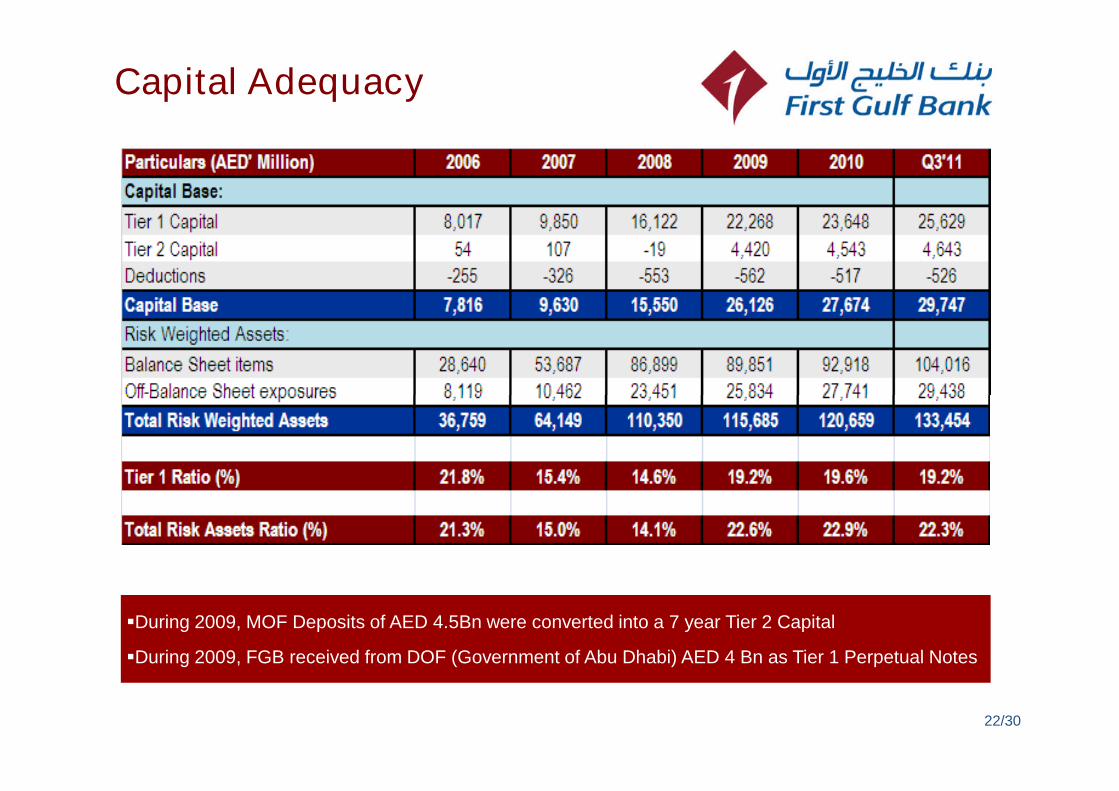
Capital Adequacy
22/30
During 2009, MOF Deposits of AED 4.5Bn were converted into a 7 year Tier 2 Capital
During 2009, FGB received from DOF (Government of Abu Dhabi) AED 4 Bn as Tier 1 Perpetual Notes

Dividend Distribution
DESCRIPTION 2003 2004 2005 2006 2007 2008 2009 2010
NET PROFIT (Mn) 120.9 244.9 1,055.7 1,535.9 2,008.2 3,005.3 3,310.3 3,420.4
CASH DIVIDEND10% 20% 25% 70% 20% 35% 50% 60%
(% of Capital)
BONUS SHARES- 5% 25% - 10% - - 5%
(% of Capital)
23/30
Maximizing Value for our Shareholders
DIVIDEND PAYOUT RATIO32% 40% 47% 57% 19% 16% 20% 26%
(% of Net Profit)
YIELD 1.20% 6.10% 26.00% 5.70% 10.90% 3.80% 3.10% 8.29%

Short Term Prioritiesand Future Plans
Continue on strengthening the Balance Sheet through appropriate Liquidity andCapitalization levels, balanced Asset allocation with focus on the mostprofitable businesses.
Continue the focus on improvement of asset quality and collections.
Continue the diversification of sources of income through a balanced productmix and a balanced business lines contribution
Continue the geographic diversification through an expansion strategy for ourphysical presence in Singapore and Qatar, and through a progressive builtstrategy of the Rep Offices (London and Mumbai).
Maximize value for shareholders through healthy profitability, efficiency andCapital adequacy ratios.
24/30

FGB - A Bright Future Outlook
FGB model is founded on two important criteria:
- Solid Balance Sheet - Sound Profitability.
Strong and Stable Shareholders’ Base.
Visionary, experienced and professional Board of Directors.
Capable, professional and stable Management team.
Continuous Government support to the entire Banking Sector.
FGB is very well positioned to continue generating value to itsshareholders in 2011 and beyond.
FGB is very well positioned to continue generating value to itsshareholders in 2011 and beyond.
Continuous Government support to the entire Banking Sector.
FGB is Abu Dhabi based. Bright outlook for Abu Dhabi / UAE Economy.
Prudent Credit and Risk Management policies in place.
Well Diversified Sources of Funds and Sources of Income.
High efficiency in Cost Management.
Prudent provisioning policy.
Large Equity Base, High Capital Adequacy Ratio and Low Leverage.
Well planned overseas expansion
25/30

AppendixAppendix
26/30

Board of Directors (2011 – 2013)
Board of Directors 2006 – 2008
H.H. Sheikh Hazza BinZayed Al Nahyan
Chairman (1)
H.H. Sheikh Tahnoon BinZayed Al Nahyan
Vice Chairman (1)
Abdulhamid Mohammed Saeed Managing Director
Ahmed Ali Al Sayegh Member
Board of Directors 2011 – 2013
H.H. Sheikh Hazza BinZayed Al Nahyan
Chairman (1)
H.H. Sheikh TahnoonBin Zayed Al Nahyan
Vice Chairman (1)
Abdulhamid Mohammed Saeed Managing Director
Ahmed Ali Al Sayegh MemberAhmed Ali Al Sayegh Member
Khaldoon Khalifa Al Mubarak Member
Khadem Khalifa Al Qubaisi Member
Dhafer Sahmi Al Ahbabi Member
Ahmed Ali Al Sayegh Member
Khaldoon Khalifa Al Mubarak Member
Khadem Khalifa Al Qubaisi Member
Sultan Khalfan Al Ktebi Member
Note:1 Members of the Ruling Family
His Highness Sheikh Hazza Bin Zayed Al Nahyan has resigned from his position as the Chairman of First Gulf Bank, effective Thursday 10 March 2011. ViceChairman His Highness Sheikh Tahnoon Bin Zayed Al Nahyan is currently acting as Chairman of the Board until the election of the new Board members. 27/30
Board of Directors (2011 – 2013)
H.H. Sheikh Tahnoon Bin Zayed Al Nahyan, Vice Chairman (1)
H.H. Sheikh Hazza Bin Zayed Al Nahyan, Chairman (1)
Abdulhamid Mohammed Saeed, Managing Director, Board MemberAbdulhamid Mohammed Saeed has over 26 years of experience in banking, 18 years of which were with Citibank. He joined FGB in September 1999 as the GeneralManager. Apart from being the Managing Director and Board Member of FGB, he is a Board Member of the Abu Dhabi Securities Exchange, Emirates InvestmentAuthority, Emirates Integrated Telecommunications Company (DU), Chairman of Aseel Finance PJSC, Chairman of First Gulf Financial Services and the Managing
Director of Al Reem Investments. He has a Bachelor of Science in Business Administration from the University of Arizona, USA
Khaldoon Khalifa Al Mubarak, Board MemberKhaldoon Khalifa Al Mubarak began his career at the Abu Dhabi National Oil Company and held a number of positions at the UAE Offsets Group before assuming his
Ahmed Ali Al Sayegh, Board MemberAhmed Ali Al Sayegh is involved in a number of development initiatives of the Government. Most notably he is the Chairman of ALDAR Properties Company PJSC andthe CEO of Dolphin Energy Limited. He is also a Board Member of the UAE Offsets Group, Mubadala Development Company, Abu Dhabi Water and ElectricityAuthority, Etihad Airways, Abu Dhabi Insurance Company and Aabar Petroleum Investments Company. Over the last 24 years, he has worked in a wide range ofpositions of responsibility at leading Government organizations including the Abu Dhabi National Oil Company and Abu Dhabi Investment Company. He holds a degreein Economics and Finance from Lewis & Clark College, USA
Khaldoon Khalifa Al Mubarak began his career at the Abu Dhabi National Oil Company and held a number of positions at the UAE Offsets Group before assuming hisposition at FGB. He is the CEO and Managing Director of Mubadala Development Company, an investment vehicle wholly owned by the Government. He is theChairman of the Executive Affairs Authority of the Government and also of The Imperial College London Diabetes Center. He is a member of the Abu Dhabi ExecutiveCouncil, Abu Dhabi Education Council, and Abu Dhabi Council for Economic Development. He is a board member of Dolphin Energy Limited and of the EmiratesFoundation and also sits on the boards of ALDAR Properties PJSC, LeasePlan Corporation and Piaggio Aero. He holds a degree in Economics and Finance from TuftsUniversity, Boston, USA
Khadem Khalifa Al Qubaisi, Board MemberKhadem Abdulla Al Qubaisi has previously worked with the Abu Dhabi Investment Authority, as Senior Financial Analyst. He is the Managing Director of theInternational Petroleum Investment Company and the Chairman of Gulf Energy Maritime. He is a member of the Internal Audit Committee at Hyundai Oilbank Co. Ltd.,Korea, and of Abu Dhabi Petroleum Investment Co. He is also Vice Chairman of Pak-Arab Refinery Ltd., Pakistan. He is a board member of Parkarab Fertilizers
Co.(Pvt) Ltd., Pakistan, Borealis AG, Austria and AMI Agrolinz Melamine International GmbH, Austria. He has a degree in Economics
Sultan Khalfan Al Ketbi, Board MemberSultan Khalfan Al Ketbi holds a Bachelor Degree in General Administration from UAE University since 1994. He is a private advisor for one large FGB Shareholder (amember of Al Nahyan ruling family). He is Vice Chairman of Al Ain International Group and Board Member in several companies in UAE and other GCC countries.
28/30
Note:1 Members of the Ruling Family
His Highness Sheikh Hazza Bin Zayed Al Nahyan has resigned from his position as the Chairman of First Gulf Bank, effective Thursday 10 March 2011. ViceChairman His Highness Sheikh Tahnoon Bin Zayed Al Nahyan is currently acting as Chairman of the Board until the election of the new Board members.

Enterprise Risk ManagementStructure
Group Risk Committee (Board Level)
Group CRO
Group Risk Management Team
Credit Risk Committee Asset Liability Committee Operational Risk Committee
Group Credit Risk TeamGroup Operations
Risk TeamGroup Compliance Team
Group Market Risk
/ ALM Team
First Gulf CapitalGreen Emirates
/ MismakAseel FinanceFGFSRep OfficesFirst Gulf Bank
First Merchant
International
InternationalBanking
Operations
IndependentRisk Team
RMU Direct ControlReporting to RMU
Group Basel II / ICAAP Team
Enterprise Risk Management & Compliance
Compliance with best practices (COSO, Basel II)
Portfolio view of risks at the group level
Group wide risk monitoring / reporting
Aggregation of risks and global mitigation strategies
Compliance with risk regulations across jurisdictions
Risk related expertise in a cost effective manner
29/30

This presentation provides information in summary form only and is not intended to be complete. It is not intended to be reliedupon as advice to investors or potential investors and does not take into account the investment objectives, financial situationor needs of any particular investor.
No presentation ,express or implied, is made as to the fairness, accuracy, completeness or correctness of informationcontained in this presentation, including the accuracy, likelihood of achievement or reasonableness of anyforecasts, prospects, synergies, returns, benefits or statements in relation to future matters contained in the presentation.
The forward-looking statements are by their nature subject to significant uncertainties and contingencies and are based onnumbers or estimates or assumptions that are subject to change (and in many cases are outside the control of FGB and itsdirectors) which may cause the actual results or performance of FGB to be materially different from any future results or
Disclaimer
30/30
directors) which may cause the actual results or performance of FGB to be materially different from any future results orperformance expressed or implied by such forward looking statements.
To the maximum extent permitted by law, FGB disclaims any responsibility for the accuracy or completeness of anyinformation contained in this presentation including any forward-looking statements and disclaims any responsibility to updateor revise any information or forward-looking statement to reflect any change in FGB’s financial condition, status or affairs orany change in the events, conditions or circumstances on which a statement is based.
To the maximum extent permitted by law, neither FGB nor its related bodies corporate, directors, employees or agents, norany other person, accepts any liability, including, without limitation, any liability arising from fault or negligence, for anydirect, indirect or consequential loss arising from the use of this presentation or its contents or otherwise arising in connectionwith it.This presentation should be read in conjunction with other publicity available material. Further information including historicalresults and a description of the activities of FGB is available on our website, www.fgb.ae