real estate and capital markets - rdhawan.com · trends in real estate capital markets ... equity...
TRANSCRIPT

Real Estate Forecasting Seminar February 21, 2007
Terry V. Grissom Ph.D.Professor Real Estate Department
Georgia State University Economic Forecast Center
& Person who sets inReal Estate Research Center
Real Estate and Capital Markets

Trends in Real Estate Capital MarketsSession Objectives:Participants will:• view relations of real estate & capital• Note changes in structure of real estate capital
market• Identify the effect of changing relationships on
risk and return options• Have option to consider strategies using our
insights• Develop an alternative way of thinking

Nature of Real Estate and CapitalAlternative Economic Tradition shows:
Real Estate ≡ Capital&
Real Estate ≠ Capital
A partial function of difference in:Risk ≠ Uncertainty
& Consideration of distributive factors

Structural Nature of Real Estate
Real Estate is alternatively categorized and perceived as:
• A Commodity• A factor of production • A Resource• An Asset Class

Operational Nature of Real Estate
Operational Essence of Real Estate
• Economic Location: SitusUse Succession (LUST)
• Collateral

Agricultural and Direct return to Physical Land
Income Allocated to Location and Accessibility
TransportationCosts
Site Rent
Basis of Real Estate Value: Basic Bid Rent Curve Model – defining Land Use Patterns by Trade-off
Location and Accessibility
Economic Edge of City0 Distance from City Core - CBD

Shift in Bid Rent Curve –due increase fuel cost
Agricultural and Direct return to Physical Land
Economic Edge of City
Income Allocated to Location and Accessibility
TransportationCosts
Site Rent
Impact of fuel costs: Demand Increase where Price Exceeds Income
Demand Increase at high price within income range
Site Rent
Quantity Loss due to Demand decline for undesirable/unavailable land
Demand decline and shift in trade-off of rent ( ) to transport cost
0 D

Basis of Real Estate Value: Basic Bid Rent Curve: Patterns of Trade-off of Site Rent and
Accessibility Vary with Land Use
TransportationCosts
Economic Edge of City
Income Allocated to Location and Accessibility
Office
Retail
Industrial
Residential
Agricultural and Direct return to Physical Land
Site Rent
0 D
TransportationCosts
Income Allocated to Location and Accessibility
Office
Industrial

Linking Economic Location to Capital : A Spatial Capital as Product
Real Estate as:• Space used over time• Situs Capital – Economic Location • Sustainable development –natural capital• Space and money as Capital• Real Estate as Capital Markets within
Spatial Markets• How to pull it all together and get there

Valuation: Cost Analysis and Asset FeasibilityRisk Measure from origins of a project at a location:
PotentialCost Market Revenue
[ Financing Options] [Operating Options][Operating Options] [ Financing Options]
Required Justified Investment Revenue Value
RR (JIV)

JIV-Cost & Rent SensitivityValue/CostPer SF GBA$200.00
$135.09
$123.30
$100.00
0 $ 10 $20 $30$18.27$12.43$13.00
RentNOI PGI
Income Productivity Range
Ro | JIV
Rc | Vc
η

JIV-Cost Comparison As Measure of RiskAlternative Risk Adjustment: • Value:
A. JIV/Cost = Profitability Index (PI):PI >1 go, PI =1, neutral, PI<1, no go
B. Probability of Ruin (δ = PI -1) • Income Elasticity:
(JIV/Cost -1)/(Mkt Rent/Required Rent-1)
• Rate/Return/Yield – Equity Shortfall Risk (ESR) or Roy’s Criterion (a hurdle rate);

JIV-Cost Comparison As Measure of RiskRoy’s Criterion (ESR):
E(Ri) - ϕ = ESR (π E(Ri) ≤ ϕ)σRi
Where: E(Ri) = expect return on asset (average)σRi = total risk to asset (market measures
can be used)ϕ = investor’s hurdle rate (required rate
of return)π = probabilityESR = equity shortfall rate

Functional Nature of Real Estate
Functional Essence of Real Estate:
Conversion of:
Space-time <====> Money-time

Repeat of Overview Essentials from Repeat of Overview Essentials from Underwriting and Risk PerspectivesUnderwriting and Risk Perspectives
The general principles of real estate finance, underwriting, investment and portfolio analysis are simplified as:
• Pain• Pleasure• Bail-out

Real Estate FinanceAs in general finance, the nature of real estate finance has evolved and changed over time.
Key changes have been in:• Nature of institutions and intermediaries• Participants and sources of capital• Real estate investment vehicles• Relationships to inflation and interest
contingencies• Change in risk exposures

Traditional Capital Market for Real Estate
Source Instrument Capital Intermediary
Savers
Investors
Pass Book
Life Policy
Banks
Thrifts
Insurance Co.
Positions of: Limited Exposures
Private Syndications
Lawyers
Accountants
Professional Intermediaries

Traditional Capital Market for Real Estate
Investment Intermediaries Capital Vehicle
Mortgage Brokers/Bankers Mortgages
Developers
BrokersEquities

Evolving Capital Market for Real EstateSource Instrument Capital Intermediary
Insurance Co.
ThriftsS-term Savers
Pass Book
Money Markets
CDs
Banks
Mortgage Conduits …
L-term Savers
Investors
Life Policy
Pension Funds
IRA/Keogh
Positions of: Limited Exposures
Employers
Public/Private SecuritiesPublic/Private Trusts ….
Equity Conduits .

Evolving Capital Market for Real Estate
Investment Intermediaries Capital Vehicle
Mortgages
…… Mortgage Conduits
Mortgage Brokers/Bankers
….. Public/Private Securities
….. Public/Private Trusts
…... Equity Conduits Equities
Blended Debt and Equity Vehicle

0
200
400
600
800
1000
1200
70 72 74 76 78 80 82 84 86 88 90 92 94 96 98
Comparison of Debt and Equity Capital$B illions
Ye ars
D e bt
Equity
Sourc e : GSU R e al Estate ; Grissom

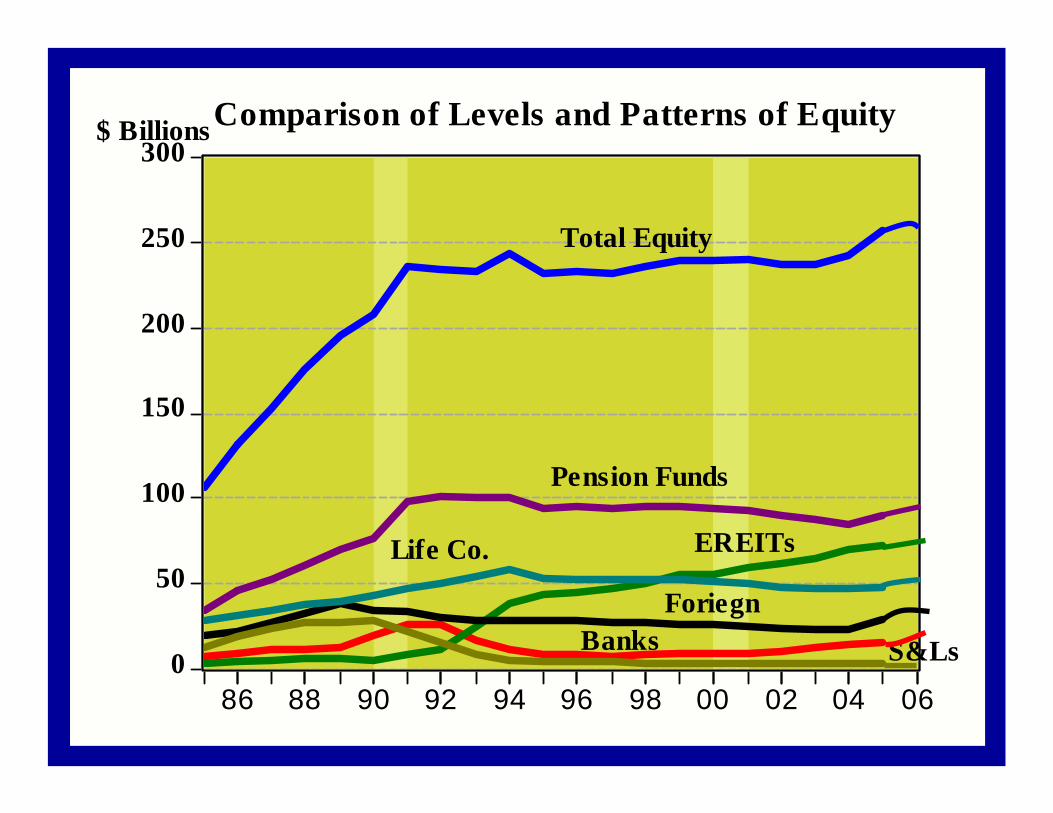
0
10
20
30
40
50
60
86 88 90 92 94 96 98 00 02 04 06
Life Co
Banks
Foriegn Inves tors
S&Ls
Traditional Equity Capital$ Billions

0
20
40
60
80
100
120
86 88 90 92 94 96 98 00 02 04 06
Pension Funds
EREITs
Emerging Equity Capital$ Billion
0
50
100
150
200
250
300
86 88 90 92 94 96 98 00 02 04 06
Total Equity
Pension Funds
Banks
EREITsLife Co.
Foriegn
S&Ls
Comparison of Levels and Patterns of Equity$ Billions

Equity Pie: 1995-6
Foreign Investors: 12.29%
REITs: 18.76%
Thrifts: 1.75% Banks: 3.42%
Life Co.: 23.21%
Pensions:40.56%

Equity Pie: 2005-6
Series1
Series1
Series1
Series1Series1
Series1
Thrifts: 1.08% Banks: 6.02%
REITs: 27.98%
Foreign Investors: 11.27%Life Co.: 18.66%
Pensions:34.98%
Banks: 6.02%
Pensions:34.98%

0
20
40
60
80
100
120
70 72 74 76 78 80 82 84 86 88 90 92 94 96 98
Securitized Debt Capital Sources$Billions
MREITs
CMBSs
YearsSource: GSU Real Estate; Grissom

Interest RateInterest Rate Determinates: Classes of InflationDeterminates: Classes of Inflation
-.08
-.04
.00
.04
.08
.12
.16
50 55 60 65 70 75 80 85 90 95 00
Anticipate d Inflation
Actual Inflation
Unanticipate d Inflation
Infla tion Influences on C ost o f C apita lR ate s

-.05
.00
.05
.10
.15
.20
50 55 60 65 70 75 80 85 90 95
T o ta l R e turns a nd R e g im e s G N P , Inte re s t a nd T a x S pline T re ndsR e turns /R ate s
Ye ars
G N PG N P
Inte re s t
G N P
Inte re s t
Tax
Inte re s t
S ource : G S U, G ris s om & D e Lis leThis e xhibit s hows the s e gme nt e d s pline s or tre nd in thek e y caus al variable s impacting re al e s tate re turns ove r time .
R e al Es tateR e turns

-.04
.00
.04
.08
.12
.16
.20
50 55 60 65 70 75 80 85 90 95 00 05
Total Return Cycles and Long-term TrendTotal Return
Years
Total Return Series
Long-termTrend
57 Year Trend/CycleSource: Grissom, GSU:Data Sources: Ibbotson Associates and NCREIF data

-.04
.00
.04
.08
.12
.16
.20
50 55 60 65 70 75 80 85 90 95 00 05
Event and Return HistoryReturns
Years
KoreanWar
Creeping Inflation
KeynesianPolicy
Oil Crisis
Vietnam War
Oil Cris is
RepealBretton Woods
Disinter-mediation
Stagflation
M onetaryPolicy Supply-side
Reagonomics
Deregulation M CA
1981 TaxAct 1986 Tax
Act
Oil Concerns Oil Concerns
Gulf War
1993 TaxAct
Neo-Keynes ian
CommunistDevolution
1997 Tax Act
9-11 Event
ERISAFIRREA
TechnologyB ubble
Bust
CEO-SOBs
Comp. Conservatives
Source: Grissom, GSU
1991 FDICImprovement Act

General Real Estate Trends: Multiple Indices
- .0 8
- .0 4
.0 0
.0 4
.0 8
.1 2
.1 6
.2 0
8 6 8 8 9 0 9 2 9 4 9 6 9 8 0 0 0 2 0 4
I& A /N C R E IF
I& AN C R E IF
N C R E IF N C R E IF
I& AA C L I
A C L IN C R E IF
N R E I
N R E I
A C L IN C R E IF
N R E I
K YI
K YI
R E R C
A C L I
R E R C
C om p a r ison of A ltern a tive R etu rn s S er ie s :C on ver ted to In d ices
Tot
al R
etur
ns
Y ea r sS ou rce: G risso m G SU R ea l E tate C enter

Changes in Real Estate As Function of Capital Evolution
The changes:• More players: Increase flow of K to RE• Varying source of K• Increase instruments: Blended• Direct Real Estate: debt and equity• Indirect Real Estate: debt and equity
(securities or other derivatives)K = capital, RE = Real Estate

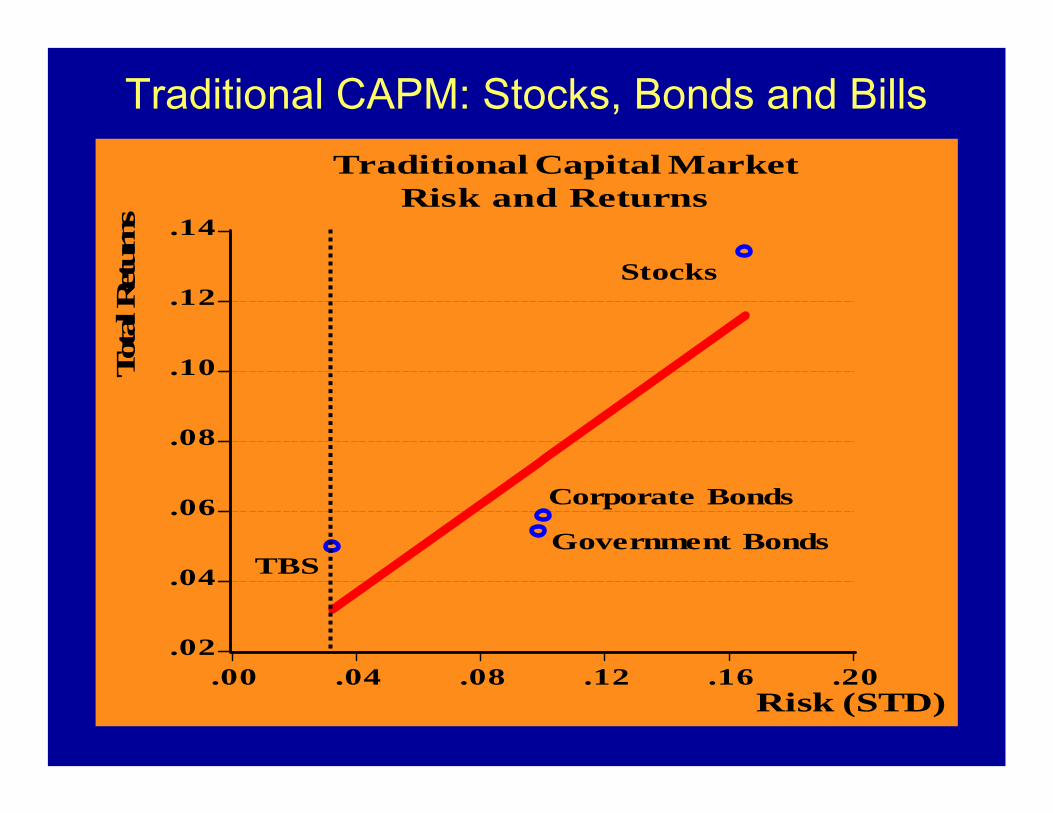
Traditional CAPM: Stocks, Bonds and Bills
.02
.04
.06
.08
.10
.12
.14
.00 .04 .08 .12 .16 .20
Traditional Capital Market Risk and Returns
TBS
Stocks
Corporate Bonds
Government Bonds
Tot
al R
etur
ns
Risk (STD)

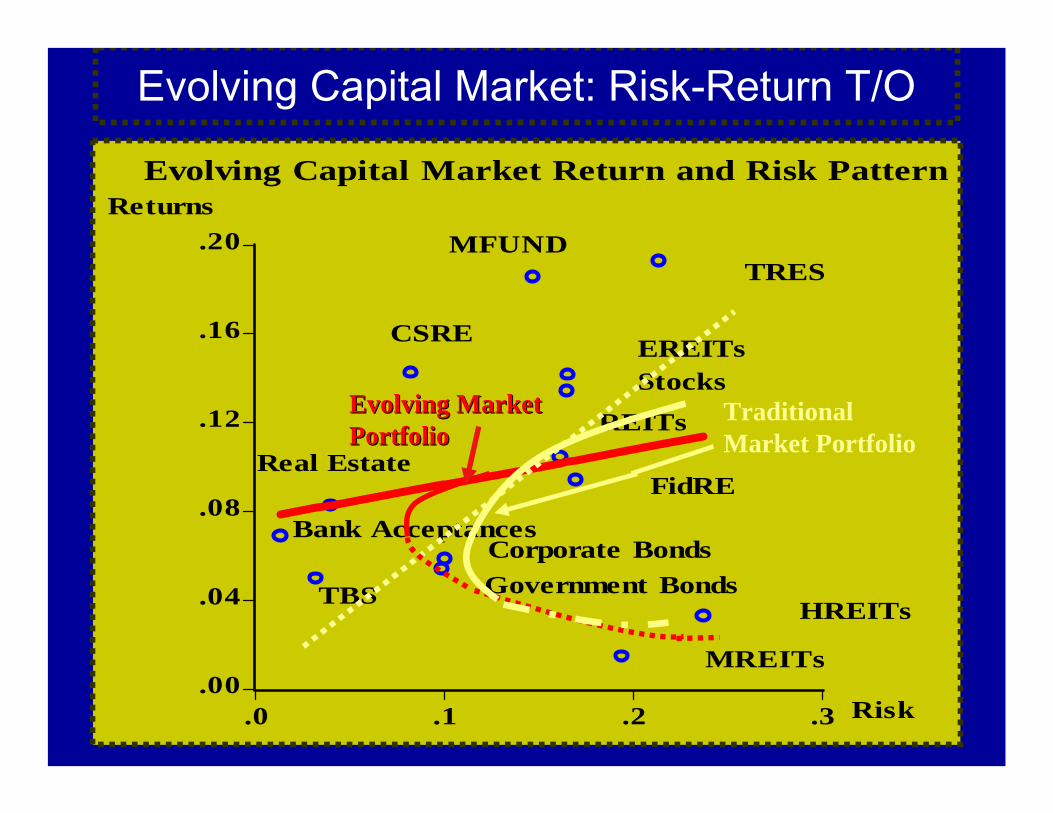
Evolving Capital Market: Risk-Return T/O
.00
.04
.08
.12
.16
.20
.0 .1 .2 .3
Evolving Capital Market Return and Risk Pattern
TBS
Bank AcceptancesCorporate BondsGovernment Bonds
MREITs
HREITs
Returns
Risk
Real EstateFidRE
EREITsStocks
REITs
CSRE
MFUNDTRES

Four Quadrant Strategy Private Public
Direct Eqty in Operating Cos. Commingled Funds Equity REITs
Equity Participating Interests Real Estate Securities Private Syndications Public Syndications Limited Partnerships RE Mutual Funds Co-investment Derivatives Development Development
Development Development Mortgages Mtg REITs Mortgage Pools Hybrid REITs
Debt Synthetic Leases Senior/Junior Positions Commingled Funds CMOs Participating Mtg Synthetic Leases Co-investment CMBSs

Enhanced Core Opportunistic -- Pools of partially defaulted loans, large broken deals, etc.
New Development
Core Agriculture
Fully Leased in the (concentration investment size Timber between $10-25 million) Office Retail Hotels, Healthcare, Industrial Mobile Home Parks Apartment
Modest Value Added - Traditional core properties with lease or rehab "challenges"
Equity in Private Real Estate Companies
Below - investment- grade CMBS
Equity in public real estate companies
Enhanced Core

The End!

Appendix
Extension of Real Estate, Direct and Indirect to International Asset Classes

International Real Estate Securities
The European Public Real Estate Association (EPRA):
• offers a global data base of securitized national market portfolios
• Data base allows the development of market models for both property and equity
• A characteristic line can also be developed per national portfolios

International Real Estate Securities
The EPRA data is a foundation for a market model per national asset/portfolio measures:•Market Model
E(Ri) = αi + βiM( RM) ± εi
• The beta parameter βiM reflects the sensitivity of the asset to market volatility
• αi reflects the return component not associatedwith the market

International Real Estate SecuritiesMarket Model enables a characteristic line for each asset/portfolio:
E(Ri) = βiM( RM) (+) αi + εi
Systematic Unsystematic

.0
.1
.2
.3
.4
.5
.6
.7
2 4 6 8 10 12 14 16 18 20 22 24
Diverification Impacts
Standard Deviationper Portfolio
Systematic Risk Portfolio Rankby Numberof Securities
Theoretical RiskTrend with Diversified Portfolios

.0
.1
.2
.3
.4
.5
.6
.7
2 4 6 8 10 12 14 16 18 20 22 24 26
Real Estate Securities Risk as f(n)
Equity Securities Risk as f(n)
Evans and Archer Naive Diversification ModelRisk
P(n)
International Real Estate Securities
EPRA

-.1
.0
.1
.2
.3
.4
.5
.6
.7
2 4 6 8 10 12 14 16 18 20 22
Real Estate Portfolio
GlobalEquity Portfolio
GlobalSystematic Risk
RiskDiversification: Asset Structure in Evan & Archer Model
P(n)
Equity Portfolio
Real Estate Systematic Risk

.0
.1
.2
.3
.4
.5
.6
2 4 6 8 10 12 14 16 18 20 22
Risky Asset Risk Spac e Ide ntity G rid
Real Estate Securities Risk:f(As set Structure)
Equitty Risk: f(Asset Structure).
Asset Secant
Risk
Ris kM agnitude

Traditional CAPM: Stocks, Bonds and Bills & R E
.04
.06
.08
.10
.12
.14
.00 .04 .08 .12 .16 .20
Traditional Capital Market Risk and ReturnTotal Returns
Stocks
Corporate Bonds
Government BondsTBS
CompositeReal Estate
AtlantaIndustrial
NationalIndustrial
Traditional CAPM: Stocks, Bonds and Bills
.02
.04
.06
.08
.10
.12
.14
.00 .04 .08 .12 .16 .20
Traditional Capital Market Risk and Returns
TBS
Stocks
Corporate Bonds
Government Bonds
Tot
al R
etur
ns
Risk (STD)
Evolving Capital Market: Risk-Return T/O
.00
.04
.08
.12
.16
.20
.0 .1 .2 .3
Evolving Capital Market Return and Risk Pattern
TBS
Bank AcceptancesCorporate BondsGovernment Bonds
MREITs
HREITs
Returns
Risk
Real EstateFidRE
EREITsStocks
REITs
CSRE
MFUNDTRES
Traditional Market Portfolio
Evolving Market Evolving Market PortfolioPortfolio

Evolving Capital Market: Risk-Return T/O
.00
.04
.08
.12
.16
.20
.0 .1 .2 .3
Evolving Capital Market Return and Risk Pattern
TBS
Bank AcceptancesCorporate BondsGovernment Bonds
MREITs
HREITs
Returns
Risk
Real EstateFidRE
EREITsStocks
REITs
CSRE
MFUNDTRES
O O

Table 4 Alternative Theories of Distribution
Traditional Contemporary Alternative Labor Labor: CAPITAL:
Entrepreneuership Real Capital: Technology Real Real
Financial Financial Capital: Land Real Entrepreneur Financial Labor Entrepreneurship Land Land

-.08
-.04
.00
.04
.08
.12
.16
.20
86 88 90 92 94 96 98 00 02 04
I&A/NCREIF
I&ANCREIF
NCREIF NCREIF
I&AACLI
ACLINCREIF
NREI
NREI
ACLINCREIF
NREI
KYI
KYI
RERC
ACLI
RERC
Comparison of Alternative Returns Series:Converted to Indices
Tota
l R
etur
ns
YearsSource: Grissom GSU Real Etate Center