first light in the universe richard ellis, caltech 1.role of observations in cosmology & galaxy...
TRANSCRIPT
FIRST LIGHT IN THE UNIVERSEFIRST LIGHT IN THE UNIVERSE
Richard Ellis, Caltech
1. Role of Observations in Cosmology & Galaxy Formation
2. Galaxies & the Hubble Sequence
3. Cosmic Star Formation Histories
4. Stellar Mass Assembly
5. Witnessing the End of Cosmic Reionization
6. Into the Dark Ages: Lyman Dropouts
7. Gravitational Lensing & Lyman Alpha Emitters
8. Cosmic Infrared Background
9. Future Observational Prospects
Saas-Fee, April 2006
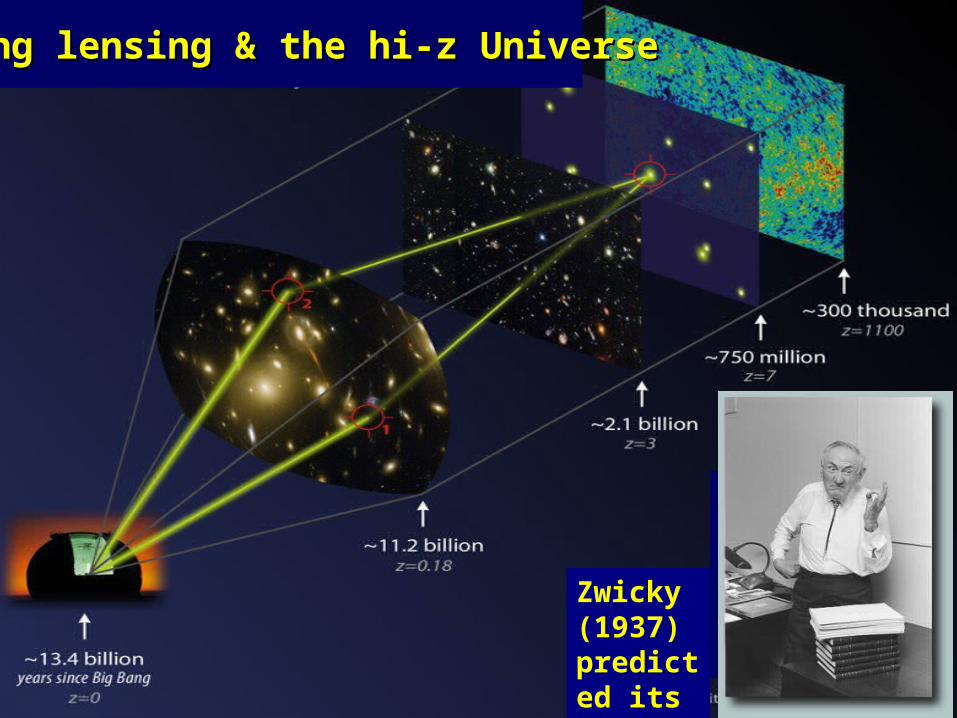
Strong lensing & the hi-z UniverseStrong lensing & the hi-z Universe
Zwicky (1937) predicted its utility
QuickTime™ and aSorenson Video decompressorare needed to see this picture.
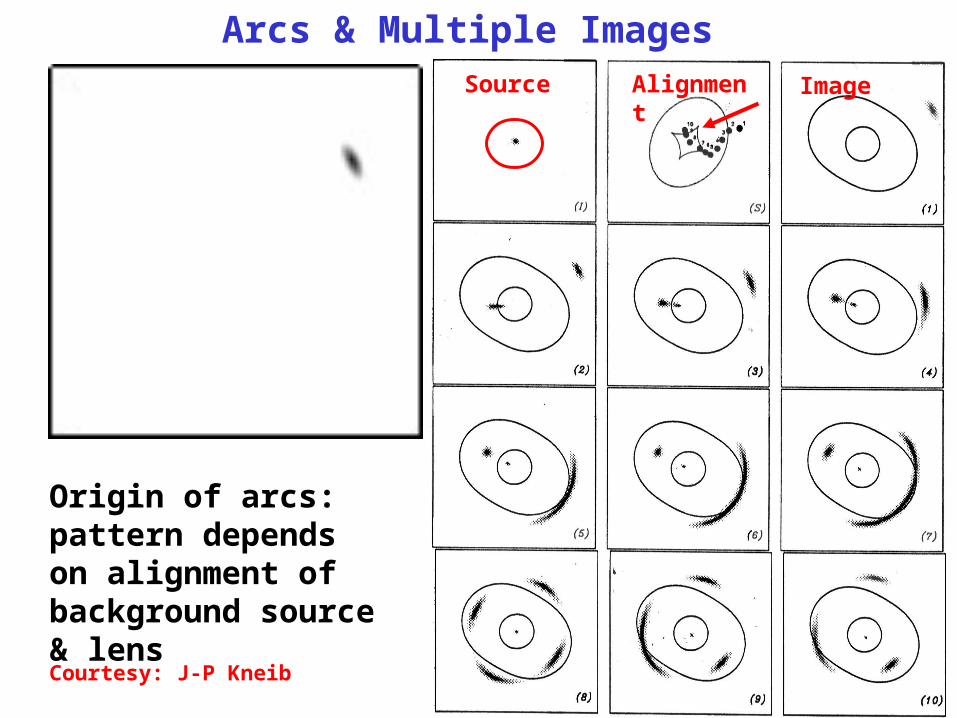
Arcs & Multiple Images
Origin of arcs: pattern depends on alignment of background source & lens
Source Alignment Image
Courtesy: J-P Kneib
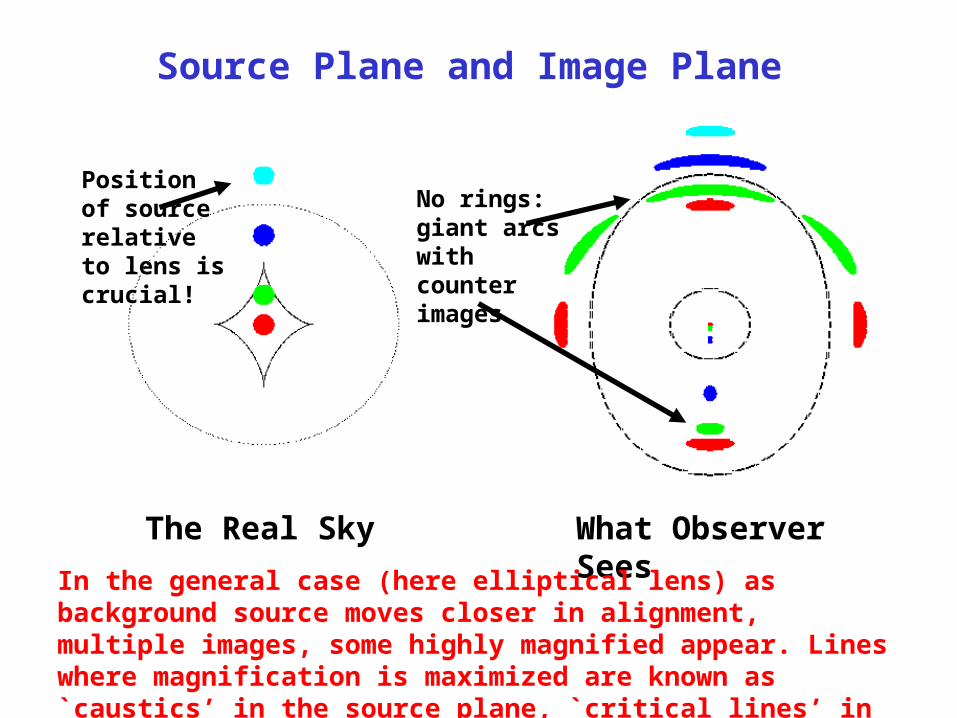
Source Plane and Image Plane
The Real Sky What Observer Sees
In the general case (here elliptical lens) as background source moves closer in alignment, multiple images, some highly magnified appear. Lines where magnification is maximized are known as `caustics’ in the source plane, `critical lines’ in the image plane.
Position of source relative to lens is crucial!
No rings: giant arcs with counter images
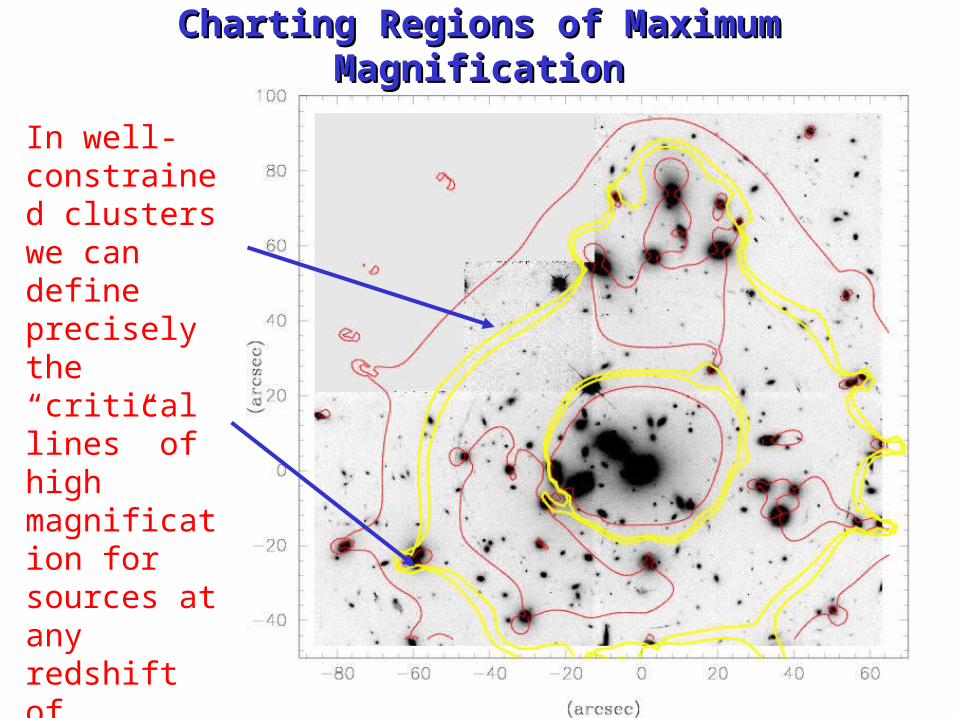
Charting Regions of Maximum MagnificationCharting Regions of Maximum Magnification
In well-constrained clusters we can define precisely the “critical lines” of high magnification for sources at any redshift of interest.
How do we locate where these critical lines lie?
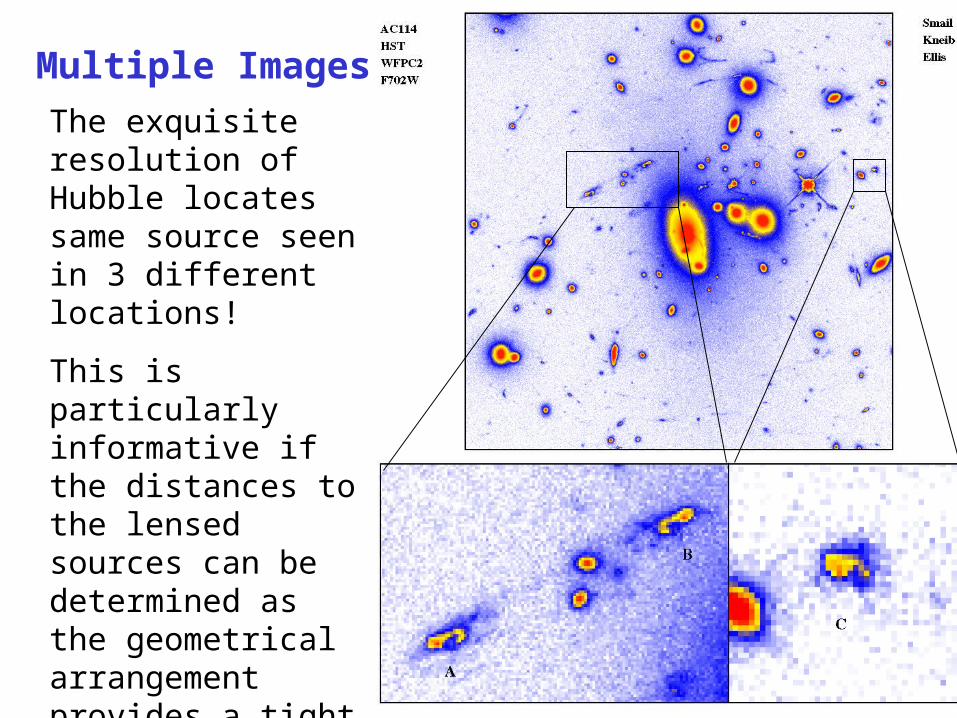
The exquisite resolution of Hubble locates same source seen in 3 different locations!
This is particularly informative if the distances to the lensed sources can be determined as the geometrical arrangement provides a tight constraint on the distribution of DM in the lens
Multiple Images
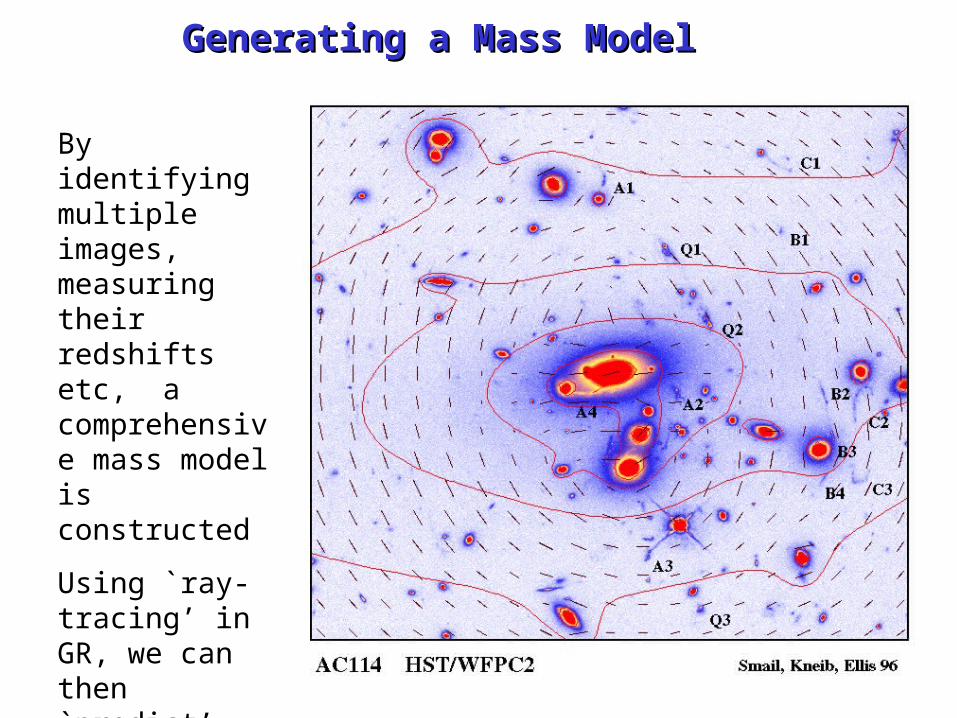
Generating a Mass ModelGenerating a Mass Model
By identifying multiple images, measuring their redshifts etc, a comprehensive mass model is constructed
Using `ray-tracing’ in GR, we can then `predict’ how background sources of any z will be lensed
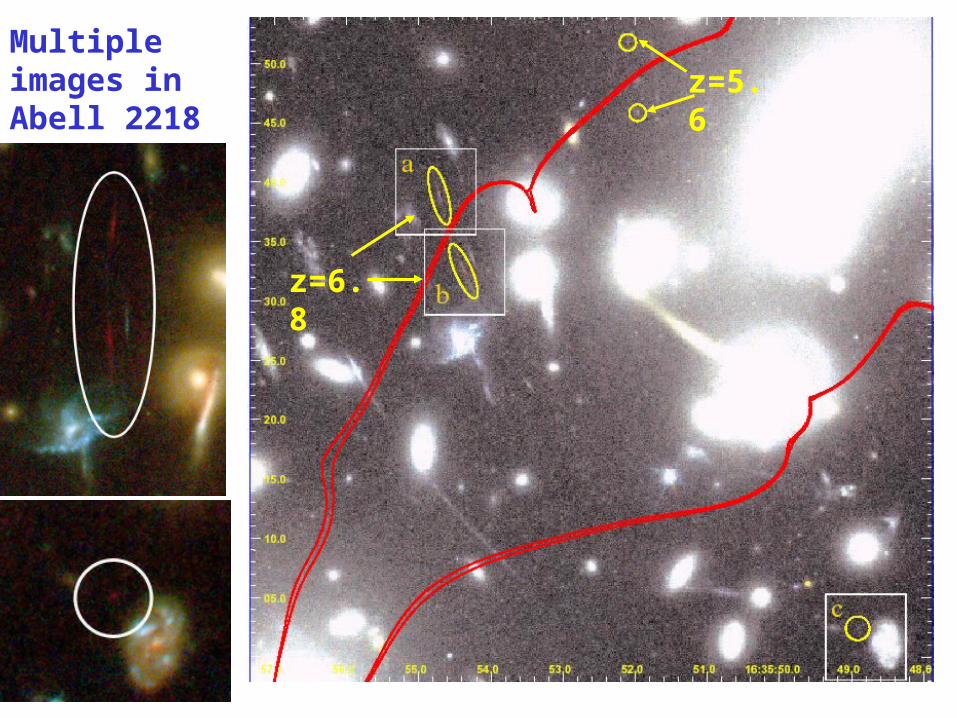
Multiple images in Abell 2218 z=5.6
z=6.8
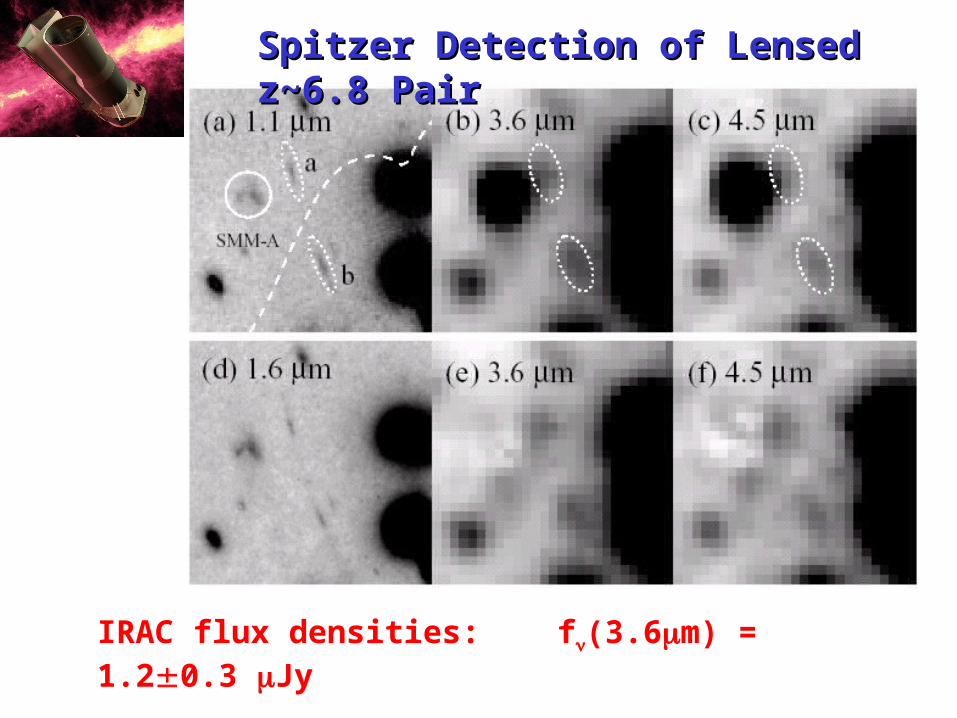
Spitzer Detection of Lensed z~6.8 PairSpitzer Detection of Lensed z~6.8 Pair
IRAC flux densities: f(3.6m) = 1.20.3 Jy
f(4.5m) = 1.0 0.2 Jy
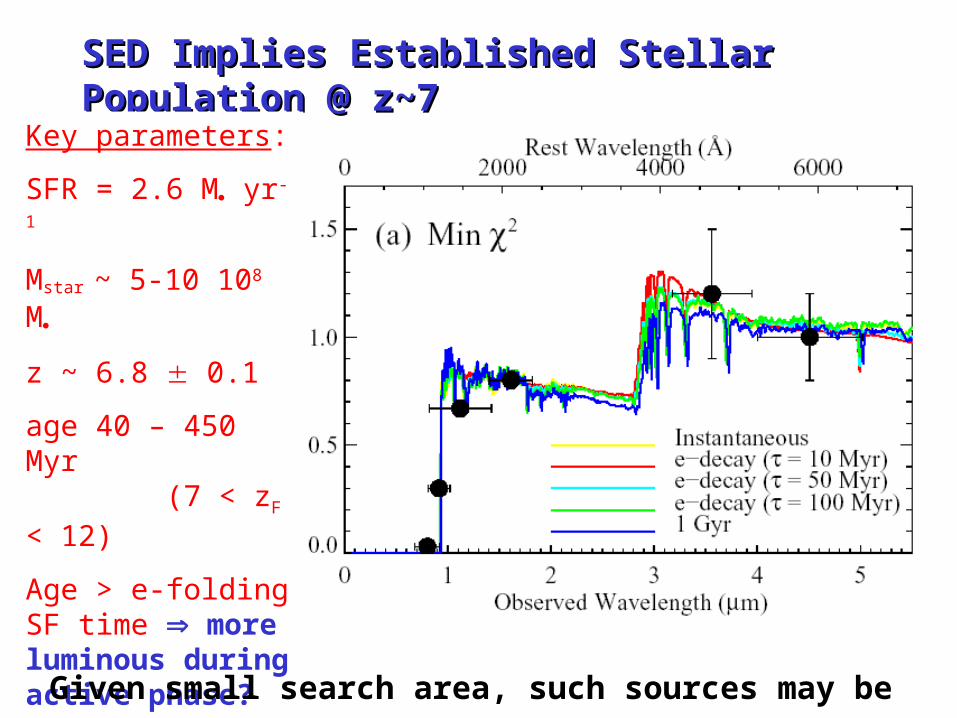
SED Implies Established Stellar Population @ z~7SED Implies Established Stellar Population @ z~7
Key parameters:
SFR = 2.6 M yr-1
Mstar ~ 5-10 108 M
z ~ 6.8 0.1
age 40 – 450 Myr (7 < zF < 12)
Age > e-folding SF time more luminous during active phase?
(Egami et al 2005, Ap J 618, L5)
Given small search area, such sources may be very common
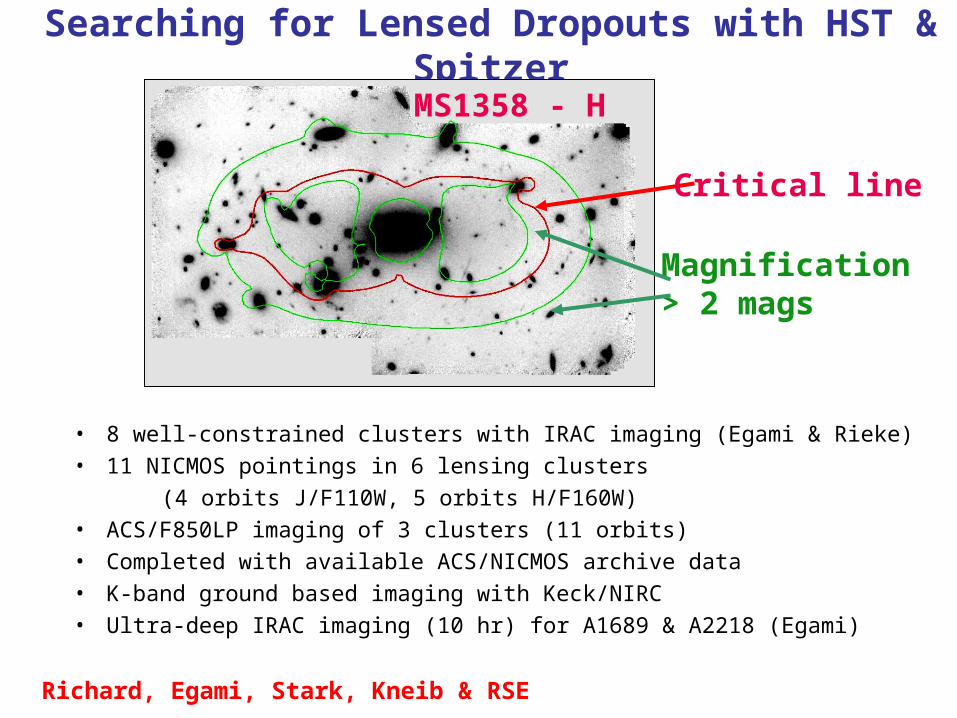
Searching for Lensed Dropouts with HST & Spitzer
• 8 well-constrained clusters with IRAC imaging (Egami & Rieke)
• 11 NICMOS pointings in 6 lensing clusters
(4 orbits J/F110W, 5 orbits H/F160W)
• ACS/F850LP imaging of 3 clusters (11 orbits)
• Completed with available ACS/NICMOS archive data
• K-band ground based imaging with Keck/NIRC
• Ultra-deep IRAC imaging (10 hr) for A1689 & A2218 (Egami)
MS1358 - H
Critical line
Magnification > 2 mags
Richard, Egami, Stark, Kneib & RSE
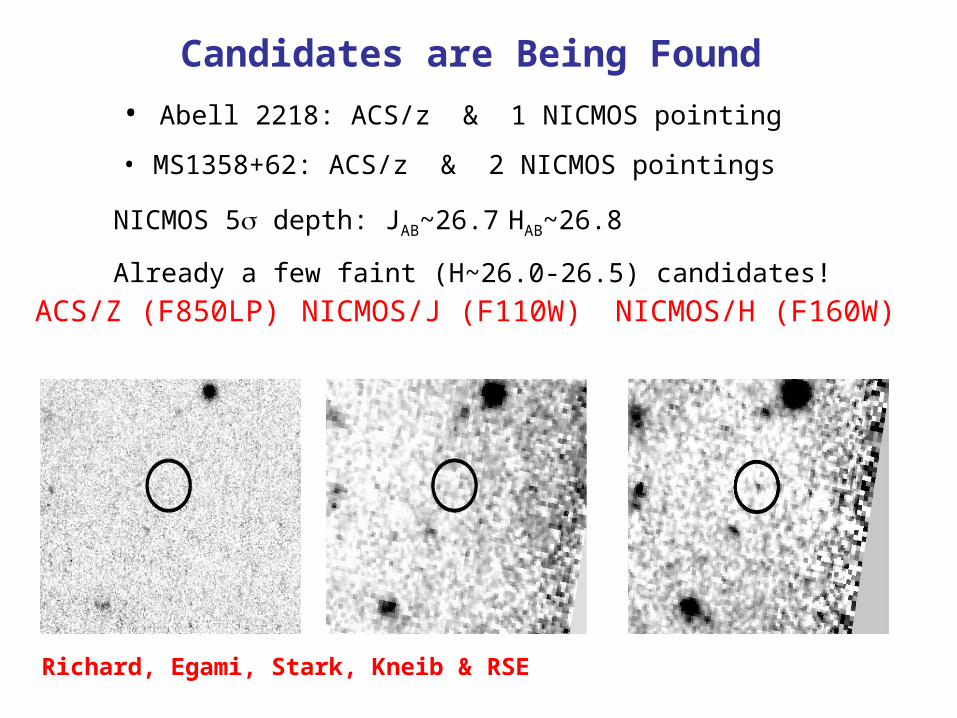
Candidates are Being Found
• Abell 2218: ACS/z & 1 NICMOS pointing
• MS1358+62: ACS/z & 2 NICMOS pointings
NICMOS 5 depth: JAB~26.7 HAB~26.8
Already a few faint (H~26.0-26.5) candidates!
ACS/Z (F850LP) NICMOS/J (F110W) NICMOS/H (F160W)
Richard, Egami, Stark, Kneib & RSE
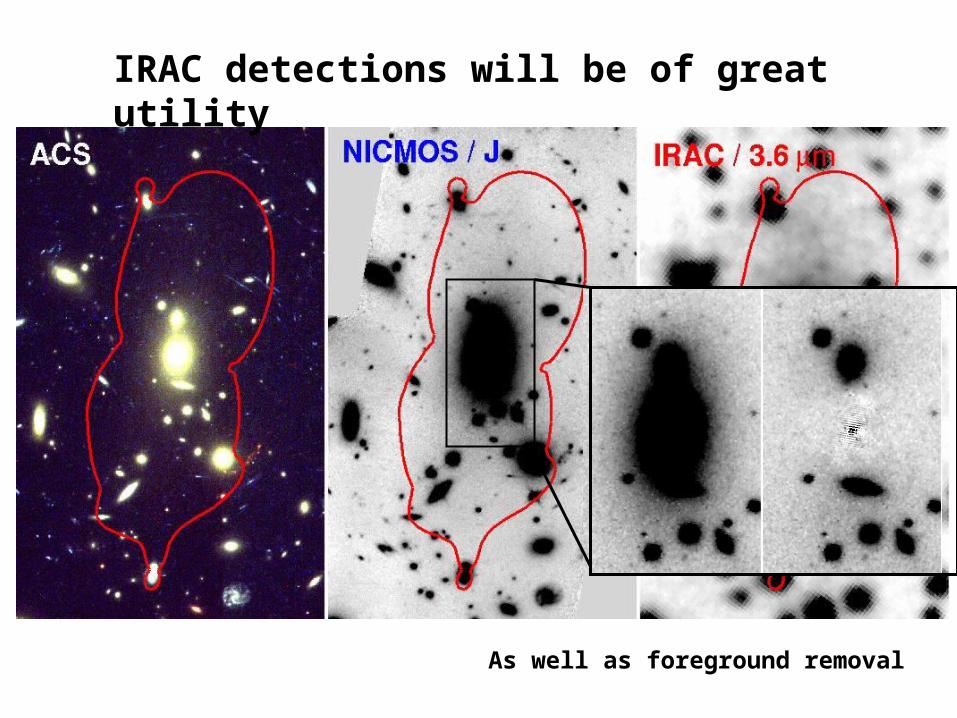
IRAC detections will be of great utility
As well as foreground removal
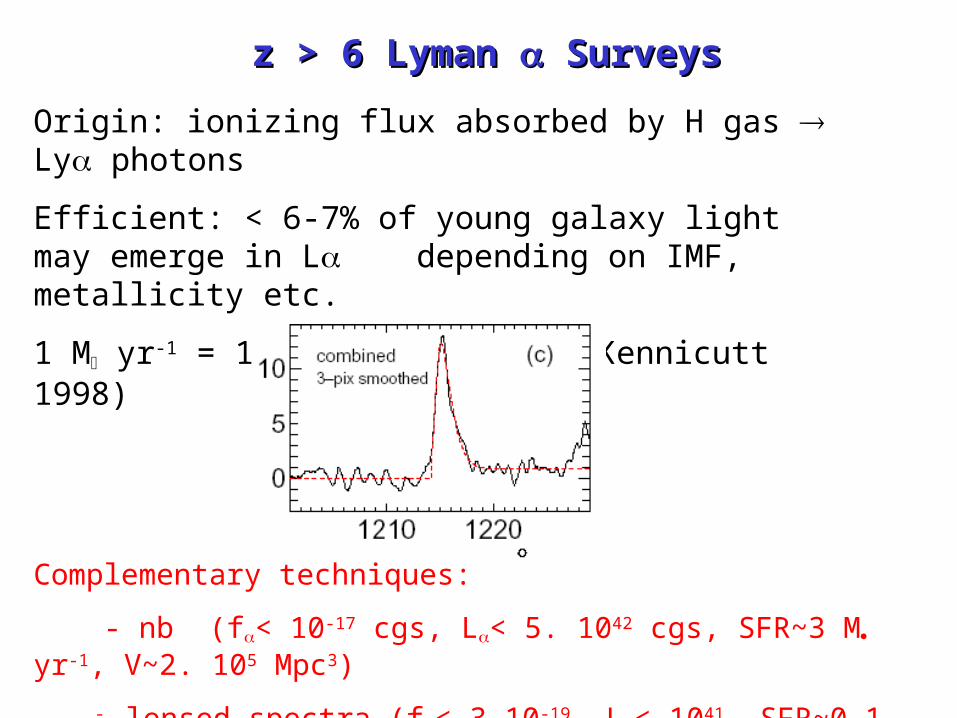
z > 6 Lyman z > 6 Lyman Surveys Surveys
Complementary techniques:
- nb (f< 10-17 cgs, L< 5. 1042 cgs, SFR~3 M yr-1, V~2. 105 Mpc3)
- lensed spectra (f< 3.10-19, L< 1041, SFR~0.1 M yr-1, V <50 Mpc3)
Origin: ionizing flux absorbed by H gas Ly photons
Efficient: < 6-7% of young galaxy light may emerge in Ldepending on IMF, metallicity etc.
1 M yr-1 = 1.5 1042 ergs sec-1 (Kennicutt 1998)
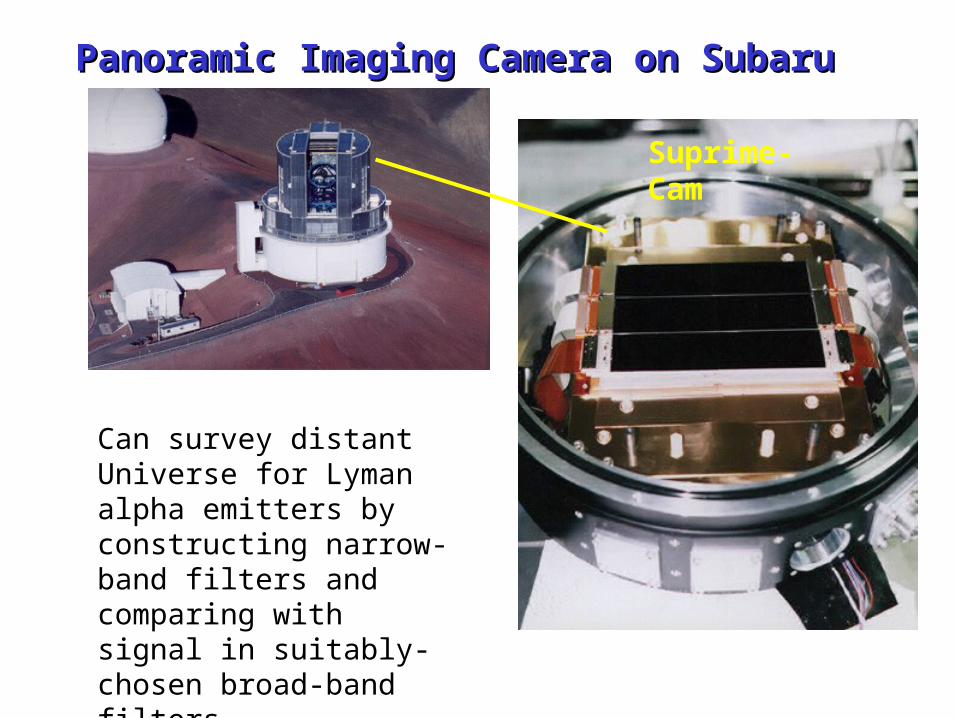
Panoramic Imaging Camera on SubaruPanoramic Imaging Camera on Subaru
Megacam
Suprime-Cam
Can survey distant Universe for Lyman alpha emitters by constructing narrow-band filters and comparing with signal in suitably-chosen broad-band filters
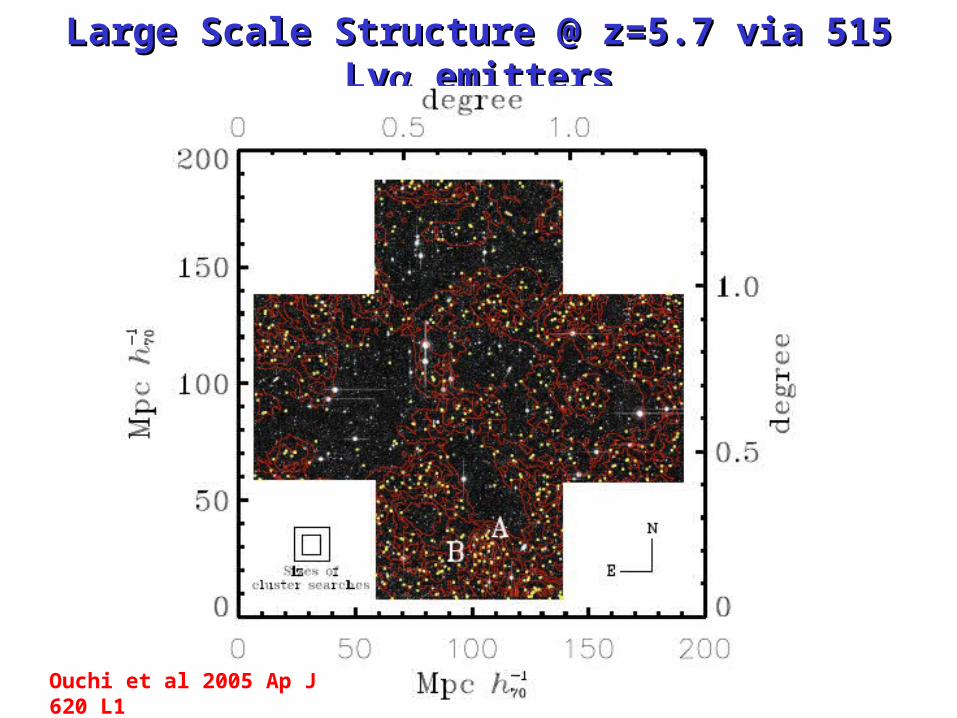
Large Scale Structure @ z=5.7 via 515 LyLarge Scale Structure @ z=5.7 via 515 Ly emitters emitters
Ouchi et al 2005 Ap J 620 L1
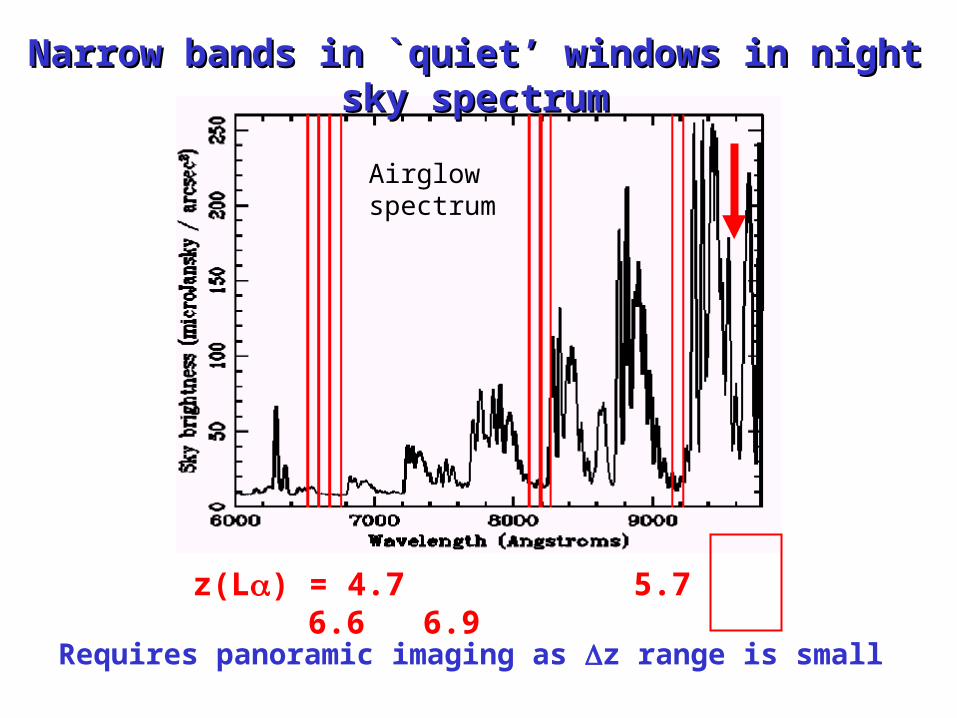
Narrow bands in `quiet’ windows in night sky spectrumNarrow bands in `quiet’ windows in night sky spectrum
z(L) = 4.7 5.7 6.6 6.9
Requires panoramic imaging as z range is small
Airglow spectrum
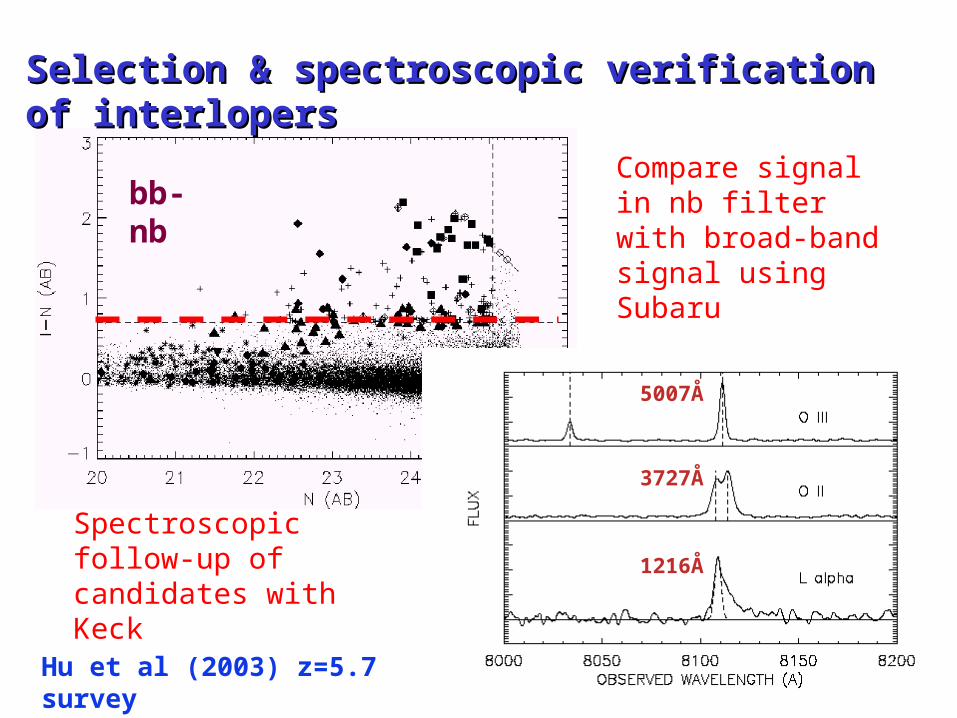
Selection & spectroscopic verification of interlopersSelection & spectroscopic verification of interlopers
Hu et al (2003) z=5.7 survey
Compare signal in nb filter with broad-band signal using Subaru
bb-nb
Spectroscopic follow-up of candidates with Keck
5007Å
3727Å
1216Å
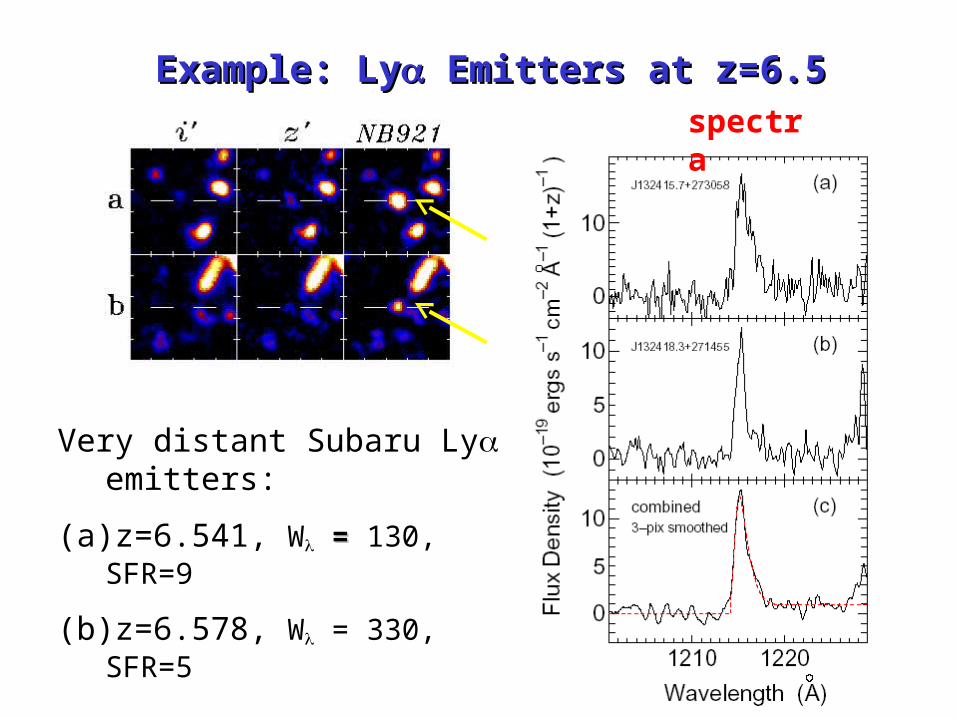
Example: LyExample: Ly Emitters at z=6.5 Emitters at z=6.5
Very distant Subaru Ly emitters:
(a) z=6.541, W = = 130, SFR=9
(b) z=6.578, W = 330, SFR=5
Kodaira et al (2003) PASJ 55, 17
spectra
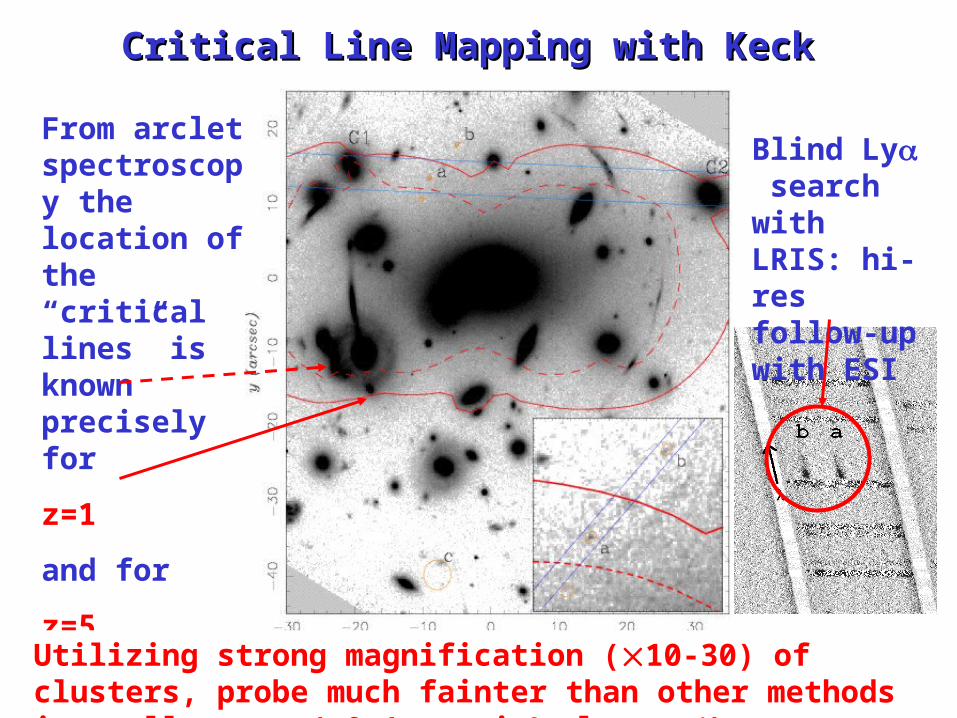
Critical Line Mapping with KeckCritical Line Mapping with Keck
From arclet spectroscopy the location of the “critical lines” is known precisely for
z=1
and for
z=5
Blind Ly search with LRIS: hi-res follow-up with ESI
Utilizing strong magnification (10-30) of clusters, probe much fainter than other methods in small areas (<0.1 arcmin2 cluster-1)

• Mag x30 unlensed f(L)= 2. 10-18 cgs; 20 fainter than unlensed searches
• Unlensed L luminosity (1042 cgs) SFR 0.5 M yr-1
• Faint continuum (<6. 10-21 cgs Å-1) implies age < 1-2 Myr
Galaxy with 107M at z=5.7
Lyman Alpha Emission and the IGMLyman Alpha Emission and the IGM
Lyman alpha emission: n=21, E=10.199eV, 1216Å
Resonant transition:
• foreground H gas cloud scatters away Ly photons in direction and frequency
• in partly ionized IGM, scattering is maximum at 1216Å in rest-frame of gas cloud - affects blue side of observed line
• in fully neutral IGM, scattering far from resonance can occur - damping wings
As a result many workers have stressed the importance of monitoring evolution in the Ly LF and the line profile
Miralda-Escude 1998 Ap J 501, 15 Haiman 2002 Ap J 576, L1 Barkana & Loeb 2004 Ap J 601, 64 Santos 2004 MNRAS 349, 1137
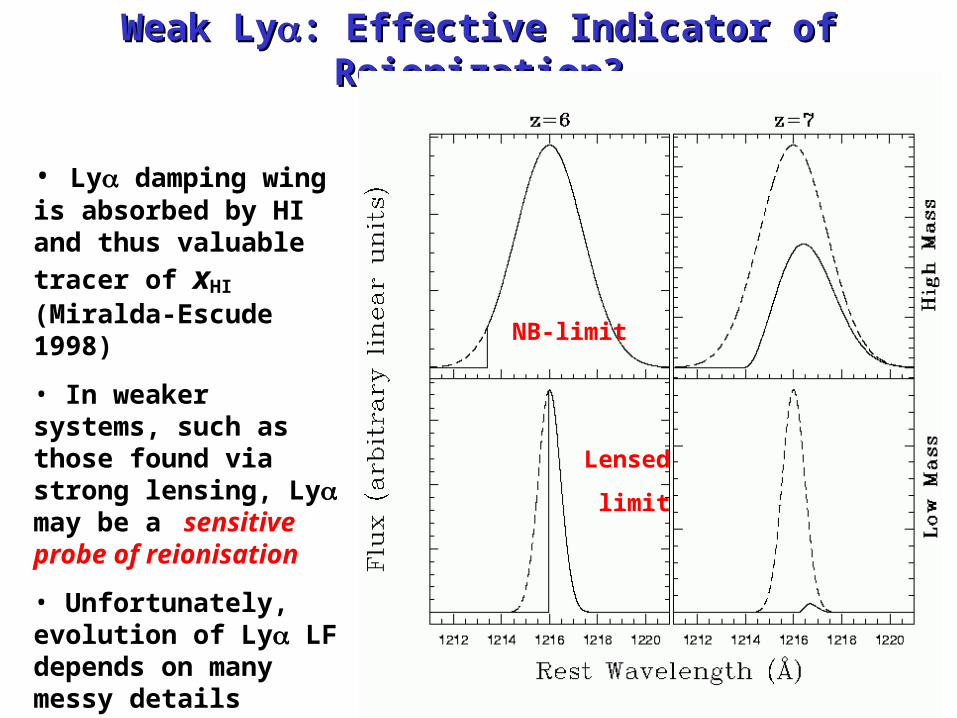
• Ly damping wing is absorbed by HI and thus
valuable tracer of xHI
(Miralda-Escude 1998)
• In weaker systems, such as those found via strong lensing, Ly may be a sensitive probe of reionisation
• Unfortunately, evolution of Ly LF depends on many messy details (Furlanetto et al 2005)
Weak LyWeak Ly: Effective Indicator of Reionization?: Effective Indicator of Reionization?
NB-limit
Lensed
limit
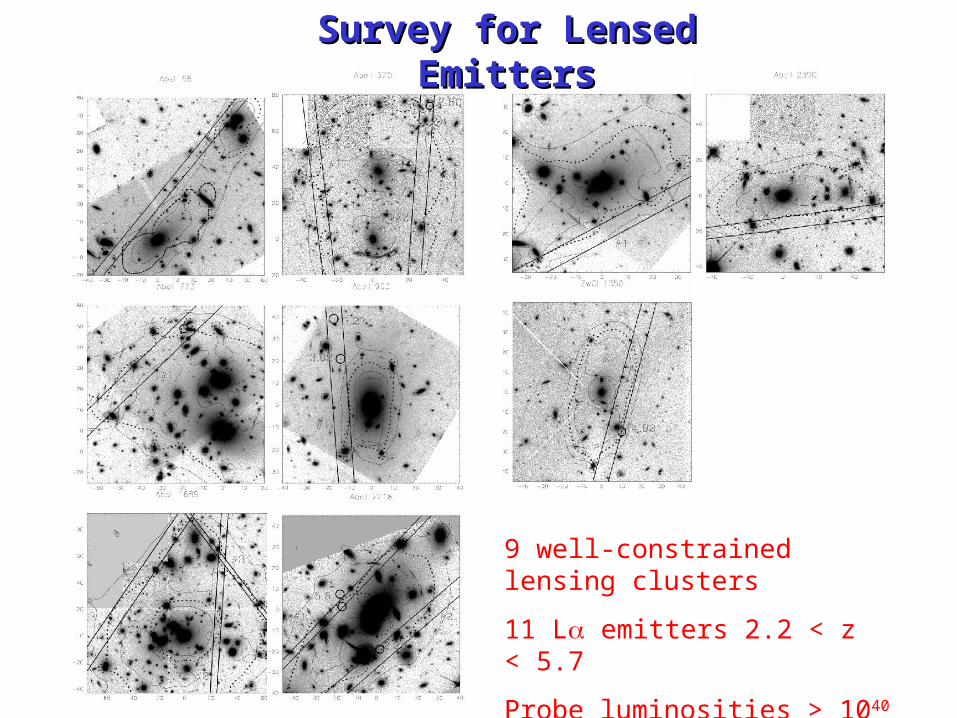
Survey for Lensed EmittersSurvey for Lensed Emitters
9 well-constrained lensing clusters
11 L emitters 2.2 < z < 5.7
Probe luminosities > 1040 cgs
Santos et al Ap J 606, 683 (2004)
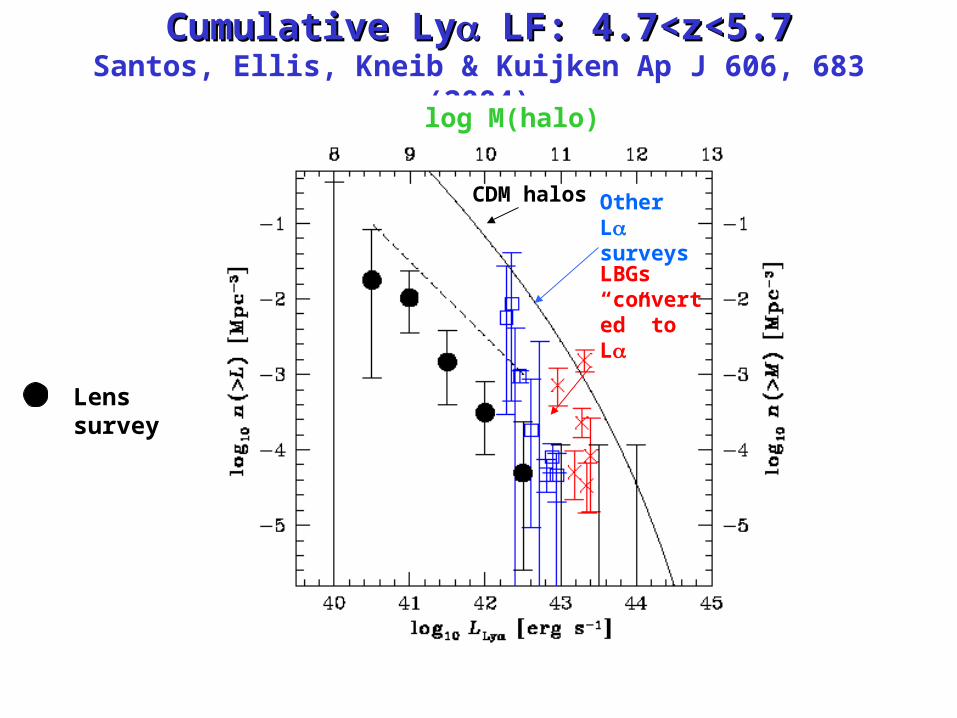
Cumulative LyCumulative Ly LF: 4.7<z<5.7 LF: 4.7<z<5.7Santos, Ellis, Kneib & Kuijken Ap J 606, 683 (2004)
Other L surveys
LBGs “converted” to L
CDM halos
log M(halo)
Lens survey
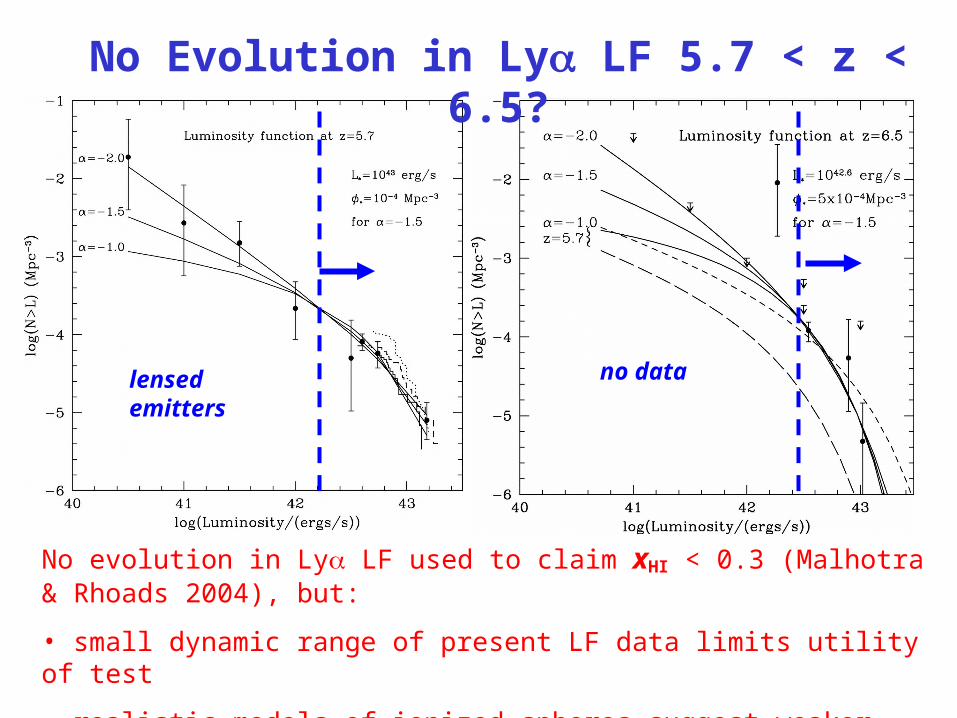
No Evolution in Ly LF 5.7 < z < 6.5?
No evolution in Ly LF used to claim xHI < 0.3 (Malhotra & Rhoads 2004), but:
• small dynamic range of present LF data limits utility of test
• realistic models of ionized spheres suggest weaker constraint (Furlanetto et al 2005) indicating strong emitters will persist until xHI ~ 0.5
lensed emitters no data
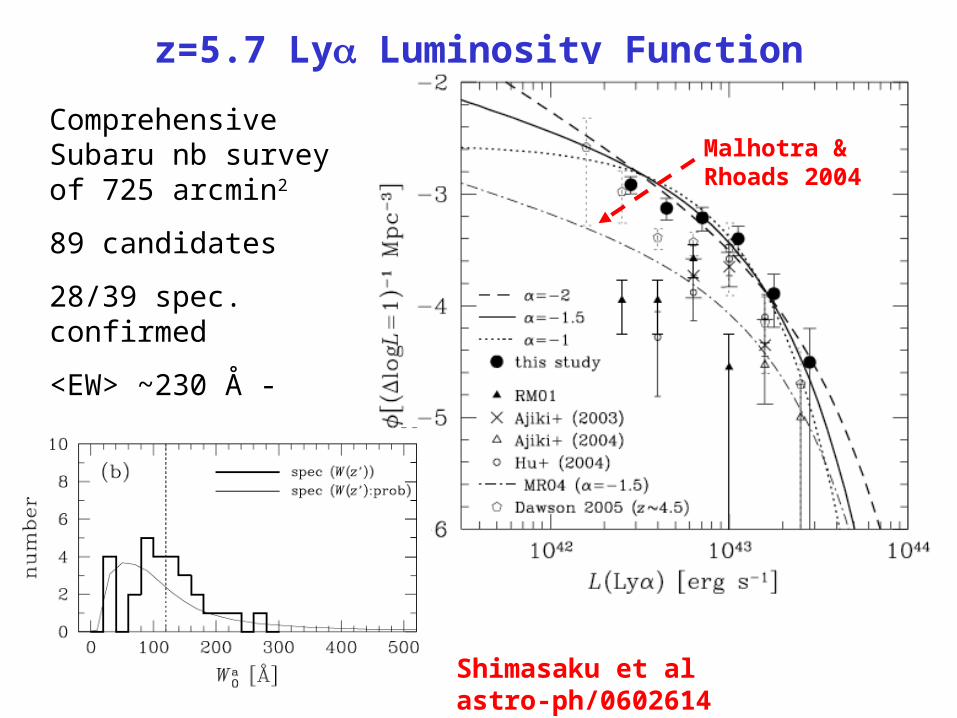
z=5.7 Ly Luminosity Function
Shimasaku et al astro-ph/0602614
Comprehensive Subaru nb survey of 725 arcmin2
89 candidates
28/39 spec. confirmed
<EW> ~230 Å - normal stellar popn.
Malhotra & Rhoads 2004
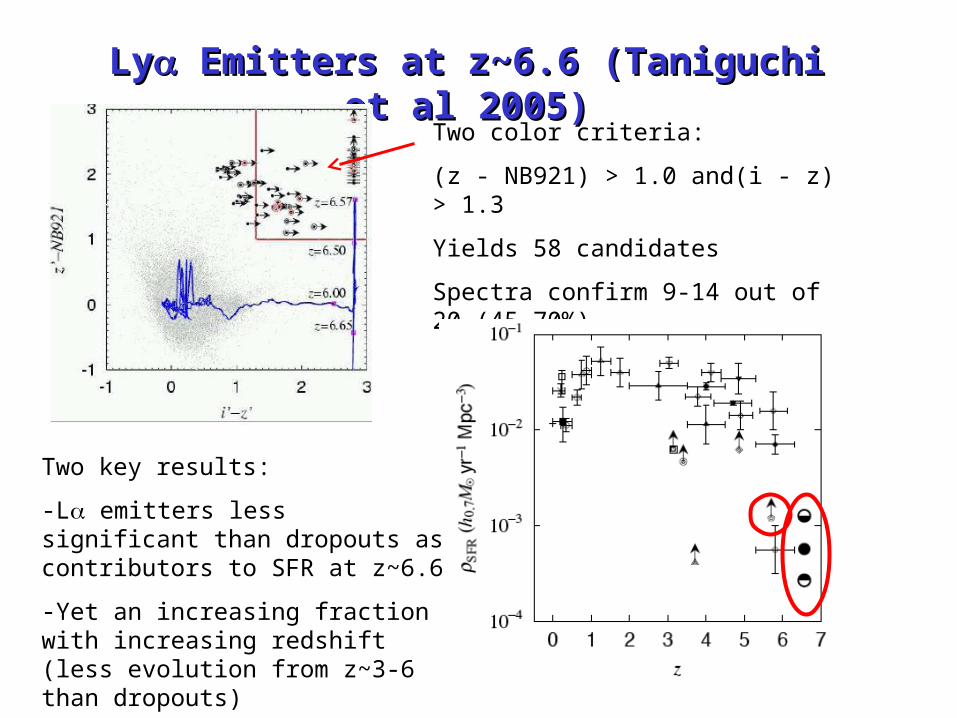
LyLy Emitters at z~6.6 (Taniguchi et al 2005) Emitters at z~6.6 (Taniguchi et al 2005)
Two color criteria:
(z - NB921) > 1.0 and(i - z) > 1.3
Yields 58 candidates
Spectra confirm 9-14 out of 20 (45-70%)
Two key results:
-L emitters less significant than dropouts as contributors to SFR at z~6.6
-Yet an increasing fraction with increasing redshift (less evolution from z~3-6 than dropouts)
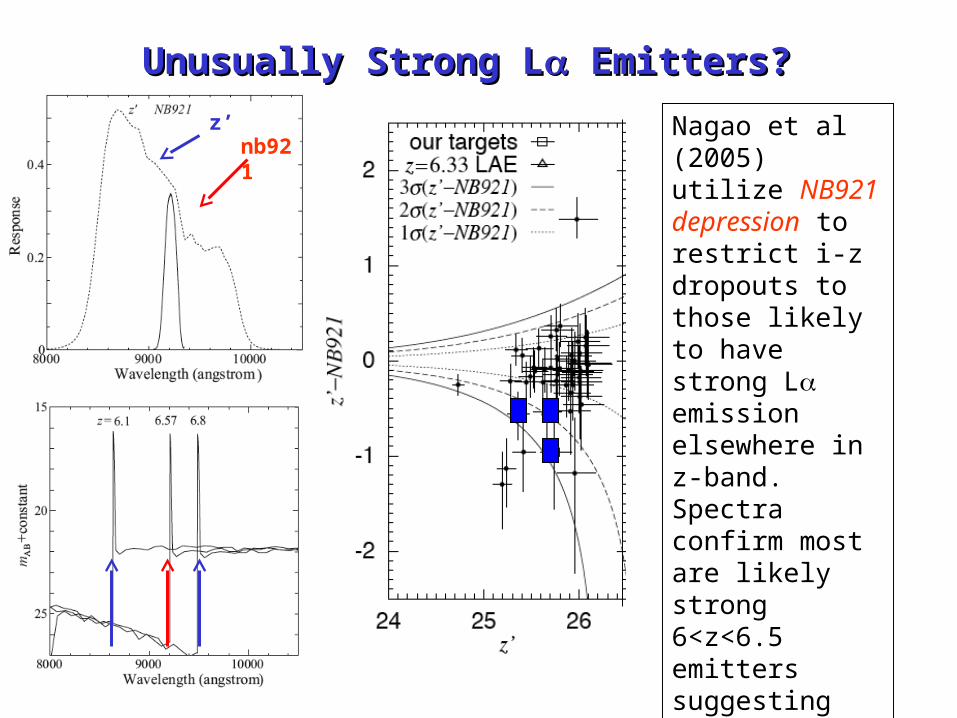
Unusually Strong LUnusually Strong L Emitters? Emitters?
Nagao et al (2005) utilize NB921 depression to restrict i-z dropouts to those likely to have strong L emission elsewhere in z-band. Spectra confirm most are likely strong 6<z<6.5 emitters suggesting redshift evolution in EW distribution
nb921z’
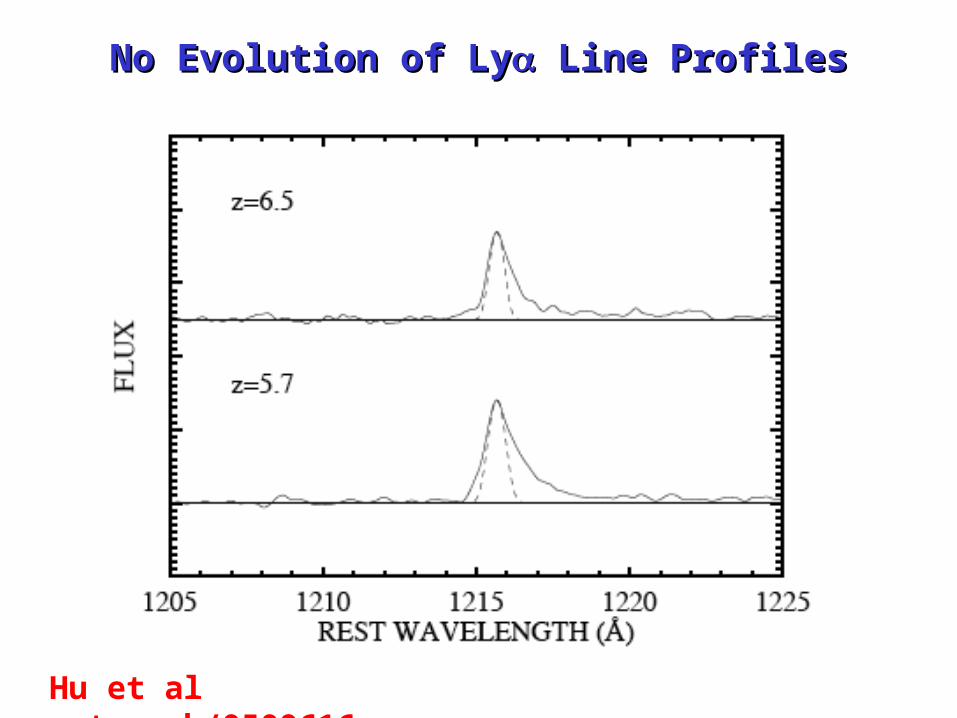
No Evolution of LyNo Evolution of Ly Line Profiles Line Profiles
Hu et al astro-ph/0509616
D. Stark Keck Science Meeting, 2005
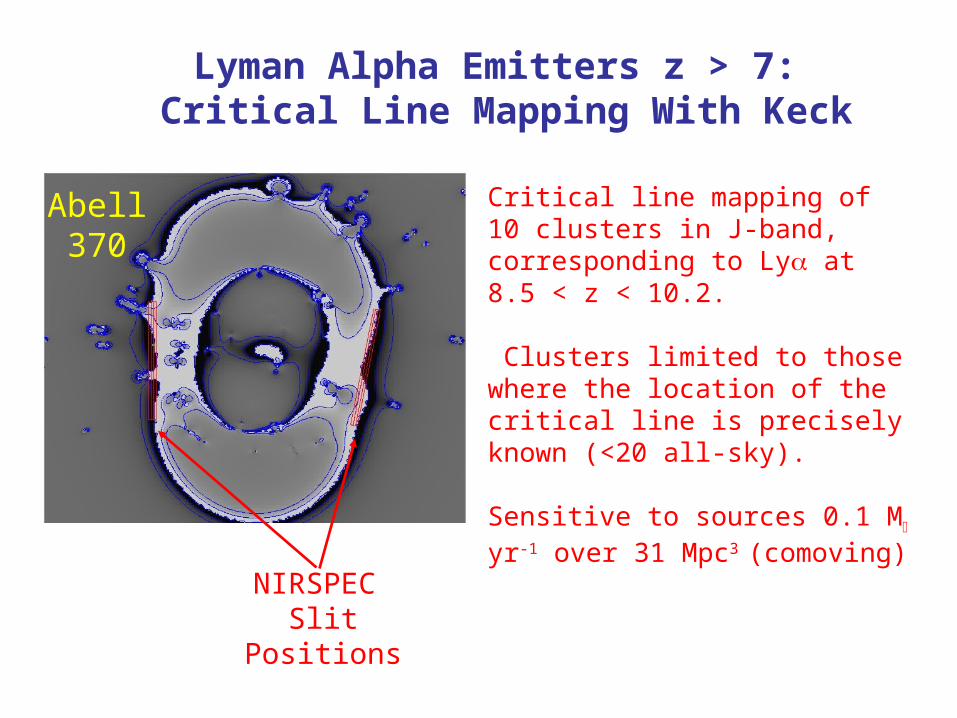
Lyman Alpha Emitters z > 7: Critical Line Mapping With Keck
Abell 370
NIRSPEC Slit
Positions
Critical line mapping of 10 clusters in J-band, corresponding to Ly at 8.5 < z < 10.2.
Clusters limited to those where the location of the critical line is precisely known (<20 all-sky).
Sensitive to sources 0.1 M yr-1 over 31 Mpc3
(comoving)
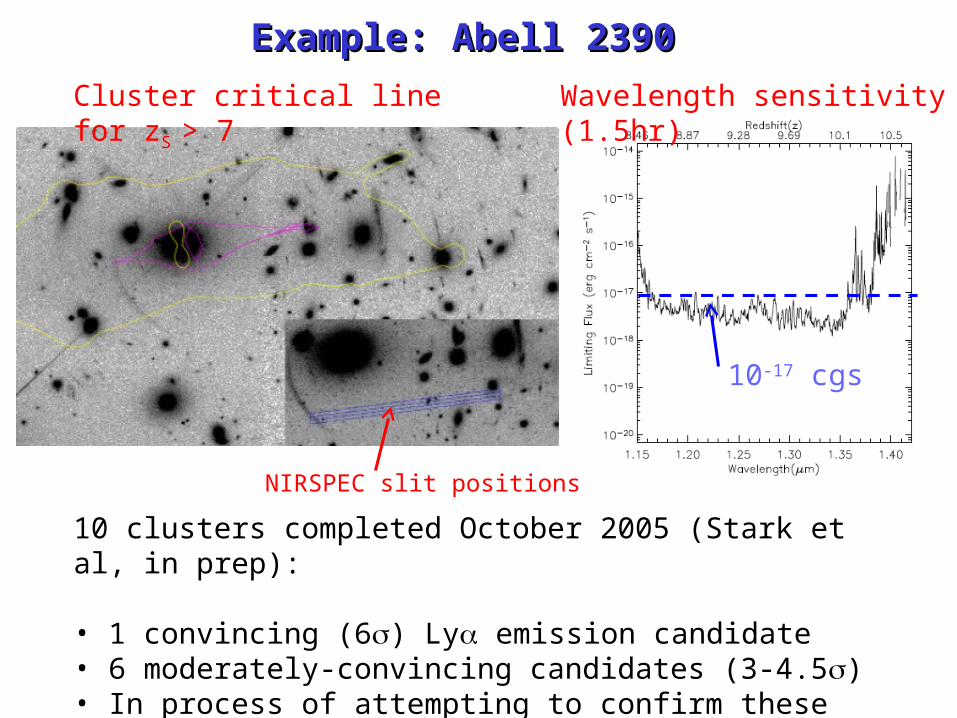
Example: Abell 2390Example: Abell 2390
Cluster critical line for zS > 7
NIRSPEC slit positions
Wavelength sensitivity (1.5hr)
10-17 cgs
10 clusters completed October 2005 (Stark et al, in prep):
• 1 convincing (6) Ly emission candidate• 6 moderately-convincing candidates (3-4.5)• In process of attempting to confirm these
D. Stark Keck Science Meeting, 2005
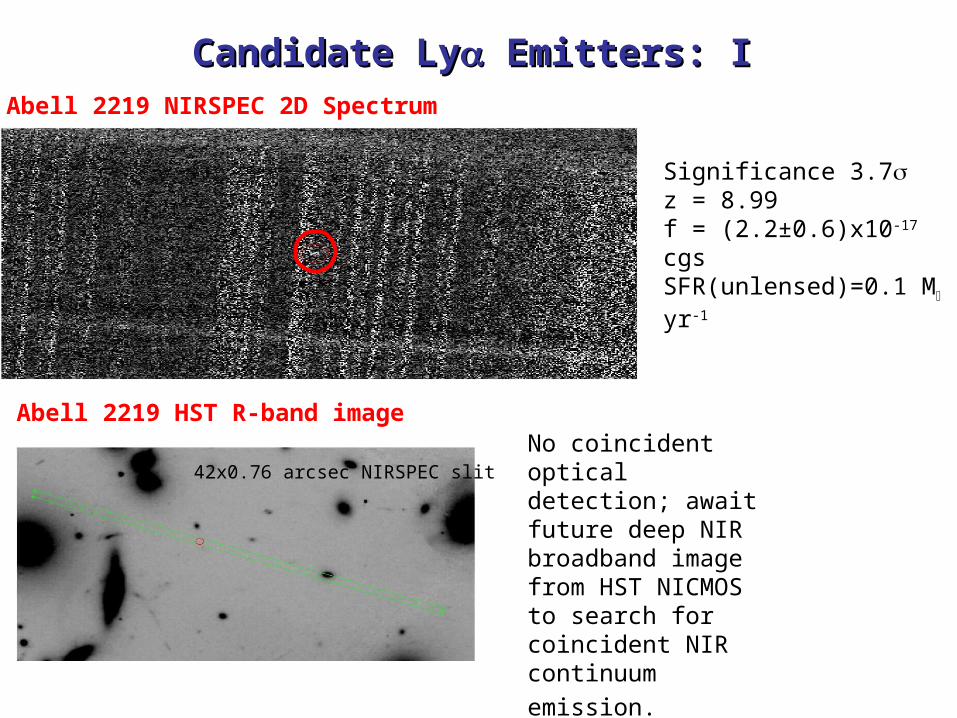
Significance 3.7z = 8.99 f = (2.2±0.6)x10-17
cgs SFR(unlensed)=0.1 M yr-1
42x0.76 arcsec NIRSPEC slit
Abell 2219 NIRSPEC 2D Spectrum
Abell 2219 HST R-band imageNo coincident optical detection; await future deep NIR broadband image from HST NICMOS to search for coincident NIR continuum emission.
Candidate LyCandidate Ly Emitters: I Emitters: I
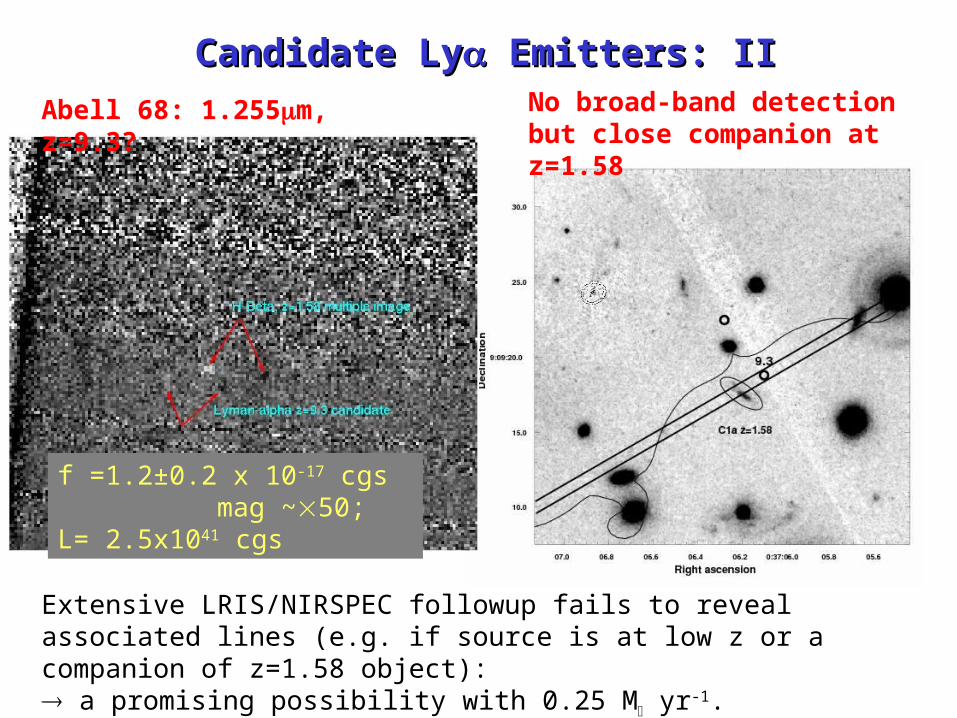
f =1.2±0.2 x 10⁻¹⁷ cgs mag ~50;
L= 2.5x1041 cgs
Candidate LyCandidate Ly Emitters: II Emitters: II
Abell 68: 1.255m, z=9.3? No broad-band detection but close companion at z=1.58
Extensive LRIS/NIRSPEC followup fails to reveal associated lines (e.g. if source is at low z or a companion of z=1.58 object):
a promising possibility with 0.25 M yr-1.

Did feeble sources with 7<z<10 cause reionization?Did feeble sources with 7<z<10 cause reionization?
Absence suggests faint sources alone may not cause reionization
NIRSPEC survey (Stark et al)
Bouwens et al 2004 z~7
Kneib et al 2004 z=6.8
Oct 05
Bouwens et al 2005 z~10
arcmin-2
Adopt worst case scenario: none of the candidate lensed Ly emitters is real: is this a surprise?
Summary of Lecture #7Summary of Lecture #7
• Although the Ly emission has become a standard redshift diagnostic for high z galaxies, the distribution of line profiles, equivalent widths and luminosity function can act as a sensitive gauge of the neutral fraction, xHI, because of scattering by H clouds
• As with early i-band dropouts, measures of the 5<z<7 Ly LF remain in dispute; early claims (Malhotra & Rhoads) for no evolution (and hence xHI<0.3) are not necessarily correct
• There is no convincing evidence that line profiles are evolving or that the equivalent width distribution requires anomalous populations
• Searches for z>8 lensed Ly emitters are underway: candidates are being found but their follow up will be tough. New instruments are coming online to make these searches more efficient (Lecture #9)
