first nine months 2016 m&a fa cover.ppt -...
TRANSCRIPT

MERGERS & ACQUISITIONS REVIEWREUTERS / Bernadett Szabo
MERGERS & ACQUISITIONS REVIEWFINANCIAL ADVISORS
First Nine Months 2016

Any New Zealand Involvement Announced (AD39)
Any New Zealand Involvement Completed (AF46)
Japan M&A
Americas Deals Intelligence
M&A Financial Advisory ReviewFirst Nine Months 2016 | Mergers & Acquisitions | Financial Advisors
1
Japan Deals Intelligence
Any European Involvement Announced (AD21) 17
17
18
18
Global M&A
Global Deals Intelligence
Scorecard: Worldwide Announced M&A
Scorecard: Worldwide Completed M&A
Top Fifteen Worldwide Announced Deals
Any German Involvement Announced (AD35)
Americas M&A Any Spanish Involvement Completed (AF41)
Any UK Involvement Announced (AD32)
Any UK Involvement Completed (AF39)
Any European Involvement Completed (AF3) 10
12
12
Any French Involvement Announced (AD33)
Worldwide Completed (AF1)
Top Ten Japanese Involvement Announced Deals
19
Any French Involvement Completed (AF40)
Any Japanese Involvement Completed (AF23)
19
Any Spanish Involvement Announced (AD34)3
3
6
6
11
12
11
Worldwide Announced (AD1)
20
10
18
Any Japanese Involvement Announced (AD19)
2
2
Table of Contents
1
20
2
11
Fairness Opinion Rankings
Worldwide Announced Fairness Opinion
11
Any Americas Involvement Announced (AD49) 7
US Target Completed (AF2)
6
US Target Announced (AD2) 7
Any Americas Involvement Completed (AF55)
13
12
Any Italian Involvement Announced (AD36)
Any Nordic Involvement Announced (AD37)
Any Italian Involvement Completed (AF43)
20
20
Top Ten US Announced Deals20
15
Mergers & Acquisitions Criteria Summary
Any EMEA Involvement Announced (AD47)
European Deals Intelligence
Any Benelux Involvement Announced (AD40)
8
8
7
Any German Involvement Completed (AF42)
16
Any Canadian Involvement Completed (AF49)
Any Australian Involvement Completed (AF31)
10
9
Any Canadian Involvement Announced (AD42)
16
Any Asia (ex-Japan) Involvement Completed (AF32)
Any EMEA Involvement Completed (AF53)
Any Benelux Involvement Completed (AF47)
10
Any US Involvement Completed (AF48)
Top Ten Any Asia (ex-Japan) Involvement Announced Deals 15
7
8
9EMEA M&A
Any US Involvement Announced (AD41)
Any Japanese Announced Fairness Opinion13
Asia Pacific (ex-Japan) M&A
Asia Pacific (ex-Japan) Deals Intelligence
20
21
21
22
21
20
13
13
Regional Contacts
Criteria Summary
Any EMEA Announced Fairness Opinion
14
Any Asia Pacific Announced Fairness Opinion
8
16
16Any Australian Involvement Announced (AD24)
9
Top Ten European Involvement Announced Deals
Thomson Reuters Soultions for the Deal the Deal Making Community
Any Asia (ex-Japan) Involvement Announced (AD25)
20
15
Worldwide Announced Fairness Opinion
Any Americas Announced Fairness Opinion
Any USAnnounced Fairness Opinion
14
Any Nordic Involvement Completed (AF44)
https://www.thomsonone.com

First Nine Months 2016 FINANCIAL ADVISORS
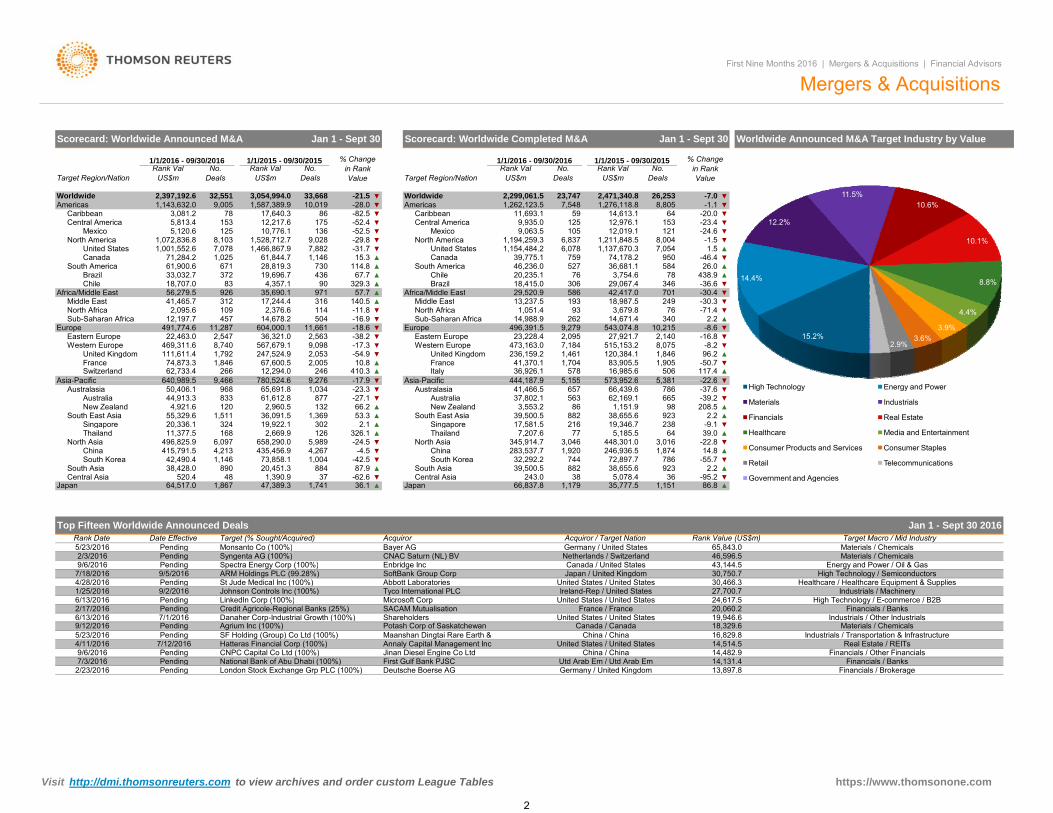
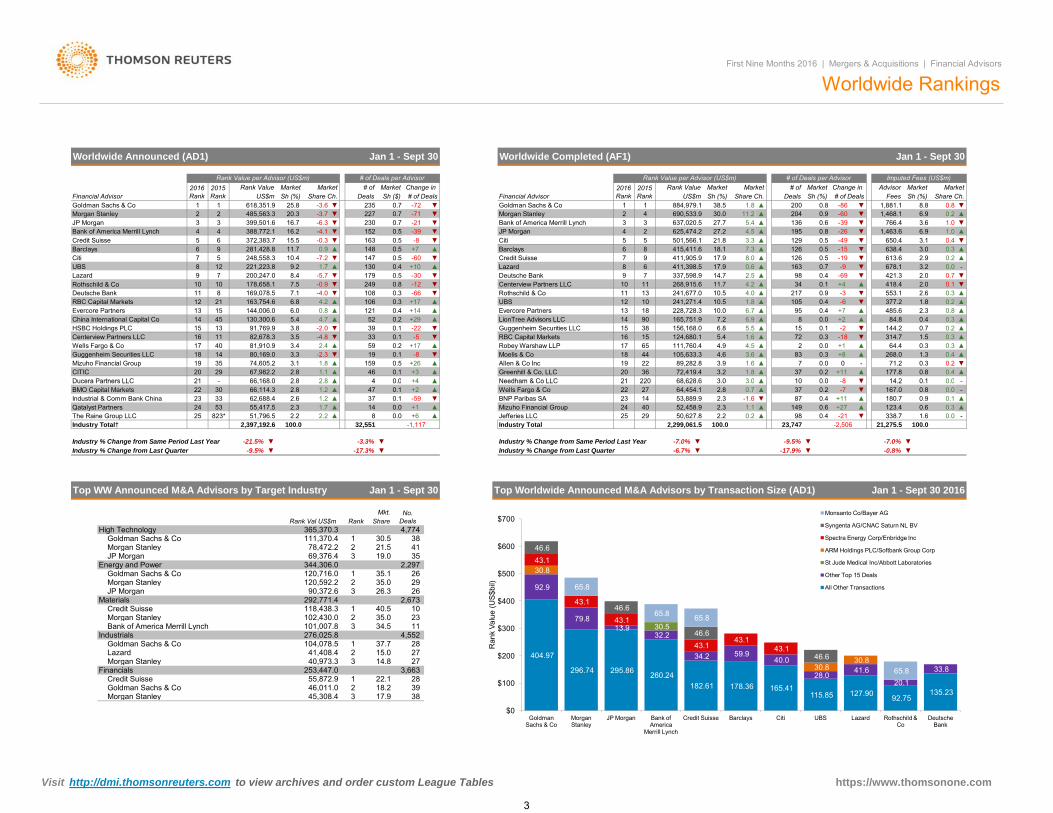
MERGERS & ACQUISITIONS REVIEWWorldwide M&A Falls to 3-Year Low l Deals Over $5 billion Down 40% l Tech, Energy & Materials Lead Balanced Sector Mix l Goldman Sachs Top Advisor
Global Deals Intelligence Worldwide Completed M&A by Region - Imputed Fees WORLDWIDE DEAL MAKING FALLS 22%, NUMBER OF DEALS DOWN 3%- Worldwide M&A activity totaledUS$2.4 trillion during the first nine months of 2016, a 22% decrease from comparable 2015 levels and the slowestperiod for worldwide deal making in three years. Sixty-five deals with a value greater than $5 billion wereannounced during the first nine months, their combined value down 40% compared to the first nine months of 2015.Overall, 32,551 worldwide deals were announced during the first nine months of 2016, a 3% decrease compared tolast year.
DEAL MAKING DOWN 10% FROM SECOND QUARTER - The value of worldwide M&A announced during thethird quarter of 2016 totaled US$796.2 billion, a decrease of 10% compared to the second quarter of this year.
UNITED STATES M&A FALLS 32%; ASIA PACIFIC DEALS DOWN 18% - M&A activity for United States targetstotaled US$1.0 trillion during the first nine months of 2016, a decrease of 32% compared to the level of activity seenduring 2015. With US$641.0 billion in announced deals during the first nine months, Asia Pacific M&A fell 18%compared to a year ago. Asia Pacific targets accounted for 27% of worldwide M&A, compared to 21% for Europe.
TECH, ENERGY & MATERIALS LEAD BALANCED SECTOR MIX - Deal making in the Technology sector totaledUS$365.4 billion during the first nine months of 2016, an increase of 4% compared to 2015 levels, while Energy &Power decreased 12% by value, but increased 3% by number of deals. Materials deal making increased 28%compared to a year ago. Six of 12 major industry sectors accounted for at least 10% of year-to-date M&A, the mostbalanced first nine month sector breakdown since records began in 1980
$2
$3
$4
$5
Impu
ted
Fees
(US
$b)
Americas EMEA Asia Pacific Japan
Worldwide Cross Border Volume Worldwide Announced Buyside Financial Sponsor Activity
balanced first nine month sector breakdown since records began in 1980.
RECORD OUTBOUND CHINA AND INBOUND US M&A POWERS CROSS-BORDER DEALS – Powered byrecord levels of outbound M&A from Chinese acquirors and inbound M&A for US assets, cross-border M&A activitytotaled US$922.4 billion during the first nine months of 2016, accounting for 39% of overall M&A volume and a 12%decrease from 2015 levels, when cross border M&A accounted for 34% of total M&A activity.
COMPLETED M&A ADVISORY FEES DOWN 7% - According to estimates from Thomson Reuters/FreemanConsulting, M&A advisory fees from completed transactions totaled US$21.3 billion during the first nine months of2016, a 7% decrease from the comparable period in 2015.
$203.1
$78.4$16.0 $32.2 $65.7 $62.9
$117.1 $147.9 $163.5$73.6
$318.2
$82.6
$24.7$60.3
$87.6 $79.9
$80.1$118.8
$136.6
$140.8
$163.2
$57.4
$35.6
$73.7
$70.5 $99.9$82.0
$136.3$169.5
$125.5
$113.8
$35.9
$52.7
$100.5
$105.8 $98.8$110.6
$113.8
$231.111.5%
6.4%8.1%
13.6%
10.4%
15.6% 15.5%
13.9%
14.4%
14.3%
0%
2%
4%
6%
8%
10%
12%
14%
16%
18%
$0
$100
$200
$300
$400
$500
$600
$700
$800
$900
2007 2008 2009 2010 2011 2012 2013 2014 2015 2016
% o
f Glo
bal M
&A
Ran
k Va
lue
(US
$b)
Q4 Volume (US$b) Q3 Volume (US$b) Q2 Volume (US$b) Q1 Volume (US$b) % of YTD Global M&A
$0
$1
3Q11 4Q11 1Q12 2Q12 3Q12 4Q12 1Q13 2Q13 3Q13 4Q13 1Q14 2Q14 3Q14 4Q14 1Q15 2Q15 3Q15 4Q15 1Q16 2Q16 3Q16
$405.6$258.1
$113.4 $175.7 $235.3 $172.5 $132.4$239.8 $287.5 $304.2
$640.7
$364.7
$111.4$204.2
$247.4$272.6
$167.8
$384.6 $340.1 $279.6
$371.3
$325.9
$147.1
$271.8$204.3 $203.2
$180.1
$313.5$423.8
$338.6
$430.9
$156.4
$166.0
$261.8 $196.7 $252.1
$221.4
$303.5
$465.5
26.3%
36.2%33.2%
50.0%
30.2%31.7%
34.1%31.9%
35.9%
38.5%
0%
10%
20%
30%
40%
50%
60%
$0
$200
$400
$600
$800
$1,000
$1,200
$1,400
$1,600
$1,800
$2,000
% o
f Glo
bal M
&A
Ran
k Va
lue
(US
$b)
Q4 Volume (US$b) Q3 Volume (US$b)
Q2 Volume (US$b) Q1 Volume (US$b)
% of YTD Global M&A
Visit http://dmi.thomsonreuters.com to view archives and order custom League Tables https://www.thomsonone.com
2007 2008 2009 2010 2011 2012 2013 2014 2015 20162007 2008 2009 2010 2011 2012 2013 2014 2015 2016
1
Western Europe
-50.796.2-8.2 ▼
▲▼
1,905▲
Worldwide Announced M&A Target Industry by ValueScorecard: Worldwide Announced M&A
950
1/1/2015 - 09/30/2015
1,211,848.5 ▼▲
▼▼
% Change in Rank Value
▼▼
▲
-24.6-1.5
-46.4
-20.0
26.0
▼
1.5
▼
▲▼
3,754.658436,681.1
438.9
-30.4-36.6
78
United States 1,137,670.3
29,067.4
▼7,054
▲
-71.4▼▼
346
74,178.2
No. Deals
9,935.011,693.1
9,063.5 12,019.1
1,154,484.2
76
759
2,299,061.5
Rank Val US$m
% Change in Rank Value
South America
6,078
527
-52.4105
Target Region/Nation
North America-52.5 Mexico
1,194,259.3121
-29.8 6,837▼
8,004
1,262,123.5▼
125Central America▼
7,548▼
Americas
12,976.114,613.117,640.3
3,054,994.0
Rank Val US$m
8610,01933,668
No. Deals
59-1.1
-23.415364
-7.08,805
114.8
26,25323,747
Caribbean-82.5
▼
-31.7
-28.0-21.5
1,276,118.8
▼
90
9,0287,882
▲67.7
329.3▲
▼
7301,146
18,415.0436
15.3 Canada 39,775.1▲46,236.0
Chile 20,235.1▲
14,988.9
13,237.5971
Brazil57.7 ▲ 29,520.9
140.5Africa/Middle East
18,987.5▼
Sub-Saharan AfricaNorth Africa
-30.3
262 14,671.4
249▲ 193586
496,391.5 -8.623,228.4
306
3,679.8
42,417.0
93
701
1,051.4 76340
120,384.1
2,140
2.2
83,905.5
▼-16.8
▼
7,184
543,074.8
117.4
9,279▼
1,846
10,215
16,985.6 506573 952 6
8,075
5 381
515,153.21,461
22 6
27,921.7
5785 155
2,095
444 187 9
Eastern Europe
236,159.21,704
Asia Pacific36,926.141,370.1France▲
473,163.0
▼Italy▲
10.8
▼
▼United Kingdom-54.9
▼-38.2Europe
▼
▼
316
-17.3
-11.8
2,563
114
2,053
246
Eastern Europe
2,005
11,661
247,524.967,600.5
62,733.4
9,0988,74036,321.0
604,000.1
North AfricaMiddle East
-18.611,287504
17,244.42,095.6
14,678.2 -16.9
17 9
35,690.1312
Europe
109
Africa/Middle East
2,376.6457
926
410.3780 524 6 9 276
12,294.0
78
1,072,836.8
61,900.6
7,078
Americas3,081.2
9 466
153
8,103
Central America
South America71,284.2
2,547
1,001,552.6
671372
74,873.3266
1,792
33,032.7
1,025
Middle East
12,197.7Sub-Saharan Africa
Canada
Western Europe22,463.0
491,774.6
56,279.5
Switzerland
North America
469,311.6
France
Chile 18,707.0
Asia Pacific
United Kingdom
Worldwide 32,5512,397,192.6
1,846
Rank Val US$m
61,844.7United States
Caribbean
5,120.6
Brazil
Target Region/Nation
Mexico
567,679.1111,611.4
83
41,465.7
4,357.1
1,466,867.9
28,819.3
1,528,712.7
1/1/2016 - 09/30/2016 1/1/2015 - 09/30/2015
1365,813.4
10,776.1125175
1,143,632.0
12,217.6
1,587,389.9Worldwide
9,005
No. Deals
No. Deals
Rank Val US$m
2,471,340.8
19,696.7
640 989 5
1/1/2016 - 09/30/2016
Mergers & Acquisitions
Jan 1 - Sept 30 Scorecard: Worldwide Completed M&A Jan 1 - Sept 30
First Nine Months 2016 | Mergers & Acquisitions | Financial Advisors
15.2%
14.4%
12.2%
11.5%10.6%
10.1%
8.8%
4.4%
3.9%3.6%
2.9%
South East Asia
Industrials / Transportation & InfrastructureReal Estate / REITs
Financials / Other Financials
Materials / ChemicalsMaterials / Chemicals
Energy and Power / Oil & Gas
14,131.413,897.8 Financials / Brokerage2/23/2016
PendingPending
National Bank of Abu Dhabi (100%) Utd Arab Em / Utd Arab EmGermany / United Kingdom
4,921.6New Zealand
London Stock Exchange Grp PLC (100%)7/3/2016
Target Macro / Mid Industry
▲▲▼
▼▲
208.5
▼▼
Financials / Banks
Materials / Chemicals
Financials / Banks
Industrials / Machinery
Industrials / Other Industrials
High Technology / Semiconductors
High Technology / E-commerce / B2B
Healthcare / Healthcare Equipment & Supplies
Jan 1 - Sept 30 2016
Abbott Laboratories
Pending
4/28/2016
9/6/2016United States / United States
Bayer AGAcquiror / Target Nation
Johnson Controls Inc (100%)United States / United States
▲
▲
-39.2665786 -37.6
1,151.9
573,952.666,439.6
5,381 -22.6
645,185.5
62,169.1
5,155
98
1,874
39.0-22.8
2.238,655.6 923
3,046
Singapore7,207.6
238
283,537.7▼
14.8246,936.5
19,346.7
786
36
448,301.0
-55.72.2
1,179
216 -9.1
744
-95.2
3,016
Australia
923
▼
36.1
▼-4.5-24.5 ▼
86.835,777.5
444,187.9657▼65,691.8
46,596.5
Central Asia66,837.8
38
Rank Value (US$m)Acquiror
41,466.5
882863,553.2
563
Asia-Pacific
37,802.1
▼Australasia
▼
South East Asia
-23.31,034-17.9
2,669.9
780,524.6 9,276
877
326.1
53.3
61,612.8
36,091.5
243.064,517.0Japan
37
▼
Top Fifteen Worldwide Announced Deals
5,078.4Japan
1686,097
48
73,858.11,146
▲
North AsiaChina 415,791.5
496,825.9
42,490.4
1,741
20,451.3
658,290.0
520.4
5,989
-27.1
3021,369
19,922.1
66.2120
38,655.6
▲
72,897.71,920
77
132
126 Thailand
▲
▲
South Asia 39,500.5
2.1
▲
North Asia
32,292.2ChinaSouth Korea
17,581.5
345,914.7
39,500.5
▼
Australasia
4,2671,004
435,456.9
890
2,960.5 New Zealand▲
St Jude Medical Inc (100%)9/2/2016
38,428.0South AsiaCentral Asia -62.6
Pending
9/6/2016
1/25/2016
▲
Credit Agricole-Regional Banks (25%)
First Gulf Bank PJSC
65,843.0CNAC Saturn (NL) BV
1,151
Japan / United Kingdom
LinkedIn Corp (100%)
Canada / United States
Ireland-Rep / United States
▼882
Agrium Inc (100%)
47,389.3
6/13/2016
Syngenta AG (100%)43,144.530,750.7
Germany / United States
SoftBank Group CorpARM Holdings PLC (99.28%)
18,329.6
Microsoft Corp
30,466.3
SACAM Mutualisation
Netherlands / SwitzerlandMonsanto Co (100%)
France / FranceDanaher Corp-Industrial Growth (100%)
SF Holding (Group) Co Ltd (100%)
24,617.5United States / United States
Spectra Energy Corp (100%)
20,060.2
27,700.7Tyco International PLC
Shareholders
Annaly Capital Management IncChina / China
14,514.5
Deutsche Boerse AG
Jinan Diesel Engine Co LtdPending
Maanshan Dingtai Rare Earth &
CNPC Capital Co Ltd (100%)7/12/20164/11/2016
19,946.6
Hatteras Financial Corp (100%)16,829.85/23/2016
Canada / CanadaPotash Corp of Saskatchewan9/12/20167/1/2016 United States / United States
6/13/2016Pending
Pending
2/17/2016
9/5/2016
2/3/2016
7/18/2016Pending
87.9884-42.5
Thailand
4,213
9,46650,406.1
20,336.11,511
324
833
5/23/2016
Asia-Pacific
11,377.5
Pending
Australia
South Korea
1,867
44,913.3
55,329.6
Rank Date Date Effective
Singapore
968
Enbridge Inc
Target (% Sought/Acquired)
640,989.5
Pending
1,390.9
China / China 14,482.9
Pending
2.3%High Technology Energy and Power
Materials Industrials
Financials Real Estate
Healthcare Media and Entertainment
Consumer Products and Services Consumer Staples
Retail Telecommunications
Government and Agencies
https://www.thomsonone.com Visit http://dmi.thomsonreuters.com to view archives and order custom League Tables
2
Rothschild & Co
Market
1,881.1
Change in
0.8Share Ch.Sh (%)
8.8
130147
7.1
3.0
6.9
0.23.6 1.0
2.0
# of
Worldwide Completed (AF1)
Market
▼ 6.9 ▲
# of DealsMarket Advisor
▼ ▼0.8
0.40.30.30.8
-22+29
8
11-66
+7
▼
+10▼▲
7Barclays
411,398.569-30 Deutsche Bank
▲12
241,677.010
▲
▼
52
10
Centerview Partners LLC
+17 UBS
▼Rothschild & Co
-12
121
7
39 0.1▲0.2
+14
110.5
108106
33 0.1+17
-5 1.6
-4.0
22
JP Morgan
3.6
Jan 1 - Sept 30
Worldwide Rankings
2015 RankFinancial Advisor Deals
Imputed Fees (US$m)
1 ▼Sh ($)
485,563.3 -3.7 0.7
2016 Rank
Rank Value per Advisor (US$m)
Goldman Sachs & Co# of Deals-72
Jan 1 - Sept 30
0.7Financial Advisor
1365.4
1
Change in
9.2
16.7
7 5
6
-7.2
4 388,772.1
Rank Value # of
27.2
227▼
▲
▼230 0.7
1
-8
268,915.6
Market
UBS 8
3
Credit Suisse45
Bank of America Merrill Lynch
Centerview Partners LLC
Deutsche Bank
Evercore Partners
200,247.07178,658.1169,078.5
RBC Capital Markets
11
7.5
10.4
18
5.4
221,223.8
163,754.6
9
82,678.31613
Guggenheim Securities LLC
21
▼
40Wells Fargo & Co
▼
0 0
-5.7
-39
249
-0.3 0.5
0.4
0.1
-3.6
163
235
-4.1
148
-0.9
▼
179
▼152
345
▼▼
0.5 JP MorganBank of America Merrill Lynch
52
US$m DealsShare Ch.25.8
Sh (%)
# of Deals per Advisor
▼
MarketMarket Rank Value Market2016 Rank
Rank Value per Advisor (US$m)
Share Ch.
2 438.5
690,533.9▼ ▼
1.830.0
Fees200
US$m
-390.911.2
▲884,979.1Sh (%)Sh (%)
# of Deals per Advisor
First Nine Months 2016 | Mergers & Acquisitions | Financial Advisors
-86
Market2015 Rank
1,463.6766.4
195 -26
▲
▼0.6
-60204 1,468.1
0.57.3
17.9
3 637,020.5 ▲
3.3▲
27.7
21.8625,474.2
▼0.50.8 ▲4.5
650.41.0
18.1869 411,905.9Credit Suisse
638.40.50.2
▲126126
2.90.7 -9
▼▲
3.2
-15 0.3415,411.63.1▲ -49501,566.1 129
▼0.4▼
14.7 98▲ Lazard ▼▲ 163
337,598.9▼ 0.4
▲8.017.9
▲
▲0.6
-19
▼▼ 0.7-
613.6678.1 0.0421.3
0.12.5
▲-69 2.0
418.434 +4
▲377.2-6-3 553.1
11.74.04.2
▲0.1
217▲ ▼
241,271.413 10.5
2.3▼
2.61.81.810.5
▲
0.9105
▲▲
950.4
0.1 ▼
0.30.2
-20.0
▼
144.20.4
+7+2 ▲
0.8 ▲
0.7 ▲8▲
6.7
38▲
0.20.3
15
10.0228,728.384.8
485.60.4 ▲7.2
156,168.0 6.890
15RBC Capital Markets
18165,751.9 6.914
13
▼ 15
Evercore Partners
Guggenheim Securities LLCLionTree Advisors LLC
▲4.517
124,680.15.5
Robey Warshaw LLP
▲16 5.4
65▲ 4.9 28318▼ Moelis & Co 4.6105,633.3 ▲
-18▲
▲▲
▼ 1.5
268.0
72▲ 0.0
314.7+1 0.3
▲0.30.3
0.3
▼0.3
64.4 ▲1.3 0.4
71.200.3
-0.07
111,760.4
3.944
Allen & Co Inc
21
19 89,282.8Greenhill & Co, LLC
▲▲
220▲20
+8▲1.6
3 036 ▲0.8177.872,419.4 1.83.2 ▲
▲ Needham & Co LLC ▲3 0+4+3
68 628 6 14 2 0 1 0 010 ▼80 0
0.2+110.237 0.4
▲-2.3
0.2
▲
2 8▲▲
159-8
0.5 +260.1
4
▼59
-4.8
3.3
1.1
▲
1.846
2.419
▼
618,351.9
45 130,300.613
399,501.6
281,428.8 11.79
3
Citi372,383.70.5
15.516.2
Morgan StanleyGoldman Sachs & Co
▼
4.2
▼▲
▼20.3
-6.3
6.8 ▲
Worldwide Announced (AD1)
▲0.8
▼
1.78.4
2Morgan Stanley1
-71
0.9
2
248,558.3CitiBarclays 6
-600.5
-21
12
15
108
10
14
29Ducera Partners LLC
35
Lazard12
2111
19
17
HSBC Holdings PLCChina International Capital Co
6.04.7
1514
144,006.0
-2.0 ▼91,769.9 3.8
2 866 168 0
3.43.5
3.174,605.267,982.2
80,169.081,910.9
2.8Mizuho Financial GroupCITIC 20
* tie
▼
2.3149
23,747
0.0
38 30.5
▼
21
19.0
-17.3%-3.3%
26 26.32
21.5
1
Credit SuisseGoldman Sachs & Co
35
2,673
3
28
29 26
23
17.9
4,552
27 15.014.8
3,663 22.118.2
38
Industry % Change from Last Quarter -0.8%
41,408.4
2,297
21
Materials
Morgan Stanley
Industry % Change from Last Quarter
823*100.0
23 3353
Bank of America Merrill Lynch
111,370.4
118,438.3
90,372.6
24
69,376.4
Rank Val US$mHigh Technology
78,472.2Goldman Sachs & Co
Morgan Stanley
35.1
1
101,007.8
240,973.3
Financials
104,078.5
Industry % Change from Same Period Last Year
344,306.0Energy and Power
Industrials
▼
39 45,308.4 3
28 55,872.946,011.0
Morgan Stanley2
27
37.7
253,447.0
1
0.0
Jan 1 - Sept 30
Goldman Sachs & CoLazard
3
21 220 3.0▲ Needham & Co LLC ▲3.0+464,454.168,628.6 -14.2 0.1
167.00.0
▲0.72.8 0.8+11 ▲
10
0.4-7
▼-8▼
0.0
180.7870.237 0.0
100.0
0.90.6
0.1▲-
0.30.0
▲-
21,275.5▼
-2,5060.4
▼
-21 1.6+27
338.7
▼
▲ 123.4
-7.0%▼
2.2 0.2 ▲1.1
-1.6 ▼2.3 ▲ 0.6
-17.9%▼
0.0 +6 Jefferies LLC 50,627.829
▼
98
-9.5%-6.7%
Wells Fargo & Co
▲▲
Industry % Change from Same Period Last Year
BNP Paribas SA
Industry Total
Mizuho Financial Group14
22232425
365,370.3
▼
▲32,551
Share
Top Worldwide Announced M&A Advisors by Transaction Size (AD1)
No. Deals
-1,1172,397,192.6
-9.5% ▼
Rank
▲
▲
100.02,299,061.5
+1▼0.1
-7.0%
52,458.953,889.9
40
27
1.7
2.8
1.2▲▲
41
4,774
14
Top WW Announced M&A Advisors by Target Industry
-21.5%
8
Mkt.
2.2
▲0.1
447
-591.2
2.6+2
37
-3022
Ducera Partners LLC 2.866,168.0
2.2
62,688.466,114.3BMO Capital Markets 2.8
55,417.5The Raine Group LLC 51,796.5
2.3Industrial & Comm Bank ChinaQatalyst Partners
120,716.0
102,430.0
Morgan Stanley
Industry Total†25
Credit Suisse
276,025.8
JP Morgan
35.0Morgan Stanley40.5
JP Morgan
3292,771.4
1
11 34.532
Goldman Sachs & Co
Jan 1 - Sept 30 2016
120,592.2 35.0
10
404.97
296.74 295.86 260.24 182.61 178.36 165.41
115.85 127.90 92.75 135.23
92.9
79.8 13.9
32.2
34.2 59.9 40.0
28.0 41.6
20.1
33.8
- 30.5
30.8
30.8 30.8
43.1
43.1
43.1
43.1 43.1
43.1
46.6
46.6
46.6
46.6
65.8
65.8 65.8
65.8
$0
$100
$200
$300
$400
$500
$600
$700
Goldman Sachs & Co
Morgan Stanley
JP Morgan Bank of America
Merrill Lynch
Credit Suisse Barclays Citi UBS Lazard Rothschild & Co
Deutsche Bank
Ran
k Va
lue
(US
$bil)
Monsanto Co/Bayer AG
Syngenta AG/CNAC Saturn NL BV
Spectra Energy Corp/Enbridge Inc
ARM Holdings PLC/Softbank Group Corp
St Jude Medical Inc/Abbott Laboratories
Other Top 15 Deals
All Other Transactions
https://www.thomsonone.com Visit http://dmi.thomsonreuters.com to view archives and order custom League Tables
3
10.9x
Consumer Staples
Consumer Products and Services
16.2x
Healthcare
12.8x
High Technology
13.3x
16.6x
12.4x
11.0x
13.2x
10.8x
Energy and Power
15.7x
Materials
13.0x
14.8x
5.5x
13.8x 14.5x
9.0x7.1x
23.0x19.8x
12.9x
26.1x
11.9x
-
11.6x
21.0x10.7x10.5x 11.2x 12.0x
16.1x
16.8x
11.9x
17.4x
12.2x
9.7x 13.5x
13.6x
14.6x 18.5x
-14.3x
11.2x
16.9x
16.2x
16.9x 24.5x
11.5x6.5x
5.9x
6.4x
9.3x
16.4x 10.8x
-15.1x8.3x
16.1x 11.9x17.2x
20.6x 6.8x
16.1x
13.2x
13.1x
23.8x19.8x
8.9x12.2x
9.0x
19.6x
15.8x
12.0x13.2x
12.6x 15.9x
13.6x 13.1x
14.9x
11.6x
18.9x13.7x
9.5x26.7x
21.7x11.3x
11.1x
14.0x 17.1x18.4x
13.4x 12.5x
12.2x
12.0x
18.4x13.0x
16.7x14.6x 18.4x
13.9x
14.0x
17.2x10.5x
14.9x
11.3x11.3x
11.6x 11.6x
11.2x
12.4x
13.2x
21.3x 17.2x
15.4x15.4x16.6x
5.4x
19.2x19.2x 11.9x
12.3x
23.9x14.7x 18.8x
17.1x17.1x
18.8x20.0x 9.5x
4.7x9.3x
-
9.3x
27.1x 20.3x7.2x
8.9x
4.7x
16.1x
20.0x
-
9.3x
16.1x10.0x
10.4x20.2x
11.1x 13.2x
UK
15.8x
14.4x
-
9.7x 16.0x
12.4x 15.8x
15.1x
11.0x
24.2x
8.9x
13.5x
18.1x
World
Industrials 13.2x14.5x
17.0x
19.5x 13.7x
12.9x
3.5x
14.2x
31.4x
8.8x
8.0x
12.9x
10.9x
19.4x 21.0x
8.8x 9.0x
11.4x
13.7x
Telecommunications
Real Estate
Media and Entertainment
Retail
13.5x
11.9x
15.4x
14.3x
Exit Multiple Matrix - Average Rank Value / EBITDA
Canada
First Nine Months 2016 | Mergers & Acquisitions | Financial Advisors
13.1x
7.9x
USA
12.6x
15.1x 26.9x
19.4x
19.7x
13.8x
16.9x 23.8x
Japan
9.6x
Asia ex. JapanEurope
14.2x
9.3x
12.4x
20.0x
EMEAAmericas
Worldwide M&A Matrix
2016 UP 2016 DOWN 2015
Jan 1 - Sept 30
13.2x15.2x
8.0
36.6
14.0x
52.1
UK
25.3
Real Estate 19.7
33.6 33.1
23.0 23.0
15.4x
36.330.0
13.4x
EMEA2015
45.7
18.6x17.9x 18.6x14.2x12.1x
23.6
32.1
27.7
19.1
19.7
5.1 24.5
23.9
42.3
41.6
40.0
28.5
43.4
16.6
30.8
24.6
49.9
22.8
23.555.1
-
-
38.2
25.3
25.8
35.3
52.5
41.1
41.0
19.745.0
25.0
26.439.1
26.5
34.1
36.4
36.3
-
21.7
10.6
27.1
25.4
26.5-
52.5
Europe
13.1x
39.8
35.9
16.7
22.8
29.5
-23.1
100.0
39.3
-
23.122.3
22.0
27.9
42.1 31.7
6.719.111.828.7
26.6
22.722.2
40.3 22.332.3
45.1
15.7
20.6
27.2
17.3
22.0
19.7
Japan
26.7
Asia ex. Japan
13.6x12.9x
28.8
24.6
28.8
42.7
20.8
27.7
30.624.0
20.8
11.8x
54.6
47.923.2
60.07.4
55.7
7.4
43.9
20.8
31.0
36.0
USA
8.7x16.7x 12.1x
25.337.7
22.2
45.2
35.9
37.3
42.2
28.529.0
Americas Canada
29.4
Healthcare
Consumer Products and Services
39.4
29.7
45.729.0
22.1Energy and Power
25.4
Average Industry Total
29.1
23.6
High Technology
Industrials
28.1
25.6
26.9 37.1
Media and Entertainment
27.5
Telecommunications 25.0
Materials
26.4
16.4
28.2
Retail
26.6
14.1
23.8
26.4
30.7
30.9
31.2
42.2
28.028.4
36.1 16.238.4
33.0
32.7
39.7
30.933.5
28.7
14.9x
29.6
35.7
2016 UP 2016 DOWN
33.328.1
31.0
Financials
40.3
-20.329.0
-
28.1
Average Industry Total
15.6
26.518.6
32.6
26.912.7
27.5
38.524.3 23.5
29.6
19.5 23.4
26.610.0
42.0
14.0
33.1 31.6
18.4
24.4
19.617.6
15.7
18.131.7
18.526.9
65.6 23.4
29.4
32.3
32.7
42.3
24.9
26.537.2
35.4
47.4
26.6
10.0
36.0
25.2
12.328.2
29.9
40.2
17.730.2
20.0
24.5
46.6
23.533.1 29.1
-23.4
28.3
- -
22.727.2
31.0
World
20.047.3Consumer Staples
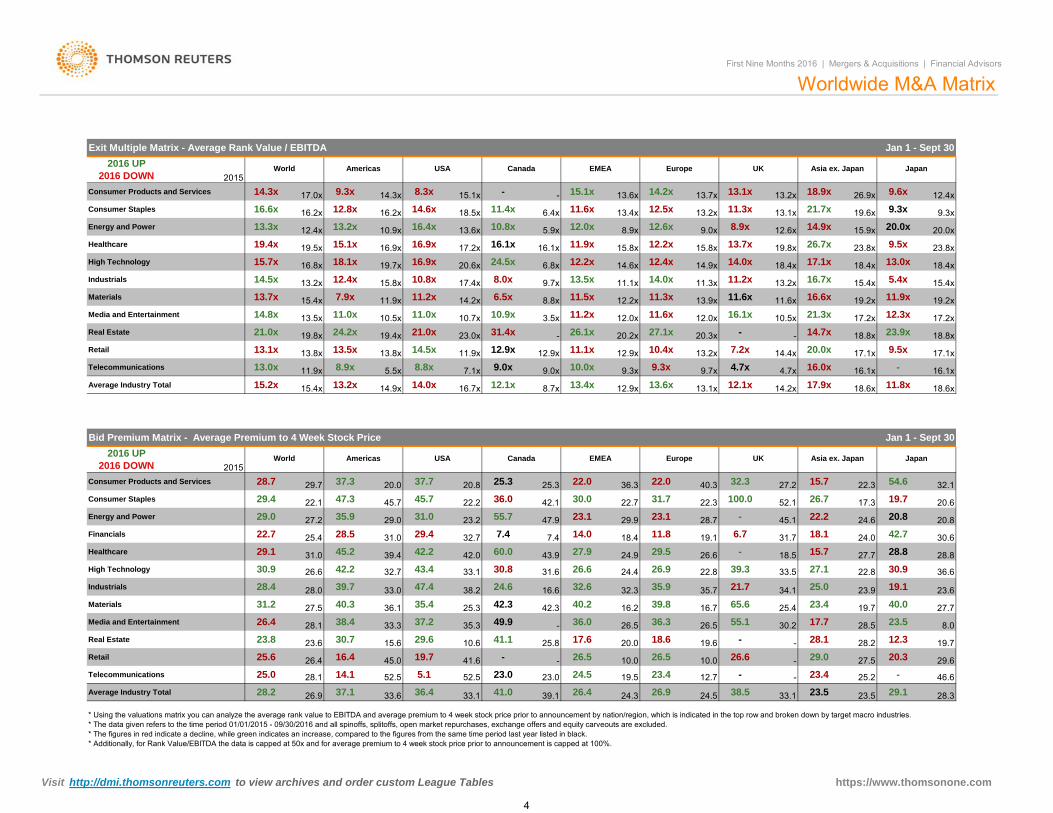
* Using the valuations matrix you can analyze the average rank value to EBITDA and average premium to 4 week stock price prior to announcement by nation/region, which is indicated in the top row and broken down by target macro industries. * The data given refers to the time period 01/01/2015 - 09/30/2016 and all spinoffs, splitoffs, open market repurchases, exchange offers and equity carveouts are excluded. * The figures in red indicate a decline, while green indicates an increase, compared to the figures from the same time period last year listed in black. * Additionally, for Rank Value/EBITDA the data is capped at 50x and for average premium to 4 week stock price prior to announcement is capped at 100%.
Bid Premium Matrix - Average Premium to 4 Week Stock Price Jan 1 - Sept 30
https://www.thomsonone.com Visit http://dmi.thomsonreuters.com to view archives and order custom League Tables
4
First Nine Months 2016 | Mergers & Acquisitions | Financial Advisors
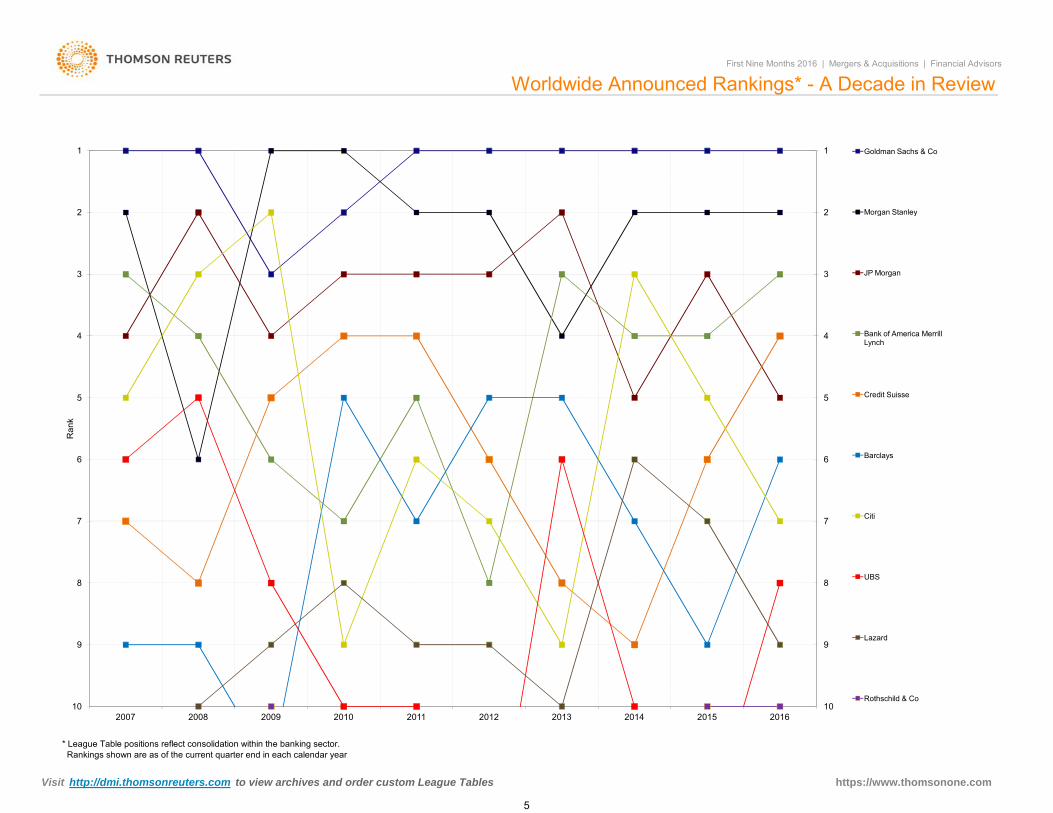
Worldwide Announced Rankings* - A Decade in Review
1
2
3
4
1
2
3
4
Goldman Sachs & Co
Morgan Stanley
JP Morgan
Bank of America Merrill Lynch
* League Table positions reflect consolidation within the banking sector. Rankings shown are as of the current quarter end in each calendar year
5
6
7
8
9
102007 2008 2009 2010 2011 2012 2013 2014 2015 2016
5
6
7
8
9
10
Ran
k
Credit Suisse
Barclays
Citi
UBS
Lazard
Rothschild & Co
https://www.thomsonone.com Visit http://dmi.thomsonreuters.com to view archives and order custom League Tables
5
63.3 8 Lazard
1
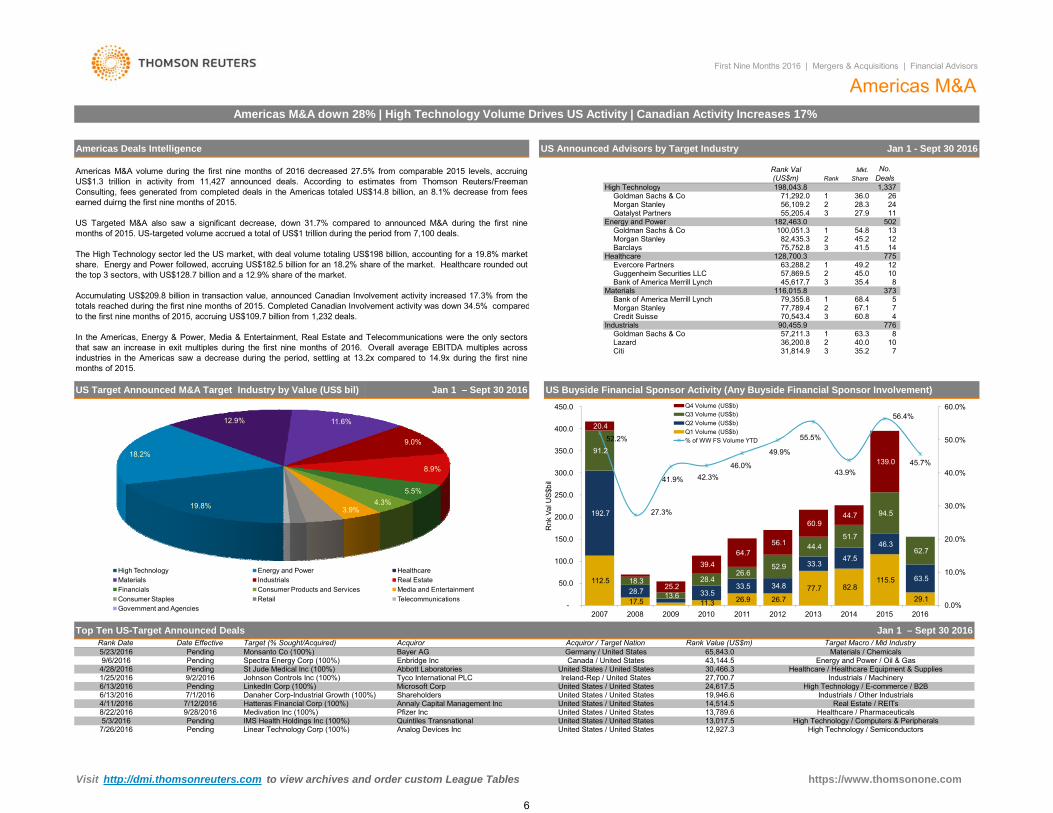
Americas M&A volume during the first nine months of 2016 decreased 27.5% from comparable 2015 levels, accruingUS$1.3 trillion in activity from 11,427 announced deals. According to estimates from Thomson Reuters/FreemanConsulting, fees generated from completed deals in the Americas totaled US$14.8 billion, an 8.1% decrease from feesearned duirng the first nine months of 2015.
US Targeted M&A also saw a significant decrease, down 31.7% compared to announced M&A during the first ninemonths of 2015. US-targeted volume accrued a total of US$1 trillion during the period from 7,100 deals.
The High Technology sector led the US market, with deal volume totaling US$198 billion, accounting for a 19.8% marketshare. Energy and Power followed, accruing US$182.5 billion for an 18.2% share of the market. Healthcare rounded outthe top 3 sectors, with US$128.7 billion and a 12.9% share of the market.
Accumulating US$209.8 billion in transaction value, announced Canadian Involvement activity increased 17.3% from thetotals reached during the first nine months of 2015. Completed Canadian Involvement activity was down 34.5% comparedto the first nine months of 2015, accruing US$109.7 billion from 1,232 deals.
In the Americas, Energy & Power, Media & Entertainment, Real Estate and Telecommunications were the only sectorsthat saw an increase in exit multiples during the first nine months of 2016. Overall average EBITDA multiples acrossindustries in the Americas saw a decrease during the period, settling at 13.2x compared to 14.9x during the first ninemonths of 2015.
49.2
36,200.8 2 40.0 10 7 Citi 31,814.9
4 60.8
35.2
First Nine Months 2016 | Mergers & Acquisitions | Financial Advisors
Americas M&A down 28% | High Technology Volume Drives US Activity | Canadian Activity Increases 17%
13
Americas M&A
26
502 54.8
77,789.470,543.4
1Bank of America Merrill Lynch116,015.8
79,355.8
Goldman Sachs & Co 57,211.3
Share
36.0
35.4345.0
27.9
3
68.47 2
3776
8
67.1
373 5
10 12
28.311 24
12
775 41.545.2
Rank
1
Mkt.
1,337
No. Deals
2
63,288.257,869.545,617.7
12
2
3
1
55,205.4182,463.0 100,051.382,435.375,752.8
128,700.3 14
Morgan StanleyQatalyst Partners
Guggenheim Securities LLCBank of America Merrill Lynch
Goldman Sachs & CoMorgan StanleyBarclays
Evercore Partners
Americas Deals Intelligence
High Technology
Energy and Power
Healthcare
Materials
Industrials
Goldman Sachs & Co
Morgan Stanley
3
90,455.9
US Announced Advisors by Target Industry Jan 1 - Sept 30 2016
Credit Suisse
Rank Val (US$m)198,043.8
71,292.056,109.2
High Technology / Semiconductors
Real Estate / REITsHealthcare / Pharmaceuticals
High Technology / Computers & Peripherals
Healthcare / Healthcare Equipment & SuppliesIndustrials / Machinery
US Buyside Financial Sponsor Activity (Any Buyside Financial Sponsor Involvement)
1/25/2016Pending
43,144.530,466.327,700.7
United States / United States7/26/2016
8/22/2016 Medivation Inc (100%)
7/1/20166/13/2016
Bayer AG
ShareholdersDanaher Corp-Industrial Growth (100%)
Materials / ChemicalsEnergy and Power / Oil & Gas
Rank Value (US$m)Germany / United States
Pending Linear Technology Corp (100%) 12,927.3
9/28/2016
24,617.5
14,514.5
13,017.5
United States / United StatesPfizer IncAnnaly Capital Management Inc
Ireland-Rep / United StatesTyco International PLCUnited States / United States
United States / United States
Microsoft Corp
United States / United States13,789.6
Industrials / Other IndustrialsUnited States / United States6/13/2016
Hatteras Financial Corp (100%)19,946.6
4/11/2016
LinkedIn Corp (100%)
Analog Devices Inc
High Technology / E-commerce / B2B
7/12/2016
Pending IMS Health Holdings Inc (100%) Quintiles Transnational
9/6/20164/28/2016
Date Effective
St Jude Medical Inc (100%)
Pending Monsanto Co (100%)5/23/2016Rank Date
Johnson Controls Inc (100%)9/2/2016
5/3/2016
Pending65,843.0
Abbott LaboratoriesCanada / United States
United States / United StatesSpectra Energy Corp (100%) Enbridge Inc
Pending
Target (% Sought/Acquired) Acquiror Target Macro / Mid IndustryAcquiror / Target NationTop Ten US-Target Announced Deals Jan 1 – Sept 30 2016
Jan 1 – Sept 30 2016US Target Announced M&A Target Industry by Value (US$ bil)
19.8%
18.2%
12.9% 11.6%
9.0%
8.9%
5.5%4.3%
3.9%
High Technology Energy and Power HealthcareMaterials Industrials Real EstateFinancials Consumer Products and Services Media and EntertainmentConsumer Staples Retail TelecommunicationsGovernment and Agencies
112.5
17.5 11.3 26.9 26.7 77.7 82.8
115.5
29.1
192.7
28.7 33.5 33.5 34.8
33.3 47.5
46.3
63.5
91.2
18.3
13.6
28.4 26.6
52.9
44.4 51.7
94.5
62.7
20.4
25.2
39.4 64.7
56.1
60.9 44.7
139.0
52.2%
27.3%
41.9% 42.3%46.0%
49.9%
55.5%
43.9%
56.4%
45.7%
0.0%
10.0%
20.0%
30.0%
40.0%
50.0%
60.0%
-
50.0
100.0
150.0
200.0
250.0
300.0
350.0
400.0
450.0
2007 2008 2009 2010 2011 2012 2013 2014 2015 2016
Rnk
Val
US$
bil
Q4 Volume (US$b)Q3 Volume (US$b)Q2 Volume (US$b)Q1 Volume (US$b)% of WW FS Volume YTD
Visit http://dmi.thomsonreuters.com to view archives and order custom League Tables https://www.thomsonone.com
6

Deutsche Bank Lazard
▲1.9 1.6 0.8 0.40.5 -11 ▼ 118.0 ▲1.5 ▲ 20 0.2 60 26,469.7Sandler O'Neill Partners 25 47-
Santander 25 53 24,435.2 1.82.4 0.7
+7 ▲27 33,724.0 0.5 0.0▼ 72.4▲ 25 0.3 -41.5 ▲ 36 0.3 BNP Paribas SA 24-20 ▼
▲Sandler O'Neill Partners 24 38 28,065.5 2.1
84 0.7 +16 ▲ 0.8 0.221 33,781.8 2.4 0.3 0.3 +9 ▲ 119.1PJT Partners LP 232.1 0.10.9 -12 ▼ 312.4
▲ 28▲
Moelis & Co 23 22 32,723.7 2.5 0.1 ▲▼ 84-3 ▼ Jefferies LLC 22
1.1 0.020 34,999.817 64,454.1 0.4 -8
2.4 -0.52.7▼
-5.1 ▼-10 ▼
7 0.124 0.2
Allen & Co Inc 22 13 35,865.6
-CIBC World Markets Inc 21 29 37,703.4 2.8 1.9 ▲ -165.0
93 0.8 -7 ▼ ▲ 104.8 4.7Wells Fargo & Co 21Needham & Co LLC 20
▲ 364.5 1.2125 68,628.6 0.1 -7 0.1 0.0▼ 14.2
5.0 2.9 1.1 0.60.3 +13 ▲ 163.9▲ 31 ▲Jefferies LLC 20 19 38,716.5 2.9 -0.6 ▼
3.3 ▲ 12 0.1 23 71,522.2Greenhill & Co, LLC 19▲
Qatalyst Partners 19 30 55,205.4 4.25.8 2.4
0 -16 82,338.4 1.5 0.3▼ 216.2▲ 75 0.8 -1-2.5 ▼ 59 0.5 Rothschild & Co 18+4 ▲
▼UBS 18 14 65,002.2 4.9
46 0.4 +1 ▲ 0.5 0.215 89,282.8 6.2 2.5 0.1 +1 ▲ 71.2Allen & Co Inc 171.7 0.60.8 +17 ▲ 256.2
▲ 7▲
BMO Capital Markets 17 21 66,031.3 5.0 2.4 ▲▲ 77+4 ▲ Moelis & Co 16
2.1 0.633 104,517.311 124,177.1 0.7 -15
7.3 6.25.0▼
5.0 ▲-6 ▼
4 0.019 0.2
Ducera Partners LLC 16 - 66,168.0
▲Guggenheim Securities LLC 15 11 80,169.0 6.0 -3.4 ▼ ▲311.1
56 0.5 +15 ▲ ▲ 4710.5 5.5RBC Capital Markets 15UBS 14
▲ 688.7 3.312 150,944.4 0.5 -2 1.4 0.4▼ 211.4
10.9 8.8 1.0 0.30.2 -1 ▼ 144.2▲ 15 ▲Wells Fargo & Co 14 26 80,622.3 6.1 4.5 ▲
-7.5 ▼ 33 0.3 24 156,168.0Guggenheim Securities LLC 13▲
Centerview Partners LLC 13 9 82,678.3 6.211.0 10.6
-3 ▼0.5 0.3▲ 72.9▲ 7 0.1 +1LionTree Advisors LLC 12-12 ▼ 51 157,482.53.2 ▲ 85 0.7
-5.4 ▼ ▲Rothschild & Co 12 16 108,189.7 8.1
105 0.9 -5 ▼ 2.7 0.914 207,765.9 14.5 10.0 0.9 +10 ▲ 406.1Evercore Partners 112.9 0.30.9 -18 ▼ 429.4
▲ 80
2.8 0.1▼ 82 ▼
Lazard 11 8 115,721.0 8.7
0.4 +616.6 -3.3
▲ 3418.8 6.990.6
+22 ▲ ▲ 418.45 238,096.18 268,915.6
-1.7 ▼ 63109
10-40 ▼Centerview Partners LLC2.6 ▲
10 10 134,525.3 10.1
▼Evercore Partners 9 12 138,958.9 10.5 ▼1.0
▲ 5999 0.9 +17 ▲ Deutsche Bank 8 9 276,335.8 19.3 7.4 0.6 -45 283.625.2 16.0 3.4 0.60.9 -1780 ▲
RBC Capital Markets 8 18 148,480.6 11.2 1.9 0.8▼7.1 ▲-9.3 ▼14.8
26.9-41 ▼90 0.8 Credit Suisse 7Citi 7 4 196,307.0
▲97 1.0 -6 3.810 360,177.4 ▼ 495.5▲
385,510.6Barclays 6 7 0.6▼ 557.40.91,215.7 ▲1.1 +21 8.2
-9 ▼ ▲12.5Credit Suisse 6 6 240,851.7 18.1125
-3.3 ▼ 108Barclays 1.02 423,031.5 29.5 -0.5 1.5 -21 ▼139▼
3.40.8 -41 ▼ 498.7423,893.7 77▲▼ 170 ▲ 4-6.4
▲ JP Morgan 54
▲▼ 7.8▲
5 7 262,603.4
0.3
19.8 3.9JP Morgan 4 2 281,226.3Bank of America Merrill Lynch
▼0.5-51
29.6 9.1-27 ▼
3111 1.0 3
1.2 ▼Morgan Stanley
+321.2
1.12.2
1.5▲
Citi31.923.7 120457,395.3
Bank of America Merrill Lynch6
213.6
459,403.7 ▼615.7 1.0▲ 991 -64
▼ 32.1 7.0Morgan Stanley3 5 314,668.8
Goldman Sachs & Co 1351,744.42 3421,000.0
Change in
26.5 -0.4Goldman Sachs & Co▼161 1.4
-53134-51
4.2▼1.3
Sh (%) Sh (%)Sh (%) # of Deals Fees
▲-24
141
# of
1,147.9
▼1 ▲43.2 1,486.0
2016 Rank
2015 Rank
Rank Value Market MarketShare Ch.
10.0
Rank Value per Advisor (US$m)
3.41 618,610.3 1.5
Jan 1 – Sept 30
Rank ValueShare Ch. Financial Advisor
Market
▲
MarketShare Ch.
# of
Jan 1 – Sept 30Any Americas Involvement Announced (AD49)
DealsUS$m
Americas Rankings
Rank Value per Advisor (US$m)2015 Rank
31.7 0.7Sh (%) Sh (%)
Advisor
▼1.2# of Deals
Market Change in 2016 RankFinancial Advisor
MarketImputed Fees (US$m)
US$m
Any Americas Involvement Completed (AF55)
First Nine Months 2016 | Mergers & Acquisitions | Financial Advisors
DealsMarketMarket
# of Deals per Advisor # of Deals per Advisor
†Note: Industry Totals include multiple competing bids for the same Target.
Lazard Lazard
†Note: Industry Totals include multiple competing bids for the same Target.
Industry TotalMizuho Financial Group 25
▲
▼
16,849.6
Sandler O'Neill Partners 23
1,001,552.6
▼-31.7%
-1146
-27.9%
24 172.8
▼
Industry Total
Industry % Change from Last Quarter ▲-24.3%
6,078
-4.3%▼-3.3%▲
4.0%▼▼
26,469.7 47
-13.8%
100.0▲2.3
-976
1.5% ▼
0.8
Industry % Change from Same Period Last Year
▲▼ 1.0 0.4118.011,311.1 100.0
0.2 ▼-1.0 ▼ 263.264 1.1 -1617Sandler O'Neill Partners
24Jefferies LLC▲4325▲
▲4 0.1 -3 ▼ 0.0 -0.2
0.427.5
0.1
2.3▼1.831,988.90.530,357.9 2.6
36-2.1
33 28,065.5+10Moelis & Co 22 PJT Partners LP0.9 +7
1.9 ▲0.9
2.8 2.00.0 ▲
3122
BNP Paribas SA 23▲
203.322 30,114.6
+7▲ 2432,616.6 2.819
0.43.7▼ -1169 1.0 21▼ 40Rothschild & Co
+4 ▲▲ 0.4 ▲75.1
114.9▲0.71.05.0 2.3 0.33.6 -5.9 -36 20 57,188.020
Qatalyst Partners ▲ 34 0.64.4 0.0▲ 0.2 -1 1.4 -1.7▼19 26 163.0▼55,205.4 5.5 Wells Fargo & Co0.1 -5
19 16 64,415.4 5.6 -468,628.6
+3 ▲▲
0.6210.3 1.90.213 7.717
66,168.0 6.6
0.15.968.0
79 8 12.2+15.8
-0.05.8 ▲ ▼▲ 0.60.1▲ 6
▲0.114 104,530.4 9.1▲▲8.8 0.9
1.5
▼28
2.989,007.8
148.0260.7 -11 172.50.4
41 ▼-9.5-3.8
5.0 ▲RBC Capital Markets 150.4117,250.3
▲Guggenheim Securities LLC 14 10 79,300.2 7.9 4.7 ▲
0.3▼ 1.21.3
0.2▼10.2UBS
13 155,799.0 ▲-7
Centerview Partners LLC 15 8 71,081.3▲17 0.4▼ 14 11
-31372.9
132.213.5Guggenheim Securities LLC+3
187 ▲
13 24 80,394.2 49 10.7▲0.7 +14▲20 8.1
8.0
Deutsche Bank0.4▲ LionTree Advisors LLCRothschild & Co 12
Wells Fargo & Co
1281,471.9 +85.4 ▲157,482.5 13.6 13.1 ▲ 0.1
17.30.612 38
9.4 -1.3 41 200,008.90.4
1111 11 93,703.0 -24 ▼ Evercore Partners▼ 0.6211,627.89 -27-6.6 ▼ 4499,816.4 10.0 -5.8 62
12.0 ▲ 1.169 1.1 +10 355.4 3.1▲
▼175.8 1.6
▲1.32.6297.3 ▼0.7▼0.635
0.718.3 ▼9.6 ▲
89 1.3▲
▲224,771.3 -30
10 499
Centerview Partners LLC 8 8110,067.1
1061
▼19.5
▼0.911.0 Deutsche Bank+6
-0.0▲ 32 ▲ 398.40.5 +9 3.5▲
Evercore Partners 8 12 129,110.7 12.9▼7
22.4 7.70.20.9 -1028.0 19.5 ▲ 354.852 3.1
8.6+21 ▲ 10110▼
JP Morgan 6323,448.0Credit Suisse
1.7 0 ▲Citi 7 4 168,792.1 16.9 -11.1 ▼
22.3 -1.00.82 353,605.1 30.6 -0.7 - 971.7▼1.3Barclays 6 7 217,520.3 21.7 3.6 ▲ 90
461.7▼ 0.9 Barclays-666 ▲76 1.3 +7▲8.9 1.3
4.1 0.6 ▲1,004.3
14.230.8Credit Suisse 5 6 223,533.3 355,801.15 725.5 Morgan Stanley 390,090.3 33.8 16.5 874 6
▼Citi-5.0 ▼ 1.8 +8126 1.4 -16 ▼
-1934.3
▲▲ 1.1
▲0.8 -353
Bank of America Merrill Lynch0.8399.1
1.135.1 663 9.3 ▲405,221.3 ▼3.5▲ 4910.25
▼517.1 4.6▼
1.5-26▼-175 259,291.2 25.9 2.3
1.39475
▼28.6 -1.4
-37 ▼532,089.8 46.1 5.0 ▲▼
Financial Advisor1 370,992.5 1.410.998 1.61 1109 1,236.81.5 -28 ▼ Goldman Sachs & Co
MarketShare Ch. Deals Sh (%) # of Deals
Market
37.0 3.0 ▲US$mDeals Sh (%) Share Ch.Sh (%)
AdvisorFees
# of Change in 2016 Rank
2015 Rank
Rank Value Market Change in Market# of Deals Sh (%)
2015 Rank
Market
US Target Announced (AD2) Jan 1 – Sept 30
MarketRank Value Market2016 Rank
Industry % Change from Same Period Last Year -6.7%
US Target Completed (AF2) Jan 1 – Sept 30
-14.2% ▼ -8.1% ▼Industry % Change from Last Quarter -10.3%
▼
100.0
-21.0% ▼▼
Imputed Fees (US$m)
▼
14,802.0
Rank Value per Advisor (US$m) # of Deals per Advisor
▼ -1.4%
Rank Value per Advisor (US$m) # of Deals per Advisor
Industry % Change from Last Quarter -18.4% ▼ -22.4%Industry % Change from Same Period Last Year -27.5% ▼ -8.9% ▼
Industry Total† -1,5381,431,883.0 9,3231,328,307.0 100.0 -1,11211,427 100.0Industry Total,,
28
3.0
0.9
3.2
▲
6.6
-25
0.27.1
+55.7
3.3
57,770.6 +8
Allen & Co Inc 20
▼-10.0%
-18
286,129.8
JP Morgan 4 2 255,041.9
BMO Capital Markets-
RBC Capital Markets 9 19
Ducera Partners LLC 16
18 14 57,148.0
0.4
-26.4%
Financial Advisor US$m Sh (%) Share Ch.Goldman Sachs & Co
0.530
Bank of America Merrill Lynch 3Morgan Stanley 2 3
Industry % Change from Last Quarter
UBS▲
1
18
1.9
▲0.3▲43,122.8Jefferies LLC 21 -0.5
106.8
-787
25▼ +8▲
▼
0.2
Greenhill & Co, LLC18 31,805.7
▼0.1▼
395,394.0
4.918
0.8
38
▲
▼
▲ 0.10.4
▼
Needham & Co LLC
101,015.8
1,154,484.2
7.6
▲
258,518.5
2
4
▼▼
6.4
▼
Market # of
0.9
25
1.4 11100.0
-1-7
Allen & Co Inc
8.1+14
11
▼Moelis & Co
-4
30
▲
▲▲
16+4 ▲
+51.7PJT Partners LP 17,638.4
61
13 35,590.6
63
-2.2
Industry % Change from Same Period Last Year
17
7,100
56
* tie
Visit http://dmi.thomsonreuters.com to view archives and order custom League Tables https://www.thomsonone.com 7
Deutsche Bank Lazard
6Barclays
-2.0 ▼
▲
▼
▼
0.8▼
0.2+4
▲
11.7
56
1.0
0.6
8
13▼
53
33
1.1 Morgan Stanley
2016 Rank
Goldman Sachs & Co
First Nine Months 2016 | Mergers & Acquisitions | Financial Advisors
32.3
Rank Value per Advisor (US$m)
633.4
3
Any US Involvement Completed (AF48)
Market
604,412.2DealsSh (%)
Credit Suisse
45.71
427,319.6
▼
US$m
10
Jan 1 – Sept 30
Industry Total
Jan 1 – Sept 30
Americas Rankings
Share Ch.
8
4
268,915.6
11
▼Financial Advisor
Guggenheim Securities LLC
-19
2
▼▲
15
▼
▼
▲9 344
+14
100 0
71 0.8
+4
-
▲-3 Wells Fargo & Co
0.6
▲+22
Credit Suisse
Citi 7
230,972.4
12
10▲
8
227,363.5
Evercore Partners 137,611.8
5
RBC Capital Markets 9 20 114,748.4
6
18 21 71,508.5 5.4
16
89,282.8
15 64,454.1
14
50
6.8
4.8RBC Capital Markets 8.3
17Allen & Co Inc 2.6 ▲Greenhill & Co, LLC
1.618,922.82425 1.6
1 175 743 5-
1.3▲
43 19,442.8
Market
▼
0.4
Rank Value per Advisor (US$m)
35.0
23.6
2016 Rank
2015 Rank
4.4Bank of America Merrill Lynch
Rank Value MarketImputed Fees (US$m)
2015 Rank
# of Deals per Advisor
▲
-6.4JP Morgan
116
MarketSh (%)
▲1 411,219.03 311,922.2
1 2.2
3 5Morgan StanleyBank of America Merrill Lynch
# of
1502
US$mFinancial AdvisorGoldman Sachs & Co
4
-1.5 ▼
Market
277,384.623.2272,386.9
0.826.5
2
Any US Involvement Announced (AD41)
▼
1.0
0.9
3
JP Morgan
-36
1.2
▲
Market
1.6Sh (%)
-43
Change in
-250
-6
1.1
229,194.9
4 2-10
0.4
-6
-2.9▲
DealsRank Value
# of Deals
1.7
-50
+6
▲
0.1 00.9
0.6
88
75
▼
+10
7
# of Deals per Advisor
-2+15
-5
2.1
▲▲
+14110 1.2
10031.1
380,275.6 13.9
8.1594.8
▼ 8.8▲1,100.6▼ 8.1▲
▼
0.0
21
23
▲▲
0.4
109,455.6
100Needham & Co LLC
BNP Paribas SA
-3.4 19
-2.3▲
0.1
4
▼
▲
▲
12
Allen & Co Inc
55,205.4Jefferies LLC
Moelis & Co 22
-0.2
32,287.2
Qatalyst Partners
Ducera Partners LLC14-
▲19BMO Capital Markets
293.9
5.5
-5.40.6
3.7
2.8
1.72.4 36
-9.119.319.6
7
▼▲
▼
▼
16.14
Lazard
Centerview Partners LLC 13 9 82,678.3 7.0Rothschild & Co
1112 17
3.1
9.6108
8.8-5.3
7.39.6113,063.7
189,316.3
103,669.3 4.4112,270.4
103
93
9.8 ▲
▼54
-7.9
5.611
14
66,168.080,169.0
5.16.96.8
5.6
Wells Fargo & Co 24 80,622.3Guggenheim Securities LLC 15
17 64,278.716
UBS
2119
58,704.518 5.0
2013 3.1
3.24.7
0.7
22
37,897.035,865.6
33
▲
▼
4
7
28
17.3 -4.5
11
Evercore Partners-6
13 206,418.9-38
▼
14▲
Centerview Partners LLC 20.3
▼
▲146,978.9 11.1UBS
▲
5.5
Citi
1
80
91160
441,379.8▼-
Barclays 6
106 1.3
18 +3
▲
▲
7
410,843.8▼
67
▼
0.2
▲
-43
China International Capital Co
Sandler O'Neill Partners 23 35
1.7
1.7
▲
MarketChange in Advisor
1 000+4
20
0.0Mizuho Financial Group
1.24.26.1
14.9
1028.7
51 0.6
▼
# of Market
-52Share Ch.
-24▲ 9110.6131 1,439.91.7
Sh (%) # of Deals Fees Sh (%) Share Ch.▲
4.4▲ 10.6
8.89.0 0.8 -46 3.4▼
1,188.7▲5 5 406,505.6 30.7 3.4▲
3.9 3.964
-9453.7
131 1.7
439.4 3.271 3.2▲92 1.2 0 - 534.1
▼26.2 17.9 ▲346,562.2 0.9 -9 ▲6.8 ▲ 34 0.4 +6 ▲ 418.4 3.1 3.1 ▲
Deutsche Bank 9 9 256,309.0 19.4 9.3 ▲ 249.4 1.8411.4 3.0
1.8 ▲3.0 ▲
-44 ▼
15.6 11.1 ▲ 7676 1.0 -16 ▼
2.9 ▲LionTree Advisors LLC 12 44 157,482.5 11.9 11.5
1.00.1 +3 ▲ 0.572.9
2.9+13 ▲ 397.10.5
▲39 0.5 -7 ▼1.1
▲1.1
7▲20 156,168.0 0.2 -1 ▼ 144.211.8 9.5 15
1.60.6 -6 ▼ 217.01.4
1.61.4193.9▲
▲Moelis & Co 16 30 102,822.4 7.8 6.7 ▲ 245.0 1.8 1.8 ▲70 0.9 +13 ▲
0.5 ▲7 0.1 +1 ▲ 71.2 0.5
▲ 1.3▲ 160.63.1 ▲ 27 1.20.3 +10
▼ 14.2
1.2 ▲Rothschild & Co 19 28 70,607.2 5.3 3.9 1.3 ▲▲ 178.558 0.7 +5
68,628.6 5.24.9
5.1▼ 165.01.1 ▲
10 0.11.20.5 -8 1.2 ▲
▲ 0.1 0.1 ▲-7
22 18 33,259.8 2.5 -0.636
▼ 2.2 ▲80 1.0 -9 ▼ 297.9 2.229 33,012.6 0.2 -4 ▼ 53.22.5 1.3 ▲ 17 0.4 0.4 ▲
PJT Partners LP 24 19 32,616.6 2.5 0.1 ▲ ▲25 0.3 +8 ▲ 108.4 0.825 49 26,469.7 2.0 1.7
0.80.6 -11 ▼ 118.0▲ 47 0.9 0.9 ▲
13 551 2 100 01 323 205 1 7 855100 0 1 315Industry TotalSandler O'Neill Partners
28,065.5Jefferies LLC
CIBC World Markets Inc Lazard
12
8
▼-
Scotiabank
6
Banco Bradesco SA 17*
Rank Value per Advisor (US$m)Market
Wells Fargo & Co
15
8.213
4.6 3.3TD Securities IncNational Bank of Canada Fin'l
14 14
11.0
16.9
1.5▼
▼
0.3
5.19,641.029
11.2
8.4
11 17,234.6
-6
Change in
0.8▲
4.6
14
+4
-
▲
-1
Market
+1
-1
# of Deals per Advisor
36-2
▼
0.8
0.6▲
10
1.4▲
▲
1817
# ofDeals
▲12.218.0
10.6
2425,624.7
53,479.7 25.549,062.2
11.223,570.4
37,703.4
23.4
1.4
CIBC World Markets Inc▲ Goldman Sachs & Co▼
0
-184
2449
Moelis & Co
100.0
Guggenheim Securities LLC
5,190.0 2.5
3,563.523 15
2565
20 20 4,586.8
Industry Total▲
1
10
3,853.7 0.11.8
2.2
-7.4 ▼
Macquarie Group
3,031.0 1.43,550.0
Peters & Co Ltd
21 9 4,523.5
+2-1.31.4▲
+1
1.7
4.1 ▲
-0.4
0.14.1 0.2
250.9
614
+1-
-
10,629.6
▲
8,578.8
Industry Total
0.1
▼13 7,001.613 ▼-0.2 43.71
0.20.1 2.9
▼ 8 0.0 - 38.7 2.5-11
6,554.7-5.2 ▼
13
5.2
7.4
7-9.9
7.4 -
▲0.5+1 ▼6.4TD Securities Inc
12
06.0
10.6 ▲112*
+7
-8-9.1
▲
-6
0.0-1 ▼ 1.08,132.11.40.112 2.011.8 ▲
36 8
▲
30.70.0
17
17,772.2 71.7▲
11
26,760.8
20,524.0 ▲
1.414.7
11.5
0.0
▲
▲
22
0.0+1
▲1.5
▼
-
1.8
▲▲
52.74.7
▼▼
7.6
▼▲0.1
2.3130.1
-1.5Bank of America Merrill Lynch 5
+4
Financial Advisor
45
9,344
25.7
43.6▲ 618.9
100.0
7
13.1 39.1
8
Lazard 11 301010
39,652.894.4
966.6
14,571.82.62.9
1013.3
▼
12.2
15▲
Barclays
▲
14,376.429
5+7
12,904.2110.1
Bank of America Merrill Lynch0.4
8
Stifel/KBW 16 95*
Sandler O'Neill Partners
16,140.7- 2BMO Capital Markets▲17,037.9Scotiabank
00.10.1
15.516.2-4
196
423
12
+1▼
3.5-9 ▼-9
▲
+429 -8
58.4-4.1 ▼▲18.7 44.0
18,629.2 17.0
RBC Capital Markets-3
3.8▼0.0
▼4
6Morgan Stanley1
2.92.9Wells Fargo & Co0.0
0.00.1 11.0
JP Morgan
34
▲12
2016 Rank
MarketFinancial Advisor
2015 Rank# of Deals
▼▼
Deals
10
Share Ch.Sh (%)
5.6
# of Deals
24.4
MarketSh (%)
-60.0
Sh (%)Market Advisor
Imputed Fees (US$m)
0.3▲
▼ 85.91.35.3
168.2 5.7
MarketMarket
Industry % Change from Last Quarter-20.9%
2015 Rank
MarketRank ValueSh (%)
Industry % Change from Last Quarter
Any Canadian Involvement Announced (AD42)
1,175,743.5
▼
27,269.1
Jan 1 – Sept 30
Change in 2016 Rank
Jan 1 – Sept 30
24.91Share Ch.
4
Rank ValueUS$mUS$m
18.7RBC Capital Markets
▲36.0▲
4 44.9 26.443.1
94,118.6 ▲
Citi
5JP MorganGoldman Sachs & Co
2
37.037.1
90,419.940.985,862.0
Credit Suisse
8
132
167
3
BMO Capital Markets 3 61,015.4
77,804.1
▲77,699.9
2329.1
▲
5,130.2
1.0
▼
Rank Value per Advisor (US$m)
▼
Industry % Change from Last Quarter
Sh (%)
1.1
+5Moelis & Co
0.9
-9.7%
154.7
109,683.9
11
21.1
-9.11.4
4.4
2,691.0▲
0.0
3.6
-19.7%28.2%
43.63,976.7
22.8
0.0 -9-111
0▲
▲
▲
7
Deutsche Bank
17
2.1
1.0
▲
Any Canadian Involvement Completed (AF49)
5
16
▲Stifel/KBW
▼
HSBC Holdings PLC
▲
2.3
9 5,656.3Rothschild & Co
▼
16▲ 21▲
▼
14
Industry % Change from Same Period Last Year 17.3% -9.8%183.8%
▲
▲
-3.922
0
▼-24.8%
22
Industry % Change from Last Quarter
* tie
6.0
-1.3
Rothschild & Co
Santander19 7 -9.9
209,773.1
▼
16.5BarclaysMorgan Stanley
-20.9%
11.1
Industry % Change from Same Period Last Year -30.0% ▼
-1,000 13,551.2 100.01,323,205.1
▼
7,855
Industry % Change from Same Period Last Year -2.4% -14.3%
100.0
▼-5.2% ▼
-20.7% -0.9%
-1,315
▼
25,056.6
▼
# of Deals per Advisor
-8.7%
Share Ch.
9.1
▼
▲-6.2
# of
▼Fees80.5▼0.010 -6
3.0 0.5 ▼1.3
▼ 46.4
1.613.1▼▼ 19.7
0.0 0.9 ▼0.0 0.4
-2.617
1416
Citi
3,930.8▼18
-7Macquarie Group
▼-2
10
7 4,812.8
0.0-5.2▼▼
▼0.1 -212 1.6▼ 24.5 0.5
2.2 ▲+6 2,882.5
17*▼
6.31.5▼
19 ▼ 34.77 0.1Credit Suisse
▲34.00.0 ▲
0.40.4+10.0▼
2,391.2▲
2.11.4
2.3
12.4
2131
-1 112*
▼23
Zaoui & Co
24
22
3,056.6-
+52.6
2.82.6
0.70.0 0 1.04BBVA
2.2▲
79 14.8
33100.0
2.12.1
▲3.0▲
0.12.5
2.10.1 2,297.1 ▲
100.0
2 0▲
Industry % Change from Same Period Last Year ▼▲
1,524.6
▼▼▲
1,2321.0 0.46
4.7%-18.4%
▼
-277▼
-24.3%
▲
-0.1
5.3- 2.4 0.2
0.10.3
1.7
+2 ▲
▼ 131.5 ▲
-0.8
1,6992,261.325
12
0.4
Industry Total
Deutsche Bank
2 1.6-1-2
20 ▲51
National Bank of Canada Fin'l
Jefferies LLC
Industry Total0.0 -20.0
0.7
5,190.0 2.5 2.5
▼
-1.2
▲▲-
14 0▼
0.84,848.5
56
2.2
45.216
2.2▲
▲-2
-34.5%
Evercore Partners
https://www.thomsonone.com Visit http://dmi.thomsonreuters.com to view archives and order custom League Tables
8
46.8
36.1
49.3
938 Morgan Stanley
EMEA Targeted Financial Sponsor Investments (Buyside Sponsor Activity)
13
36.5
2
12
11
21,013.3
28,384.5
3
36,269.7
Energy and Power
1
The Raine Group LLC
UBS
Morgan Stanley
Morgan Stanley
Goldman Sachs & Co
Industrials
Rothschild & Co
Bank of America Merrill Lynch
Financials
High TechnologyCiti
Credit Suisse
3
1,697
28.5
96,075.6
3
8
41.039,350.7
8
997 Share
19
No. Deals
1,525 45.3
EMEA Involvement Announced Advisors by Target Industry
99,461.2
5
4 9
EMEA Deals Intelligence
First Nine Months 2016 | Mergers & Acquisitions | Financial Advisors
EMEA M&AEMEA Announced M&A Down 16% | Materials Highest Valued Sector | Financial Sponsor Activity Drops
14 23.8
Goldman Sachs & Co2,138
6
Primary Listing of Most Acquisitive EMEA Companies - Top 10 (US$b) Jan 1 - Sept 30 2016
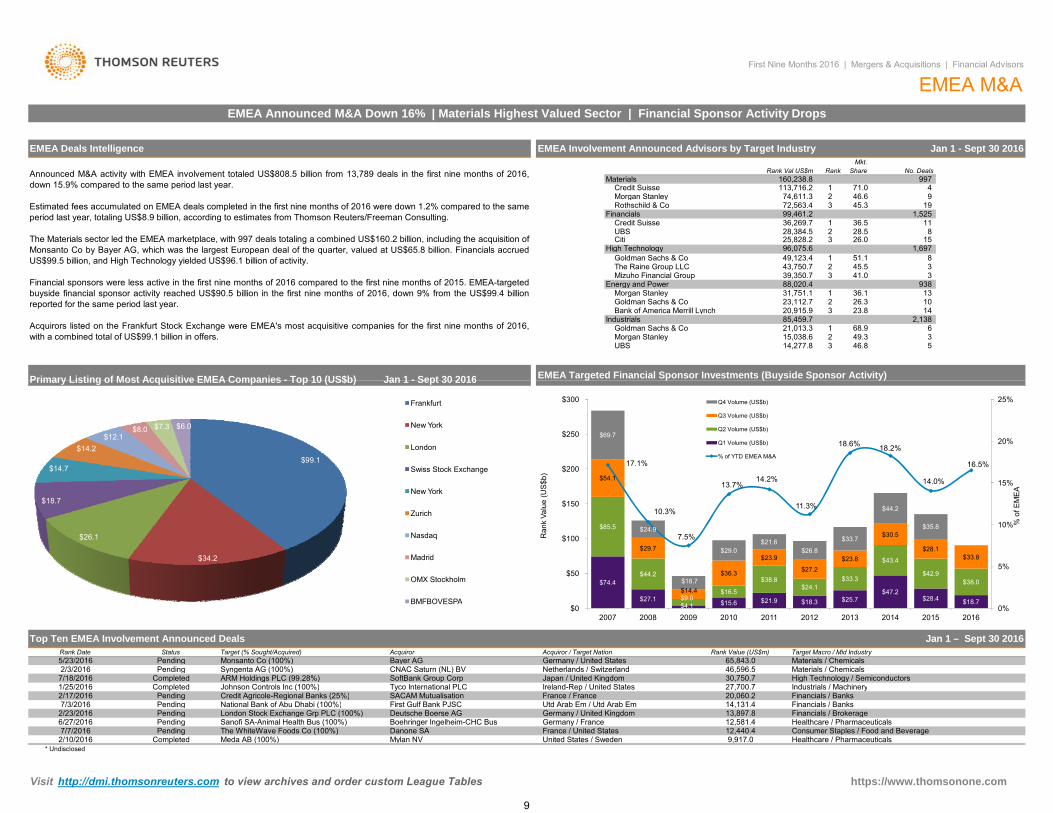
Announced M&A activity with EMEA involvement totaled US$808.5 billion from 13,789 deals in the first nine months of 2016,down 15.9% compared to the same period last year.
Estimated fees accumulated on EMEA deals completed in the first nine months of 2016 were down 1.2% compared to the sameperiod last year, totaling US$8.9 billion, according to estimates from Thomson Reuters/Freeman Consulting.
The Materials sector led the EMEA marketplace, with 997 deals totaling a combined US$160.2 billion, including the acquisition ofMonsanto Co by Bayer AG, which was the largest European deal of the quarter, valued at US$65.8 billion. Financials accruedUS$99.5 billion, and High Technology yielded US$96.1 billion of activity.
Financial sponsors were less active in the first nine months of 2016 compared to the first nine months of 2015. EMEA-targetedbuyside financial sponsor activity reached US$90.5 billion in the first nine months of 2016, down 9% from the US$99.4 billionreported for the same period last year.
Acquirors listed on the Frankfurt Stock Exchange were EMEA's most acquisitive companies for the first nine months of 2016,with a combined total of US$99.1 billion in offers.
Mizuho Financial Group
85,459.7 20,915.9
3 UBS 3
2
3
43,750.7
88,020.4
72,563.4
Goldman Sachs & Co
14,277.8 15,038.6
Materials
2
160,238.8
46.674,611.3 1113,716.2 Credit Suisse
23,112.7
49,123.4 1
71.0
Mkt.Rank Val US$m Rank
3
1
51.1
26.3
45.5
31,751.1 2
68.9
10
Jan 1 - Sept 30 2016
3 26.0 15 25,828.2
46,596.5 Materials / Chemicals65,843.0
Germany / France
High Technology / SemiconductorsJapan / United Kingdom
g p ( y p y)
Germany / United StatesAcquiror Target Macro / Mid Industry
Completed1/25/2016
PendingBayer AG
Netherlands / Switzerland
Pending
5/23/2016
SoftBank Group Corp
7/3/2016
Completed
National Bank of Abu Dhabi (100%)
Pending
ARM Holdings PLC (99.28%)7/18/2016
7/7/2016
Pending Deutsche Boerse AG6/27/2016
2/3/2016
2/23/2016 13,897.8Pending Sanofi SA-Animal Health Bus (100%) Boehringer Ingelheim-CHC Bus
Target (% Sought/Acquired)
Syngenta AG (100%)Monsanto Co (100%)
20,060.2Tyco International PLC
* Undisclosed
Pending
London Stock Exchange Grp PLC (100%)
France / FrancePending
Credit Agricole-Regional Banks (25%)
Completed
27,700.7Ireland-Rep / United States
Healthcare / Pharmaceuticals
2/17/2016
12,581.4
Industrials / Machinery
Financials / Banks
Johnson Controls Inc (100%)
Germany / United Kingdom
SACAM MutualisationUtd Arab Em / Utd Arab Em
Primary Listing of Most Acquisitive EMEA Companies - Top 10 (US$b) Jan 1 - Sept 30 2016
Rank Value (US$m)Acquiror / Target Nation
CNAC Saturn (NL) BV
StatusRank Date
Financials / Brokerage14,131.4
Jan 1 – Sept 30 2016
Financials / Banks
Top Ten EMEA Involvement Announced Deals
9,917.0Consumer Staples / Food and BeverageThe WhiteWave Foods Co (100%) Danone SA
Meda AB (100%) Mylan NV United States / Sweden2/10/201612,440.4France / United States
30,750.7
Healthcare / Pharmaceuticals
First Gulf Bank PJSC
Materials / Chemicals
$74.4
$27.1$4.1 $15.6 $21.9 $18.3 $25.7
$47.2$28.4 $18.7
$85.5
$44.2
$9.0$16.5
$38.8$24.1
$33.3
$43.4
$42.9$38.0
$54.1
$29.7
$14.4
$36.3
$23.9
$27.2$23.8
$30.5
$28.1$33.8
$69.7
$24.9
$18.7
$29.0$21.6
$26.8
$33.7
$44.2
$35.8
17.1%
10.3%
7.5%
13.7%14.2%
11.3%
18.6% 18.2%
14.0%
16.5%
0%
5%
10%
15%
20%
25%
$0
$50
$100
$150
$200
$250
$300
2007 2008 2009 2010 2011 2012 2013 2014 2015 2016
% o
f EM
EA
Ran
k Va
lue
(US
$b)
Q4 Volume (US$b)
Q3 Volume (US$b)
Q2 Volume (US$b)
Q1 Volume (US$b)
% of YTD EMEA M&A$99.1
$34.2
$26.1
$18.7
$14.7
$14.2$12.1
$8.0 $7.3 $6.0
Frankfurt
New York
London
Swiss Stock Exchange
New York
Zurich
Nasdaq
Madrid
OMX Stockholm
BMFBOVESPA
https://www.thomsonone.com Visit http://dmi.thomsonreuters.com to view archives and order custom League Tables
9
Barclays
▲5.9
▲
3.9▲
52,073.747,001.7
8.3
11.5
5.8▼
-4.9
-8.2
# of
EMEA Rankings
Rank Value per Advisor (US$m)
▲
Financial Advisor
▼▼
14
5.9
124,475.4
Rank Value Market
255,059.2 -2.1
▲
MarketShare Ch.
31.6Financial Advisor# of Deals
Jan 1 – Sept 30
Market
9424.0
1Goldman Sachs & Co193,862.1
▼3
20.721.1
1
2015 Rank US$m
# of Deals per Advisor
-1.1 21876
11.6▼
▼▼
▲
-5.3
17*China International Capital Co
Citi
80,779.0
103
4
7
China Construction Bank
Robey Warshaw LLP16N+1
Ducera Partners LLC 13
15
13JP Morgan
98
Deutsche Bank
17*
17*
-
2
9
China CITIC Bank Corp Ltd
Industrial & Comm Bank China
12
14
HSBC Holdings PLC
11
-4
121
-17.5
-6.7Evercore Partners
0.3
-8.830
0.274,205.078,595.2
▼▲
9.7 63
-43539.2 -10.2
2
8
Lazard 6UBS
Credit SuisseMorgan Stanley
Bank of America Merrill LynchRothschild & Co
7
10.0
4
10
170,773.45
131,022.615.4
6
12
5
-5.775 54,489.0
175 5.35.311
Greenhill & Co, LLC7.2
BNP Paribas SA
18 38,631.2Societe Generale
63,777.4
17
15
3.834,430.3 3.9
1533,867.9
14
▲ 16
+1
3.25732,281.2 3.6
▼▲
Guggenheim Securities LLC
▲
-2.216
Deloitte
4.3
21The Raine Group LLC
89
HSBC Holdings PLC 19
6.1
5.8
29
▲▲
248
1▲
▼
17*
0.0
1
2.45.8
▲
▲
0.0
+1
▲3 +39
▲▲
1+11+1
-5.8
5.45.4
6.15.8
5.85.85.8
▲▲
▲
-17*
-0.8
100 0
24
DyalcoCenterview Partners LLC 22 20
5.8Lakeside Capital Advisers LLC
BNP Paribas SA
Industry Total35
The Raine Group LLC 23 -14
Mizuho Financial Group 25
-2.2
0.0▲59,272.2
8.4 62
▼ 3
▼▼
163,667.17▼ 82 ▼
Centerview Partners LLC
3.2
-5
▲▼
0.1
5.41
-120.20.2
-2.6-12
Deutsche Bank
▼Citi
12.6
-34 18.4
67,628.6
1565,843.0
▲7.3 ▼+18.1 8.1
2▼ Credit Suisse
▲
-2.212
109 10.5
9.3-3.4
13
147,015.8
UBS73,637.3
12
20
8
24
849
▲
57
1182,408.293,574.4
40
1757
47
-7.2▼
-14-5
52 0.5▼▼▼
0.51.61.0
58▲
115210,458.6
+149.6 ▲
205,785.3
30.7▲
35.2-11
44.0
31.4 0.6719.6313,264.32
0JP Morgan
279,619.7 9.5
0.3▼▼
0.2
1Morgan StanleyGoldman Sachs & Co
2
0.7▼
578.0
0.70.7▲-370.3
-37
▼
▼
65- 4
38566
Bank of America Merrill Lynch3
▼-33522.577
14.3▼▲ -34
77
2015 Rank
Market
77340,136.3 38.2
DealsShare Ch.Rank Value
1
AdvisorMarketMarket
▼391,372.8 ▲ 0.72.4 -50US$mSh (%)
Change in DealsSh (%)
Any EMEA Involvement Announced (AD47)
2016 Rank
Market
Jan 1 – Sept 30
# of# of Deals per AdvisorRank Value per Advisor (US$m)
Sh (%) Sh (%)2016 Rank
First Nine Months 2016 | Mergers & Acquisitions | Financial Advisors
Share Ch.Market
▼6.5
▲
Imputed Fees (US$m)
-2.7-0.3
Sh (%) # of Deals
Any EMEA Involvement Completed (AF53)
0.0▲
1.1
0.2
Change in
-30
Fees
▼
▲
5.8364.0409.8
0.25.7509.3
446.7 0.7
▲
▲▲
2.3
179.8
0.2
▲
-0.5
-0.6
▲
▼▼0.5
0.40.0
-36288.3
▼207.7
-8 165.5
+1
▼▼-6▲ 64.4
23,543.6
▲
100 0
▼▼
195
+129,173.8 0.9
0.0
27,020.7 -1.9
0.0
Industry Total4
32
18Credit Agricole CIB
▲▼
11 071
4▼
0.1
-20.335
9▼
-2-5
7
1.4 ▲3.33.5
-4.1
▼
30,750.7 3.5
32
100 0
-6
890 477 02.6
1 246
37.10.0 0.324.1
0.0
0.2
0.30.1+1 ▲
0.0-8
8 941 6
▲-36 0.1
▲
▼ 0.3
0.3
▲0.1
+2▲
+2+18
+4
78.0
▲+12
▲4.6
3.2
4.1
5.01.30.7
0.7
▲
▲
0.6
▲
-1.2
0.90.0
▼0.6
1.9
▲0.8
6 7.210
▼16.5
74.3
57.5
212.4
▲
▲
▼
148,482.4 18.4 Rothschild & Co16.2 9.6
-8.061
23.610.7
184,993.2
167,228.9
111,760.4
▼0.4
▼Robey Warshaw LLP
22.9
▼50.2
0.2
-17 Lazard
23.1+1-12
273,471.4
▲ Barclays
0.7
0.3
81
11
0.448
0.220
35
1.0
▼
169.9
0.3
0.10.9
1.3
2.2196.7
2.4
2.8
1.9
2.0
▲
249.30.7
115.9
22.6
56.9 -0.5
-0.4
0.80.4 ▲
0.30.2
-
37.5
-
▲
20Mizuho Financial Group
Sumitomo Mitsui Finl Grp Inc
Perella Weinberg Partners LP
2.3
22
▲▲
24-
3.023
8425
28
12▲13 789
041,310.7
+1
-28
0.00.0 +1
0.0
0.0+20+1
0.1
▲
527
0.0
0.3 +14
0.0
0.0
0.0
▲
▲
11
46,596.5 5.8
6.351,057.350,890.9100
5.8-
6.3
313 46,596.5
46,596.546,596.5
--
43,987.046,596.5
4.0
43,750.75.242,345.2
808 497 7
5.4
5.1
Barclays Robey Warshaw LLP
-6
-29
-5.84.3
169.9
228.9
196.7
5
8
0.7
▲
Industry Total100.00.0
* tie
2425▲
1.9%
5.3The Raine Group LLC0.1
0.0 ▲+10.1
+1+1
162,414.2
▲▼▼
911
144,304.4
46
▼12.5
▲6.4
- Sumitomo Mitsui Finl Grp Inc▲
4.2
5.8
21The Raine Group LLC
16
▼
5.0427.4
5.8
▼▼ 207.7
360.0▲▼
▼404.9
# of Deals546.3-47
Change in Fees
▼ 490.9
US$m
-2.2% ▼
Advisor
Industry % Change from Last Quarter
478.9
82▼
Share Ch.
15.6
19.8
88-3.3 0.7
Any European Involvement Announced (AD21)
0.4
64
78120
0.6
6.41063,777.4
16938,631.2 4.747,001.7
11111,760.4
4
7
9
329,054.3
2
12
37
26.0
22.2-3
10.5-9.3
22.8
Market
+1
-9
Evercore Partners
-2
UBS
▼Citi
-27
▼ 1.6213
▲7
▼57
0.6
8Barclays▼
Lazard▼5▼
▼ Rothschild & Co
4
Deutsche Bank148,172.0118,977.8 15.9
▼-5.5-8
-330.9
745 5
▲
166,007.3
-15.3 ▼-9.1 ▼
4 -1.86Credit Suisse
168,255.43 170,209.810
22.5
100.0
▼Industry % Change from Same Period Last Year
2016 Rank
Rank Value
▼-15.9%
Industry % Change from Last Quarter
Industry Total
▼
Sh (%)1
Morgan Stanley1
US$mFinancial Advisor
2
8
22
Deutsche Bank
2015 Rank
2Goldman Sachs & Co
Citi
Lakeside Capital Advisers LLC
China Construction Bank
Rothschild & Co
24Industrial & Comm Bank ChinaRobey Warshaw LLPN+1
59
1 0.0
0.5
18China International Capital Co
20
14
Deloitte
0.0
4.3 ▲23 ▼-1.9
2.6
▼Industry % Change from Same Period Last Year
22Credit Agricole CIB
Industry % Change from Last Quarter▲
20,212.433
4
11910
UBS
Industry % Change from Same Period Last Year
Centerview Partners LLC
Industry Total
142327
14BNP Paribas SA
193,862.1
163,667.1
10.0
MarketShare Ch.
199,296.1
81,756.2
273,160.912.0
33.4
-10.1%
46.2377,374.6
Rank Value
32,281.2
Any European Involvement Completed (AF3)
-19.1%▲
73,637.3
3.53.8
33,930.0
3.3
30,750.7
52,073.77.8
4.1
9.0
Industry % Change from Last Quarter ▲
-
100.0817,114.6
4.0
9.8%
Mediobanca84 23,543.6
Perella Weinberg Partners LP
5.3-
▲
12,923
Mizuho Financial Group 3525 39,350.7
41,310.7
3.210.7
BNP Paribas SA
746,866.9
38.3%
5.5
15
Dyalco
China CITIC Bank Corp Ltd
▼
▼-
64,858.6
▲
▲
▲
1-11.0
▼7 52
▲
0.2
0.0
0.46028
14
0.0
0.5
1.5
-4.03.8
17
3.433,867.9
28,883.5
15
27,020.70
2.5
▼
2.9
6
▼
55
13.1%
74Sh (%)
92,505.5
100.0
9
35
Industry Total 11,071 100.0890,477.0 -1,246
0.757.5
0.2
0.90.3
# of Deals per Advisor
▼
▼
MarketImputed Fees (US$m)
▼-2.8Sh (%)
▲
▼
1.0
209.8
64.4
37.5
1.9
78.0
179.8
162.9
▲▲
0.5
▲▼-0.6
0.8
2.52.5 -1.0
0.7
0.12.7
Market
▲5.7
1.44.2 ▲4.8
0.8
6.4Share Ch.
0.3
-0.4
▼
8,941.6
▲0.1
2.0
Jan 1 – Sept 30
▼
52.1
0.9
▲
▲
▲
▲0.12.4
2.3 ▲
▼
74.3 0.2▲
-8 0.2
▼
▼
-6.5%
8,483.7
0.3
19
0.3
0.0
32
0.8
0.0
0.4
0.1
+1
+4
+21+2
5251
173
54
▼ 7
2▼▼
46
▲Deals
# ofMarket
▲15.1
270,450.3
278,719.7
6.833.1
34.17540.3
▲
11.3
▲
70112
74
▼
▲
-3.2
11.2
-6.2▲
20.024.4
-2.2
7.1-0.8
-2.25.8
13.7
7.7
▲
17.7▲
▼
19.9
▲▼ 81
32
11
▲ 931
▲
▼-30.2
▼
▼
▲▲
-2
0.0
0.3
1.60.5
0.5
-31
-5
-4
0.5
0.7
-330.7
-15
-33
+1
1.1
-8
0.0
0.7
+14
MarketSh (%)
0.7
0.4
▲
-1.2%-0.3%
.224.4
206.3
Morgan Stanley
Guggenheim Securities LLC0.3
1.14
0.1
32 -6
▼
-4.6
▼
-18.7%
+2▲
▼
-380.9
10,528
-9.7%
▲
20
▲
-17.8%
+15
3
12
-0.1%
2
3.4%
1
+2
0.5
-13
+1
-4
▼ 2.8▼
# of Deals Financial Advisor
2-38
2016 Rank
-37Goldman Sachs & Co
Rank Value per Advisor (US$m)
3
2015 Rank
1
Industry % Change from Same Period Last Year
15Centerview Partners LLC
JP Morgan
10
12
3
13
6
Bank of America Merrill Lynch
Credit Suisse
▼▼▲
▼
17
Mizuho Financial Group
Societe Generale
19
▼
HSBC Holdings PLC
16▲
▲
▲
▲
▲▲
▲
▲
-420.1
0.4+1
+200.0
-2
+1
-11
-3.7%
# ofDeals
Change in
▼▼
Sh (%)
▼
0.6
Jan 1 – Sept 30
# of Deals per Advisor
13,789
-22.8%
Rank Value per Advisor (US$m)
-527
Market
▲
▼
44.1
-
24.1 ▲
0.0-0.00.1
▲
2.1 ▲1.1
▲0.8
-0.30.3
▲
▼
0.1
▼
▼+2
0.6▲
4
0.1-3▼-2
▼
-
16.2
1
-5.4
5.6▼
▲
▲
▲0.346,596.5
5.9
▲ 10.3▲0.39
100.0
0.3
48
0.0+1
-4970.5
2
0.4
▲-7.8
-1.5%
22.6
-1,135
▼5.743,987.0
6.2
▲
8.8
7.68.7
-2.5
▲
46,596.5 6.26.2 6.26.26.8
46,596.5 6.2
-
-
6.246,596.5
46,596.5
6.2
6.217*
14
16
17*
17*
17*
50,890.9
24
17*
88
51,057.396
19
11
-
6.6293
6.8
-0.92.6
3
28
65,843.074,205.0
856,502.2
80,165.81274,831.2
8.3116,198.113
33.1
808,497.7
-14.6%
246,882.8
Market
Bank of America Merrill Lynch6
13
Lazard
HSBC Holdings PLC
JP Morgan 7
9
12Ducera Partners LLC
42,190.3
9.98.8
10.0
Visit http://dmi.thomsonreuters.com to view archives and order custom League Tablest e
https://www.thomsonone.com
10

The Raine Group LLC Barclays
Nomura
23
Lazard
# of Deals2016 RankFinancial Advisor
# of Deals per Advisor
Sh (%)2016 Rank Sh (%)
Market Change in Rank Value per Advisor (US$m)
1
150,724.45
165,149.8
2015 Rank
4
Rank Value per Advisor (US$m)
156,540.1
26,212.715,662.1
6,152.9
0.1Lazard
-12
US$m
Any UK Involvement Announced (AD32)
13
# ofMarket
25
6,819.4
6
1
Rank Value2015 Rank
▲
1.1Deals
18.4
Goldman Sachs & CoFinancial Advisor US$m Sh (%)
Market
63.6
Market
47.22Goldman Sachs & Co 1
Morgan Stanley
Rank Value
▼-10
▼
Jan 1 – Sept 30
Market
▼
▲
-0.1
▲
0.2
0.0
1.6
0.6
0.4
1.0
-0.2
0.4
▲ 0.0
100 0
▲1.6
44.8 22.643.1
111,760.4
4
38
142,080.86
67,333.3
16
▲
-1.0
24.2
▲
222,366.8Sh (%)
▲ 0.2Deals
-0.4Share Ch.Sh (%)
▲
9.228.5
EMEA Rankings
Market Market
150,309.3 25
-21
▲▲
# of Deals
3.0
32.0
21.9
0.25
0.7
0.4
1
▼
Deloitte
▲
0.1
0.0
19.3
2.2
43.040.6
26,507.5
-3.7
30,750.7
18.2
30,750.7
14,417.2
2.6
10,386.1
0.5
191*
8.8
3.9
63,653.2
35,448.6
8
-20.98.7
10.1
29,167.4
60 3.7
0.30.0
58,450.9
8.8
30,382.6
6.1
23.4
7.6
▲▼
▲
20▲2
2621
14
0.1
0.1
0.1+1
-23 ▼
0.0
-150.1
0.1 -6
0
0
+4
▲▼65
0.2 +70.1
▼41
▼29 -8
0.129
3.5
22.6
64.4
+2
-8
▲-13
+1
-6
▼
▲▼
▲
▲▼
▼
▼
5.7▼19.9
2 408100 0
-1
471
0.00.0
# of Deals per Advisor
7UBS 8
Any UK Involvement Completed (AF39)
# of
▲33.6
21
17
6 16.7
▲▼
0.5▼
▲
▲
-2-
▲
▼
-2
0.00.2
-1+1
0.8
0.30
+40.0
▲+1
-33 ▼
-3
▼-2
-25 ▼
▼0 -
▲
-LionTree Advisors LLC
306
0
40.5
11.9
1.0+1
+1
-3
19.5
19.9
51.4
+3
-0.13 293 9
▼
1.734.7
120.8 3.71.962.3
▲
▲
1.0
▲
0.0
1.1
0.6
0.61.2
0.1
-
1.8
▼
-0.9▲▼
-0.7
0.7
▼0.0
▲
2.4
0.7 ▲
▲
▲▼-0.7
▲▲
1.7
▲3.2▲6.4
1.1
-0.12.0
▼5.7
0.0
225.2 -0.1
Jan 1 – Sept 30
Share Ch.9.5
597,275.0
Share Ch.
12.7 ▼2
144.6
Change in Advisor
313.4+2+2 1.2
6.3
92.294.2
▲
-
-
▼▼
23.1
115.8
211.56.8
2.90.6
0.7
57.90.7
187.5
205.94.4
▼
▼-
0.01.8
6
RBC Capital Markets8,269.46,865.1
349 739 4
2.4
2423
1.6
8,540.9
25
20
Industry Total
57
21 15
Credit Suisse
12*
Robey Warshaw LLP
Deutsche Bank
2.4
19Greenhill & Co, LLCHSBC Holdings PLC
Perella Weinberg Partners LP 16
10
14
Mizuho Financial Group
1718
319
11
The Raine Group LLC
Evercore Partners
11
910
22
31
9
7
15
5
181
Imputed Fees (US$m)Market
Fees
209*
38
12513
14
30,750.7
1112
-26,480.825,391.623,595.7
51,057.3
▲
23
16
1.7
-0.1
1▲
▼
▼
0.0
Nomura
48
Industry Total
24Credit Suisse
17
HSBC Holdings PLC
19
23199
22M Klein & Co LLC
Rothschild & Co
Greenhill & Co, LLCEvercore Partners
17Societe Generale 16
18
RBC Capital Markets
204 843 2
110*
Numis16
66*
20
LionTree Advisors LLC
Perella Weinberg Partners LP
19,177.7
21BNP Paribas SA8,276.8
15
4,055.3
11,276.78,649.3
Citi
6,152.9
21
3.3
3.03.1
-1.7
3.02.7
2.7-0.2
▼ 18
▲
0.6
-14.0
1
▼
111
2 990
4.0
2
32
4
4.24.0
-2.247.5
15.8
28.524.9
6.2
First Nine Months 2016 | Mergers & Acquisitions | Financial Advisors
24UBS0.1
37
19.218.9
6
12 58,463.0
Morgan Stanley 11
Bank of America Merrill LynchJP Morgan
9*
Barclays9*Mizuho Financial Group
6
828
32,432.4
2
Robey Warshaw LLP 4
Deutsche Bank38
10
▼-17.7
0.0▼
247
53
1.4▲
430.8
Rothschild & Co0.825
JP Morgan
Bank of America Merrill Lynch
1.0
30-6
▼-191.0
290.8 ▼
-80.1
+10.0 ▲
131
▲▲8.8
14
212* 8.8
68 Citi
12 ▼-100.40.6
0.7 ▼
-+7-262.3-15
▼▲
213▲
▲8.3
7.5
-4.6
▼
+2
▼ 0.0
-115-9
0.117
0.0
4.5 -2.7
7.6
4.1▼
0.08
12
▲ 6
▼-8
0.02.0
1
0.1▲
▲1.8
▲ 10.1
77
-Moelis & Co
Sumitomo Mitsui Finl Grp IncM Klein & Co LLC
20
▲▲
▼
▲▲
208
64,236.5
▲
▼
▲
9.7 ▲
▼
▲
30,750.7
38,629.439,373.6
18.5
31.4
-20.8
37,834.6
▼
15.013.7
15.0
-33.8
5.015.0
▲
0.7
4.6
14,773.06.8
18,078.07.2
-12.32.0100 0
4,170.0
12.912.4
69 5,632.4
5.5
8.8
6,408.8
9.411.5
13,897.8 4.4
▲
2.0
7.2
-1 1.7 0.11.3 ▲ 2
* tie
Societe Generale JP Morgan
RBC Capital Markets
▼Industry % Change from Last Quarter
-9▼-22.8
12
-7.1%
-17.2%
▲
▼Industry Total
-
-42.0%
--
2,819.7
0.1
▼ ▼
▲
0.10.01
-1
2
3,716.4
+2
75
2,140.0
▲2
9▲
-16.1
33.8
21.7
29.032.6 -21.9
-21.1%
1.8
0.1
3
0.10.0
Market
▼
0.30.5
16.4
31
40
▼
Rank Value
Any French Involvement Completed (AF40)
0.1
-4+2
▲
▲+1
0.1-0
+1
-1.5%
-1+2
-1
115.6%
1 11
2016 Rank # of Deals
▼
Share Ch.Sh (%)
100.0
Jan 1 – Sept 30
MarketFees
▼12.0%
AdvisorImputed Fees (US$m)
Market
3.6
▲-2.2
5.16.9
▼
▼
79.2
3.79.7▲
▼
▼-
53.9151.9
58.5
0.0
32.1
37.3
32.1
▲
▲
-
▼22.2
▲+1
0
+2
+1
01.644.6▼
▲2.1
1.633.5
▲
13.7
.61.3
0.5
0.1
-
▲
2.1
0.0
▼3.5
1.2
0.0
-0.0 0.0.0▲1,564.4
▲100.0-167
+30.20.1
7
0.4
▲▲
2.63.2
0.4
3.4
-
2.4
90.9
▼
0.0 -
55.537.4
107.7
▼
28.0▼
10
23.922.2
▲▼
+100.5
+15-8
1250
-5
-60.5
1.20.5
2.3
1.7
27
-16.5
1.2
0.4
Rank Value per Advisor (US$m)# of
35,354.7
▲0.2 +3+3
16
Change in
+2
▲
0.0
1.6▲
-18.5%-6.3%
1.82,384.1 5
6.9%
100.025
▲
Industry Total
1.92,364.3 -6.416
▲ 1,718.7
▼
2,476 100.0
2
1
▲ ▲
1.5
27Ondra Partners
- 2.6▲
▲
4.0
2.2
▼
2.1
▲
+10.0
4-0.93.0
13.03.0
3.0
4.13,716.4
2,715.4
3,616.43,420.2
2.2
3,716.4 3.02.9
19.017.3
4.3
-4.0
-19.9
21,496.5
8,942.47,996.7
-19.7
Morgan Stanley27.2
9BNP Paribas SA
4.9
5Credit Agricole CIB
67
32,079.533,819.9
28.7
24,612.1
Sh (%)
0.4
2016 Rank
2,408
Bank of America Merrill Lynch
100.0
Financial Advisor
# of Deals per Advisor
-7
-41.5%▼
Change in
10
20.8▼ 0.4
-471
37.4Citi
4
-15.8%
-0.6
▲
▼
▼ 3.5 +5
0.541,713.7
5
2 31,448.7Goldman Sachs & Co
37
3 1040,574.2
-6-3
6
Rothschild & Co-12 36,632.6
▼
21,555.6
24,062.2▼
-4
150.2 ▼
67
Credit Agricole CIB 13
14-924
1640
101.0
+1
Societe Generale
-20.9
61
0.4+2
Barclays
-11.1 ▼
2.5
5.4
9.0
6,687.5-3.55.2
5.4
7.26.4
146,722.1
15 6,135.25,078.27516
13
1554
Industrial & Comm Bank China
Accuracy SAS 2122
Barclays
Malayan Banking Bhd 17*
20JayDee Partners Ltd
20
17*Evercore Partners
-
31
2,698.7 2.2
45
Industry % Change from Last Quarter
2.8 2.8
* tie
▼▲
143*
Wells Fargo & Co 230.2
0.1
0.4
0.2
101.9
2
Credit Suisse
Citi
11
17*
Natixis
124,138.6
HSBC Holdings PLC
Deutsche Bank
Industry % Change from Same Period Last Year
Nomura
24
Perella Weinberg Partners LP
Santander
-
12
23,581.1
5
4
22
8
3109
11,119.1Bank of America Merrill Lynch
8JP Morgan
30,202.710
▼▼
9▼
- 3,716.4
▲5361
▲
▲▲
3▲
▼
1.9
14.1%
▼▼▼
+51.21.9
MarketSh (%)
3.6
▼▼
0.4-6
# of Deals
▲
8
1
-306
▼
-1 ▼▲
26+1
25
Industry % Change from Same Period Last Year
3.4
23
1,650.01.6
-25.5%
12
6.0-
13,954.18.99,679.1
1163
19
0
-5▲2710
▼
9-10
-0.8-9.1
▼11.3 ▲
780.4
-2▼
2.665.7 4.256.6
3,293.9
▼
▲
▲
▼0.6
-3.21.0
2.1 ▲1.3
▼-1.32.4
0.6
1.4
▲0.4
▲0.5
1.8 -0.3 ▼
3.5
▲2.9
▲
0.6
1.0
▼
5.83.6
▲
▲
▲0.0
0.1
▲0.10.6
-0.20.1
▼-
▲
-0.00.1▲
0.20.9
0.2
0.122
Wells Fargo & Co
Mediobanca24
21
6▼
Malayan Banking Bhd17
3.3
1▼
2.3
JayDee Partners Ltd 20
12.99
8.1
12
14
MarketSh (%)
48.9 31.4 ▲
-1.5%
Share Ch.
38.4
US$m
Industry % Change from Same Period Last Year
53,017.8
349,739.4
▼-17.9%
Industry Total
# of Deals per Advisor
7
54,126.1
30
-9.3%
Rank Value per Advisor (US$m)
US$m
-47.6%
▼
10
20▲
+22▼
Duff & Phelps
34,200.74 13
# of
619.8
27.6
24.325.8
▲
+4
-9.6
▲
▲
35,582.2
Benedetto, Gartland & Co, Inc.
+2-2 ▼
-6.7▲1.5
46
1.5
1
▲
Rothschild & Co
3
Market
Jan 1 – Sept 30
-12.4%
2.011.0
▲Goldman Sachs & Co
43.62 2
Rank Value
Industry Total
Financial Advisor
Industry % Change from Same Period Last Year
2015 Rank
Industry % Change from Last Quarter
204,843.2
Deals
1.6
Share Ch.22.9 90▲-3.7
-8
▲
▼
Deutsche Bank
Sumitomo Mitsui Finl Grp Inc
6
+2
BNP Paribas SA
▲▲
109
Zaoui & Co
11
13
1516
▼
2.0
3,568.5
6,536.0
▼
108,542.6
0.20.30.6
Natixis
▲
Industrial & Comm Bank China
HSBC Holdings PLC
▲
Credit Suisse
1918
1
-15.2
1.7
-0.7
Morgan Stanley
5
6
Lazard
2015 Rank Sh (%)
Market
2,990
4 42.045,601.9
Industry % Change from Last Quarter
12-2.4
-23.8
38
▼
▼
7.8
8,808.7
25,949.6
21,011.016.519.4
17,911.2-10.715.4
▲1 0.0
▲
23,502.119.9
15,278.516,662.0
14.1
4.3
▲
▲
8.1
2
2,200
3
+1
▼
-261
-10.6%
▼
▼
100.0
Any French Involvement Announced (AD33)
Lazard
Market
▼
Deals8
https://www.thomsonone.com Visit http://dmi.thomsonreuters.com to view archives and order custom League Tables
t e
11

PricewaterhouseCoopers Macquarie Group
▼-9
-22
▲▼
-0.11.8 1.8-4.3
3.3264
25
▼▼-19
+40.53.2
0.4
-5-2-3
▲+4-1
▼▲
-370.4
0.10.50.10.1 0
+1
91
0.30.40.61.10.1
▲
4.334141
▼ 3
▲▼▲▼
13
▼▲
1.5▼▲
1.1-16.9
▼▼▲▼▲
0.9
469.70.9
-20.6-5.32.5
-15.10.2
3.0
1.5
-6.1-1.31.81.8
1.61.5
2.3
1.6-1.8
676.3648.2
3.73.5
388.4
1.5
1.1
--
1949*
1.2548.930
800.9716.2676.3
15
2,149.41,827.41,638.01,634.11,571.41,348.51,023.017
6232425
211245
1812
-UniCreditErnst & Young LLP
1112131415161718
-1Credit Agricole CIBMediobancaLeonardo & CoPJT Partners LPDeloitte
1920*20*22
HSBC Holdings PLCCredit SuisseBanca IMI (Intesa Sanpaolo)Rothschild & CoSociete GeneraleBank of America Merrill LynchKPMG
10.7▼▲-▼
12.7
▼▼
Erneholm & Haskel AB
1.5
▼▲
-0.20.20.0
-3.7-0.30.3
6.9▼▼
2.51.40.40.4
▼-0.1
-38-2-3-10
223
2450* ▲
11
▼715.0676.3
1.91.91.8
1,226.8 0.35.21.3
-10.1
-1.4-1.3
-23.4222324*
-▼
▲▼▼▼
24*
Societe GeneraleKPMG
Leonardo & Co
7,000.0
676.3
871.7
31.1Financial Advisor
Mediobanca
BBVANomura
1019
5
27
9
11
1,592.0
3,405.3
First Nine Months 2016 | Mergers & Acquisitions | Financial Advisors
724.3
2021
17.8
6
9.1
# of Deals▼
MarketSh (%)
-0.4Share Ch.
Change in
▲Fees
0.98.1
Advisor
▼ 1.6 -1.5
Imputed Fees (US$m)
13.8-0.1
▲▼
7.520.8
7.14.8
2.8
▲4.1
1.4
0.4▲
0
+3
▼-43.819.0
2.8
1.90.6
-8.0
1.0
-1-
1.70.2
▼
▼
-
+31.4
-0.6 ▼
-4.0
▲
-0.20.9
-3.2
▼
2.12.53.0 ▲
EMEA Rankings
Market
7.2
1.4
-3
-3
▼+1
# of Deals per Advisor
Any Spanish Involvement Completed (AF41)
▲▼
0.1
Jan 1 – Sept 30
37.8
MarketSh (%)
0.6
▲
0.5▼1.9
▲
▲0.3
3.2
▲
0.8
▲4.024.4 4.9
2.02.0
0.32.1
5.9
▼▼
5
-9.7
-15.9
-8-1.5-6.0
2,349.8 6.3
4▲
2,879.0
106,645.24,407.9
▲3,879.6
6,661.58
4,301.3
18.6
7
12
7,526.0
1
16
Share Ch.
▼
3.410.8
▲
▲▲
▲
▲
-37.4
2015 Rank
▼
Jan 1 – Sept 30
Rank ValueChange in Market Market
2,642.6-32
0.61.7
10.6
▼7.83,473.7
5
▲
Goldman Sachs & Co
# of Deals per AdvisorMarket
92110
Lazard
Deutsche Bank▲
Rank ValueSh (%)
0.8
# of
▼AZ Capital
0.5
▼▼
-2-1
▲
▼
Goldman Sachs & Co
12
-8
0
+4
▲
Citi-8
7
RBC Capital MarketsMorgan Stanley
910
8BBVA 20
143
14.514
21.7 ▲4.7Deutsche Bank 4
5 14.4Santander
# of Deals32.5
22 -0-6
Share Ch.
0.917.6
DealsMarket
81
2016 Rank
2015 Rank
Citi32AZ Capital
Financial AdvisorMarket
6Sh (%)
29.3
US$m
787
31.2
5,336.47
5.95.04.84.13.7
6.1235
6,458.3
Morgan Stanley 7 9,732.7
-2.811.96
3BNP Paribas SA
Rank Value per Advisor (US$m)
Any Spanish Involvement Announced (AD34)
7
4▲
14,538.813,965.5
2,233.2
28
▼
6,485.5
▲
3.4▲
-18.4
118
14PricewaterhouseCoopersUBS
13
100 044 759 1Industry Total
10.3▲ +3
48-1.1▼
5.0
▼
+113
56 0.8
+7
▲
1.8
4,742.1
2
6
45
1
20.125.1
7,549.812
11,652.9
9
2016 Rank
-61.0-
Credit Suisse
▼
12.0
Lazard
Rothschild & Co
Santander
11Bank of America Merrill Lynch
3Deloitte
1716
8
10
15JP Morgan
33
14
40
+7122
369
0.30.1
▲21
3.50.41,535.4
BNP Paribas SA18
17.4
Rank Value per Advisor (US$m)
11.8
18.7
▲4 7.7
5
1.7
20.1
11.8
7.10.6
3
3
Sh (%)
-9
04
7.7
10.4
▲7.3
11.5
17.7
US$m
9,394.1
2,215.6713
0.6
4.7
3
14.4
6.7
Deals
▲
▼-20.60.4 7.0
19.917.9
16.9▲
▼
3.4
3.6
8
0.7
33
# of
4
▼
4.01.4
16.3▼
▼
49
15.2
2.1▼
10.5
▲
0 -
▼1.6
+3
▼
4.5▼
10.48.0
▲▼
1
0.64
▼
4
▲2
0.7
4.71,753.24.3
-36.0
2,227.3
▲
▼▼
-5.53.32.3
Banca IMI (Intesa Sanpaolo)
19 1,300.2
260.8HSBC Holdings PLC
100 0
23
Industry Total 37 481 2
0.1
4-1
881
-28
0
0.69.7
1.2-
4.1▲
3.0
0.8
7.2
502 8 100 0695
Industry % Change from Last Quarter
Barclays Credit Suisse
Houlihan Lokey
Industry % Change from Same Period Last Year
0.3-1
16
-39.2%
79
-44.4%
21
11
13
Ernst & Young LLP
12
8
36,031.5Morgan Stanley 45.3
95* 5.28,525.4
6
8
ING5
-46.9%
21
Rank Value per Advisor (US$m)
Industry % Change from Same Period Last Year ▼ ▼
Imputed Fees (US$m)
9.6
MarketShare Ch.Sh (%)
-3.2
▲
▼
2.5
4.6
▲
2.3
▼
▼4.4
3.6
0.2 ▲
▲▼-3.3
1.2
-
▲-1.5
▼0
Fees
-0.4
99.0
▼
-5
0.7 ▲
Advisor Market
3.9
2.7
48.0
▼
45.7-4.8
0.916
49.8
787
▼
1
Sh (%)0.80.7
▲
▼39
-4▲
3
+1
-30.50.2
0.2
1.0
+30.23 ▲
3 ▲+1
40.24 0
+3+5
▲+2▲+6
▲▲
1923
18
Credit Agricole CIB 25
22
24Mizuho Financial GroupBNP Paribas SA
Moelis & Co
▲ ▲
-941,014.4
15▼29 -26
+1
-16.5%-27.1% ▼
Industry Total
56.3%Industry % Change from Last Quarter▼
1.7 78 1.379,574.1 100.0
1,112.1
1,034.6
▼
0.00.2
-14.8%
2.524.7
-0.2
1.5
▼▼
-0.4
▲
0.5
0.7
▲0.5
0.0 -
-0.4
-0.4
▲
0.7▲
0.80.8
▲
-
100.0+3
0.2
2.4
0.1
7.3
1.5
▼
1.10.2
1.3
Industry % Change from Same Period Last Year ▲
5
▼-5.2%
7
▲1,720
9
2.3
16
▲
0.4
30.0 ▲
0.1
8
0.2
1411.0
10
1.0
▲
▲
0.8
18
▲
Change in
Jan 1 – Sept 30
Market
▼▼
0.3
1 0.1
# of Market
35.8
-42.2% ▼
▲▲
Share Ch.14
33,653.7
18,647.4
7.8
-7.829,048.3
10.1
15.8 -6.2
9.1
10.6
20.9
-
15,775.714,766.4
64
2.8
17,084.7
4,657.0
9.3
Industry % Change from Last Quarter
16,731.5
-
5,094.9
25
7.6
Credit Agricole CIB 4,043.72322
2.1
94.8%
Industrial & Comm Bank China 21
3,433.1Industry Total
CITIC
▼
Credit Agricole CIB4,461.0
92524
7.8 ▲
Ernst & Young LLP--Valence Group
184,439.9
-70.1%
2.4
1.9101.0
94* 2.2
▲
2.4
▼
10.1
-6.27.3 ▲
-13
504,502.4
8- 13,897.8
35
Citi 18 7,449.0
Commerzbank AGBerenberg Bank 2419
20
Robey Warshaw LLP 17
▲
11.07.5▼
3,800.0
9.3
27
14,017.9RBC Capital Markets 16
▲HSBC Holdings PLC
15BNP Paribas SA6.6
4.0 -7.8
0.5
▲
▲
17+112
+2
UBS- 5.04,065.0
▲Deloitte 32
▲▼108.6
ABN AMRO Bank
4.74,014.2
5.17.0 14
8
▲0.2
▲0 -
+1▲
3.0
▲0.9
38,691.3
0.90.5
▲
0.1
▲5.1 0.1
1.0
6.6
73,342.3▲
10.1-19,619.6
21.0
219.7
▲
65,843.0
0.4
5
Perella Weinberg Partners LP 11
67 36,349.2
8LazardGoldman Sachs & Co
7
12
JP Morgan 18.3Deutsche Bank 39
9.3
19
Societe Generale
7.3
7.1
10
8.0
18▼0.7
UBS14
▲
0.1
▼
PricewaterhouseCoopers
1
▲
# of Deals
# of Deals per Advisor
-118
-46.5%
12
Deutsche Bank▲
0.6 ▲
Deals
Citi
+2 Barclays
4.2
4,461.0
2.5
15
HSBC Holdings PLC
0.5
3,724.9
Mediobanca+46
6
4,095.1
Rothschild & Co▼
+4+3
9▲
Lazard
▲
+10 ▲
▲
Perella Weinberg Partners LP
+4
+4
10
31,960.7+7
▲+1+3
9,454.0
5
Goldman Sachs & CoJP Morgan
26.4
▼40.2
▲
14.6
5.2▼▼11.9
0.07
-3.7
11,127.21
23,705.9
14.0
928,235.8 35.5
21.0
30
66
7.1
2
7.0
▼
-94 1,363
17 -12
Morgan Stanley
5
52.13
Ducera Partners LLC6
286,641.9
4- 35.735.7
39.8
100.044,759.1
Rank Value
▼
Rank Value per Advisor (US$m)
101,251.5
2015 Rank
96,104.9
-62.6%
13
1
1Financial AdvisorBank of America Merrill Lynch
Industry % Change from Same Period Last Year
4
Industry Total
-8.5%
2016 Rank Sh (%)US$m
Industry % Change from Last Quarter
Financial AdvisorMarket
▼8.7▲+5
0.7
1.8
▲
-213
24.8%
1.2-6 ▼
▲▲ 0.7
-80
▼ 3.9
15.011.6
0.27.52.2
1.1
4.7
5.2
9.210.9
-2
37.2
64.739.8
+2
-26
+5▲
-1 31.3
+2
+2▲
▼▲
▼
▼
-2
30.66.33.0
+5
2.6
26.3
+1
▲
26.4
39.8
▲
-7▲
+1
▼
12-7
Jan 1 – Sept 30
▼
Any German Involvement Completed (AF42)
▼
Rank Value Market2016 Rank Sh (%)
-3.3%
29.8
US$m
▼
100.0
3
Market
223,735.4
3
▲▲
-▲
Share Ch.2015 Rank
20,045.7
Bank of America Merrill Lynch4
14.0
75216
29.84
25.2▲
2019
1.0▲3,306.6
10.7
-10.1
▼
29.6
▲
2513
-2,066.3-
3.217
3Centerview Partners LLC
40 1,904.1
▼
2.82,240.5▲
1,754.1 ▲1,510.4 1.9
▲2
-1.71.1
1,157.2▲
2.2
1.81.91,500.0
2.4
1.3
-
▲▼
4
0.11
61.9
9-3.5-2.1
▲
▼1 0.1
0.30.7
14 1.0
+4
▼-9.3%-13.5%
Credit Suisse47.0Rothschild & Co
▼
▲
▲
Any German Involvement Announced (AD35)
2.82.6
0.9
1.0
-4.4
52.6
▲
-8.0
1.5▼1.4
Industry Total 37,481.2
▲
5.3
0.9
0.5
▼
29.4
4
-12.9 12
▲
12
0.3
27
3
7
Deals54.9
23,546.7
11,586.0
0.63
2
6
Market# of
0.9
0.4
2.0
8
70.7
▼
1.8
0.9
9
Change in
-35.6
# of Deals per Advisor
# of Deals12
-1
0.5
0.1
Sh (%)
0.2
0.4
0.4
▼
-881 502.8 100.0
-2.0%-42.1% ▼
695
* tie
Visit http://dmi.thomsonreuters.com to view archives and order custom League Tables https://www.thomsonone.com
12

KPMG Banco BTG Pactual SA
HSBC Holdings PLC
2015 Rank
Banca IMI (Intesa Sanpaolo)
Rank Value per Advisor (US$m)
Jan 1 – Sept 30
# of Deals per Advisor
15
0.9
1.7
▲
# of Deals
+2128
13
-13
1.5▼
Change in Market
Morgan Stanley1.4
10
▲
Sh (%)
2
14,681.2
17.220.3
Share Ch.
2
38*▼
Share Ch.
1 21,865.839.6
205.5
▲2.6
2.00
+3
23.4
1218.6 ▲
2.3▲▲
17
Market
Any Italian Involvement Completed (AF43)
34.9 ▲4.7
Jan 1 – Sept 30
Sh (%)Market
Share Ch.Sh (%)34.0+8
# of Deals per Advisor
Fees
▲
-
▲▲
▼
▲
30.1
12,701.0
6.7
▲
3.026
1.7 ▲
Imputed Fees (US$m)
13,184.7
20,086.2
1.6 20.0
▼
▲1.121.0
13
▲
5.1
-1
+1
4
0.2
5
-8
0.12.6
+1
0.8
+30.76
+6-2
11-14.5
▼
▲▼
▲
8
2.1-3.6
0.98
-17.625 12
1.4 +66
-14.2
100 0
50*
5.9
▼-3
-47
1.2
▼
280.2
33.9
0.7
11.1
+17
7
-8
-5.25.8 0.74.1▲
1.021.0-
2.2
-
-0.3 0
36.9
3.0
1.4
21.692
0.1
-1
1
3
0.70.5
15.4
6.8
7.5
6,715.4
4,857.2
14.4
9.3
7.5
-0.5
6,985.3
5,199.05,815.6
7.6
9,001.4
▲
▲10.710.7
-13.5-
▲
7.3
0.8
▲7.0
5
6.96.919 51
24,339.5
8Equita SIM SpA 4,406.018 51
Vitale & Co SpACredit Agricole CIB
5.2BNP Paribas SALeonardo & Co
25 1524
1,355.5
2,044.523
+64
▲
6.7
▲▼
63*
Goldman Sachs & Co
163.6
2.2
-26.0
1,869.2
20 3,421.8
37 2,246.422
1921 3,264.6
Banco BTG Pactual SA
▲ 1
▼
▲
▲
▼12
▼▼
▼
# of
-4.2-16.7
▲▼
443
23
-6.4
-23.1▲
14,458.2
194.8
24
20
22
5
4,945.2
Leonardo & Co
53*
1,726.2
1,355.51,718.8
38
1,952.9Vitale & Co SpAJP Morgan
Houlihan LokeyErnst & Young LLP 1,040.8
▼Credit Suisse55 016 7Industry Total
2976.3880
8.1
6.45.7
3.6
0.61.5
+122
13
Credit Agricole CIB
1.9
4,629.523
-
13
1,188.3
3,499.4
2223
21 14
BNP Paribas SA 3,242.218UBS 2,611.117
1941
3,769.215 86 4,412.2
Colombo & Associati 16
2
14Equita SIM SpA
UniCredit
9 24101112
Citi
7
Goldman Sachs & Co
6,442.6
169
8 60
4,844.8
Rothschild & Co
Nomura
Morgan Stanley
2
Rank Value
6
2016 Rank
Market2015 Rank Sh (%)
36.0 ▲4 19,824.4
-27.1
Rank Value per Advisor (US$m)
16,820.2
Financial Advisor
7Mediobanca
Any Italian Involvement Announced (AD36)
Bank of America Merrill Lynch
Lazard
1Itau Unibanco
9,946.0
4
US$m
3
5,387.1
5
EMEA Rankings
Deutsche Bank
-4.6
11.7
9.0
18.116.5
9.8 5.711.7
8.0
8.8
3.1
2.2
6.9
2.5
3.1
1.8
23.0
▲
Market
4,433.7
14
13
3.0
▼
19,407.91
▼
▼
3.3
62
6.4
-12.1
1.5
0.80.7
1.3
▼
▲
-5
4.00.6
▲
Financial Advisor
+11-
Deals
+4
▲
▲ +34
▼ Mediobanca30.6
First Nine Months 2016 | Mergers & Acquisitions | Financial Advisors
▲# of Deals
-0.9
# of
32.0▲
5
9,071.31
103
12,736.5 23.2 ▲
7
▲
Deals
0.7
-1.08.8
4.6
▲0.6
▼
4.3
+2+11
0.4
+3
0
2.71.1
▲
3.8
731 2 100 0
▲
4.6
2.2
▲▼
1.9
1.54.0
▼1.9
▼16.1
---3.4
+33
-5 ▼-
-1.0
-0.6
1.3
2.2
0.83.8
0.3-1
+11
2.9
3.8
▼
9.615.8
42.6
▲
▼
▼14.0
▲▲
50.8
16.0
+5
28.1
29.5
▼0.4
▼-2.0▲
0.60.51.3
▲
1.813.4
0.9▲9.4
▼
4.5
5.9
33.6
▲
▼-1.6
▲
-
▲
7.0 2.6
10.6-0.6
0.6 ▲1.3
Advisor
0.0
-
US$m Sh (%)Market
1Bank of America Merrill Lynch
639
Market
▲
Rank Value
9
2016 Rank
8
Market
▲
5▲
1.6
1.2
1.2
11
▼ Itau Unibanco
+37
▲0
Citi
-3
UBS
▲
4,787.2 -21.4-2 ▼
▲7.7
320.7▼
8.3
0.7
▲4,580.5 -14.9
-1
▲▼
▲4,722.7-2
+5+3
738▲
▼8 -1
-6.7
0.43
13
▲1.1
100 0
-5.13.0
5.5
+7
▲
17
0.75.0
3.3
0.36.9
1.5
1.80.7
UniCredit
BarclaysNomura
3.3
62 730 9
24
55
14
8
12
7
13
-4
16
24
3
8.4 -35.9
▼▼
-19.3 15
1714
Rothschild & Co11BDT & Co LLC
0.70.1
+7
+4
65
10+3
5
0.5
8
▼
6
26.3
35.3
▼-12.8▼9,638.6
10,795.0
24,862.4
-14.1
Change in
LazardDeutsche Bank
20
-1
JP Morgan
Industry Total
▲
▼
▲
▲
Banca IMI (Intesa Sanpaolo)
KPMG
+30.9
+3
+2
35
6.71.7
3.0
▲3.3
▼
7.09
Credit Suisse
5▲▼
1.0▲
+81.1▼ 7.2
11
Industry % Change from Same Period Last Year ▲
Nordea Societe Generale
Industry % Change from Last Quarter
241,079.7
-
2.9
2.4
4.0
1,651.6
2.3
3.0
14
▲ -26.4% ▼
2,339.4
-3.0
0.917.620.7
100.0
0.60.919.8
▲
14.1
▲
1
8.6
18
▲▼
18.7
▲
5.5
▲
▲20.6
24.0
CIMB Group Sdn Bhd
Danske Bank
Industry % Change from Same Period Last Year
22
2,959.2
KPMG 21Nordea
21▲
-2.8
88.7%15.8%
-3.115 ▼58,879.5
▲
Houlihan LokeyMoelis & Co
Arctic Securities ASA 20
1,437.5
1,342.6
0.2 0.3
▲Industry Total
16
251,156
▲-0.5
▲12.8% ▲
+6
-2+2
▲
▼+17
1.5%
0.1 ▼0.2
▼2.8
1▲
1.40.22.4 21,417.6
292.8
▲8.3
-3▲ 2.5 4.1
3 9.8+14
10▲
0.9 +5▼25 +21.4
3.9▲
19.2 0.93.7
14.1UBS 0.4
9,917.1-
19 4 1,741.6 -11.0
16.8
4.4
1.6
31.4
1.6
2.5
+31.0▲
▲▲+1
3.35
+2
16.812
0.5
+1▲
5.06
2.2
0.6
▲
0.3
0.2
0.1▲
0.1
▲
▲
▲7
1.3▲
▲▲
+5
2
▲
10
2.413
1.8
▼0.21,732.0
▼
Rank Value per Advisor (US$m)
16.1%▼
100.0
90.5%
2015 Rank
▼
Financial Advisor
-65.9%
Rank Value per Advisor (US$m)
Any Nordic Involvement Completed (AF44)
Industry % Change from Last Quarter
FeesDeals
+64
Jan 1 – Sept 30
▲
Sh (%)MarketMarketMarketMarketMarket
-30.2%▲
55,016.7Industry Total 880
▲
▼-11.2%
Industry % Change from Last Quarter
+5
Change in
39
+1
Handelsbanken Capital Markets+2
▲
Credit Agricole CIB
Bank of America Merrill LynchDeutsche Bank
Credit Suisse
12Zaoui & Co
▲
▲7
SEB
-
10,384.7Rothschild & Co
Jefferies LLC▲
-
Centerview Partners LLC16
-10*
2,564.2
13,779.613,779.614,118.6
3
9
13 2513,609.212,200.4
--10*
8-
75* 14,143.6
6
4
15,140.7
9 16,869.5
21
2317
18
3618▲
1514
▲
Ernst & Young LLP
0.6
0.1
0.1
188
0.6
101.4
12
0
0.11.1
+10
1
0.8+4
230.8
+1
0 -+4
+1
+5
1.1▲
▲
▼
▼-6-1
+2+1
▼
322
40.3
9
23
1
▼
0.1
0
+5
Industry % Change from Same Period Last Year
70
15,011.9
Market
Jan 1 – Sept 30
20.9
+122
2016 Rank
Any Nordic Involvement Announced (AD37)
US$mRank Value2015
RankFinancial Advisor Sh (%)
-74.6%
10.4
19.4
12.5-12.213.6
-2.2
10,601.6
13.8
14.7
▼▲
15
4.2
10,469.7
13,580.319.4 -11.618.9
20.3
4.4
▼
3.9
▼6.0 ▲6.5
6.8
5.9
-24.3
175,167.8
4,675.3
8,600.026*
5,608.7258,600.0
6.1
3
3.5
▲
8
▲
+7
▼
1
+4
+63.7
14.6
77.2
2.9
12.0
1
12.0
13,913.9Rothschild & Co ▲
▼Deals Sh (%)
▲0.9
# of DealsShare Ch.
3.5
0.4
2.7
0.57
-22.7
▼
0.4
0.23.4
3.0
-1.6
-33.4
100.0-9.9
▲2.6
1.22.3 2
▲
.211.9
14.4%
100.0859.7
+1
▲
0.6▼
1.4-2-1.5
▼
▲
▲
▲+1+31.6
0.05.0
23.4
8▲ 7.2
29.712.7
+1+2
0.2
1
5.5
3.00.3
3.0
▲-0.7
▲
▼▲
3.8
3.1+10+8
65.226.8
▲
▲▲
1.5 ▼3.5
-0.51.7
▲2.0
-1.37.3
24.0+1
00.7
26.6▲
23.4
24.0
27.9
7
15,643.8
123.423.4
24.025.7
+2
4
30.0
6
20.2
Rank Value
16,426.3
Sh (%)Change in
US$m
▲
Sh (%)
3
17 0.9
10
▲15
2016 Rank
Market
Lazard 1
2.10.5
731.2
2
# of Deals
10
17.9
3.3
▼
100.0
1.1
-0.4
▲
0.9
1.50.1
2.2
-0.5▲
▲
-
0.6
▼-0.2
-0.2
▼
1.0
▲
2.48.0
▲
0.0▼
▼
0.1
0.30.4
0.80.4
▲▲
▲
Share Ch.▲
0.1
▼
▲0.76.0 ▲
1.428.6
Advisor Market
1.4 ▼
4
1,947.1
1,802.5 ▲1,888.9
0.4
2.50.6
▲
1,600
19.3%
0.3
▼
+125
-28.9%
1,681.671,910.3
25 13
-25.0%Industry % Change from Last Quarter
Danske Bank
2320
22
-
28*
21
2324
1Deutsche Bank20
Ernst & Young LLP
Itau UnibancoArctic Securities ASA
Barclays
11
2,712.32,663.7
48
24,881.4
13225
4,237.0
1 8
12.0
Bank of America Merrill Lynch
7Goldman Sachs & Co
Morgan StanleySEB
14,586.02
8*
336
10
12
6
-
Lazard
44
Mizuho Financial Group
12Citi
Centerview Partners LLC 28*6
3
58
Carnegie
15Pangea Property Partners ABJP Morgan
Jefferies LLCCredit Suisse
16 441718
749
2,961.0
Industry % Change from Same Period Last Year
19
Moelis & Co
3.5
8.5%
Handelsbanken Capital Markets 32
9,917.18*
5
14
The Raine Group LLC
3,265.1
2,143.52,500.0
3,133.0
3.9
7.6
+1
4.1 -20.1
4.5
33.8▲
9
-1
▲
▲12.5
▲
-30.8%
6
▲
# of
738
# of Deals per Advisor
9.5%
+3
-
▲
3.7▲
47.632.8
▲25.8
2.5
14.6
23.1
0.1
43.6%
Imputed Fees (US$m)
▲Share Ch.
▲
-26.4%
717,646.4
28.7
2
100.0
23.5
21.817,860.7
5
18,538.8 31.5
▼▲
11
62,730.9
30.3
▲
7
▼
Industry Total
Goldman Sachs & Co
Industry Total
UBS
▲▲
+3
▲▼
# of
0
# of Deals per Advisor
-
▲
0.4
Citi
0.4
0.6
JP Morgan
0
0.5
Morgan Stanley
7.8
3.8
12
-27.7
▼
▲
+4
▲
▲
10
▲
https://www.thomsonone.com * tie
Visit http://dmi.thomsonreuters.com to view archives and order custom League Tables
13
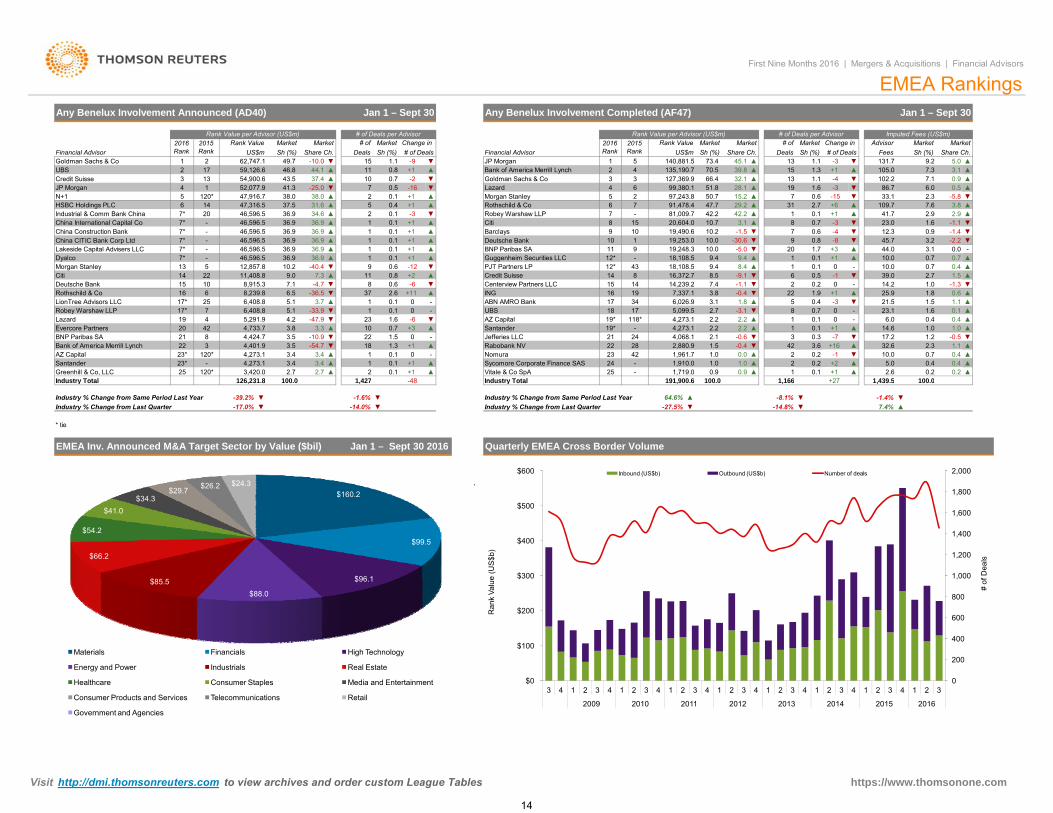
China CITIC Bank Corp Ltd Deutsche Bank
1,961.7
2.61,719.0
-5.0
-3.1
-0.4 3.6
-3
0.78
▲
▲
-1.1
32.1
42
▲
13
1.8
31
1.9
3.1 0.7
▲
# ofMarket
29.2
-4
Share Ch. Sh (%)1.145.1
▲ 1.3
-30.6 ▼ 9
▲
▲
15.2
-1.5 ▼
20▼
US$mFinancial Advisor2015 Rank
Rank Value per Advisor (US$m)
JP Morgan2
66.4
42.2
12* -
5
50.7
70.5
10.2
51.8
Rank Value
9.4
10.010.0
+1
Goldman Sachs & Co
Guggenheim Securities LLC
2
1519,490.6
+110
19,248.3
919,253.01
9+1 10
11
Bank of America Merrill Lynch 4 135,190.7
▲
▼ 8 0.6
▲
0.1
▼
37
PJT Partners LP+2 ▲
ABN AMRO Bank
Credit Suisse11Centerview Partners LLC▼
1
10.0
▲
-6
▲0.0 ▼
▲
▼
2.2
+1
100 01 439 5+27100 0Industry Total 191 900 648+1▲
1 16610.9
▲221.0
0.2
0.4 ▲0.4
0.70.4 ▲
▲
▼-7 -0.51.21.132.6 ▲▲+16
▲
▼
0.1
-12.3
+2 5.00.20.2
0.2
-0.4
17.23
-
-30
5
▼2.2
1 0
7
▼
0.8
▼
▲6
▲
-8
0.1
1
22
8
19
0.4
1.67
0.6
1
0.3
42.2
1339.8 15
+1
7.3
0.10.1
62,747.1
Market Market
Any Benelux Involvement Completed (AF47)
Imputed Fees (US$m)
73.4
Change in
105.0▲
# of Deals per Advisor2016 Rank
First Nine Months 2016 | Mergers & Acquisitions | Financial Advisors
25
MarketSh (%)
▲▲
23.4
-10.0
Rank Value per Advisor (US$m)
Share Ch.1
Share Ch.# of Deals▲
# of Deals
Jan 1 – Sept 30
140,881.5Deals
Market
46.8 44.1
Sh (%)
-25.0 ▼
Market
▲
0.541.337.4
31.636.9
38.0
34.6
▲
38.0
43.5
0.1▲▲▲
Barclays
0.4
▲ 1 0.10.1
AZ Capital2.7
0.1
-12
+1 BNP Paribas SA
43+1
▼
7,337.1
2.2
14
UBS
8.516,372.7
4,273.1
19
81415
▲12* 18,108.5 9.4
18,108.5
7.4
1.0
17
-0.62.12119* - 4,273.1
1.0
2.2
1,910.00.9
5,099.5118*
4,068.11.5
24
-
2,880.9
-
▼Santander▲
34
19*
22 28Jefferies LLCRabobank NV▲Nomura
2423 42
+30
-
Vitale & Co SpASycomore Corporate Finance SAS
-
▲0
22
+1+1
+11.3
23
0.10.1
1.6 -6
126 231 8
4,273.11
1 4272.7 2.7
100 0
4,401.9 18
3.44,273.1
0.1
0.7
3.4▼
13.4 ▲
▲
-10.9 1.5
▼
3,420.0
3.7▼
10▼
1
▼
▲
▲
2.6 +11000.1
0.118
3.8-
ING 16
-
▲17 6,026.9 3.1
▼0.2
0.11 0
20.5
3.1
0.1
▲
▲
44.0
- 10.010.0▲
0.7
▼
3.8
▼
▲▲
▲
2.7-1.3
▼ 45.7
47.77
-4
8.41
+3
81,009.7
1.7
10.7
9.4
14,239.2
+1
▼0
12.3
-9.1 -1 39.0▼-
109.70.1 ▲
-3 6.086.7▼
28.1▼
▲ ▼
▼
▲
Market
+19.2
AdvisorFees
Market
102.2
131.7
25.9
2.3
6.0
1.1▲
0.9
▲2.9
▲▼
0.4
▲
23.1
14.2
1.5▲
-▲
0.7
▼
▲
-
0.40.7
1.5
3.20.0
5.0 ▲
▼0.5 ▲
2.9
3.1 ▲
0.6
-1.4
0.9 ▲
▼
▼
▼
-2.2
▲▲
Jan 1 – Sept 30
Sh (%)
1.1 7.1
-1.11.6
0.41.0
23.0
-5.8
1.0
7.633.1
41.7
14.6
1.6
1.0
21.51.8
Citi▲-
Morgan Stanley
8
6Robey Warshaw LLP
4
91,478.4
20,604.07
5
36
127,369.999,380.197,243.8
3Lazard
Rothschild & Co+1-16
▲+1▼-3
▲▼
-2
-9+1
2015 Rank
▼59,126.6
52,077.9
1.1Deals
49.7
36.936.97* - 46,596.5
47,316.5 37.5
Financial Advisor US$m
6
13JP Morgan
3
5
17
2016 Rank
120*1
Credit Suisse2
Any Benelux Involvement Announced (AD40)
47,916.7
2Goldman Sachs & Co
Rank Value
4
1UBS
EMEA Rankings
China Construction Bank
N+1
-3
2.7 +6+1Industrial & Comm Bank China 207*
-15
China International Capital Co46,596.5
10
-
7* -
Citi 9.0
7*7* -
-
13 57.3
46,596.5Dyalco
14
36.9
12,857.836.9
36.9
10.236.9
42
Greenhill & Co, LLCSantander
Lakeside Capital Advisers LLC
22
17*
Lazard
15
7*
23*
Deutsche Bank
LionTree Advisors LLC
Industry Total
23*
20
AZ Capital
21
25
3
Morgan Stanley
Evercore Partners
Rothschild & Co
6,408.8
8,239.8
Robey Warshaw LLP
16
BNP Paribas SA
7
10
22
17*19
8
6
120*
4
Bank of America Merrill Lynch
4.25,291.9
120*
-47.9
-54.7
-25
4,733.7
11,408.8
6,408.8
46,596.5
8,915.3
46,596.5
54,900.6
36.9
0.8
-33.9
6.5 -36.5-4.7
3.5
7.1
3.8 3.33.5
-40.4
▼
▲
0.6
36.9 36.9
2
▲ 1
5
▲0.6
0.11
0.1
▲
90.8
▼1
0.7
Change in Sh (%)
# of Deals per Advisor
▲
4,424.7
46,596.5
5.15.1
14 ▲
# of
1115
HSBC Holdings PLC
36.9 1
7▲
2
Jan 1 – Sept 30 2016EMEA Inv. Announced M&A Target Sector by Value ($bil) Quarterly EMEA Cross Border Volume
-14.8%
100.0
-1.4%▼
1,439.5
7.4% ▲▼
+27100.0
-8.1%▼
Industry Total
64.6%
191,900.6-48 1,166
▼▲▼-1.6%Industry % Change from Last Quarter
-39.2%▼ Industry % Change from Last Quarter-14.0%
Industry % Change from Same Period Last Year-27.5%
* tie
Industry % Change from Same Period Last Year ▼-17.0% ▼
126,231.8 1,427100.0Industry Total
$160.2
$99.5
$96.1
$88.0$85.5
$66.2
$54.2
$41.0$34.3
$29.7 $26.2 $24.3
Materials Financials High Technology
Energy and Power Industrials Real Estate
Healthcare Consumer Staples Media and Entertainment
Consumer Products and Services Telecommunications Retail
Government and Agencies
`
0
200
400
600
800
1,000
1,200
1,400
1,600
1,800
2,000
$0
$100
$200
$300
$400
$500
$600
3 4 1 2 3 4 1 2 3 4 1 2 3 4 1 2 3 4 1 2 3 4 1 2 3 4 1 2 3 4 1 2 3
2009 2010 2011 2012 2013 2014 2015 2016
# of
Dea
ls
Ran
k Va
lue
(US
$b)
Inbound (US$b) Outbound (US$b) Number of deals
https://www.thomsonone.com Visit http://dmi.thomsonreuters.com to view archives and order custom League Tables
14

1,212
China Securities Co Ltd21,612.6 17,931.4
China International Capital Co 21.2
79,484.1 133
51417.6
672 68,478.1
25,372.8
JP Morgan
116,120.9 IndustrialsCITIC
Jan 1 - Sept 30 2016
6
10.9
7
38.94
6
No. Deals
Asia (ex-Japan) Involvement Announced Advisors by Target Industry
3
1,484
3
711.43
16.4
33.721.9
1
2
3
220.3
8
7
Morgan StanleyReal Estate
10
2
Announced M&A volume with Asian involvement in the first nine months of 2016 decreased by 6.3%, compared to thesame period in 2015, accruing US$780.2 billion with 9,560 deals. Materials, High Technology and Industrials were themost active industries in the period.
China National Chemical’s US$46.6 billion acquisition of Syngenta was the largest Asian-involvement deal in the firstnine months, followed by the US$16.8 billion acquisition of SF Holdings by Maanshan Dingtai Rare Earth & NewMaterials. Jinan Diesel Engine’s US$14.5 billion acquisition of CNPC Capital was third largest Asian-involvement dealto date and the largest deal announced during the third quarter of 2016.
According to estimates from Thomson Reuters/Freeman Consulting, M&A advisory fees from completed transactions inthe region totaled US$2.4 billion during the first three quarters of 2016, an 8.2% decrease from the US$2.6 billionrecorded during the same period in 2015. Goldman Sachs led the fee rankings with US$206.3 million, followed byMorgan Stanley and JP Morgan, with US$148.2 million and US$124 million, respectively.
China domestic activity for the first nine months of this year posted US$385.2 billion from 3,711 deals, a decline of 2%in volume and 1% in transactions from last year's 3,756 deals. Meanwhile, Australia's domestic activity for the first ninemonths of this year posted US$31.3 billion from 535 deals, a decrease of 15.6% in volume and 5% in number of dealsfrom the same period in 2015.
23,621.6
1,505
13,093.0
Rank Val US$m131,208.8
Asia Pacific (ex-Japan) Deals Intelligence
Financials
58,200.4
102,003.7
5.5
967 1
120,610.0 51,060.0 52,345.7 Goldman Sachs & Co
China International Capital CoMaterials
High TechnologyIndustrial & Comm Bank China
Mkt.Rank
44.42
Share
39.9
Morgan Stanley13,736.3
3
1Goldman Sachs & Co
The Raine Group LLC
Morgan Stanley
19,802.3
China International Capital CoCITIC
3* 1
10.7
4,399.4 6,865.4
HSBC Holdings PLC
29.09,183.3
18.6
Asian M&A Falls 6% I Imputed Fees Down 8% I Materials Most Active Industry
39,140.8
First Nine Months 2016 | Mergers & Acquisitions | Financial Advisors
Asia Pacific (ex-Japan) M&A
Halcyon Capital Ltd 4,399.4 3* 5.5 1
Industrials / Transportation & InfrastructureWuhan Iron&Steel Co Ltd (100%)
3/14/2016 Shenzhen Metro Qianhai Intl (100%)Pending
Date Effective Target (% Sought/Acquired)
Industrials / Transportation & InfrastructureMaanshan Dingtai Rare Earth & 16,829.8Jinan Diesel Engine Co Ltd
10,372.6
Syngenta AG (100%)
8,780.7China / FinlandChina / China
Consumer Staples / Household & Personal ProductsHigh Technology / Computers & Peripherals
CPFL Energia SA (46.1%) State Grid Brazil PowerIntended6/21/2016 Pending Supercell Oy (84.3%) Tencent Holdings Ltd 8,600.0
Jan 1 - Sept 30 2016
Financials / Other Financials
9/23/2016
3/23/2016Materials / Metals & Mining
Pending
Asian Completed M&A by Region - Imputed Fees
10,805.6China / China
China / China 14,482.9Industrials / Building/Construction & Engineering
CNPC Capital Co Ltd (100%)
Pending
Energy and Power / PowerBrazil / Brazil 7,716.4
9/23/20169/14/2016 YTO Express Co Ltd (100%)
9/6/2016 Pending
Baoshan Iron & Steel Co LtdDalian Dayang Trands Co Ltd
China Vanke Co Ltd
5/23/20162/3/2016
China Cross Border Announced M&A
CNAC Saturn (NL) BVSF Holding (Group) Co Ltd (100%) China / ChinaPending
Rank Date Acquiror / Target Nation Target Macro / Mid IndustryAcquirorTop Ten Any Asia (ex-Japan) Involvement Announced Deals
46,596.5Rank Value (US$m)
Netherlands / Switzerland Materials / Chemicals
China / China
High Technology / Software
2/17/2016 Ingram Micro Inc (100%)China / United States 5,600.0
Pending China / United States 6,257.76/6/2016 General Electric Co-Appl Bus (100%) Qingdao Haier Co Ltd
Tianjin Tianhai Invest Co Ltd1/15/2016
0%
20%
40%
60%
80%
100%
$0
$10
$20
$30
$40
$50
$60
$70
$80
$90
$100
2Q10
3Q10
4Q10
1Q11
2Q11
3Q11
4Q11
1Q12
2Q12
3Q12
4Q12
1Q13
2Q13
3Q13
4Q13
1Q14
2Q14
3Q14
4Q14
1Q15
2Q15
3Q15
4Q15
1Q16
2Q16
3Q16
% O
utbo
und
Ran
k Va
lue
(US
$b)
Outbound (US$b)
Inbound (US$b)
% of Cross Border is Outbound
$0.0
$0.1
$0.1
$0.2
$0.2
$0.3
$0.3
$0.4
$0.4
$0.5
$0.5
2Q12 3Q12 4Q12 1Q13 2Q13 3Q13 4Q13 1Q14 2Q14 3Q14 4Q14 1Q15 2Q15 3Q15 4Q15 1Q16 2Q16 3Q16
Impu
ted
Fees
(US
$b)
North Asia South Asia Southeast Asia Australasia
https://www.thomsonone.com Visit http://dmi.thomsonreuters.com to view archives and order custom League Tables
15
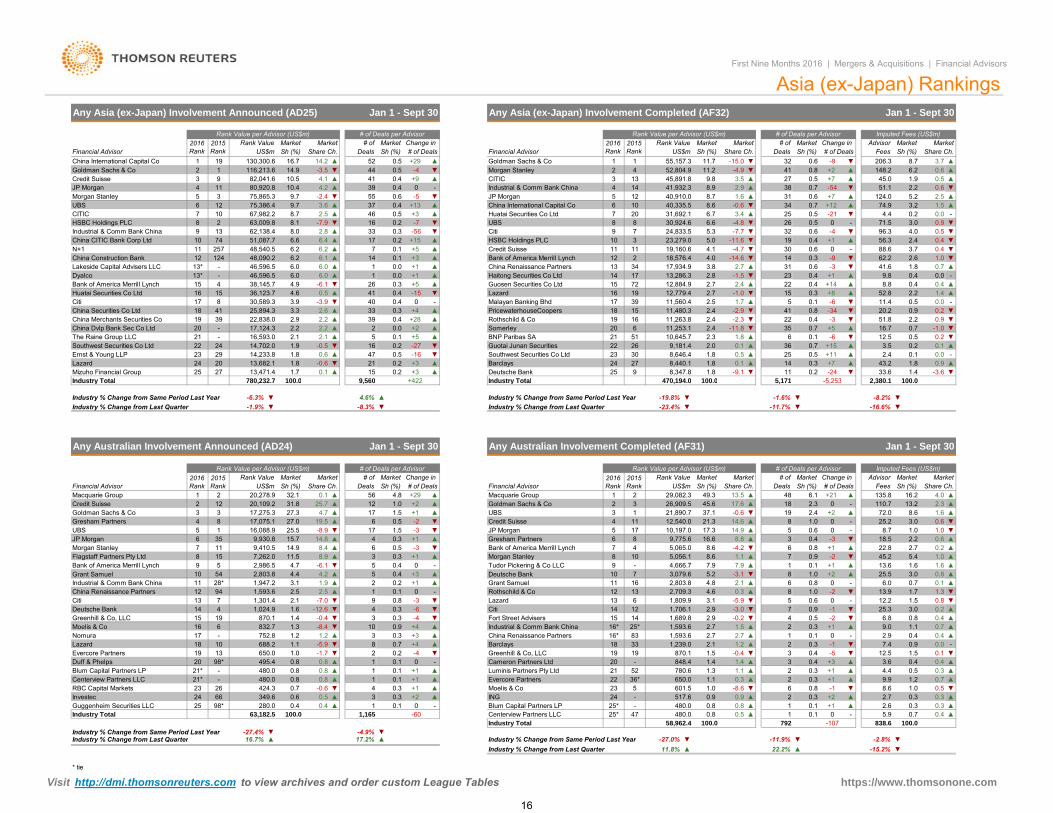
China CITIC Bank Corp Ltd HSBC Holdings PLC
31,692.1
Deals
13
+1337
# of Deals per Advisor
9UBS
+32 63,009.8
62,138.4
Industry Total
17,124.3
HSBC Holdings PLC 8Industrial & Comm Bank China 9
Bank of America Merrill Lynch 15 4
China Renaissance Partners
15
13,471.4
0.40.0
Sh (%)Market
-1.0
Asia (ex-Japan) Rankings
Huatai Securities Co Ltd
Jan 1 - Sept 30
16
▲
-1.52.4
2016 Rank
0.9
1.0
First Nine Months 2016 | Mergers & Acquisitions | Financial Advisors
▲
43.2
0.4
25Mizuho Financial Group 1.7
Southwest Securities Co Ltd 22 24 14,702.0
270.2
Any Asia (ex-Japan) Involvement Announced (AD25)
1.81.80.1
+422100 0▼8,347.8 ▼1.4 -3.633.6
5 253100 0
27 0.1-2411
0.39Deutsche Bank
24▼-9.1
▲0.2
+110.5▲ 14 +7 ▲1.81.8 Barclays▼
9,181.4 2.0-0.1
+321Ernst & Young LLP 23 29
-0.6Lazard 24 20 13,682.114,233.8 0.0▲ 2.41.8 8,646.40.6 ▼ 0.547 Southwest Securities Co Ltd
▲ 0.725
1.9-16
▼ 0.10.230
16 ▲+15 ▲ 3.5 0.236 0.1
▼16.71.8 ▼▲ 6 0.1 -6 0.2
0.76▼10,645.7+5 ▲ 2.3
35+2 -11.811,253.1▼ 22▼ 0.7
0.4 ▼▲+5
0.4China Merchants Securities Co 22,838.0 ▲2.9 2.219 390.20.9
2.2-325,894.3 PricewaterhouseCoopers3.3 2.6 2.411,480.3 -2.9
Rothschild & Co 16+28 2.419 ▼51.8 0.9▼0.80.3 15
-2.3▲+4
Citi 1720.2-3418China Securities Co Ltd
30,589.3 3.9 -3.941
0.10▼▼ 41
17 -611,560.4▲ 18
-▲2.72.5 1.7
2.2▼ 11.4 0.00.55
52.8+80.3 72
190.4 -1.0▲
0.336,123.7 4.6 1516 ▼▼41 -150.5 Lazard
▼ 9.8+10.4 0.4 -23 ▲8.8+14
1.4 ▲22
▲▲0.4▼4.9
Dyalco 13* - 46,596.5
12 2 18,576.4 4.0 -14.61.841.63.8
0.3▼
China Construction Bank▲ 1 0.0 31 0.6
0.1 +3 ▲ Bank of America Merrill Lynch- 46,596.5
6.0 6.0
6.26.0
12 124 48,090.22.7 ▲341313* ▲
▼146.117,934.9
14 ▼-9 ▼ 62.2▲-3
2.60.4 ▼88.6
0.7 ▲
▼2.4▲ 56.33.7
0.4-N+1 11 -4.711257 4.111+5 19,160.6Credit Suisse 0
10 74 51,087.7 6.6 6.40.17
17306.2 ▲ ▼ 0.6
0.2 ▼ 0.4▼
19 +13 23,279.0▲ 10 5.0 -11.624,833.5
6.630,924.6▼33 7-56 Citi0.3
165.3
-4.8 ▼ 26 3.0 0.932 96.3-7.7 4.00.6 ▼
0.5 0 - 71.50.5
▼-4 ▼
--21 ▼ 4.4 0.00.2Huatai Securities Co Ltd 78
0.580.2 -7 ▼
20▲
31 ▲▲1.6
3.4 ▲34 0.7
0.525
5.2 2.5▲+12
6.7▲▼-0.6 74.9
124.0▲75,386.4
▲8.6
▲0.6 +73.2 1.5
5 40,910.0 8.7China International Capital Co 10
1240,335.56
Morgan Stanley 5 3 75,865.3 9.7-5438 0.714 41,932.3 ▼▲
1310.5 ▲39
4.14.2 4
3▼2.9 0.6- 8.9▲▲
2.251.1+7 0.5
▲0.60.8 +2 ▲ 148.2 6.29.8
52,804.90.5 1.92745,891.8 3.5
▼45.0▲
14.2 0.5524
-15.0▼ 2Morgan Stanley 11.2 -4.9
11.755,157.31
# ofRank ValueShare Ch.
2015 Rank Sh (%)
41▼
MarketChange in Advisor
▲8.7 3.7206.3
Market MarketMarket Market# of Deals FeesDeals Sh (%)
-9Share Ch.Sh (%)Financial Advisor
0.6▼1US$m
Goldman Sachs & Co 32
MarketFinancial Advisor
1 19 130,300.6US$m
14.9 ▼
Rank Value per Advisor (US$m)Market
Share Ch.
Goldman Sachs & Co16.7China International Capital Co
1
# of Deals# of
12,884.9
33
1
12,779.4Malayan Banking Bhd-
41
2.8
44
9.72.5 46
6.2 ▲
13,286.3
3.6 ▲
14Guosen Securities Co LtdHaitong Securities Co Ltd
0.440
▲+1
Imputed Fees (US$m)
Sh (%)▲
Credit Suisse 3 9 82,041.6
▲116,213.6 -4
80,920.8
48,540.5
Rank Value per Advisor (US$m)2016 Rank
2015 Rank
Rank Value
▲
+290.5
Change in
10.4
-3.5
0.6
67,982.2 8.7
▼-2.4▲
55
0.4
Lakeside Capital Advisers LLC +16.0▲
UBS7CITIC 106 0.4
Any Asia (ex-Japan) Involvement Completed (AF32) Jan 1 - Sept 30
# of Deals per Advisor
12
JP Morgan 4 11
2
▲
▼
Somerley2 2021
-27 Guotai Junan SecuritiesBNP Paribas SA
2.4
26
▲25
0.5
15
▲
0.0The Raine Group LLC 0.1China Dvlp Bank Sec Co Ltd 20 - 2.2
-5Industrial & Comm Bank ChinaJP Morgan▼
+90
CITIC0.4
0.2▲
2.2
-0.5
8.1 ▼-7.9
▲
780 232 7
▼
▲
▲
38,145.7 -6.1
▲
5
8
21 - 16,593.0 2.1 2.1
2.88.0
▲
▲
+526
39
0.0
+15
+3
15
2223
▲
12.5
▲1.8
17
470 194 0
8,440.1
11,263.8
2.7
39
51 0.5
9 560 5 171 2 380 1 100 0Industry Total
Grant Samuel Deutsche Bank
- 5.9 0.7 0.4 ▲0.8 0.5 ▲ 1 0.1 0
Industry Total
▼
14.9
Rank Value per Advisor (US$m)
Industry % Change from Last Quarter▼
▼37.121.3
13.5
▲17
45.6321,890.7
9,775.6
0.30.3
8.6
7.94,666.7
16.213.20 110.72.3
16 2.1
-4.2
Share Ch.
UBSCredit Suisse
▲
Grant Samuel
-8.6▲
0.80.9
US$m
5.2
8.6 1.1
▲
0.321 780.6
650.0
1.41919
36*22 1.1
2
Industry % Change from Last Quarter
0.3
-
0.3
25.3
▲-6.3%
+29
▲▼
0.3
-4
Any Australian Involvement Announced (AD24)
▼▼
+422
-8.3%
Financial Advisor
-1.9%
Sh (%) Share Ch.Market
Rank Value per Advisor (US$m)
100.0
20,278.9
Market
Industry % Change from Same Period Last Year
6
Gresham Partners5
US$m
Credit Suisse 2
2015 Rank
0.1
# of Deals per Advisor
Macquarie Group 1 2
Rank Value
32.1
Change in 2016 Rank
94
12
1
38
3
12▲
Goldman Sachs & Co
3-8.4
4.4▼
5▲1.9▲
72.0
+14.2
0.4 Tudor Pickering & Co LLC-+305
0.4
6
▼
+2 ▲+1 ▲▲
▲▼17.3
Sh (%)135.8
Sh (%)
0.40.6
6
18
0.8
8.7▼
# of Deals per Advisor
-11.7%
5
▲Fees# of Deals
+216.148
19
2015 Rank
# ofMarketRank Value Market
▲49.32Share Ch.Financial Advisor Deals
Market2016 Rank
Change in AdvisorSh (%)
Market
▼Industry % Change from Last Quarter
- ▲2.3▲4.0
▼
Imputed Fees (US$m)
Jan 1 - Sept 30
-16.6%
-5,253100.0
Market
▼-8.2%▼
Any Australian Involvement Completed (AF31)
▼-1.6%Industry % Change from Same Period Last Year
Sh (%)
Jan 1 - Sept 30
-19.8%
349.60.7
0.4
-0.6
0.425
Industry % Change from Same Period Last Year
▲424.3
0.111,165
-27.4%Industry % Change from Last Quarter
Industry Total 63,182.5
16.7%
1,947.2
30.3
3.1 2
0.6
14Deutsche BankCiti
Centerview Partners LLC
Greenhill & Co, LLC
LazardNomura 17
Evercore Partners
13
24Guggenheim Securities LLC
▲
26
280.0
0.823
480.0
100.0
RBC Capital Markets
25.7 ▲4.81.0
4.6%
780,232.7
Market
▼
Deals
UBS
8.9
27.0
9,930.8
157
Flagstaff Partners Pty Ltd
4
JP Morgan 35
2,803.854
Morgan Stanley
2,986.5
9,410.5
10
7,262.0
7
11
Industrial & Comm Bank China 11
59
28*China Renaissance Partners
Bank of America Merrill Lynch8
▲
17,275.3
16,088.917,075.1
4.7
▲▲
31.8
-6.1
▼
11.5
-8.9
▲
15.7
▲▲
0.3
27.320,109.2
14.9
19.5
8.414.8
25.5
121.5
56
-3
+1
4.7
1.5
17
0.53
0.317
4 ▲▼
+1
6
Macquarie Group
JP Morgan
Goldman Sachs & Co
-3
0.5 -2
# of Deals▲
# of
-23.4%
470,194.0
5.4▲
2.2
3.0
▲80.1
3.0
01.0
-
+22.48
1.0
▲
▼
8.6
0.7
1.6
13.9
13.645.2
0.20.8
▲
0.2
▼
1.6▲
▲▲
1.3
▲
0.1
▲
0.61.0
▼
1.0
0.6
0.8
3.0
▲
+1▼▲
1.5▼
22.8 2.7
+125.5
1.6
18.5
0.61.0▲
▲ 6.01.7
12.2
4
▼
7
7
+2
085
61.0
▲ 1▲▼
-2
3 -3
0.9
6.8▲
0.8
-2
0.3+30.4
9.0
1.5
-1
-
0.9
-5
0.5
0.8 0
▼
-
-2
▼
1.00.9
11.8%
0.3
21
910
870.11.2
25* 2.7
7
11
-Morgan Stanley 8
4Gresham PartnersBank of America Merrill Lynch 7 5,065.0
5,056.1
8.85
8
1
10,197.012,540.0
3▲
16.6
4
6
26,909.5-0.614.6
1 29,082.32
0 - 25.2
9,560
17.6
▼▼
4.6
▼-3.0
-3.1
1,706.13.1
▲ 107.9
2.9
4.83,079.6
1,809.913
2,803.8
2.9
▲ 1,239.0
6 -5.9
▲ 16* 1,593.61,593.616* 83
▲
52848.4 1.4
0.2 11-▼
2.12.7
18
▲1.3▲
1.5
1.1
2.7
-0.4
3
▼
0.9
+4
1214
▲
Fort Street Advisers
-3
33
4 -12.6▼ 15-4
14▼1,024.9 ▼▼
Moelis & Co 1.31.41915
16 6 10-0.4 0.3
China Renaissance PartnersIndustrial & Comm Bank China
1.2
870.1832.7
-
-
688.2650.0495.4
10
98*
0.7
▲
▼18
0.813
0.8
0.8
-5.91.11.0
480.0 0.8Blum Capital Partners LPDuff & Phelps
▼-1.7
0.3▲
21*
1219 0.2
-21*20
0.8 0.10.1
1Luminis Partners Pty Ltd1
0.1▼▲
▼
+1
-▲▲
+1
Greenhill & Co, LLC
Evercore Partners23
▲▲
0 20Cameron Partners Ltd
+1
Barclays
Rothschild & Co1 12Lazard 13
+3+4
8
0
1.5
0.1
0.3-0.2
+10.3▲
0.82,709.3
1,689.8
7.4▲ 0.3 ▼-11▲ 0.1 - 2.9
0.7
0.40.51.2
▲
0.9
1.1
0.4▲
▲
▼
▲
▼
0.4
0.51.0
▼
+2
0.7
▲
▲-
0.1
2.6
0.4
-27.0%
▲
0.0
2
3
23
2 0.3▲
+1
12.5
17.2% ▲
4 ▼0.3
▼
▲
-4.9% ▼▼
-
100.0 100.0
-2.8%
-107
+1517.6
0.8 ▲
Industry % Change from Same Period Last Year
Centerview Partners LLC 25* 47 480.0
66
838.6792
▼
4.4
0.8
22.2%
0.3
▼
▲+1 9.9
2.70.1
▲
▲
3.6
5,171 2,380.1
480.0
6
-11.9%-15.2%
-1▲
8.6601.55+2
Blum Capital Partners LP 25*0
Moelis & Co
-
▲24ING
Industry Total
▲
58,962.4
-
100.0
0.40
Industry Total
1,301.4 ▼
▲0.4-6 Citi
1,593.6 2.5-7.0
▲2.5
1.62.1
49
752.8 1.2▼
Investec 0.598*
-60
▼
Visit http://dmi.thomsonreuters.com to view archives and order custom League Tables* tie
https://www.thomsonone.com
16

Deals
4
14
Any New Zealand Inv Announced (AD39)
Financial Advisor2
Craigs Investment Partners Ltd
1 ▲32.1
# of
2*698.7
23.729.5
▼
0
2.5
1
-23.432.0
▲
4-10.6
Goldman Sachs & Co5
10.33.9
14
-Rothschild & Co 940.0
▼
Industry % Change from Same Period Last Year
317.7
-26 5% ▼
5,189.8
Industry % Change from Same Period Last Year
-Deutsche Bank596.4848.4
US$m
86.1
▲2
Rank Value per Advisor (US$m)2016 Rank
4
PricewaterhouseCoopers
Asia (ex-Japan) Buyside Financial Sponsor Activity
2016 Rank
Deutsche Bank
Industry Total
Cameron Partners Ltd
Goldman Sachs & CoFinancial Advisor
3
5*
160
Change in Market# of Deals
-8
Any New Zealand Involvement Completed (AF46)
Market2015 Rank
-79.2%
1
0.6
-19.7%-4.8%
1
4
23.9
2.5
Jan 1 - Sept 30
100.0
4
Deals
# of Deals per Advisor
▼
▲
2.46.6
▲
# of
2015 Rank
Share Ch.▼2.7
# of Deals
▲
Sh (%)Market
First Nine Months 2016 | Mergers & Acquisitions | Financial Advisors
32.0
KPMG
Industry Total
18.1 3.5
Sh (%)Sh (%) Share Ch.
▼
Jan 1 - Sept 30
Rank Value per Advisor (US$m)
MarketAdvisor
10.4
Market
12.3 13.1Fees
3 -1
6.1
16.4 ▲▲
▲16.411.5
▲
4.8
▲
3 +2 4.33.6
+18 7.11
1.10.9
4.0
2.40.2
▲
2*
-10
100.0
+4
+1
100.0
21*
-46.5
2,168.0
-3
113
Industry % Change from Last Quarter
MarketShare Ch.
5 32.0
▲6.7
Sh (%)
-10 3%
84.4
Imputed Fees (US$m)
Asia (ex-Japan) Rankings
▼
32.0
Change in
▲
▲
# of Deals per Advisor
1.3
▼
+1-
▼
-13
8 6%
2.0
2.7
▼
5.80.9 6.8
▼
Rank Value
▲
MarketRank Value
6,780.6
6.1
1,239.5
▲
18.11
Citi
267.1
2,168.0
US$m
▼
Macquarie Group 5* 6 317.7
2,174.0
-
76.4%
5.5
▼▼ 3 2.7 0
Market
5.7
-
Sh (%)
5.7+4▲▲
$3.1$9.6 $3.5 $6.0 $8.9 $6.1
$12.8 $13.8 $19.1$4.0$4.0
$6.6$13.3
$8.2
$17.1
$40.7 $34.6
$6.8$5.1 $3.3
$8.1
$9.8
$6.5
$31.8
$42.3
$14.5
$6.7 $17.3$5.7
$6.2
$10.3
$14.0
$31.8
3.0%
7.8%9.9% 10.5%
8.0%
11.2%
8.0%
14.6%
18.4%
20.1%
0%
5%
10%
15%
20%
25%
$0
$20
$40
$60
$80
$100
$120
$140
2007 2008 2009 2010 2011 2012 2013 2014 2015 2016
% o
f Asi
a (e
x-Ja
pan)
Vol
ume
Ran
k Va
lue
(US
$b)
Q4 Volume (US$b)
Q3 Volume (US$b)
Q2 Volume (US$b)
Q1 Volume (US$b)
% of WW FS Volume YTD
▼-26.5% ▼Industry % Change from Same Period Last Year-51.3%
▲▼-24.4% ▼ -70.3%
-10.3%
* tie
▼ 8.6%Industry % Change from Last Quarter
Any Asian (ex-Japan) Involvement Announced M&A by Target Industry ($bil) Australian Cross Border Announced M&A
17%
15%
15%13%
10%
8%
5%
4%4%
4%3%
Materials High Technology Industrials
Financials Real Estate Energy and Power
Media and Entertainment Healthcare Retail
Consumer Staples Consumer Products and Services Telecommunications
Government and Agencies
0%
20%
40%
60%
80%
100%
$0
$10
$20
$30
$40
2Q10
3Q10
4Q10
1Q11
2Q11
3Q11
4Q11
1Q12
2Q12
3Q12
4Q12
1Q13
2Q13
3Q13
4Q13
1Q14
2Q14
3Q14
4Q14
1Q15
2Q15
3Q15
4Q15
1Q16
2Q16
3Q16
Out
boun
d
Ran
k Va
lue
(US
$b)
Outbound (US$b)
Inbound (US$b)
% of Cross Border is Outbound
2007 2008 2009 2010 2011 2012 2013 2014 2015 2016
Visit http://dmi.thomsonreuters.com to view archives and order custom League Tables https://www.thomsonone.com
17
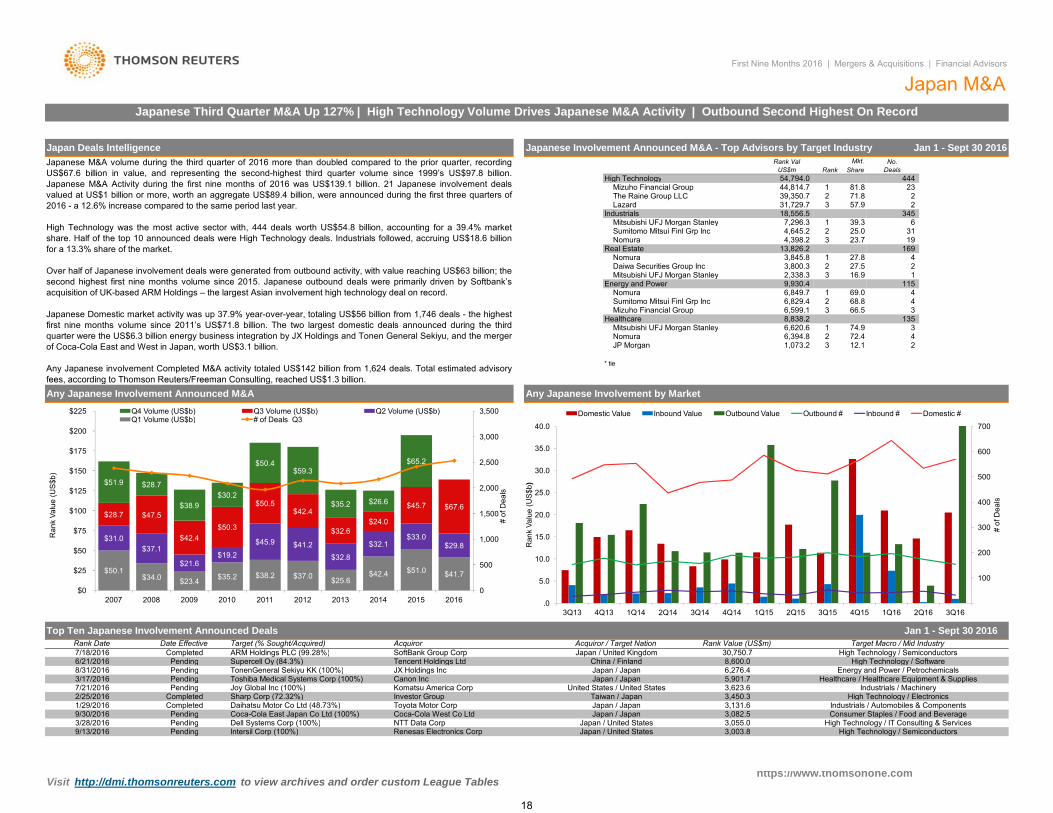
Mitsubishi UFJ Morgan Stanley
* tie
NomuraSumitomo Mitsui Finl Grp IncMizuho Financial Group 66.5 3
26,599.1 3
3115
1
1
6,829.4 68.8
72.4JP Morgan 1,073.2 3
9,930.4
2
4 69.0
13,826.2 Real Estate
3,800.3 3,845.8
2
6,849.7
23.7
345
4
19
27.8
2
444 23
2
6
4 169
Japanese Involvement Announced M&A - Top Advisors by Target Industry Jan 1 - Sept 30 2016Mkt.
The Raine Group LLC
31 25.0
Japan Deals Intelligence
31,729.7 39,350.7
54,794.0 1
Lazard
High TechnologyMizuho Financial Group
Japanese M&A volume during the third quarter of 2016 more than doubled compared to the prior quarter, recordingUS$67.6 billion in value, and representing the second-highest third quarter volume since 1999’s US$97.8 billion.Japanese M&A Activity during the first nine months of 2016 was US$139.1 billion. 21 Japanese involvement dealsvalued at US$1 billion or more, worth an aggregate US$89.4 billion, were announced during the first three quarters of2016 - a 12.6% increase compared to the same period last year.
High Technology was the most active sector with, 444 deals worth US$54.8 billion, accounting for a 39.4% marketshare. Half of the top 10 announced deals were High Technology deals. Industrials followed, accruing US$18.6 billionfor a 13.3% share of the market.
Over half of Japanese involvement deals were generated from outbound activity, with value reaching US$63 billion; thesecond highest first nine months volume since 2015. Japanese outbound deals were primarily driven by Softbank’sacquisition of UK-based ARM Holdings – the largest Asian involvement high technology deal on record.
Japanese Domestic market activity was up 37.9% year-over-year, totaling US$56 billion from 1,746 deals - the highestfirst nine months volume since 2011’s US$71.8 billion. The two largest domestic deals announced during the thirdquarter were the US$6.3 billion energy business integration by JX Holdings and Tonen General Sekiyu, and the mergerof Coca-Cola East and West in Japan, worth US$3.1 billion.
Any Japanese involvement Completed M&A activity totaled US$142 billion from 1,624 deals. Total estimated advisoryfees according to Thomson Reuters/Freeman Consulting reached US$1 3 billion
57.971.8
No. DealsRank
44,814.7 23
Share
Mitsubishi UFJ Morgan StanleyIndustrials
Daiwa Securities Group Inc
Nomura
39.3
16.927.5
HealthcareMitsubishi UFJ Morgan Stanley
4,645.2 3
Nomura
Energy and Power
First Nine Months 2016 | Mergers & Acquisitions | Financial Advisors
Japan M&AJapanese Third Quarter M&A Up 127% | High Technology Volume Drives Japanese M&A Activity | Outbound Second Highest On Record
4,398.2
7,296.3 1
81.8
Rank Val US$m
Sumitomo Mitsui Finl Grp Inc 2
1
2,338.3
18,556.5
Nomura
8,838.2
6,394.8 212.1 2
135 6,620.6 1 74.9 3
4
TonenGeneral Sekiyu KK (100%) Energy and Power / Petrochemicals
High Technology / Semiconductors
Any Japanese Involvement by Market
Toshiba Medical Systems Corp (100%)Joy Global Inc (100%)
ARM Holdings PLC (99.28%) 30,750.7SoftBank Group Corp
JX Holdings Inc
3,623.6Healthcare / Healthcare Equipment & Supplies
Jan 1 - Sept 30 2016
Sharp Corp (72.32%)Komatsu America CorpInvestor Group
6,276.4Japan / Japan
Rank Value (US$m)
Renesas Electronics Corp
Coca-Cola East Japan Co Ltd (100%) 3,082.5
Japan / Japan
3,003.8Japan / United StatesJapan / United States
3,450.3United States / United States
Japan / Japan
Canon Inc
Japan / United KingdomChina / Finland
NTT Data Corp
High Technology / ElectronicsIndustrials / Automobiles & Components
Taiwan / Japan
Coca-Cola West Co Ltd Japan / JapanHigh Technology / IT Consulting & Services
3,131.6
3,055.0High Technology / Semiconductors
Dell Systems Corp (100%)Consumer Staples / Food and Beverage
Industrials / Machinery
Acquiror / Target Nation
High Technology / Software
Pending
Completed
3/28/2016
1/29/20162/25/2016 Completed
PendingPending
9/13/2016
9/30/2016
Date EffectiveTop Ten Japanese Involvement Announced Deals
Supercell Oy (84.3%) Tencent Holdings LtdCompleted
6/21/2016
fees, according to Thomson Reuters/Freeman Consulting, reached US$1.3 billion.
Daihatsu Motor Co Ltd (48.73%) Toyota Motor Corp
Any Japanese Involvement Announced M&A
AcquirorTarget (% Sought/Acquired)Rank Date Target Macro / Mid Industry
5,901.77/21/2016
Pending
PendingPending
3/17/2016
7/18/2016
Pending
8/31/2016
Intersil Corp (100%)
8,600.0
$50.1$34.0 $23.4 $35.2 $38.2 $37.0 $25.6
$42.4 $51.0 $41.7
$31.0$37.1
$21.6$19.2
$45.9 $41.2$32.8
$32.1$33.0
$29.8
$28.7 $47.5
$42.4$50.3
$50.5$42.4
$32.6$24.0
$45.7 $67.6
$51.9 $28.7
$38.9$30.2
$50.4$59.3
$35.2 $26.6
$65.2
0
500
1,000
1,500
2,000
2,500
3,000
3,500
$0
$25
$50
$75
$100
$125
$150
$175
$200
$225
2007 2008 2009 2010 2011 2012 2013 2014 2015 2016
# of
Dea
ls
Ran
k Va
lue
(US
$b)
Q4 Volume (US$b) Q3 Volume (US$b) Q2 Volume (US$b)Q1 Volume (US$b) # of Deals Q3
100
200
300
400
500
600
700
.0
5.0
10.0
15.0
20.0
25.0
30.0
35.0
40.0
3Q13 4Q13 1Q14 2Q14 3Q14 4Q14 1Q15 2Q15 3Q15 4Q15 1Q16 2Q16 3Q16
# of
Dea
ls
Ran
k Va
lue
(US
$b)
Domestic Value Inbound Value Outbound Value Outbound # Inbound # Domestic #
https://www.thomsonone.com Visit http://dmi.thomsonreuters.com to view archives and order custom League Tables
18
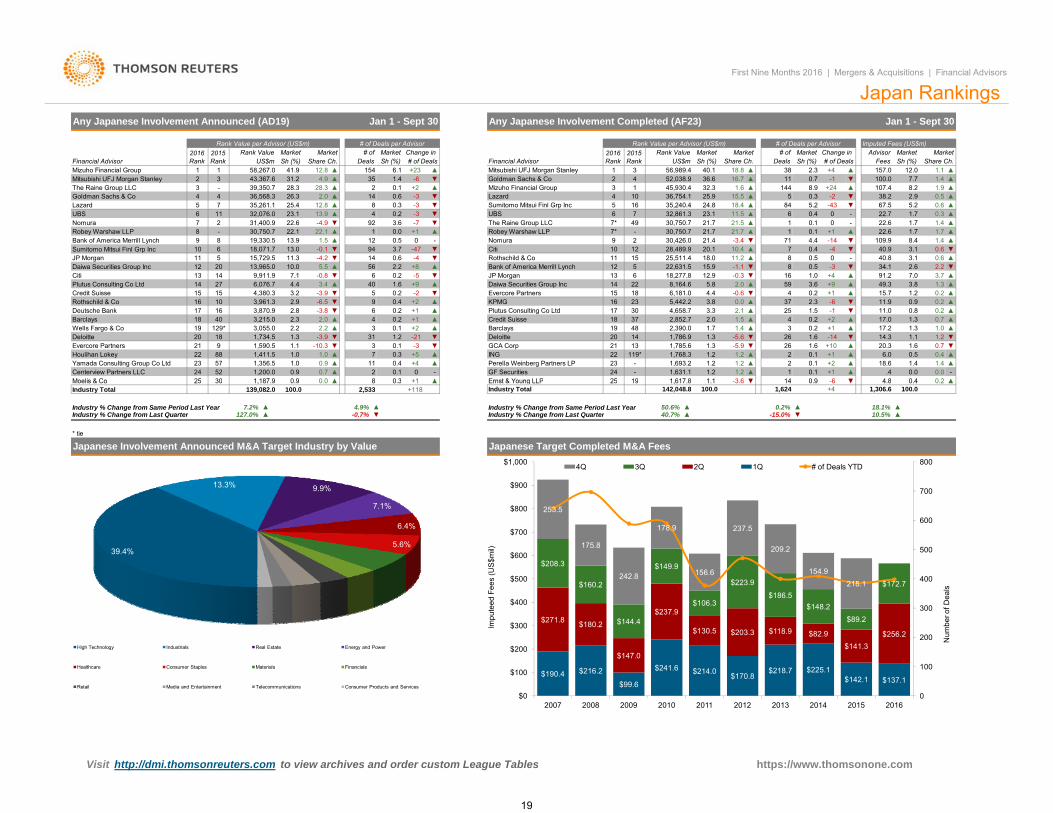
Imputed Fees (US$m)
Financial Advisor
Sumitomo Mitsui Finl Grp Inc
First Nine Months 2016 | Mergers & Acquisitions | Financial Advisors
2016 Rank
Jan 1 - Sept 30
# of Deals# of 2016
Rank
Any Japanese Involvement Announced (AD19)
Rank Value per Advisor (US$m)Market
28.3 2
41.9-6
Deals2015 RankSh (%)
Change in Rank Value per Advisor (US$m)
Sh (%)
# of Deals per Advisor
26.339,350.7
354.9154
▲▲31.2
144
Market2015 Rank
▲
58,267.043,367.6
US$m
36,568.3
Rank ValueSh (%)
▲▲
▲
28.3
1
12.82.0
23.1
12.8
-
10
13
Nomura
Goldman Sachs & Co
UBS 6 11
JP Morgan
7
14
2.9
-
108
4.4
10.0
17
15
831,400.9
3
35,261.132,076.0
12
3,961.316
3
Bank of America Merrill Lynch
14Plutus Consulting Co LtdCitiDaiwa Securities Group Inc
Rothschild & Co
13,965.0
0.2Barclays ▲Deutsche Bank
13.01.5
Citi1213.9 ▲ 094
Financial Advisor Share Ch.
# of Deals per Advisor
Japan Rankings
Share Ch.Market MarketAdvisor
Sh (%)MarketMarketMarket
Fees# of Deals# of
Share Ch.US$mRank Value
DealsMarket Change in
Sh (%)
4 52,038.9 36.656,989.4
100.0▲
0.718.8 ▲40.1+23 ▲
+2 ▲▼
0.1
12
6.1
144▲▲ 8.9
38▼-1▲
+42.3
-43
-
▼
+2
-4
11.0
91.2
-14
-
▲
2.9
40.8
1.7
▼
1.7
1.6
1.7
67.5
40.9
8438.2
▲
▼
-
109.9
22.6
▼ ▲
1.4
8.4
3.1
5.2
0.2
3.1
▲
▼
▲
0.7
3.8
0
+1▲
▲
▲
1.3
▲
0.2
5.2
1.3
0.6
0
49.3
22.7
▼
0.3
3.7-3
1.4 0.2
▲
4
▼25
▲▼
0.21.5
18
1,786.9
0.223▲
2
2.3
0.023
▲1.2
24- ▲ 2
▼
18.6▲
+2
6 4 8
6.0
.40.1 ▲
+11.21.2
0.11
▼2.6▲▲
0 9
0.1 +1
113.7
-
19 48
0 4
▲
17
14
▲1.4
157.0 12.0
▲▲7.7
1.1
107.4 8.2 1.90.5
2.2
1.4
▲
1.7
▲0.6
▲▲
▲
22.6
34.1
▲0.0
15.7 1.2
▲
0.8
1.4
▼▲
-▲
0.70.4
▲
0.5
▼
▼
0.6
0 2
7.0
0.9
1.4
1.0
18.0 11.2 ▲▲
5 8
13.9-4.922.1
20.121.42
▼
+1The Raine Group LLC
0.5
▼10
25,511.428,489.9
150.6 Rothschild & Co-412-47
9,911.96,076.7
7.1
22.130,750.7
27
18,071.719,330.5
20
6
4,380.3
56-0.8 ▼ 6
25.4
3.2
▼22.6
-0.1
Robey Warshaw LLP
145.5
11.315,729.5 -4.211
▲
▼
1
45
36,754.17
Goldman Sachs & CoMizuho Financial Group
1.413
35,240.4 24.8
Credit Suisse
9
2
10
5
Lazard
5
▲
15
Mitsubishi UFJ Morgan Stanley11
Mizuho Financial Group
The Raine Group LLC
7*
▲7*
4
3
15.5 0.3+24
Mitsubishi UFJ Morgan Stanley45,930.4
2
5
16.7
-332.3
-2
1
4911.5
532,861.3
▲25.9
18.416▲0.6
8-3 ▼
Lazard▼Sumitomo Mitsui Finl Grp Inc▼UBS
-30.3
▲▼
43.6 -792
630,750.7
71
0.2
0.01
-3.4- ▲
9
0.421.7 021.5 0.1▲
67 23.1
▼0.1
10.4
-1.18
▼
7 0.44.4
21.7 +121.730,750.7
▼
1
0.5
30,426.0
22,631.50.5
0.2 ▼59
15.912.9
3.6-5
+8 12
+91.0
▲2.00.2
1314
+45.8
6
374
2.15,442.2
▼
-0.38,164.6
16
1.5 ▲
11.9-6.5 0.4 +2
17.06-3.8
-6
3,055.01,734.5
2.818 40 3,215.0 2.3
2.2Deloitte 20 18Wells Fargo & Co 19 129* 0.1
1.33
-5.6+2▲ Barclays
▼ 1.32.2
▼▼ 1.2 -21
0.1 ▼1,785.614 ▼
Evercore PartnersHoulihan Lokey
211.0
▼DeloitteGCA Corp -5.9
-3.93
Yamada Consulting Group Co Ltd 23 57 1,356.5 1.0▲1.0
0.922 88
▲0 0Moelis & Co 25 30 0 9-
1 617 8▲ 19Ernst & Young LLP0 3 3 61 1+1 25 ▼
9 1,590.5 1.1 ▼ING▲1,411.5 +5
-10.3 -3
2,852.7
1.6
4 0.2 +1 2.0
KPMG15 18
▲
Any Japanese Involvement Completed (AF23)
▼
302.0
16 3,870.90.0
▲
-3.9 -0.6
131.2
2626
-1▲
241,693.211 0.4
▲ 0 1,631.1+4
52▲
2.218,277.8
▲
Plutus Consulting Co Ltd▲
0.2Daiwa Securities Group Inc+9 22JP Morgan
▲1.21,768.3
31
0.1▲
22
1,200.0 -0.9
▼▼
37
▲
7 0.3Perella Weinberg Partners LP
1.7
GF Securities
16
119*
2,390.0
3.8
1.2
Credit Suisse3.34,658.7
▲ 3
1 187 920.7Centerview Partners LLC8
17.21.6
+1 ▲
1.6
1.3-14 1.2
+101.314.3
2120
20.31.11.6▲
Evercore Partners
▼
40-2
+19
Jan 1 - Sept 30
6,181.0
Robey Warshaw LLPNomura
4.4
Bank of America Merrill Lynch
3.4 ▲
Industry % Change from Same Period Last Year Industry % Change from Same Period Last YearIndustry % Change from Last Quarter Industry % Change from Last Quarter ▲▼-15.0%
▼-6 4.8
18.1%
Industry Total
Japanese Target Completed M&A Fees
Vi it htt //d i th t t i hi d d t L T bl
0.2%
0.9
10.5%
0.4141,624
▲
▲
100.0
▲
+4
htt // th
1,306.60.2▲
100.0 2,533139,082.00.0
Industry Total +118Moelis & Co 25 30 0.9
* tie
127.0%7.2%
▼
1,617.8▲ 19
50.6%▲
▲▲ 4.9%-0.7%
▲▲40.7%
Ernst & Young LLP0.3 -3.61.1+1 25100.0
▼142,048.8
Japanese Involvement Announced M&A Target Industry by Value
1,187.9 8
39.4%
13.3% 9.9%
7.1%
6.4%
5.6%
High Technology Industrials Real Estate Energy and Power
Healthcare Consumer Staples Materials Financials
Retail Media and Entertainment Telecommunications Consumer Products and Services
$190.4 $216.2
$99.6
$241.6 $214.0 $170.8$218.7 $225.1
$142.1 $137.1
$271.8 $180.2
$147.0
$237.9
$130.5 $203.3 $118.9 $82.9$141.3
$256.2
$208.3
$160.2
$144.4
$149.9
$106.3
$223.9
$186.5$148.2
$89.2
$172.7
253.5
175.8
242.8
178.9
156.6
237.5
209.2
154.9215.1
0.0
0
100
200
300
400
500
600
700
800
$0
$100
$200
$300
$400
$500
$600
$700
$800
$900
$1,000
2007 2008 2009 2010 2011 2012 2013 2014 2015 2016
Num
ber o
f Dea
ls
Impu
teed
Fee
s (U
S$m
il)
4Q 3Q 2Q 1Q # of Deals YTD
Visit http://dmi.thomsonreuters.com to view archives and order custom League Tables https://www.thomsonone.com
19

141.41.4
-27+10
▼▲
BarclaysPrairie Capital Advisors Inc
22*22*
66*31*
14
▼▲▲ 7,605.1
0.60.2
12*66*
5
16*16*19*
1.71.71.4 1.7
National Bank of Canada Fin'lTD Securities Inc
Fairness Opinion Rankings†
48*
66
1.6 -11
10.8.0 0.0
2,709.072,301.3
0.032,020.9 7.7
69.9
44,719.3
First Nine Months 2016 | Mergers & Acquisitions | Financial Advisors
77,737.8 18.82,747.4 0.7
11,534.0 2.83,514.0 0.43822,694.4
▲3,388.0
▼
2.9▲
62,222.1
+10
Guotai Junan Securities
77,943.3
1.5
7,501.8▼
+5
19
22* +1
20*10
22*
+21.0
21 2.11.4
1.4
2.3
▲
1.8 ▲17
3.9
▲
34,791.5
2.2
61,519.1
+103.7
11,080.5
3.6 +27
7
▼
-3
▲
▲37
3.8
3.4 -13
2.1 +92.0
17
181.7
4 28*3 39*
+315
27 33*
36
+1028*
Morgan Stanley4.4
+25 8,101.0
12 239 8* 288 6
10.3Stout Risius Ross Inc
7.3
1.0 ▲9,306.3
0.4
83,977.3Barclays
Stout Risius Ross Inc
4.04.0
Sandler O'Neill Partners
Evercore Partners
Prairie Capital Advisors IncHoulihan Lokey
45,069.432,020.9
2.60.0
7*1011
Morgan Stanley
19.22.1
14Stifel/KBWBarclays0.0
3.2
3.3
-59,912.024,435.0
7.7
14▲3.10
-8
+1
▲
▼+5
7,185.8
69.9▲
1.68*1.7
16
Citi
16*
18
China Securities Co Ltd
Haitong Securities Co Ltd
16*
12*Guosen Securities Co LtdKPMG
10
15Sandler O'Neill Partners
12*
Morgan Stanley
14* ▲
7*
Citi201421
10.0
GF Securities
China Merchants Securities CoHuatai Securities Co Ltd
12*Duff & Phelps
11+1
22
2.8
Houlihan LokeyEvercore Partners 6
7.9 7*32 3.2
34
69.9▲
▼▲
China International Capital Co 333 ▼-146
▼
4.6
14 -134.04.3 +715
-216
2 2 30 8.6
17
2,747.4-4 ▼
▼11,534.0
0.68.9 -4 ▼
3 8 18 5.2 +5
17.7
Sandler O'Neill Partners
# of Market Change in
1 1# of Deals
-7.9
Market
JP Morgan
Rank Value
77,737.831US$mSh (%) Deals Sh (%)US$m
86,041.9 11.0
Rank Value
JP Morgan21 3 40
Fairness Opinion Provider2015 Rank
4.0Duff & Phelps
Deals0
-85 5
4.94 4
2015 Rank
-2+5
2,491.1690.3
+3
5*▼
▲▼
19.19,142.6 2.2
▲+812 -5
3.57Raymond James Financial Inc
119*
5.3
▲
4.20.7▼
-5 17.5
▼78,960.1
▲6.3-8
18
15
17
-2▲
4.2
▼
▼+510
24*1312
4
5*+7
-5
3
155.3
14-14
4.94.6
# of Deals2016 Rank
2015 Rank
1 210.2
-212
7
▼
6.0+5
▼Sh (%)
Goldman Sachs & Co
3
89*10*
BMO Capital Markets22*
Prairie Capital Advisors IncStifel/KBWRaymond James Financial Inc
Houlihan Lokey 18*18* 520*20*
16
5*5*
▲
1210
Rank Value (US$m)
Worldwide Announced Fairness Opinion
Rank Value (US$m)MarketRank Value
# of Deals per Advisor# of Deals per AdvisorBased on Number of Transactions
Change in # of Market2016 Rank
Market2016 Rank
Jan 1 – Sept 30 Jan 1 – Sept 30Any Americas Involvement Announced Fairness Opinion
Change in Sh (%) Sh (%)
Jan 1 – Sept 30Any US Involvement Announced Fairness Opinion
Rank Value (US$m)Based on Number of TransactionsBased on Number of Transactions
# of Deals per Advisor
39
DealsMarket
29JP MorganFairness Opinion Provider
Duff & Phelps
# of Deals# of
CITIC
Fairness Opinion Provider US$m Sh (%)
Gram Capital
11
8
10.931
4
Shenwan Hongyuan Securities CoStout Risius Ross Inc
1
15*
12
0.6Bank of America Merrill Lynch
1080.9
7Goldman Sachs & Co13
615*
0.60.3
16.515.2
2.92.3
3.411
+5-5
+5-5
+3▼
.02,709.01,208.2
72,301.366,609.9
▲▼▲
▲ 10,902.3
14*14*16*0.0
0.32,039.1
4,373.011,534.0
Jefferies LLC14
776
2.02.01.7Credit Suisse
9▼
55,792.423,930.251,980.5
+1-5
Evercore PartnersSouthwest Securities Co Ltd
28*4
1515
1.51.5
-19+5
▼▲ 14,697.4
4.11.9
83,977.3.0
10.70.00.5
Bank of America Merrill LynchJefferies LLCPiper Jaffray CosCredit SuisseQatalyst Partners
32,020.9
-1
12.75.5
11.9
PJT Partners LP
1213141516*16*16*16*
Citi16*16*91216*16*24*24*
98765555
3.22.82.52.11.81.81.81.8
+4+3-4-100
+1+1
▲▲▼▼--▲▲
1,184.666,609.923,930.2
2,491.1973.1
50,979.326,485.3
9,576.6
0.316.1
5.80.60.2
12.36.42.3
Great Wall Securities Co Ltd 24* 39* 13 1.3 +5 ▲ 3,615.2
UBSPiper Jaffray CosRBC Capital MarketsGuggenheim Securities LLCQatalyst Partners
19*19*19*19*19*
555
35*22*35*35*28*
1.41.41.41.41.4
55
+20
+2+2+1
48,341.520,541.726,485.3
▲-▲▲▲
2.20.2
11.04.76.0
9,566.5973.1
Guggenheim Securities LLCWells Fargo & CoUBSCenterview Partners LLCBMO Capital Markets
16*21*21*21*21*
29*35*29*16*35*
54444
1.81.41.41.41.4
+2+2+1-1
+2
▲▲▲▼▲
5,882.69,566.5
30,701.553,039.0
5.01.42.37.4
12.8
20,541.7
Industry TotalIndustry Total
Industry % Change from Same Period Last Year ▼ ▼Industry % Change from Last Quarter ▲ ▲
Somerley 20*
13*
19
Great Wall Securities Co Ltd
▲▼
10,427.25,688.9
5.12.8
33
2.92.9
+2-7
SEBBank of America Merrill Lynch
7*7*
26*3*
1.2
- 4,523.7
▼
8 1.2 0
▲
-19
1.5
†Fairness Opinion rankings include fairness opinions provided as a standalone mandate as well as fairness opinions provided as part of a broader advisory mandate.
9,141.0 2.9+5
1.0
Nuada Ltd 20* - 8
13* 12
9 ▲
▼
284
0.0
+2 ▲ 36,484.8
▲
-
▲▼
68.8%
.0
+5
▼
6
+104.328
▲
+18
2.37,185.8▲
17*
310,116.5
+254
1.81.8 ▲
▲
33
401.1
39 +106.0+3138
+8
# ofDeals
▲
Change in Market
+2
11,080.5
5.7
1.4
2.40.7
4
7
11
4.7%▲
+48
7,855.3 2.5
5.5 ▼
0.11.2+3
2.67.93.6
7,501.8▲ 2,039.1
24,435.0▲8,101.0
Industry % Change from Last Quarter 19.5% ▲ 14.3%
Industry Total 100.0
▲
652
Industry % Change from Same Period Last Year 7.9%
Guotai Junan Securities
13*13*
3 16
1227*
19.8
1.1
2.5
3.211* 3.48 219 17
▲ 61,519.136
20.162,222.1▲
-13 11.27.3
Industry % Change from Last Quarter -16.2% ▼ 192.2%Industry % Change from Same Period Last Year
Industry Total
▼
204,341.8
-25.0%
100.0-35105
-34.8% ▼
Citi 17* 21*JP Morgan
New Times Securities Co Ltd 17* 2,969.23,637.03,611.6
+148*
▲
13
1.2
13 2.0+62.0
▲ 1.2+10
3* 13*
513*
56
4Huatai Securities Co Ltd
2016 Rank
13*
Jan 1 – Sept 30Any EMEA Inv Announced Fairness Opinion
Market
25.7 +4
15.22
Market2015 Rank
Change in Deals
16Sh (%) # of Deals
▲6
Industry % Change from Same Period Last Year
# of Deals
100.0
Industry % Change from Same Period Last Year
349
▼
-34
-26.1%-13.7%
Industry Total 413,421.3
Rank Value (US$m)
3,615.22,230.6
438,236.9100.0-41
-12.6%
Market
Jan 1 – Sept 30
▲▲ 0.7
Industry % Change from Last Quarter ▼-46.1%-3.4%
17.9
Sh (%)
6.3
5.115*
2015 Rank
117*
21*
4.8
53,904.52
-2
CITIC21*
1.9
-123
Based on Number of Transactions
2016 Rank
-8.9%-36.4%
2.8% 53.9%
Shenwan Hongyuan Securities Co
6
2.6
22
32GF Securities
910
* tie
13* 13 2.0 +2▲
Sinolink Securities Co Ltd13 2.0Changjiang Securities Co Ltd
Fairness Opinion ProviderKPMGMorgan Stanley
JP Morgan
1
China International Capital Co
China Merchants Securities Co10,459.1▼
▲4.8
+112,880.6
5
Gram Capital
-361,010
# of
Based on Number of Transactions
Fairness Opinion ProviderUS$m
13*
# of Deals per Advisor
2
# of Deals per Advisor
Duff & Phelps
1
Guosen Securities Co LtdHaitong Securities Co Ltd
Rank Value
Any Asia Pacific Inv Announced Fairness Opinion
Barclays 5*5*
Dongxing Securities
Rank Value (US$m)
3.84.95.1
+11
-27
55*
3.82.9
▼-46.2%
3,514.0
Rank ValueUS$m
5.8
34,791.5▲37 +27
Industry % Change from Last Quarter
▼ 14,697.4Southwest Securities Co Ltd 12
China Securities Co Ltd
4.715 2.3
▲
0
22,694.4
Sh (%)Sh (%)
▼ 47.7%
1,010.0 100.0
7*7*7*
CITICHoulihan LokeyRothschild & CoN+1
-13*5
26*
4333
1,424.949,834.5
2.92.9
+4+1-5
+2
2.31.00.7
24.4
▲▲▼▲
4,733.42,046.0
Dongxing SecuritiesSinolink Securities Co LtdChangjiang Securities Co Ltd
24*24*24*
101*25*80*
131313
1.31.31.3
+6+11+2
▲▲▲
,2,230.63,611.63,637.0
0.30.50.5
yCanaccord GenuityPJT Partners LP
66*28*
19* 519* 5
1.41.4
▲▲
+4,681.8
+1 9,576.60.22.2
pLazardHovde Group LLCChartwell Financial Advisory
21*21*21*
13*16*
-
444
1.41.41.4
-2-1
+4 .0
▼,
51,626.4106.5
555.2
12.5▼▲
0.2
0.00.0
Kaiyuan Securities Co Ltd 20* - 8 1.2 +8 ▲
https://www.thomsonone.com Visit http://dmi.thomsonreuters.com to view archives and order custom League Tables
20
-
-
-
-
- Financial and legal advisors receive full credit for each deal on which they provide financial or legal advisory services, unless they represent minority sellers or advise on only a portionof the transaction or Thomson Reuters has not been made aware of their participation in that transaction. For pending transactions, advisors to targets of multiple bids receive credit forthe transaction agreed to or, in the absence of an agreement, the value of the highest offer.
EMEA
Tel: +44 (0) 20 7542 2246
E-mail: [email protected]
Ewelina JareckaDeals with undisclosed dollar values are rank eligible but with no corresponding Rank Value. Non-US dollar denominated transactions are converted to the US dollar equivalent at thetime of announcement of terms.
First Nine Months 2016 | Mergers & Acquisitions | Financial Advisors
Ranking Criteria Summary
If you would like to participate in the submissionprocess, receive quarterly press releases, or havequestions about league table criteria pleasecontact:
League tables include rank eligible mergers, acquisitions, repurchases, spin-offs, self-tenders, minority stake purchases and debt restructurings.
A tender/merger transaction is considered to be effective at the time of consummation of the merger or the date on which it is declared wholly unconditional.E-mail: [email protected]
AmericasRobert LevineTel: +1 646 223 5682
Announced league tables include all deals that were announced between January 1, 2015 and September 30, 2016 and of which Thomson Reuters was made aware. All current dataand previous year's data is as of 5:00pm EDT on September 30, 2016.
Tel: +813 6441 1338
E-mail: [email protected]
Asia-Pacific & JapanKaori Motohashi
-
-
-
-
League tables, commentary, and charts citing announced activity are based on Rank Date and include intended, pending, partially complete, completed, pending regulatory, andunconditional transactions. Rank Date is defined as the earliest public announcement of when a value can be applied to a transaction.
League table volumes for Mitsubishi UFJ Financial Group and Morgan Stanley, included herein reflect the changes after the commencement of their jointly established securities firmsin Japan: (1) Mitsubishi UFJ Morgan Stanley Securities and (2) Morgan Stanley MUFG Securities. Accreditation for transactions involving the newly established joint ventures arereflected in totals for Morgan Stanley. For Japanese related rankings, Morgan Stanley is represented as "Mitsubishi UFJ Morgan Stanley”.
Any Involvement league tables include deals where the target, acquiror, or either ultimate parent are domiciled (nation of headquarters) in the specified region or nation. Anyinvolvement league tables also include the nation of the seller and seller ultimate parent on privately negotiated stake purchases
Imputed fees are calculated using Freeman & Co. proprietary algorithm where spreads or fees are not disclosed. Deal fees are on a gross basis before all expenses. Each underwriteror advisor is allocated its share of deal fees using Freeman & Co. allocation methodology, based on the number of underwriters or advisors on the deal and their role. No fees areallocated to syndicated members.
While Thomson Reuters has used reasonable endeavors to ensure that the information provided in this document is accurate and up to date as at the time of issue, neither Thomson Reuters nor its third party content providers shall be liable forany errors, inaccuracies or delays in the information, nor for any actions taken in reliance thereon, nor does it endorse any views or opinions of any third party content provider. Thomson Reuters disclaims all warranties, express or implied, as tothe accuracy or completeness of any of the content provided, or as to the fitness of the content for any purpose to the extent permitted by law. The content herein is not appropriate for the purposes of making a decision to carry out a transactionor trade and does not provide any form of advice (investment, tax, legal) amounting to investment advice, nor make any recommendations or solicitations regarding particular financial instruments, investments or products, including the buying orselling of securities. Thomson Reuters has not undertaken any liability or obligation relating to the purchase or sale of securities for or by any person in connection with this document.
© 2016 Thomson Reuters. All rights reserved.
Thomson Reuters and the Thomson Reuters logo are registered trademarks and trademarks of Thomson Reuters and its affiliated companies. Any third party name or mark herein belongs to the relevant third party.
https://www.thomsonone.com
21
Thomson Reuters Solutions for the Deal Making Community
FOR STRATEGY AND PLANNING TEAMSFOR INFORMATION PROFESSIONALSSDC Platinum is the world’s foremost financial transactions database, covering new issues, M&A, syndicated loans, private equity, project finance, poison pills, and more.
Solution for:• Market Analysis & Trends (Geography, Sector, Asset Class, Deal Type, Deal Size, etc.)• Deal Origination (Debt Maturity Analysis, Company Lifecycle including Private Equity)• Pitch Creation (Firm Credentials, Representative Acquirors)• M&A Targeting (Active Strategic/Sponsor Acquirors, Target Company Screener)• Negotiation (T&C Benchmarking)
Thomson Reuters Deals Business Intelligence enables you to slice and dice our renowned Deals and Fees data to create ad hoc reports, analyze market trends, benchmark your performance and identify opportunities – all within a tool built into your workflow in Excel®, saving you valuable time and giving you a competitive edge.
Solution for:• Conducting market analysis and identifying trends• Benchmarking your performance and monitoring competitors• Targeting clients by wallet size and banking relationship• Allocating resources more effectively by evaluating and analyzing lost deals
FOR INVESTMENT BANKERS
©2016 Thomson Reuters
evaluating and analyzing lost deals
Send us a sales enquiry at: financial.thomsonreuters.com/salesRead more about our products at: financial.thomsonreuters.com/products
To purchase individual Thomson reuters Deals or League Table reports, please contact our Thomson Reuters On Demand group:
Email: [email protected]
Access unique analysis for free anytime using Thomson Reuters Deals Intelligence website and receive regular updates, delivered direct to your inbox.
Go to: dmi.thomsonreuters.com/dealsintelligence
Thomson Reuters Eikon is the most intuitive and comprehensive way of staying informed. With natural-language search, you can quickly find global information,news, charts and analytics. Company and industry views provide top-level summaries, and then detailed information is just a click away. Identify new opportunities and gain deep understanding of markets, industries, companies and events.
Thomson Reuters Eikon also includes an Add-In for Microsoft® Office to help you increase your efficiency. From screening and targeting to comparables analysis, building league tables, valuing a company
and developing a client pitch book, you can do all this without leaving Microsoft Office. Search and autosuggest features in Excel make model-building easier.
Solution for:• Managing Client Relationships• Deal Origination• New Issues Pre-Marketing/Roadshows• Financial Modeling• Customized League Tables• Simple Deals screening• Valuation analysis and comparabledeal screening• On-brand pitch book creation
©2016 Thomson ReutersThomson Reuters and the Kinesis logo are trademarks of Thomson Reuters.
22