first quarter 2016 results - ab-inbev.com · • elevating the core: carnival and lollapalooza...
TRANSCRIPT
First Quarter 2016 Results4 May 2016
© AB InBev 2016 – All rights reserved 1

Certain statements contained in this report that are not statements of historical fact constitute forward-looking statements, notwithstanding that such statements are notspecifically identified. In addition, certain statements may be contained in the future filings of the Company with the competent securities regulators or other authorities, in pressreleases, and in oral and written statements made by or with the approval of the Company that are not statements of historical fact and constitute forward-looking statements.
Forward-looking statements are not guarantees of future performance. Rather, they are based on current views and assumptions and involve known and unknown risks,uncertainties and other factors, many of which are outside the Company’s control and are difficult to predict, that may cause actual results or developments to differ materiallyfrom any future results or developments expressed or implied by the forward-looking statements. Factors that could cause actual results to differ materially from thosecontemplated by the forward-looking statements include, among others: (i) local, regional, national and international economic conditions, including the risks of a globalrecession or a recession in one or more of the Company’s key markets, and the impact they may have on the Company and its customers and its assessment of that impact; (ii)financial risks, such as interest rate risk, foreign exchange rate risk (in particular as against the U.S. dollar, the Company’s reporting currency), commodity risk, asset price risk,equity market risk, counterparty risk, sovereign risk, liquidity risk, inflation or deflation; (iii) continued geopolitical instability, which may result in, among other things, economicand political sanctions and currency exchange rate volatility, and which may have a substantial impact on the economies of one or more of the Company’s key markets; (iv)changes in government policies and currency controls; (v) continued availability of financing and the Company’s ability to achieve its targeted coverage and debt levels andterms, including the risk of constraints on financing in the event of a credit rating downgrade; (vi) the monetary and interest rate policies of central banks; (vii) changes inapplicable laws, regulations and taxes in jurisdictions in which the Company operates; (viii) limitations on the Company’s ability to contain costs and expenses; (ix) the Company’sexpectations with respect to expansion plans, premium growth, accretion to reported earnings, working capital improvements and investment income or cash flow projections;(x) the Company’s ability to continue to introduce competitive new products and services on a timely, cost-effective basis; (xi) the effects of competition and consolidation in themarkets in which the Company operates; (xii) changes in consumer spending; (xiii) changes in pricing environments; (xiv) volatility in the prices of raw materials, commodities andenergy; (xv) difficulties in maintaining relationships with employees; (xvi) regional or general changes in asset valuations; (xvii) greater than expected costs (including taxes) andexpenses; (xviii) the risk of unexpected consequences resulting from acquisitions, joint ventures, strategic alliances, corporate reorganizations or divestiture plans, and theCompany’s ability to successfully and cost-effectively implement these transactions and integrate the operations of businesses or other assets it has acquired; (xix) the outcomeof pending and future litigation, investigations and governmental proceedings; (xx) natural and other disasters; (xxi) any inability to economically hedge certain risks; (xxii)inadequate impairment provisions and loss reserves; (xxiii) technological changes and threats to cybersecurity; and (xxiv) the Company’s success in managing the risks involved inthe foregoing. All subsequent written and oral forward-looking statements concerning the proposed transaction or other matters and attributable to the Company or any personacting on its behalf are expressly qualified in their entirety by the cautionary statements referenced above. Forward-looking statements speak only as of the date on which suchstatements are made.
In addition, the forward-looking statements contained in this report also include statements relating to the Company’s recommended acquisition of the entire issued and to beissued share capital of SABMiller plc (“SABMiller”) (the “Transaction”), the related divestitures and the financing of the Transaction, including the expected effects of theTransaction on the Company and/or SABMiller and the expected timing of the Transaction. All statements regarding the Transaction, the related divestitures and the financing ofthe Transaction, other than statements of historical facts, are forward-looking statements. You should not place undue reliance on these forward-looking statements, whichreflect the current views of the Company’s management, and are subject to numerous risks and uncertainties about the Company and SABMiller and are dependent on manyfactors, some of which are outside of the Company’s and their control. There are important factors, risks and uncertainties that could cause actual outcomes and results to bematerially different, including the satisfaction of the pre-conditions and the conditions to the transactions described herein, the ability to obtain the regulatory approvals relatedto the transactions and the ability to satisfy any conditions required to obtain such approvals, and the factors relating to the Company described above. Other unknown orunpredictable factors could cause actual results to differ materially from those in the forward-looking statements. There can be no certainty that the proposed transactions willbe completed on the terms described herein or at all.
The Company’s statements regarding financial risks are subject to uncertainty. For example, certain market and financial risk disclosures are dependent on choices about keymodel characteristics and assumptions and are subject to various limitations. By their nature, certain of the market or financial risk disclosures are only estimates and, as aresult, actual future gains and losses could differ materially from those that have been estimated. Subject to the Company’s obligations under Belgian and U.S. law in relation todisclosure and ongoing information, the Company undertakes no obligation to update publicly or revise any forward-looking statements, whether as a result of new information,future events or otherwise.
This document shall not constitute an offer to sell or the solicitation of an offer to buy any securities, nor shall there be any offer, solicitation or sale of securities in anyjurisdiction in which such offer, solicitation or sale would be unlawful prior to the registration or qualification under the securities laws of such jurisdiction. By attending themeeting where this presentation is made, or by reading the presentation slides, you agree to be bound by the above limitations.
Forward looking statements
© AB InBev 2016 – All rights reserved 2
© AB InBev 2016 – All rights reserved
1Q16 highlights
• Mexico: Strong volume performance
• US & Europe: Improving volume trends
• Brazil: Macroeconomic challenges
• China: Industry softness
• SABMiller: Continued progress towards closing
3

© AB InBev 2016 – All rights reserved
Proposed combination with SABMiller
• In November last year, we announced an agreement with SABMiller’s board on the terms of
a recommended acquisition of the entire issued and to be issued share capital of SABMiller
• At the same time, we announced an agreement with Molson Coors Brewing Company
regarding a complete divestiture of SABMiller’s interest in MillerCoors in the US, as well as
the global Miller brand
• In China, we have entered into an agreement to sell SABMiller’s interest in China Resources
Snow Breweries to China Resources Beer (Holdings) Co. Ltd
• In Europe, we have accepted a binding offer from Asahi to acquire certain of SABMiller’s
European premium brands and their related businesses. We have also agreed to divest
SABMiller’s Central and Eastern European businesses and brands
• In South Africa, we have announced an agreement with the government on
the public interest conditions that will be recommended to the Competition Commission and
Competition Tribunal
• Secondary listing of AB InBev on the Johannesburg Stock Exchange
• Substantially completed the pre-funding of the proposed transaction following a
series of bond issuances in the first quarter of 2016
• We continue to expect the transaction to close in the second half of 2016
4

1Q16 summary
• Total Revenue +3.1%
• Revenue per hl +5.2% on a constant geographic basis
• Total Volumes -1.7%
• Own beer -1.4% and non-beer -5.7%
• Brazil own beer -10.0%
• Global brands revenue +5.9%
• Corona up over 22%
• Budweiser up 0.6%
• Stella Artois down ~2%
• EBITDA +2.5%
• EBITDA margin -20 bps to 36.8%
• Normalized EPS of $0.51 versus $1.40 in 1Q15
5© AB InBev 2016 – All rights reserved

© AB InBev 2016 – All rights reserved
Positive trends in our business
6
• Global brands: Revenue growth and premiumization trends
• Mexico: Strong growth and exciting future prospects
• US: Industry volumes growing, good momentum in our Above
Premium brands, and improving Bud Light volume trends
• Brazil: Healthy brand preference and growth in premium
• China: Market share gains and favorable brand mix
• Europe: Revenue growth and share gains in several markets
• Canada, South Korea, Latin America South: Solid results

Industry
• STRs +0.7% SDA (selling-day adjusted)
AB InBev
• STRs -0.3% SDA
• Market share decline of ~45 bps
• STWs (shipments) -1.2%
• Revenue flat
• Beer revenue per hectoliter +1.3%
• EBITDA +2.1% with margin expansion of 82 bps to 40.3%
US – 1Q16 summary
7© AB InBev 2016 - All rights reserved Note: Share figures based on internal estimates (STRs)

© AB InBev 2015 – All rights reserved 88
Bud Light – On the right track
8© AB InBev 2015 – All rights reserved
• Volume, market share &
brand trends improving
• STRs declined just over 1%,
with market share loss of
~35bps
• Consumers responding
positively to new “Bud Light
Party” campaign and new
visual brand identity
© AB InBev 2016 – All rights reserved Note: Share figures based on internal estimates (STRs)
© AB InBev 2016 – All rights reserved
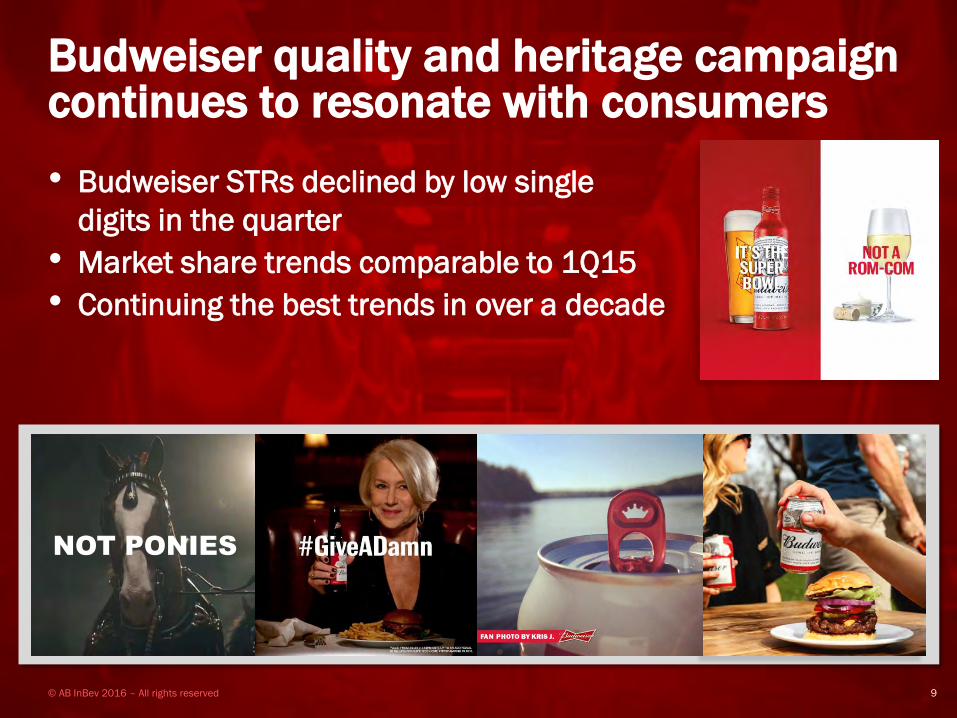
Budweiser quality and heritage campaign continues to resonate with consumers
9
• Budweiser STRs declined by low single
digits in the quarter
• Market share trends comparable to 1Q15
• Continuing the best trends in over a decade
NOT PONIES

© AB InBev 2015 – All rights reserved 10
Healthy growth in Above Premium
10© AB InBev 2016 – All rights reserved
• Above Premium brands gained 50 bps of market share
• Michelob ULTRA volume grew over 20% and gained more share
than any other beer brand in the past year
• Good growth from Stella Artois, Goose Island & our craft partners
• Best Damn performing well
Note: Share based on internal estimates (STRs)
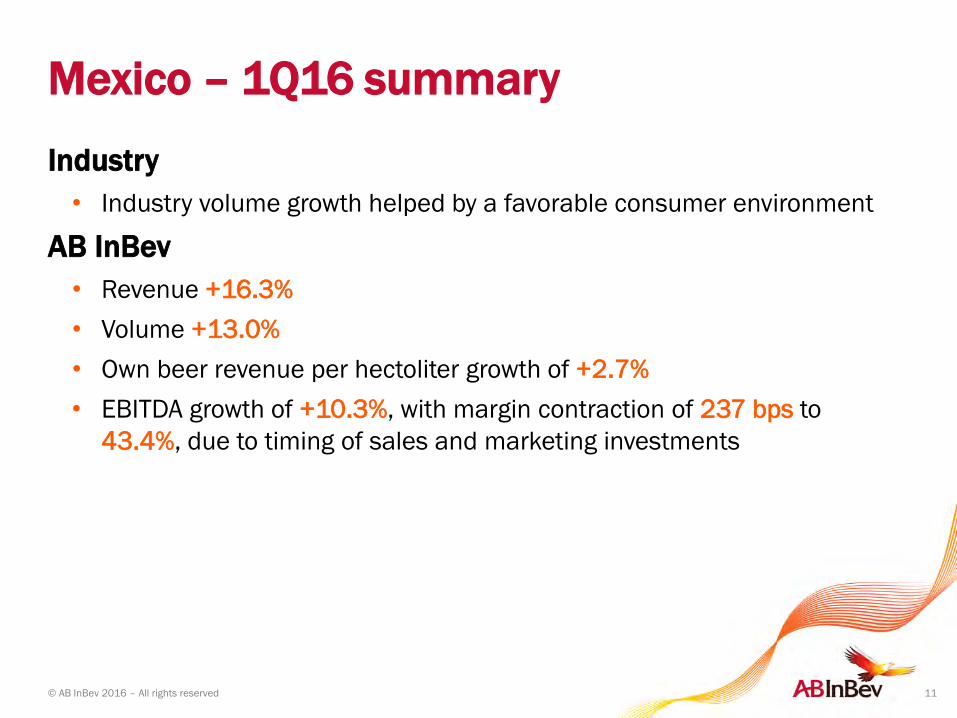
Mexico – 1Q16 summary
11
Industry
• Industry volume growth helped by a favorable consumer environment
AB InBev
• Revenue +16.3%
• Volume +13.0%
• Own beer revenue per hectoliter growth of +2.7%
• EBITDA growth of +10.3%, with margin contraction of 237 bps to
43.4%, due to timing of sales and marketing investments
© AB InBev 2016 – All rights reserved
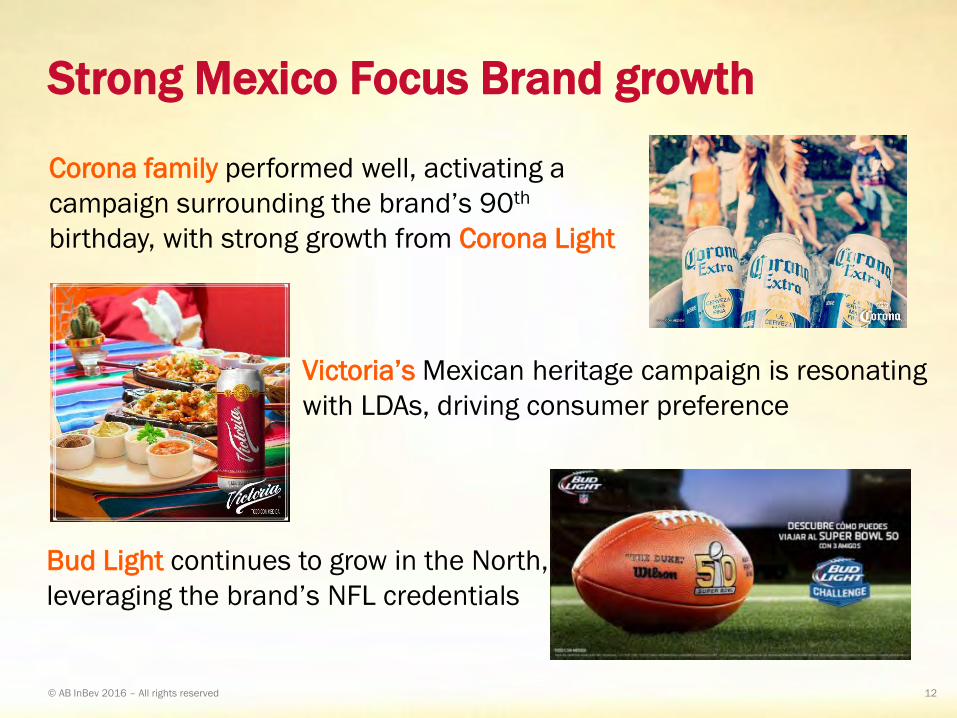
Strong Mexico Focus Brand growth
12© AB InBev 2016 – All rights reserved
Corona family performed well, activating a
campaign surrounding the brand’s 90th
birthday, with strong growth from Corona Light
Victoria’s Mexican heritage campaign is resonating
with LDAs, driving consumer preference
Bud Light continues to grow in the North,
leveraging the brand’s NFL credentials
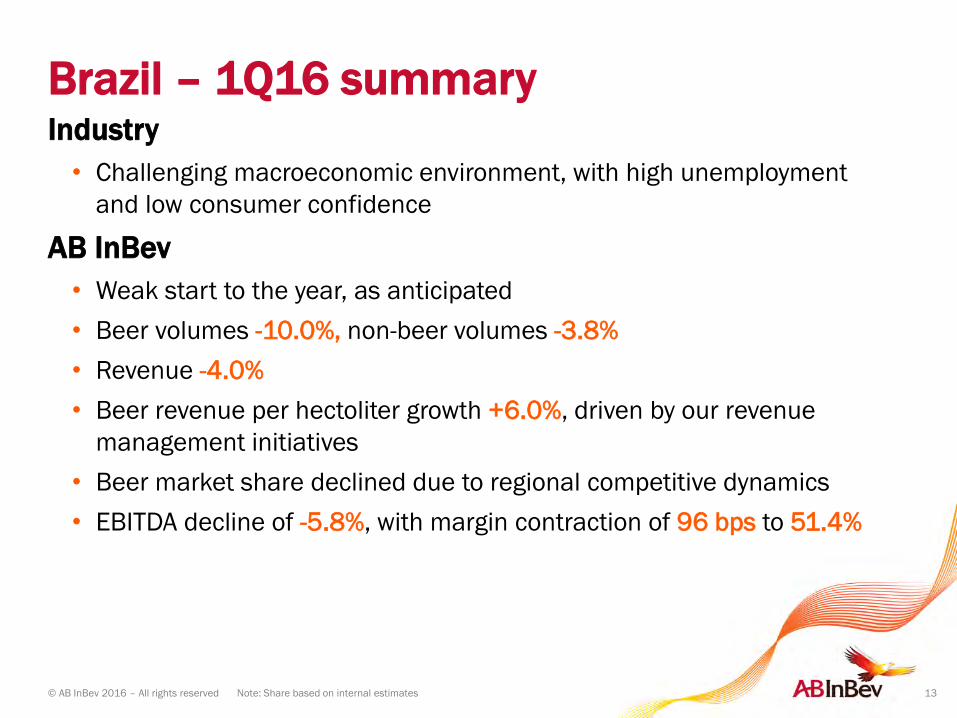
Brazil – 1Q16 summary
13© AB InBev 2016 – All rights reserved Note: Share based on internal estimates
Industry
• Challenging macroeconomic environment, with high unemployment
and low consumer confidence
AB InBev
• Weak start to the year, as anticipated
• Beer volumes -10.0%, non-beer volumes -3.8%
• Revenue -4.0%
• Beer revenue per hectoliter growth +6.0%, driven by our revenue
management initiatives
• Beer market share declined due to regional competitive dynamics
• EBITDA decline of -5.8%, with margin contraction of 96 bps to 51.4%
© AB InBev 2016 – All rights reserved
Brazil - Clear commercial priorities
Focused on what we can impact and influence
• Elevating the Core: Carnival and Lollapalooza music festival activation
driving consumer preference for Skol among target audience (LDA-24)
• Accelerating Premium: Volumes grew double digits versus 1Q15
• Near Beer: Skol Beats Family accelerating volume and share growth.
Brahma 0,0% has a strong market share position in the non-alcohol
beer market
• Shaping In Home: Increasing penetration of returnable bottles to
support our affordability strategy
• Boosting Out of Home: Activation of key selling moments: Olympic
Games, festivals and regional parties
14

© AB InBev 2016 – All rights reserved
Premium and Near Beer represent over 10% of our total Brazil portfolio
15
2010 2011 2012 2013 2014 2015 2016 YTD
Premium & Near Beer Share of AB InBev Brazil Beer Volume
~5%
10%+

• Macroeconomic headwinds, pressure on consumer
disposable income
• Focused on what we can impact and influence
• Strong and healthy brands
• Clear set of commercial priorities
• Affordability remains a major focus
• Revenue management & cost efficiency to help drive results
• April volumes trending significantly better than 1Q16
© AB InBev 2016 – All rights reserved
Brazil - No change to FY16 topline growth guidance of mid to high single digits
16
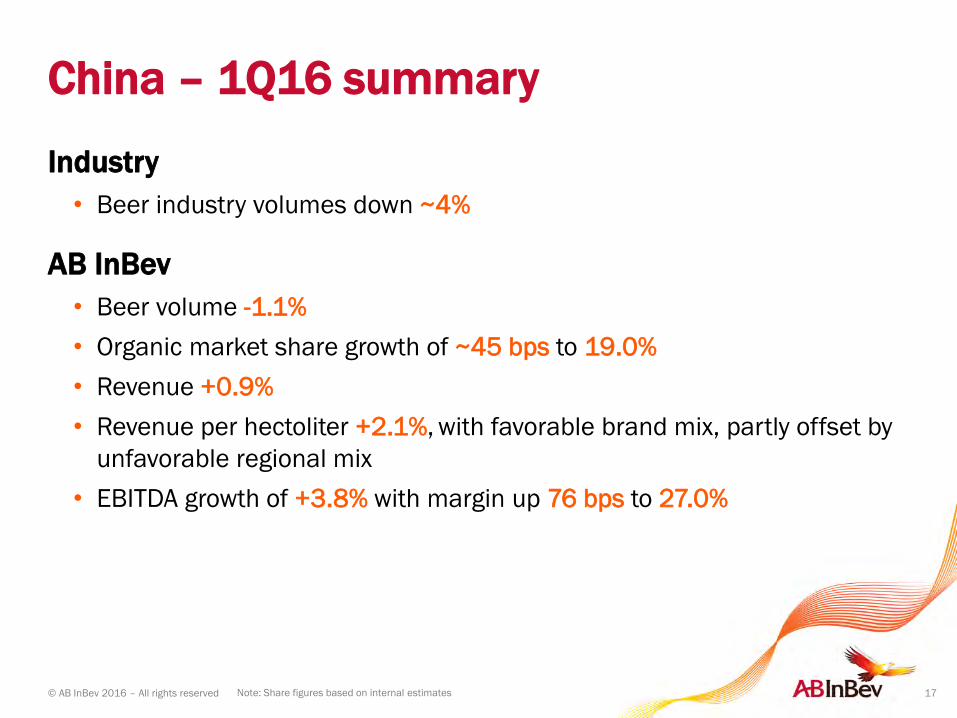
Industry
• Beer industry volumes down ~4%
AB InBev
• Beer volume -1.1%
• Organic market share growth of ~45 bps to 19.0%
• Revenue +0.9%
• Revenue per hectoliter +2.1%, with favorable brand mix, partly offset by
unfavorable regional mix
• EBITDA growth of +3.8% with margin up 76 bps to 27.0%
China – 1Q16 summary
17© AB InBev 2016 – All rights reserved Note: Share figures based on internal estimates
© AB InBev 2016 – All rights reserved
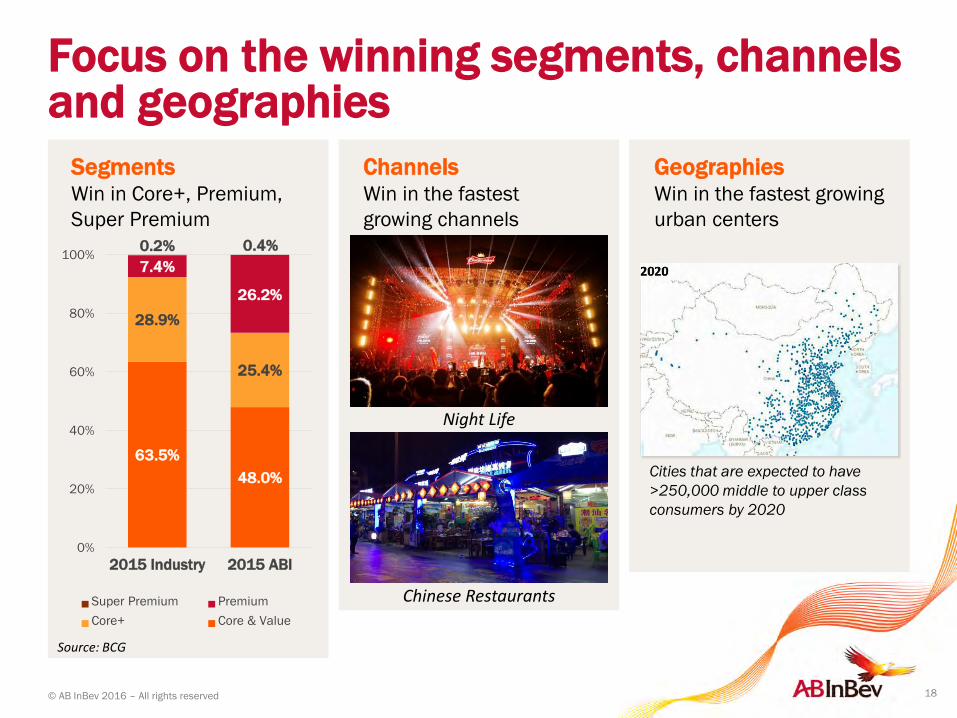
Focus on the winning segments, channels and geographies
18
ChannelsWin in the fastest
growing channels
63.5%
48.0%
28.9%
25.4%
7.4%
26.2%
0.2% 0.4%
0%
20%
40%
60%
80%
100%
2015 Industry 2015 ABI
Super Premium Premium
Core+ Core & Value
SegmentsWin in Core+, Premium,
Super Premium
GeographiesWin in the fastest growing
urban centers
Cities that are expected to have
>250,000 middle to upper class
consumers by 2020
Night Life
Chinese Restaurants
Source: BCG
© AB InBev 2016 – All rights reserved
Highlights from our other markets
• In Canada, we had another strong quarter with volumes up by almost 1%
and a stable market share
• In Europe, growth of our premium brands drove strong results, with
volumes increasing 2.5% and revenues up 4.6%
• Our Premium brands contributed to growth in France, Italy, the Netherlands,
Russia and Ukraine
• UK volumes grew on the back of Stella Artois and Corona activations
• Volumes in Belgium and Germany declined by mid-single digits due mainly to
industry weakness, and some share loss
• In Latin America South, solid financial results despite pressure on beer
volumes. Good growth from Corona and Mixxtail
• In South Korea, beer volumes grew low single digits in the quarter,
contributing to an estimated share gain
19Note: Share figures based on internal estimates
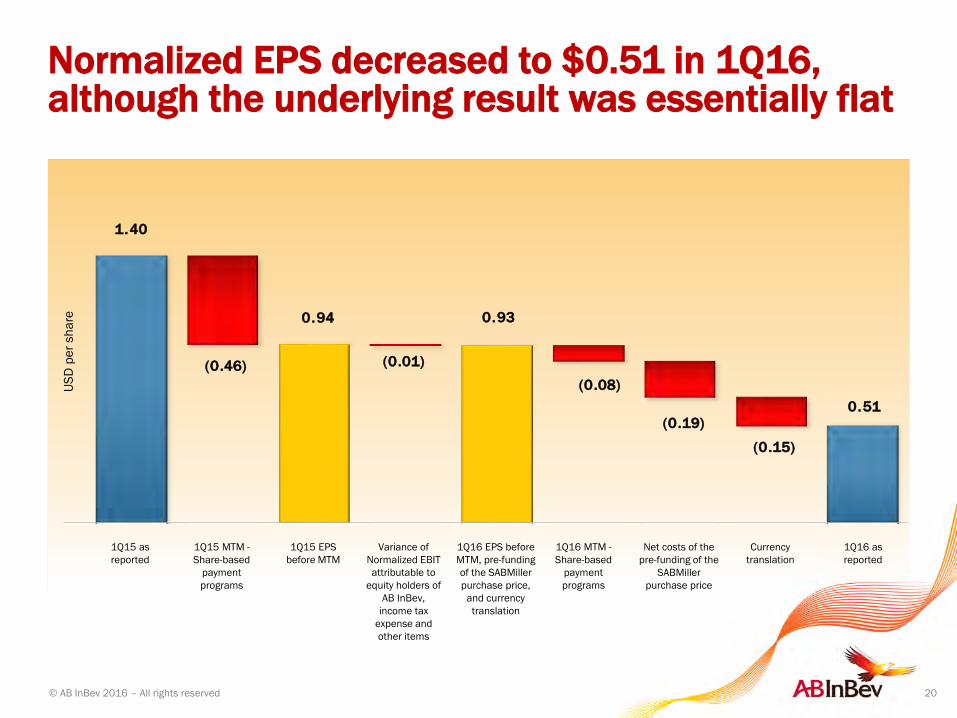
Normalized EPS decreased to $0.51 in 1Q16, although the underlying result was essentially flat
20
US
D p
er
sh
are
© AB InBev 2016 – All rights reserved
1.40
0.94 0.93
0.51
(0.46) (0.01)
(0.08)
(0.19)
(0.15)
1Q15 as
reported
1Q15 MTM -
Share-based
payment
programs
1Q15 EPS
before MTM
Variance of
Normalized EBIT
attributable to
equity holders of
AB InBev,
income tax
expense and
other items
1Q16 EPS before
MTM, pre-funding
of the SABMiller
purchase price,
and currency
translation
Currency
translation
Net costs of the
pre-funding of the
SABMiller
purchase price
1Q16 MTM -
Share-based
payment
programs
1Q16 as
reported

91
1
(1) (1 219)
(273)(67)
(895) (75)
1Q15
Interest expense including pre-
funding of SABMiller
purchase price
Net interest on net defined
benefit liabilitiesAccretion expenses
MTM - Share based payment
programs
Currency and other hedging
result
Bank fees, transaction taxes, other 1Q16
Increase in Net Finance costs driven mainly by MTM adjustment on share based payment programs
1Q16 Net Finance Result driven by:
• Net cost of the pre-funding of the SABMiller purchase price, included in interest expense
• Increase in accretion expenses due to interest charges on legal claims that became payable in 1Q16
• Negative impact of the MTM adjustment linked to the hedging of our share-based payment programs
© AB InBev 2016 – All rights reserved 21
US
D m
illio
ns
1Q15 757
1Q16 (138)
Swing (895)

395
(599) (684)
(479)
(126)
125
Non-recurring net finance costs 684 million USD in
1Q16, versus an income of 395 million USD in 1Q15 1Q15 MTM - Grupo
Modelo deferred
share instrument
MTM - FX hedging of
the purchase price
of SABMiller
Other MTM
adjustments
Accelerated
accretion and
commitment fees
1Q16
1Q15 395
1Q16 (84)
Swing (479)
• Negative mark-to-market adjustment of 84 million USD resulting from the derivative instruments entered into to
hedge the deferred share instrument issued in a transaction related to the combination with Grupo Modelo
• Negative mark-to-market adjustment of 599 million USD related to the portion of the FX hedging of the purchase
price of the proposed combination with SABMiller that does not qualify for hedge accounting under IFRS rules
• Other mark-to-market adjustments driven by derivative instruments entered into to hedge part of the Restricted
shares to be issued in relation to the proposed combination with SABMiller, as well as the hedging, into US dollars,
of the 13.25 billion Euro bonds, issued on 29 March 2016
• Other non-recurring net finance costs of 126 million USD relates mainly to accelerated accretion expenses
following the cancellation, in January 2016, of 42.5 billion USD of the 2015 committed senior acquisition
facilities, as well as commitment fees for the facilities22
USD
mill
ion
s

© AB InBev 2016 – All rights reserved
SABMiller combination - financing updateWe have made good progress pre-funding the SABMiller transaction:
• January 25th issued 46.0bn USD bonds (~3.7% weighted average coupon / 14.2-year weighted average maturity)
• January 29th issued 1.47bn USD Formosa bond (4.915% coupon / 30-year maturity)
• March 29th issued 13.25bn EUR (~1.6% weighted average coupon / 10.4-year weighted average maturity)
Net proceeds of 61.6bn USD at an average coupon of 3.2% and weighted average maturity of
13.7 years. This enabled the cancellation of 55bn USD of the 75bn USD Committed Senior
Acquisition Facilities by early April.
23
Committed Senior Acquisition Facilities
Facility TermApplicable
Margin(bps)
Original Amount (USD billions)
January 2016 Cancellation (USD billions)
April 2016 Cancellation (USD billions)
Current Amount(USD billions)
Term Facility A 3 Years L + 110 25.0 (12.5) (12.5) 0.0
Term Facility B 5 Years L + 125 10.0 0.0 0.0 10.0
Disposals Bridge Facility
1 Year L + 100 10.0 0.0 0.0 10.0
Bridge to Cash / DCM Facility A
1 Year L + 100 15.0 (15.0) 0.0 0.0
Bridge to Cash / DCM Facility B
2 Years L + 100 15.0 (15.0) 0.0 0.0
Total 75.0 (42.5) (12.5) 20.0

Normalized Effective Tax Rate (ETR)
24
Increase in normalized ETR in 1Q16 mainly due to:
• Change in the mark-to-market adjustment linked to the hedging of our share-based payment programs,
and country mix
Guidance for FY16 reflects an increase versus FY15 mainly due to:
• Lower deductibility of goodwill amortization going forward, country mix and the
assumption of zero future gains or losses on the hedging of our share-based
payment programs© AB InBev 2016 – All rights reserved
19.1%18.0%
23.2%
2019 onwardguidance range of
25-27%2017-2018
guidance range of 23-25%
FY 2016guidance range of
22-24%

Capital Allocation objectives
25
Our optimal capital structure is a Net Debt/EBITDA ratio of approximately 2x.
The priorities for the use of cash are as follows:
1. Organic growth: Investing in the organic growth of our business
2. Deleveraging: Deleveraging to around the 2x level will be a priority following the
completion of the combination with SABMiller
3. Selective M&A: Non-organic, external growth is a core competency and we will
continue to consider suitable opportunities as and when they arise, subject to
our strict financial discipline
4. Return of cash to shareholders: Our goal is for dividends to be a growing flow in
line with the non-cyclical nature of our business
© AB InBev 2016 – All rights reserved

Q&A