first quarter 2019 earnings i april 25, 2019 · to changes in the cost or availability of raw...
TRANSCRIPT

First Quarter 2019 Earnings I April 25, 2019

Earnings Presentation I First Quarter 2019 2
Forward-Looking Statements
Certain statements in this presentation may be considered forward-looking statements. Words such as “expects”, “anticipates”, “estimates”, “believes”
and similar expressions identify forward-looking statements. These statements reflect management’s current views and are subject to risks and
uncertainties that could cause actual results to differ materially from those expressed or implied in these statements. Factors which could cause actual
results to differ include but are not limited to: (i) the level of indebtedness and changes in interest rates; (ii) industry conditions, including but not limited
to changes in the cost or availability of raw materials, energy and transportation costs, competition, cyclicality and changes in consumer preferences,
demand and pricing for International Paper products; (iii) global economic conditions and political changes, including but not limited to the
impairment of financial institutions, changes in currency exchange rates, credit ratings issued by recognized credit rating organizations, the amount of
future pension funding obligation, changes in tax laws and pension and health care costs; (iv) unanticipated expenditures related to the cost of
compliance with existing and new environmental and other governmental regulations and to actual or potential litigation; (v) whether International
Paper experiences a material disruption at one of its manufacturing facilities; (vi) risks inherent in conducting business through joint ventures; (vii)
International Paper’s ability to achieve the benefits expected from strategic acquisitions, divestitures, restructurings and capital investments; and (viii)
other factors that can be found in International Paper’s press releases and U.S. Securities and Exchange Commission (“SEC”) filings. These and other
factors that could cause or contribute to actual results differing materially from such forward-looking statements are discussed in greater detail in
International Paper’s SEC filings. International Paper does not assume and specifically disclaims any obligation to update any forward-looking
statements, whether as a result of new information, future events or otherwise, except as required by law.
Statements Relating to Non-GAAP Measures
During the course of this presentation, certain non-U.S. GAAP financial measures may be presented. A reconciliation of all presented non-GAAP
measures (and their components) to U.S. GAAP financial measures is available on IP’s website at internationalpaper.com under Performance/Investors.
Ilim JV and Graphic Packaging Investment Information
All financial information and statistical measures regarding our 50/50 Ilim joint venture in Russia (“Ilim”) and our 20.5% ownership interest in a subsidiary of
Graphic Packaging Holding Company, other than historical International Paper Equity Earnings and dividends received by International Paper, have
been prepared by the management of Ilim and Graphic Packaging Holding Company, respectively. Any projected financial information and statistical
measures reflect the current views of Ilim and Graphic Packaging Holding Company management and are subject to risks and uncertainties that could
cause actual results to differ materially from those expressed or implied by such projections. See “Forward-Looking Statements.”

Earnings Presentation I First Quarter 20193
$0.94
$1.65
$1.11
Adjusted Operating EPS1
First Quarter 2019 Results
1Q19
4Q18
1Q18
See footnotes beginning on Slide 15
Solid earnings and strong free cash flow generation
Strong operational performance across all businesses
North America Packaging optimized system in a
high downtime quarter
Higher wood costs offset by lower recovered fiber (OCC)
Strong Ilim performance
Share repurchases of $180MM

Earnings Presentation I First Quarter 20194
$860
$1,268
$896
Adjusted EBITDA1
($MM)
1Q18 4Q18 1Q19
Sales ($B) $5.6 $6.0 $5.6
Adjusted EBIT1($MM) $535 $931 $582
Adjusted Operating EPS2 $0.94 $1.65 $1.11
Adjusted EBITDA Margin1 15.3% 21.3% 15.9%
Equity Earnings ($MM) $95 $79 $114
Free Cash Flow3 ($MM) $174 $535 $440
1Q19
4Q18
1Q18
First Quarter 2019 Financials
See footnotes beginning on Slide 15

Earnings Presentation I First Quarter 20195
1Q19 vs. 4Q18 Adjusted Operating EPS1
See footnotes beginning on Slide 15
.94
1.65
1.11
(.01) (.17)
(.28)
(.18)
(.01).02.09
1Q18 4Q18 Price / Mix Volume Operations
& Costs
Maintenance
Outages
Input Costs Corporate
/Other
Equity Earnings 1Q19

Earnings Presentation I First Quarter 2019
Industrial Packaging | 1Q19 vs. 4Q18 Adjusted EBIT1
6
See footnotes beginning on Slide 15
$ M
illio
n
IP U.S. Box Shipments -1.4% YoY
Optimized system in high
downtime quarter in N.A.
Export destocking as anticipated
Higher wood costs offset by lower
recovered fiber (OCC)
464
646
421
(60)
(88)
(86)
5
4
1Q18 4Q18 Price / Mix Volume Operations
& Costs
Maintenance
Outages
Input Costs 1Q19

Earnings Presentation I First Quarter 2019 7
Containerboard Export | Customer Landscape
Latin America
Mid-East & Africa
Europe
Asia
Demand
Inventory
Demand
Inventory
Demand
Inventory
Demand
Inventory

Earnings Presentation I First Quarter 20198
Global Cellulose Fibers | 1Q19 vs. 4Q18 Adjusted EBIT1
See footnotes beginning on Slide 15
Modest demand improvement
post Chinese New Year
Export destocking as anticipated
Strong operational performance
while managing downtime in N.A.
$ M
illio
n
15
93
35
(11)
(6)(31)
(11)
1
1Q18 4Q18 Price / Mix Volume Operations &
Costs
Maintenance
Outages
Input Costs 1Q19

Earnings Presentation I First Quarter 20199
Printing Papers | 1Q19 vs. 4Q18 Adjusted EBIT1
See footnotes beginning on Slide 15
Strong performance in N.A.
and Europe
Lower seasonal demand in LatAm
N.A. ops. impacted by seasonality
and mix, as expected
$ M
illio
n 64
197
144
(1) (28)
(28)
(3) 7
1Q18 4Q18 Price / Mix Volume Operations &
Costs
Maintenance
Outages
Input Costs 1Q19
Earnings Presentation I First Quarter 201910
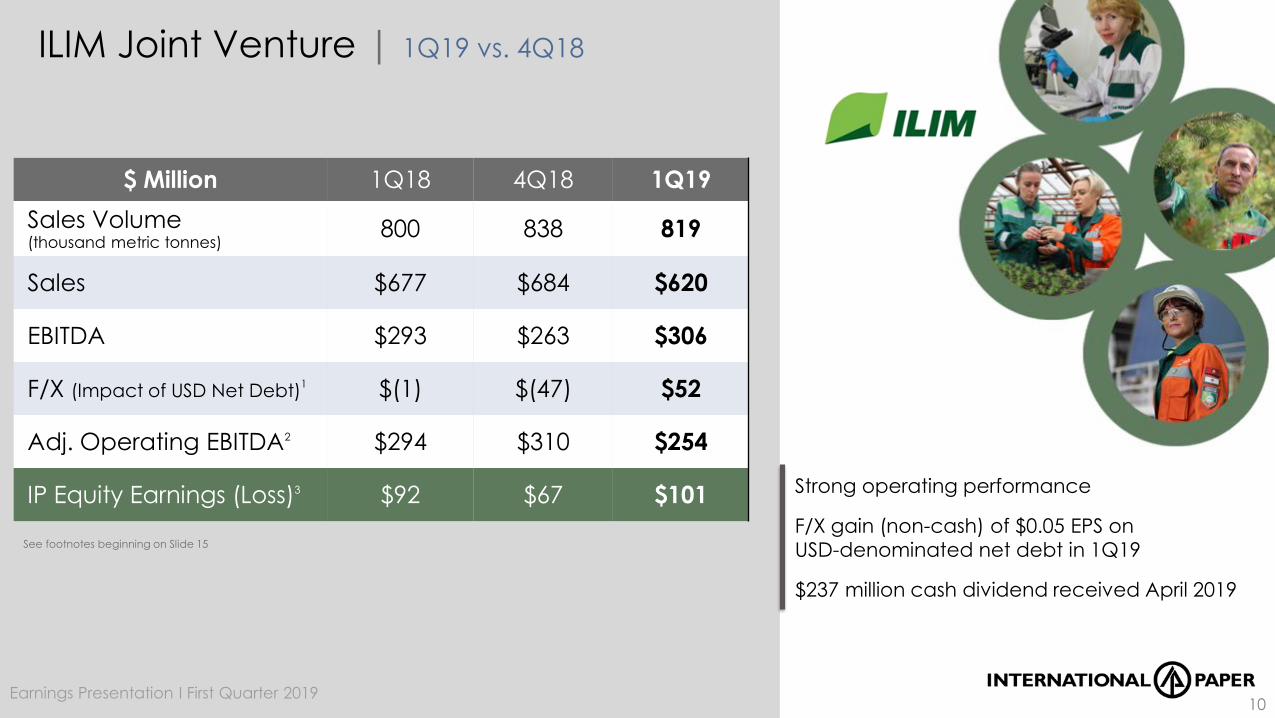
$ Million 1Q18 4Q18 1Q19
Sales Volume (thousand metric tonnes)
800 838 819
Sales $677 $684 $620
EBITDA $293 $263 $306
F/X (Impact of USD Net Debt)1 $(1) $(47) $52
Adj. Operating EBITDA2 $294 $310 $254
IP Equity Earnings (Loss)3 $92 $67 $101
ILIM Joint Venture | 1Q19 vs. 4Q18
See footnotes beginning on Slide 15
Strong operating performance
F/X gain (non-cash) of $0.05 EPS on
USD-denominated net debt in 1Q19
$237 million cash dividend received April 2019
Earnings Presentation I First Quarter 201911
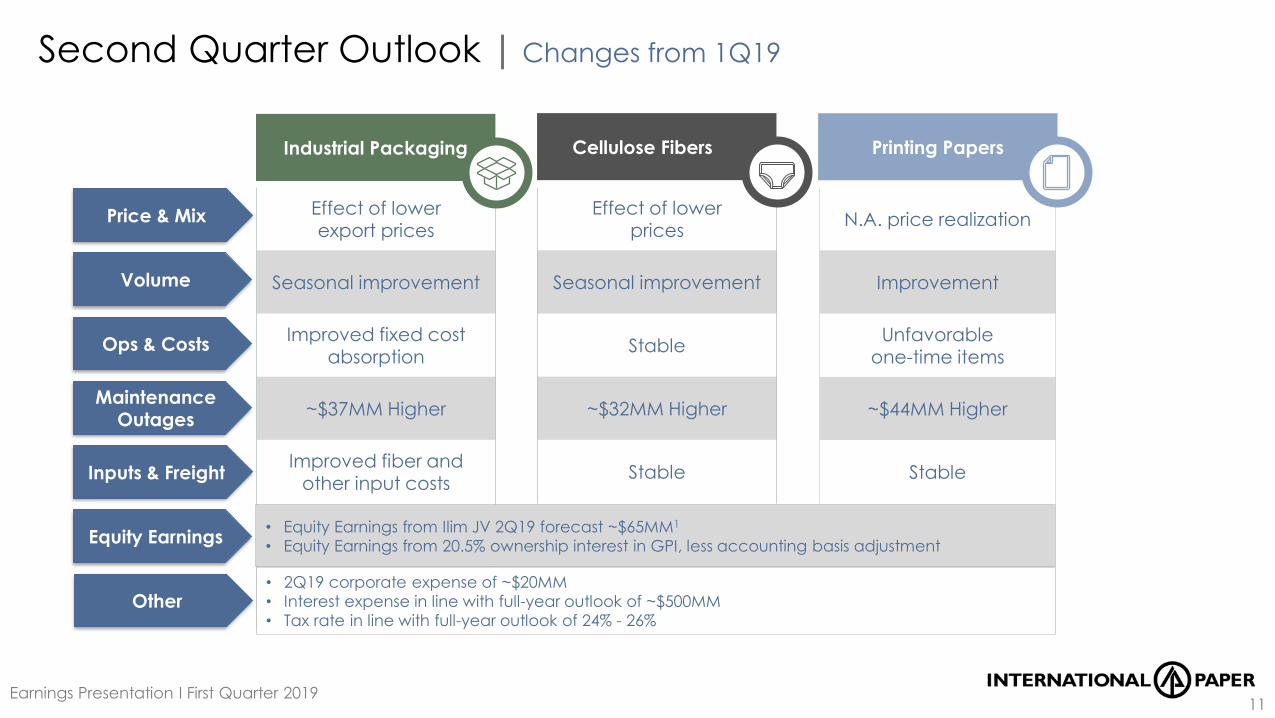
Second Quarter Outlook | Changes from 1Q19
N.A. price realization
Improvement
Unfavorable one-time items
~$44MM Higher
Stable
Effect of lowerprices
Seasonal improvement
Stable
~$32MM Higher
Stable
Printing PapersIndustrial Packaging
Effect of lowerexport prices
Seasonal improvement
Improved fixed costabsorption
~$37MM Higher
Improved fiber and other input costs
• Equity Earnings from Ilim JV 2Q19 forecast ~$65MM1
• Equity Earnings from 20.5% ownership interest in GPI, less accounting basis adjustment
Price & Mix
Volume
Ops & Costs
Maintenance Outages
Inputs & Freight
Equity Earnings
Cellulose Fibers
Other• 2Q19 corporate expense of ~$20MM
• Interest expense in line with full-year outlook of ~$500MM
• Tax rate in line with full-year outlook of 24% - 26%

Earnings Presentation I First Quarter 2019 12
2019 Outlook | Strong & Resilient Free Cash Flow
$ Billion2019
Outlook
Adjusted EBITDA1 $4.2 - $4.3
Capex $1.4
Free Cash Flow $2.0
Dividend $0.8
Share Repurchase$1.2
Debt Reduction
See footnotes beginning on Slide 15
Annualized Dividend
$1.05 $1.20
$1.40 $1.60
$1.76 $1.85 $1.90
$2.00
4Q11 4Q12 4Q13 4Q14 4Q15 4Q16 4Q17 4Q18
$300
$200 $200 $180
2Q18 3Q18 4Q18 1Q19
Share Repurchases ($MM)
Earnings Presentation I First Quarter 201913
Strong and Resilient
Company
Breadth of capabilities
Strength of portfolio
Commitment to
Shareholders
Strengthening balance sheet
Returning cash to shareholders
Growing Free Cash Flow
CEO Perspective
Earnings Presentation I First Quarter 2019
Earnings Presentation I First Quarter 20191414
Appendix | Contact Information
Guillermo Gutierrez
Vice President, Investor Relations
+1-901-419-1731
Michele Vargas
Director, Investor Relations
+1-901-419-7287
Betty Groom
Administrative Assistant
+1-901-419-4250

Earnings Presentation I First Quarter 2019
FootnotesSlide 31 Adjusted operating EPS based on Adjusted Operating Earnings (defined as Net Earnings (GAAP) from continuing operations before special items and non-operating pension expense)
Slide 41 From continuing operations before special items and non-operating pension expense2 Adjusted operating EPS based on Adjusted Operating Earnings (defined as Net Earnings (GAAP) from continuing operations before special items and non-operating pension expense)3 See slide #18 for a reconciliation of cash provided by operations to Free Cash Flow
Slide 51 Adjusted operating EPS based on Adjusted Operating Earnings (defined as Net Earnings (GAAP) from continuing operations before special items and non-operating pension expense)
Slide 61 Segment adjusted operating profit before special items
Includes European Coated Paperboard adjusted operating profit of $20MM, $17MM, and $22MM for 1Q18, 4Q18, and 1Q19 respectively
Slide 81 Segment adjusted operating profit before special items
Slide 91 Segment adjusted operating profit before special items
Slide 10
Ilim JV results are on U.S. GAAP basis 1 Represents F/X impact including amounts related to Ilim Group USD-denominated net debt (balance of ~$0.5B as of March 31, 2019); Ilim Group’s functional currency is the Ruble (RUB); Non-functional-
denominated currency balances are measured monthly using the month-end exchange rate2 Before F/X impact including USD-denominated net debt3 IP Equity Earnings (Loss) for 1Q18, 4Q18, and 1Q19 include after-tax F/X gains (losses) (primarily on USD-denominated net debt) of $0MM, $(19)MM, and $21MM, respectively
Slide 111 Assumes stable F/X as of March 31, 2019
15

Earnings Presentation I First Quarter 2019
FootnotesSlide 121 From continuing operations before special items and non-operating pension expense
Slide 171 From continuing operations before special items
Slide 231 Excludes special items (Non-GAAP)2 Includes Ilim Joint Venture and Investment in Graphic Packaging and other investments3 Includes non-cash settlement charge before-tax of $424MM
Slide 24
Does not reflect total company sales. Sales as reported is a U.S. GAAP metric. For North American Industrial Packaging, this metric includes Recycling Business Sales and Trade Sales. A reconciliation of this U.S.
GAAP metric to a non-U.S. GAAP metric of Sales excluding these items for North American Industrial Packaging is available as a Non-GAAP reconciliation on our
website at www.internationalpaper.com under Performance/Investors/Presentations and Events/Webcasts and Presentations.1 Excludes special items (Non-GAAP)
Slide 251 A reconciliation to GAAP EPS is available at www.internationalpaper.com under the Performance tab, Investors section
Slide 261 Adjusted operating EPS based on Adjusted Operating Earnings (defined as Net Earnings (GAAP) from continuing operations before special items and non-operating pension expense)
Slide 271 Segment adjusted operating profit before special items
Includes European Coated Paperboard adjusted operating profit of $20MM and $22MM for 1Q18 and 1Q19, respectively
Slide 281 Segment adjusted operating profit before special items
Slide 291 Segment adjusted operating profit before special items
16
Earnings Presentation I First Quarter 2019
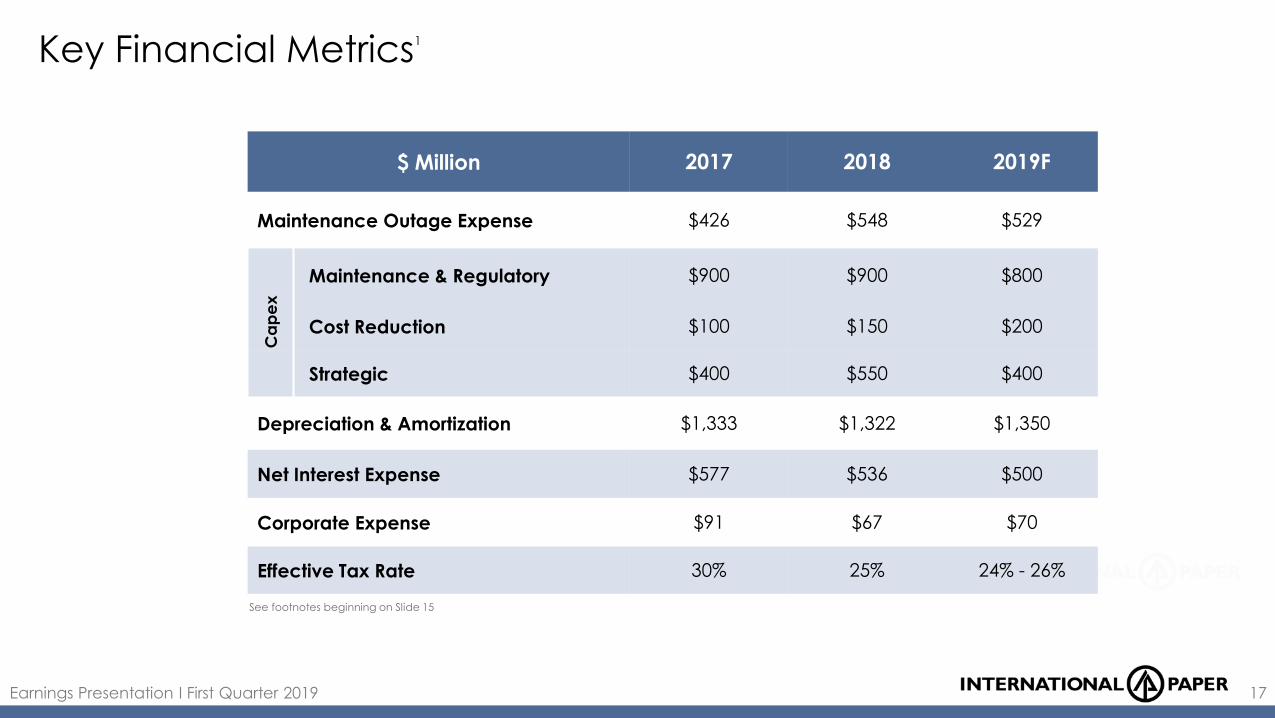
Key Financial Metrics1
17
$ Million 2017 2018 2019F
Maintenance Outage Expense $426 $548 $529
Maintenance & Regulatory $900 $900 $800
Cost Reduction $100 $150 $200
Strategic $400 $550 $400
Depreciation & Amortization $1,333 $1,322 $1,350
Net Interest Expense $577 $536 $500
Corporate Expense $91 $67 $70
Effective Tax Rate 30% 25% 24% - 26%
Ca
pe
x
See footnotes beginning on Slide 15
Earnings Presentation I First Quarter 2019
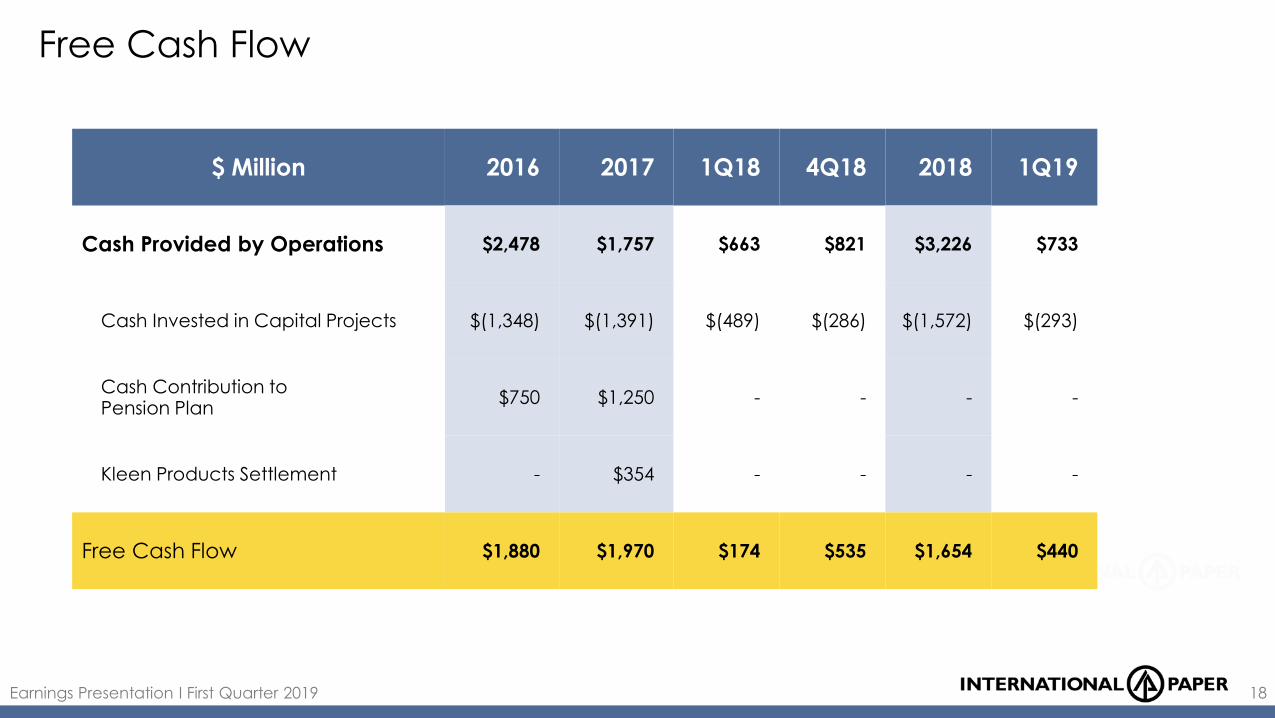
$ Million 2016 2017 1Q18 4Q18 2018 1Q19
Cash Provided by Operations $2,478 $1,757 $663 $821 $3,226 $733
Cash Invested in Capital Projects $(1,348) $(1,391) $(489) $(286) $(1,572) $(293)
Cash Contribution to Pension Plan
$750 $1,250 - - - -
Kleen Products Settlement - $354 - - - -
Free Cash Flow $1,880 $1,970 $174 $535 $1,654 $440
18
Free Cash Flow

Earnings Presentation I First Quarter 2019
$ Million 1Q19A 2Q19F 3Q19F 4Q19F 2019F
Industrial Packaging $93 $130 $58 $2 $283
North America 93 123 53 2 271
Europe - - 1 - 1
Europe Coated Paperboard - 7 1 - 8
Brazil - - 3 - 3
Global Cellulose Fibers $38 $70 $17 $11 $136 North America 38 67 17 4 126Europe - 3 - 7 10
Printing Papers $12 $56 $25 $17 $110North America 12 36 18 9 75
Europe - 17 - 8 25
Brazil - 3 4 - 7
India - - 3 - 3
Total Impact $143 $256 $100 $30 $529
19
Maintenance Outages Expenses| 2019 Forecast
Earnings Presentation I First Quarter 2019 20
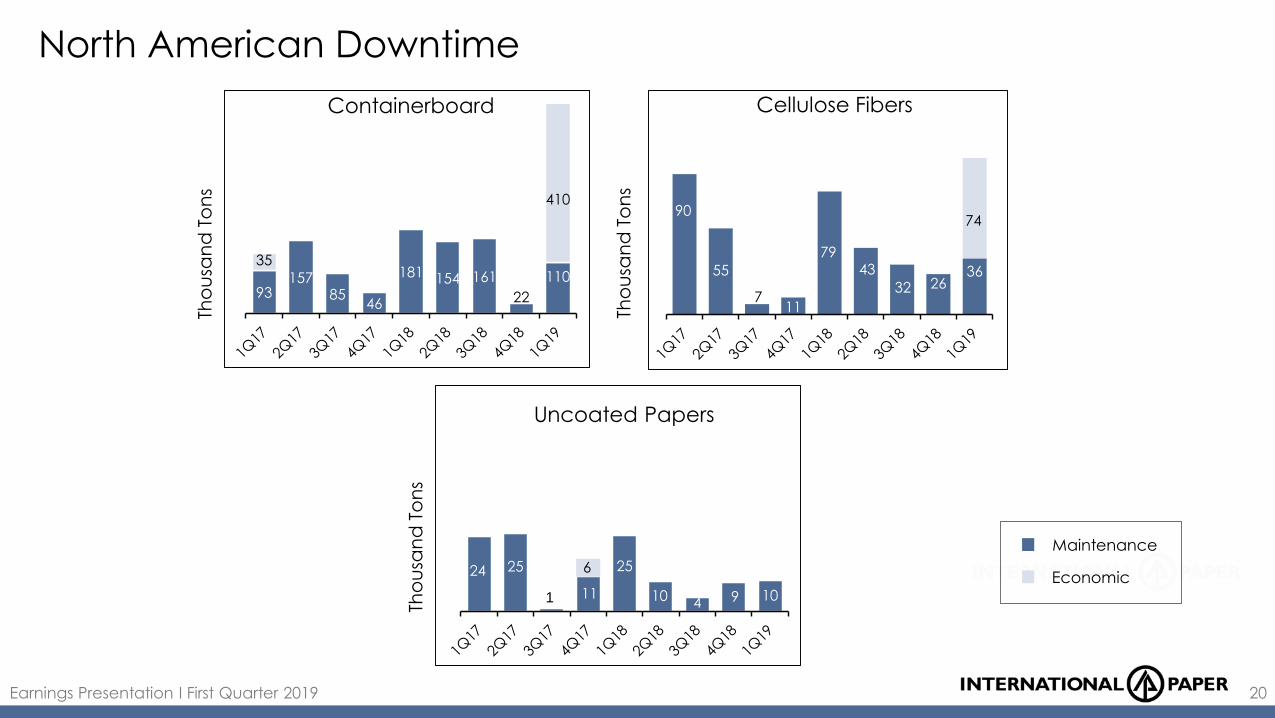
North American Downtime
Tho
usa
nd
To
ns
Tho
usa
nd
To
ns
Maintenance
Economic
Cellulose FibersContainerboard
Uncoated Papers
90
93157
8546
181 154 161
22
11035 0
00
410
Tho
usa
nd
To
ns
24 25
11
25
10 4 9 101
6
90
55
711
7943
32 2636
74

Earnings Presentation I First Quarter 2019
Special Items Before Tax | Continuing Operations
Special Items Pre-Tax $(Million) 1Q18 4Q18 1Q19
Multi-Employer Pension Plan Exit Liability $(16)
Industrial Packaging
Gain on Sale of EMEA Packaging box plant $7
EMEA Packaging Restructuring $(22) $1
Litigation Settlement Recovery $5
Other $(5) $(5) $(8)
Global Cellulose Fibers Other $(4) $(2) $(3)
Printing PapersRiverdale Mill Conversion $(4) $(1)
Other $(1)
Corporate
Debt Extinguishment $(10)
Legal Settlement $(9)
Liaison Technologies Sale $31
Total Special Items Before Tax $(40) $15 $(21)
21
Earnings Presentation I First Quarter 2019
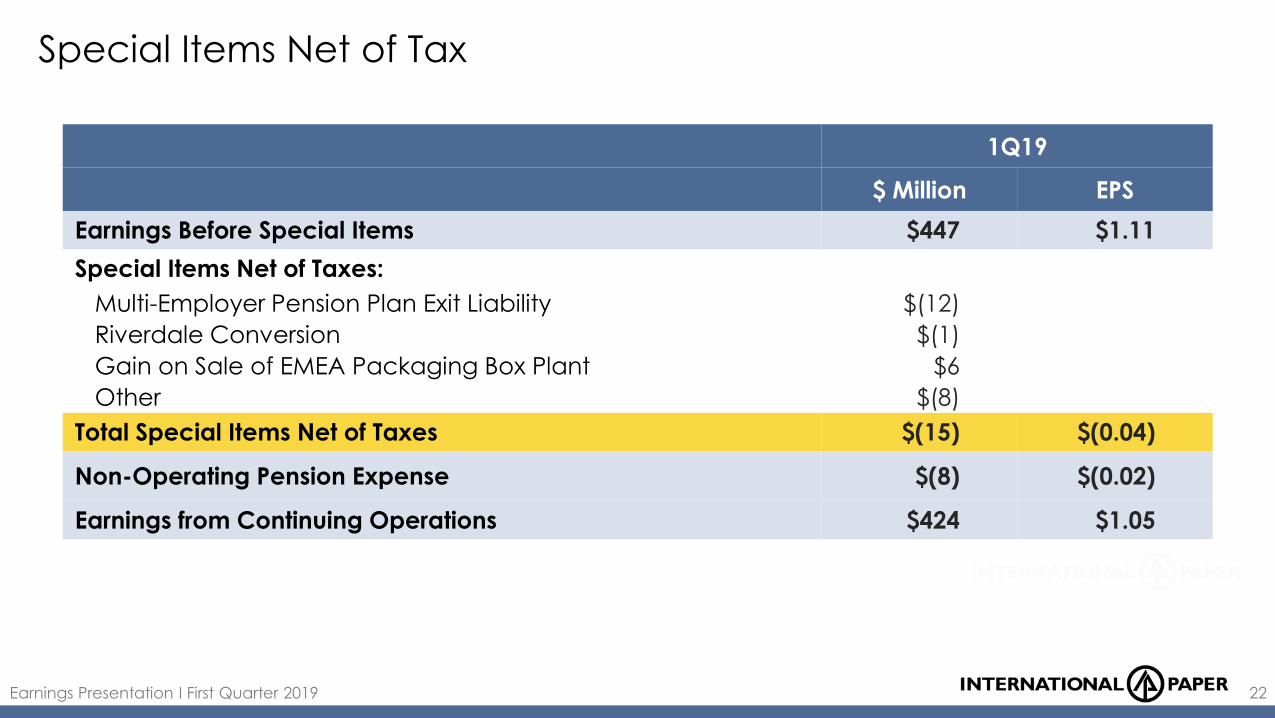
Special Items Net of Tax
22
1Q19
$ Million EPS
Earnings Before Special Items $447 $1.11
Special Items Net of Taxes:
Multi-Employer Pension Plan Exit Liability $(12)
Riverdale Conversion $(1)
Gain on Sale of EMEA Packaging Box Plant $6
Other $(8)
Total Special Items Net of Taxes $(15) $(0.04)
Non-Operating Pension Expense $(8) $(0.02)
Earnings from Continuing Operations $424 $1.05

Earnings Presentation I First Quarter 2019
Adj. Operating Profits by Industry Segment | Continuing Operations
23
$ Million 1Q18 4Q18 1Q19
Earnings (Loss) From Continuing Operations Before Income Taxes and Equity Earnings
$356 $382 $418
Interest Expense, Net $135 $135 $133
Noncontrolling Interest / Equity Earnings Adjustment $(1) $(3) $(3)
Corporate Expenses, Net $9 $8 $21
Special Items, Net $40 $(15) $21
Non-Operating Pension Expense $4 $4293
$10
Adj. Operating Profit Before Special Items $543 $936 $600
Industrial Packaging1 $464 $646 $421
Global Cellulose Fibers1 $15 $93 $35
Printing Papers1 $64 $197 $144
Total Adj. Industry Segment Operating Profit1 $543 $936 $600
Equity Earnings (Loss), net of taxes2 $95 $79 $114See footnotes beginning on Slide 15

Earnings Presentation I First Quarter 2019
Geographic Business Segment Operating Results | Quarterly
24
$ MillionSales D & A1 Adj. Operating Profit1
1Q18 4Q18 1Q19 1Q19 1Q18 4Q18 1Q19
Industrial Packaging
North America $3,369 $3,583 $3,376 $170 $464 $641 $419
Europe $362 $338 $339 $11 $(12) $(7) $(15)
Europe Coated Paperboard $92 $94 $91 $5 $20 $17 $22
Brazil $62 $57 $57 $0 $(8) $(5) $(5)
Global Cellulose Fibers
Global Cellulose Fibers $677 $736 $689 $64 $15 $93 $35
Printing Papers
North America $458 $513 $496 $22 $1 $80 $57
Europe $319 $320 $309 $11 $21 $47 $47
Brazil $229 $272 $215 $25 $40 $63 $33
India $52 $52 $53 $4 $2 $7 $7See footnotes beginning on Slide 15
Earnings Presentation I First Quarter 2019
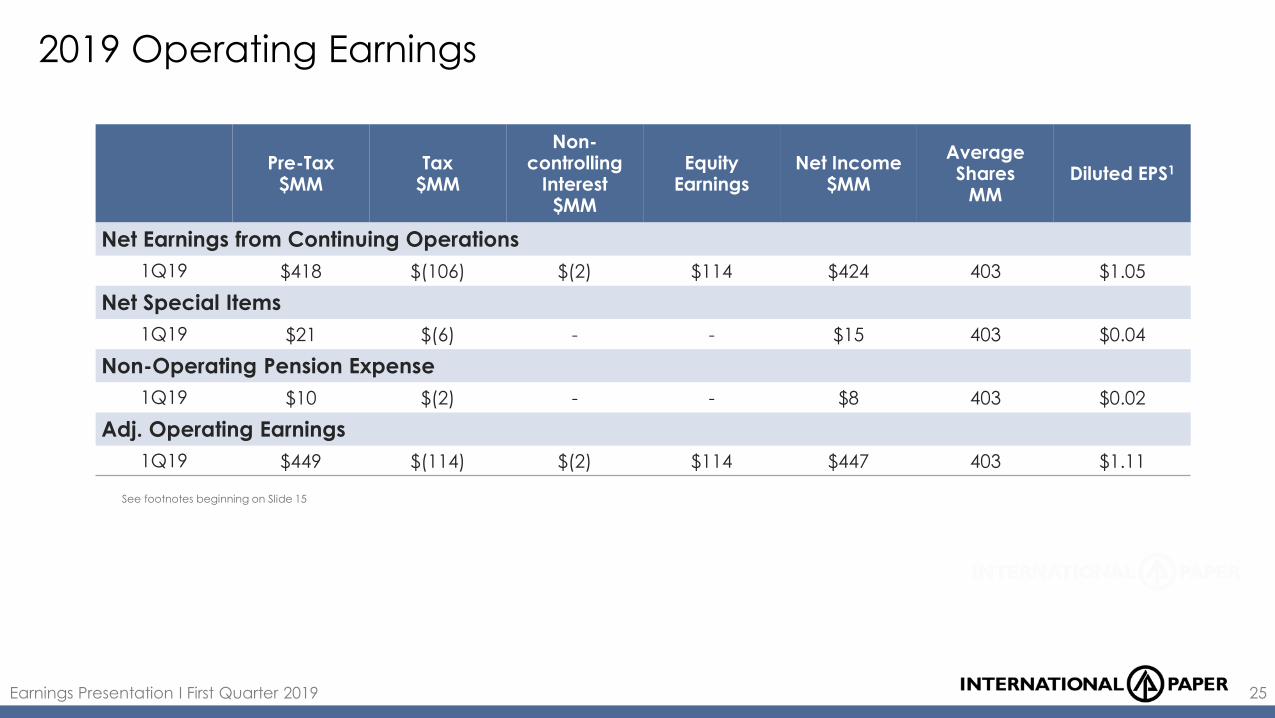
2019 Operating Earnings
25
See footnotes beginning on Slide 15
Pre-Tax$MM
Tax$MM
Non-controlling
Interest$MM
EquityEarnings
Net Income$MM
Average Shares
MMDiluted EPS1
Net Earnings from Continuing Operations
1Q19 $418 $(106) $(2) $114 $424 403 $1.05
Net Special Items
1Q19 $21 $(6) - - $15 403 $0.04
Non-Operating Pension Expense
1Q19 $10 $(2) - - $8 403 $0.02
Adj. Operating Earnings
1Q19 $449 $(114) $(2) $114 $447 403 $1.11
Earnings Presentation I First Quarter 201926
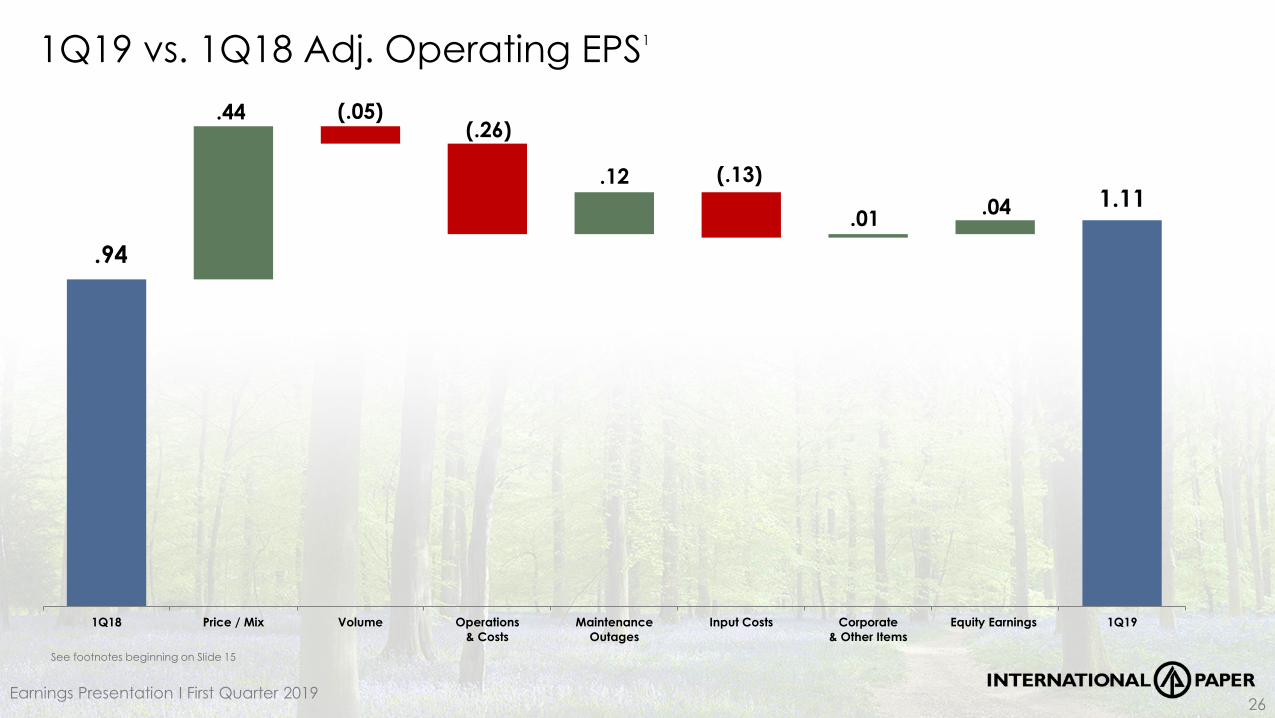
1Q19 vs. 1Q18 Adj. Operating EPS1
See footnotes beginning on Slide 15
.94
1.11
(.05)(.26)
(.13)
.44
.12
.01.04
1Q18 Price / Mix Volume Operations
& Costs
Maintenance
Outages
Input Costs Corporate
& Other Items
Equity Earnings 1Q19
Earnings Presentation I First Quarter 2019
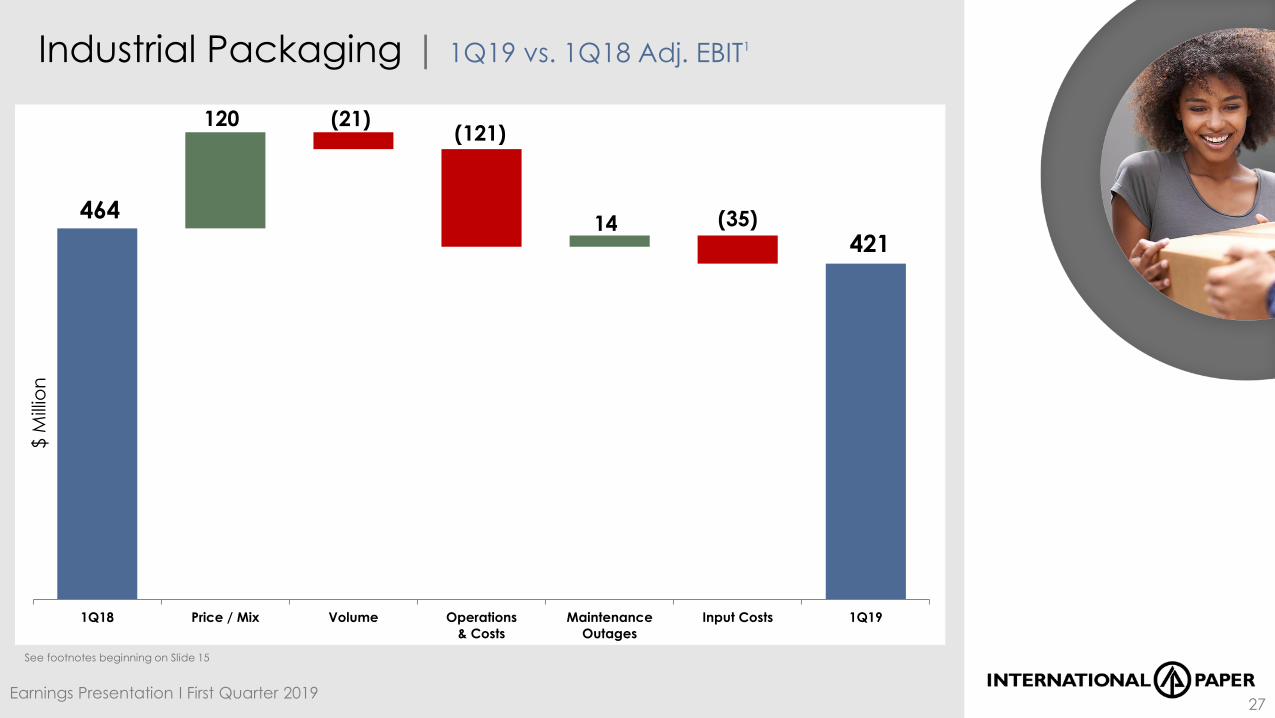
Industrial Packaging | 1Q19 vs. 1Q18 Adj. EBIT1
27
See footnotes beginning on Slide 15
464
421
(21)(121)
(35)
120
14
1Q18 Price / Mix Volume Operations
& Costs
Maintenance
Outages
Input Costs 1Q19
$ M
illio
n

Earnings Presentation I First Quarter 201928
Global Cellulose Fibers | 1Q19 vs. 1Q18 Adj. EBIT1
See footnotes beginning on Slide 15
15
35
(1) (31)
(8)
35
25
1Q18 Price / Mix Volume Operations & Costs Maintenance
Outages
Input Costs 1Q19
$ M
illio
n
Earnings Presentation I First Quarter 201929
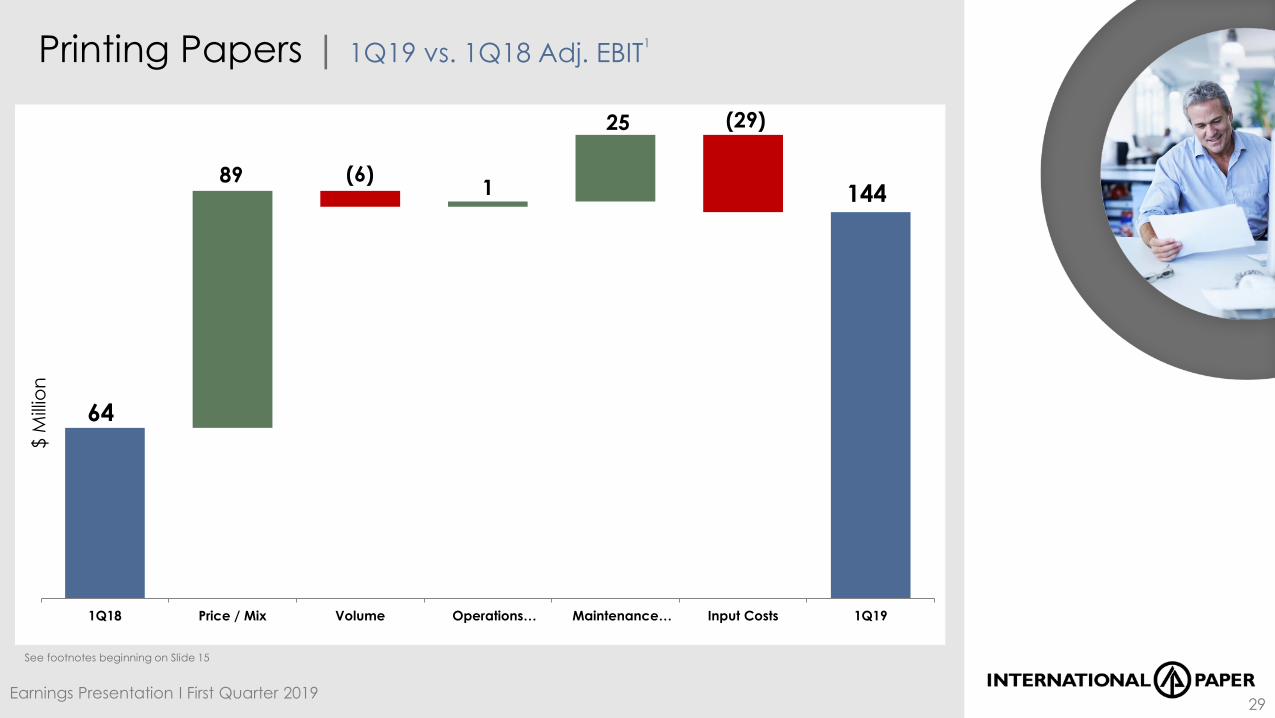
Printing Papers | 1Q19 vs. 1Q18 Adj. EBIT1
See footnotes beginning on Slide 15
64
144(6)
(29)
891
25
1Q18 Price / Mix Volume Operations… Maintenance… Input Costs 1Q19
$ M
illio
n

Earnings Presentation I First Quarter 2019
Global Input Costs vs. 4Q18 | $12MM Favorable, or $0.02 per share
30
By Business By Input Type
U.S. Average Cost vs. 4Q18
Wood 3%
OCC 10%
Natural Gas 9%
Fuel Oil 3%
Chemical Composite 3%
OCC
(3)
7
3 5
Fiber Energy Chemicals Freight
North America Outside North America
Wood
4
1
7
Industrial
Packaging
Global
Cellulose Fibers
Printing Papers
Energy Wood Chemicals Freight OCC
OCC
Wood
Wood