first results of the demographic data collection for 2002
TRANSCRIPT
First results of the ^κ. ^ ^áp
ρ A
1953 — ■¿Γ 2CKJ3
eurostat
in focus
POPULATION AND SOCIAL CONDITIONS
THEME 3 - 20/2003
POPULATION AND LIVING CONDITIONS
Contents
Joint Council of Europe/Eurostat demographic data collection 1
Main demographic trends for 2002 1
Manuscript completed on: 6.07.2003 ISSN 1024-4352 Catalogue number KS-NK-03-020-EN-C
© European Communities, 2003
demographic data collection
for 2002 in Europe
Joint Council of Europe/Eurostat demographic data collection
The objective of this publication is to provide some basic demographic information for
2002. However, given the timetable (rapid questionnaire sent out in April 2003 with a
return date of May), not all countries could provide all the information while some
figures are provisional or estimates. Additional and/or more definitive information will
be published in the annual reports of the Council of Europe (« Recent demographic
developments in Europe 2003 ») and Eurostat (« European social statistics -
Population 2003 »).
Main demographic trends for 2002
The population of the European Union is estimated to have increased by 0.3% in 2002,
compared with 0.4% in 2001. Some three quarters of the 1.3 million increase in 2002,
to 379 million at 1.1.2003, was due to net inward international migration (1 million) and
one quarter to natural increase (0.3 million). The largest percentage increase in 2002
was seen in Ireland at 1.5% and the lowest in Germany and Italy at 0.1%. Annual
population decreases were again observed in many central and eastern European
countries, such as Bulgaria and Latvia (-0.6%) and Belarus (-0.5%). More detailed
results are shown in Tables 1 and 2.
It may also be noted from Table 1 that there are revisions to the population estimates
for several countries for 1.1.2002, published, for example, in the corresponding
Statistics in focusTor 2002 (17/2002). The revision is the effect of countries re-basing
their population estimates on new information following the 2000 round of censuses,
(this is a well-established practice usually made necessary by the imprecision of
international migration estimates). Thus the current estimate for the European Union of
377.7 million at 1.1 2002 is some 2 million lower than the estimate that was published
last year. The most significant revisions have been a reduction in the population
estimate of well over 1 million for both Italy and the United Kingdom, and some 100
thousand for Austria. In contrast, the estimate for Greece has been increased by about
400 thousand. Revisions to the population estimates for France, Portugal and Spain
were incorporated in last year's report (17/2002).
Table 3 shows that yet again the total fertility rate (TFR) in the EU in 2002, at 1.47 has
remained virtually unchanged from 2001 and 2000. However there were some notable
increases, in Germany up from 1.35 in 2001 to 1.40 in 2002, and in Sweden, up from
1.57 to 1.65. The TFR for Ireland at just over 2.0 was only slightly below the rate for
the United States, and helps to account for the relatively high rate of population
increase.
The proportion of births outside marriage continues to show small increases in all
countries, both in the European Union and other Council of Europe member states.
Over 50% of births were outside marriage in many parts of northern Europe - in
Iceland (62.3%), Estonia (56.3%), Sweden (56.0%) and for the first time, Norway at
50.3%. Even in Malta there has been a significant increase, from 12.9% in 2001 to
15.0% in 2002, compared with just 5.8% in 1996.
The most significant new feature in Table 4 is the low infant mortality rate in Sweden at
less than 3 deaths of children under one per 1000 live births. This is about half the rate
of many other EU countries. The infant mortality rate for the EU as a whole has
continued to fall; at 4.5 in 2002, it is still 50% lower than in the United States (6.9).
The downward trend in the number of marriages continues with the number of
marriages in the EU falling from 1.9 million in 2000 to about 1.8 million in 2001 and
2002, despite small increases for both Sweden and Austria (see Table 5). The overall
trend in the number of divorces is in the opposite direction, with an increase of about
10 thousand for the EU as a whole between 2000 and 2001.
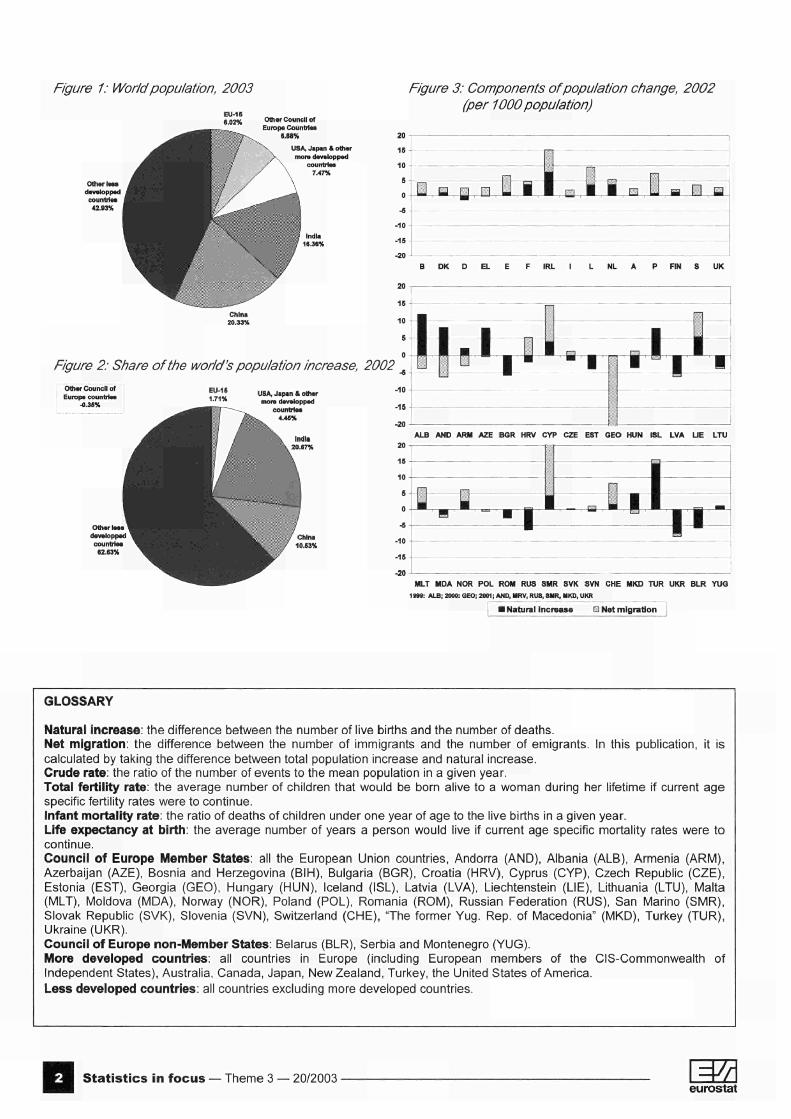
Figure 1: World population, 2003
Other Council of
Europe Countriea
6.88%
Figure 3: Components of population change, 2002 (per 1000 population)
USA, Japan t other
mora developpöd
countrlee
7.47%
20
15
10
5
0
5
10
-15
-20
y ι π o
FIN UK
Figure 2: Share of the world's population increase, 2002
Other Council of
Europa countrlee 0.36%
USA, Japan h, other
mora developped
countrlee
446%
ALB AND ARM AZE BGR HRV CYP CZE EST GEO HUN » L LVA U E LTU
MLT MDA NOR POL ROM RUS SMR SVK SVN CHE MKD TUR UKR BLR YUG
1WS: ALB; 2000: SEO; 2001; AND, HRV, RUS, SMR, MKD, UKR
■ Natural increase ] Net migration
GLOSSARY
Natural increase: the difference between the number of live births and the number of deaths.
Net migration: the difference between the number of immigrants and the number of emigrants. In this publication, it is
calculated by taking the difference between total population increase and natural increase.
Crude rate: the ratio of the number of events to the mean population in a given year.
Total fertility rate: the average number of children that would be born alive to a woman during her lifetime if current age
specific fertility rates were to continue.
Infant mortality rate: the ratio of deaths of children under one year of age to the live births in a given year.
Life expectancy at birth: the average number of years a person would live if current age specific mortality rates were to
continue.
Council of Europe Member States: all the European Union countries, Andorra (AND), Albania (ALB), Armenia (ARM),
Azerbaijan (AZE), Bosnia and Herzegovina (BIH), Bulgaria (BGR), Croatia (HRV), Cyprus (CYP), Czech Republic (CZE),
Estonia (EST), Georgia (GEO), Hungary (HUN), Iceland (ISL), Latvia (LVA), Liechtenstein (LIE), Lithuania (LTU), Malta
(MLT), Moldova (MDA), Norway (NOR), Poland (POL), Romania (ROM), Russian Federation (RUS), San Marino (SMR),
Slovak Republic (SVK), Slovenia (SVN), Switzerland (CHE), "The former Yug. Rep. of Macedonia" (MKD), Turkey (TUR),
Ukraine (UKR).
Council of Europe non-Member States: Belarus (BLR), Serbia and Montenegro (YUG).
More developed countries: all countries in Europe (including European members of the CIS-Commonwealth of
Independent States), Australia, Canada, Japan, New Zealand, Turkey, the United States of America.
Less developed countries: all countries excluding more developed countries.
Statistics in focus — Theme 3 — 20/2003 ■ eurostat

Table 1 : Population change in 2002
COUNTRY/REGION
European Union Eurozone
Belgium Denmark Germany Greece Spain France Ireland Italy Luxembourg Netherlands Austria Portugal Finland Sweden United Kingdom
Population 1.1.2002
Live births
Deaths Natural increase
Net migration
Total increase
Population 1.1.2003
(1000)
377 698.1 * 304 499.1 , B
10 309.7 5 368.4
82 440.3 p
10 988.0 5p
40 409.3 59 337.9 p
3 901.4 5 ' 56 993.7 5"
444.1 16 105.3 8 038.9 5"
10 335.6 5 194.9 8 909.1
58 921.5 5 '
3 995.0 ' 3 166.3 '
113.6 p
64.1 725.0 p
102.5 ' 411.5* 762.7 p
60.5 p
533.6 " 5.3
203.1 p
78.4 114.4 p
55.6 95.8
668.8 p
3 693.7 * 2 932.0 '
106.4 p
58.6 845.0 p
104.2 ' 365.8 ' 539.7 p
29.4 p
562.7 ' 3.7
143.3 p
76.1 106.2 p
49.4 95.0
608.0 p
301.3* 234 .3*
7.2 p
5.5 -120.0 p
- 1 . 7 ' 4 5 . 8 '
223.0 p
31.1 p
-29.1 ' 1.6
59.9 p
2.3 8.1 p
6.1 0.8
60.7 p
988 .6 ' 8 4 4 . 2 '
38.9 p
9.6 221 .7 '
32.1 ' 227.9 "
65.0 p
28 .8 ' 107.1 '
2.6 27.7 p
17.0 e
70 .0 ' 5.3
30.9 104.0 '
1 290.0 * 1 078.4 *
46.1 p
15.2 101.7 ' 30.4 p
273.7 288.0 p
59 .9 ' 7 8 . 0 '
4.3 87.6 p
19.3 e
78.1 ' 11.4 31.7
164.7 '
378 988.1 * 305 577.5 *
10 355.8 p
5 383.5 82 542.0 ' 11 018.4 p
40 683.0 59 625.9 p
3 961 .3 ' 57 071.7 '
448.3 16 192.8 p
8 058.2 e
10413.7 ' 5 206.3 8 940.8
59 086.3 '
Other Council of Europe Member States Albania Andorra Armenia Azerbaijan Bosnia and Herzegovina Bulgaria Croatia Cyprus Czech Republic Estonia Georgia Hungary Iceland Latvia Liechtenstein Lithuania Malta Moldova Norway Poland Romania Russian Federation San Marino Slovak Republic Slovenia Switzerland "The former Yug. Rep. of Macedonia" Turkey Ukraine
3 401.2 2
66.3 3 212.9 8 141.4 3 832.0 4 ' 7 891.1 5p
4 437.5 1
793.1 5" 10 206.4 5
1 361.2 6
3 947.6 1
10 174.9 286.6
2 345.8 33.5 p
3 475.6 5
394.6 3 627.2 4 524.1
38 236.9 6p
21 872.3 5p
143 954.4 28.2
5 379.0 1 994.0 7 261.2 2 038.7
69 078.0 p
49 036.5 1
57.5 3
0.8 1
32.2 110.7
35.1 p
67.3 p
41.0 1
8 . 9 ' 92.8 13.0 40.4 1
96.8 4.0 p
20.0 0.4 p
30.0 p
3.8 35.7 55.4
353.8 210.5
1 396.8 p
0.3 1
50.8 17.5 p
72.4 p
27.0 1
1 482.0 p
376.5 1
16.7 3
0.2 1
25.6 46.5 29.3 p
112.9 p
49.6 1
5 . 7 ' 108.2
18.4 38.6 1
132.8 1.8 p
32.5 0.2 p
41.1 p
3.0 41.9 44.7 p
359.5 269.7
2 331.4 p
0.2 ' 51.5 18.6 p
61.8 p
16.9 1
491.0 p
746.0 1
40.8 3
0.5 1
6.7 64.2
5.9 p
-45.6 p
-8.6 1
3.2" -15.5
-5.4 1.8 1
-36.0 2.2 p
-12.5 0.2 p
-11.1 p
0.8 -6.1 10.7 p
-5.7 -59.1
-934.6 p
0.1 1
-0.7 -1.1 p
10.6 p
10.1 1
991.0 p
-369.5 1
0.0 1
-9.3 -3.1
0.0 p
23.4 1e
8 . 4 ' 12.3 0.2
13.2 -0.3 p
-1.8 0.2 p
-2.0 p
1.9 -3.4 17.5 p
-17.2 p
-1.6°
1.1 ' 0.9 2.1 p
49.1 p
100.0 p
0.5 1
-2.6 61.1
-45.6 p
14.8 1e
11.6" -3.2 -5.2
-22.9 1.9
-14.3 0.4 p
-13.0 p
2.7 -9.5 28.2
-22.9 p
-60.7 p
1.2 1
0.2 1.0
59.7 p
1 091.0 p
3 210.3 8 202.5
7 845.5 p
4 452.3 2e
804.7 ' 10 203.3
1 356.0
10 152.0 288.5
2 331.5 33.9 p
3 462.6 p
397.3 3 617.7 4 552.3
38 214.0 p
21 811.6 p
5 379.2 1 995.0 7 320.9 p
70 169.0 p
Council of Europe non-Member States Belarus Serbia and Montenegro
Other countries/regions United States of America Japan Other more developed countries India China Other less developed countries
9 950.9 10 662.3 6
286 349.7 126 978.7 55 514.1
1 026 338.4 1 275 123.1 2 692 564.5
88.7 132.0 6p
4 076.4 1 224.9
663.1 24 582.3 16 782.6 73 755.3
146.7 119.1 6p
2 459.6 1 062.3
418.4 8 904.2 8 557.6
25 332.7
-57.9 12.8 6p
1 616.7 162.6 244.7
15 678.1 8 225.0
48 422.7
5.6 0.0 6 '
1 042.6 -1.2
295.2 -80.2
-279.9 -1 168.6
-52.4 12.8 6 '
2 659.3 161.4 539.9
15 597.9 7 945.1
47 254.1
9 898.6 10 675.1 6 '
289 009.0 127 140.2 56 054.0
1 041 936.3 1 283 068.2 2 739 818.5
ρ provisional data; * national estimate (including in small instances projections); e Eurostat estimate; b break in series ' 2001 ; 2 2000; 31999;4 average 2002;5 based upon the last National Population Census. 6 does not include Kosovo and Metohija. Sources: Eurostat, Council of Europe, US Bureau of the Census - International Program Center.
eurostat 20/2003 — Theme 3 — Statistics in focus

Table 2: Crude rates of population change
COUNTRY/REGION
European Union Eurozone
Belgium Denmark Germany Greece Spain France Ireland Italy Luxembourg Netherlands Austria Portugal Finland Sweden United Kingdom
Natural increase
(per 1000 population)
1980
2.5 2.7
1.1 0.3
-1.1 6.3 7.5 4.7
11.9 1.5 0.2 4.7
-0.2 6.5 3.9 0.6 1.6
2001
1.0* 1 .0*
1.0 1.3
-1.1 p
-0,0 p
1.1 " 4.0 " 7.3 '
- 0 .2 ' 3.9 3.9 0.1 0.7 1.5
-0.3 1.1
2002
0 .8* 0 .8*
0.7 p
1.0 -1.5" -0.2" 1.1 ' 3.7 p
7.9" -0 .5 ' 3.6 3.7 p
0.3 e
0 .8 ' 1.2 0.1 1.0'
Net migration
(per 1000 population)
1980
1.7 2.0
-0.2 0.1 3.9 5.2 3.0 0.8
-0.2 0.1 3.7 3.6 1.2 4.3
-0.5 1.2
-0.6
2001
3 .0 * 3 . 1 *
3.5 2.2 3.3 p
3.2 p
6.0 p
1.0 p
7.4 ' 2 .2 ' 6.3 3.5 2.1 6.9 1.2 3.2 2.5
2002
2 . 6 ' 2 . 8 *
3.8 p
1.8 2 .7 ' 2 . 9 ' 5 .6 ' 1.1 p
7.3" 1.9' 5.9 1.7 p
2 . 1 * 6.7" 1.0 3.5 1.8"
Total increase
(per 1000 population)
1980
4.2 4.7
0.8 0.4 2.8
11.5 10.5 5.5
11.8 1.6 3.8 8.3 1.0
10.8 3.4 1.8 1.0
2001
4 . 0 ' 4 . 1 *
4.5 3.6 2.2 ° 3 .2 " 7.1 5.1 p
14.7* 1.9'
10.2 7.4 2.2 7.7 2.7 3.0 3.7
2002
3 . 4 ' 3 . 5 '
4.5 p
2.8 1.2* 2.8 p
6.8 4.8 p
15.2* 1.4 ' 9.5 5.4 p
2 . 4 * 7 . 5 ' 2.2 3.5 2 .8 "
Other Council of Europe Member States Albania Andorra Armenia Azerbaijan Bosnia and Herzegovina Bulgaria Croatia Cyprus Czech Republic Estonia Georgia Hungary Iceland Latvia Liechtenstein Lithuania Malta Moldova Norway Poland Romania Russian Federation San Marino Slovak Republic Slovenia Switzerland "The former Yug. Rep. of Macedonia" Turkey Ukraine
20.1 11.6 17.2 18.2 11.0 3.4 3.9
11.1 1.8 2.7 9.1 0.3
13.1 1.4 8.5 4.7 7.4 9.8 2.4 9.6 7.5 4.9 3.4 8.9 5.8 2.3
13.9 22.1
3.5
12.0 2
8.1 2.5 8.0
-5.6 " -1.9 4 .8"
-1.7 -4.3 -0.2 1
-3.4 8.3
-5.7 5.5 "
-2.5 2.4
-1.0 2.8 0.1 p
-1.8 p
-6.5 4.4
-0.2 -0.5 1.7 5.0
14.6 " -7.5
2.1 7.9 1.5
-5.8 p
4 . 0 ' -1.5 -3.9
-3.5 7.8 p
-5.3 5.4 p
-3.2 p
2.0 -1.7 2.4 p
-0.1 p
-2.7 p
-0.1 -0.6 p
1.5"
14.2 p
102.7 -2.7 -3.2
-16.4 0.0 0.2 0.4
-4.0 4.1
-1.1 -0.7 -2.7 1.0
-31.8 0.6
-19.1 1.4 0.9
-0.6 -0.8 0.4
70.2 -2.3 2.9 2.7 0.1 0.3 0.2
-3.8 2
-6.2 -3.2 -0.6
0.0 p
5.3 e
5.1 " -0.8 0.1
-30.7 1
1.0 3.0
-2.2 14.4 p
1.3 5.9
-1.0 1.8
-0.4 p
-0,0 p
0.5 40.1
0.2 2.5 6.2
-1.3 1.5 p
-1.0
-2.9 -0.4
0.0 p
10.5* 1.2 0.1
1.3 -1.2 p
-0.8 7.1 p
-0.6 p
4.8 -0.9 3.8 p
-0.5 " -0.1 p
0.2 1.1 p
6.7 p
1.4 p
114.2 14.5 15.0 -5.5 3.4 4.1
11.5 -2.2 6.8 8.0
-0.4 10.4 2.3
-23.2 5.3
-11.8 11.1 3.3 9.0 6.7 5.3
73.6 6.6 8.7 5.0
14.0 22.4
3.6
8.2 2
2 0 -0.7 7.4
-5.6 p
3.3 e
9 .9 ' -2.5 -4.2
-30.8 1
-2.5 11.3 -7.8 19.9 p
-1.6 8.2
-2.0 4.6
-0.3 p
-1.8 p
-6.0 44.5
0.0 2.0 7.9 3.7
16.1 p
-8.5
-0.8 7.5
-5.8
14.5 -0.3 -3.8
-2.2 6.6
-6.1 12.4 -3.8 6.7
-2.6 6.2
-0.6 -2.8
0.0 0.5 8.2
15.7
Council of Europe non-Member States Belarus Serbia and Montenegro
Other countries/regions United States of America Japan Other more developed countries India China Other less developed countries
6.1 8.6
7.5 7.6
21.2
-4.9 1.6 3
5.5 1.5 4.6
15.5 6.7
18.2
-5.8 1.2 3"
5.6 1.3 4.4
15.2 6.4
17.8
1.5 6.2
3.6 0.2
0.0
0.9 0.0 3
3.8 0.0 5.3
-0.1 -0.1 -0.4
0.6 0.0 3 '
3.6 0.0 5.3
-0.1 -0.2 -0.4
7.6 14.9
11.1 7.8
21.2
-4.0 1.6 3
9.4 1.4 9.9
15.4 6.6
17.7
-5.3 1.2 3"
9.2 1.3 9.7
15.1 6.2
17.4
ρ provisional data; * national estimate (including in small instances projections); e Eurostat estimate. 12000 21999;3does not include Kosovo and Metohija. Sources: Eurostat, Council of Europe, US Bureau of the Census - International Program Center.
Statistics in focus — Theme 3 — 20/2003 m eurostat

Table 3: Fertility
COUNTRY/REGION
European Union
Eurozone
Belgium
Denmark
Germany
Greece
Spain
France
Ireland
Italy
Luxembourg
Netherlands
Austria
Portugal
Finland
Sweden
United Kingdom
Crude birth rate
(per 1000 population)
1980
13.0
13.0
12.6
11.2
11.1
15.4
15.3
14.9
21.8
11.3
11.4
12.8
12.0
16.2
13.2
11.7
13.4
2001
1 0 . 6 '
10 .4*
11.1
12.2
8.9 p
9.7 p
10.0 p
13.0 p
1 5 . 0 '
9 . 2 '
12.4
12.6
9.3
11.0
10.8
10.3
11.2
2002
10.6*
10 .4 '
11.0 p
11.9
8.8 '
9 .3 '
10.1 "
12.8 p
15.4*
9.4'
12.0
12.6 p
9 . 7 '
11.0 '
10.7
10.7
11.3 "
Total fertility rate
(children per woman)
1980
1.82
1.79
1.68
1.55
1.56
2.21
2.20
1.95
3.25
1.64
1.49
1.60
1.62
2.18
1.63
1.68
1.90
2001
1.46 '
1.42*
1.64 '
1.75
1.35 p
1.25 p
1.24 p
1.89 p
1.98 p
1.25'
1.65
1.71
1.33
1.46
1.73
1.57
1.65 p
2002
1 .47 '
1 .43 '
1.64 e
1.73
1.40'
1.25"
1.25'
1.88 p
2.01 p
1.26'
1.63
1.73 p
1.37*
1.42 p
1.72
1.65
1.64'
Live births outside marriage
(as % of total live births)
1980
9.6
8.4
4.1
33.2
11.9
1.5
3.9
11.4
5.0
4.3
6.0
4.1
17.8
9.2
13.1
39.7
11.5
2001
28.6*
25.1 *
27.5 e
44.6
25.0
4.3
19.0 e
43.7
31.2 p
10.0 e
22.2
27.2
33.1
23.8
39.5
55.5
40.1
2002
44.6
2 5 . 0 '
3 . 9 '
31.1 p
23.2
28.9 p
33.8
25.5 p
39.9
56.0
40.6 p
Other Council of Europe Member States
Albania
Andorra
Armenia
Azerbaijan
Bosnia and Herzegovina
Bulgaria
Croatia
Cyprus
Czech Republic
Estonia
Georgia
Hungary
Iceland
Latvia
Liechtenstein
Lithuania
Malta
Moldova
Norway
Poland
Romania
Russian Federation
San Marino
Slovak Republic
Slovenia
Switzerland
"The former Yug. Rep. of Macedonia"
Turkey
Ukraine
Council of Europe non-Member States
Belarus
Serbia and Montenegro
Other countries/regions
United States of America
Japan
Other more developed countries
India
China
Other less developed countries
26.5
15.7
22.7
25.2
17.3
14.5
14.9
20.4
14.9
15.0
17.6
13.9
19.8
14.1
15.4
15.2
17.3
19.8
12.5
19.6
18.0
15.9
11.2
19.1
15.7
11.7
21.1
31.7
14.8
16.0
17.7
16.0
13.8
34.8
17.0 2
11.7
10.0
13.6
8.6 p
9.2
11.7*
8.9
9.3
8.0 1
9.5
14.4
8.3
12.1 p
9.1
9.8
10.0
12.6
9.6 p
10.1 p
9.1
11.4
9.5
8.8
10.2
13.3
21.7 p
7.6
9.2
12.2 3
14.2
9.6
12.0
24.3
13.4
27.5
10.0
13.5
9.2 p
8.5 p
11.1 "
9.1
9.6
9.5
14.1 p
8.6
11.7 p
8.7 p
9.6
9.9
12.2
9.3 p
9.6 p
9.5
8.8 p
9.9 p
21.3 p
8.9
12.4 3
"
14.2
9.6
11.9
23.8
13.1
27.2
3.62
2.34
3.20
1.90
2.05
1.93
2.46
2.10
2.02
2.21
1.92
2.48
1.90
1.75
2.00
1.99
2.39
1.72
2.28
2.45
1.90
1.46
2.32
2.11
1.55
2.45
4.36
1.95
2.00
2.26
1.80
1.80
4.70
2.10 2
1.32
1.02
1.83
1.40
1.24
1.38
1.57'
1.15
1.34
1.35 1
1.31
1.95
1.21
1.60 p
1.29
1.51 "
1.26
1.78
1.29
1.20
1.25
1.24 "
1.20
1.21
1.41
1.73
2.52 p
1.10 2
1.27
1.71 3
2.05
1.36
1.68
3.04
1.69
1.84
1.23 p
1.17'
1.37
1.30 p
1.93 p
1.30*
1.50 p
1.22'
1.75
1.20 p
1.31 '
1.39 p
2.46 p
1.22"
2.06
1.37
1.68
2.98
1.69
4 . :
3.C
5.4
10.Ç
5.1
O i
5.e
18.2
4.7
7.1
39.7
12.2
5.;
6.C
1.1
7.4
14.2
4.7
ιο.ε
5.7
13.1
4.7
6.1
2.£
8.Ε
6.4
10.1
18.4
ο.ε
15.2
6.6
10.6
42.C
9.4
2.2
23.e
56.2
44.4
30.2
63.1
42.1
15.2
25.4
12.£
22.Ε
49.7
13.1
26.7
28.2
7.Ç
19.2
39.4
11.4
10.4
18.C
20.Ε
20.2
13.2
7.6
7.6 ρ
43.4 ρ
1 ':
25.3
56.3
: 31.4
62.3 ρ
43.1 ρ 13.1
ρ
27.9 ρ
15.0
22.9
50.3
14.4
26.7
: 21.6
39.8 ρ
9.8 ρ
:
21.4 3
ρ provisional data; * national estimate (including in small Instances projections); e Eurostat estimate. 1 2000
21999;
3 does not include Kosovo and Metohija.
Sources: Eurostat, Council of Europe, US Bureau of the Census - International Program Center.
eurostat 20/2003 — Theme 3 — Statistics in focus

Table 4: Mortality
COUNTRY/REGION
European Union
Eurozone
Belgium
Denmark
Germany
Greece
Spain
France
Ireland
Italy
Luxembourg
Netherlands
Austria
Portugal
Finland
Sweden
United Kingdom
Crude death rate
(per 1000 population)
1980
10.5
10.3
11.5
10.9
12.2
9.1
7.7
10.2
9.8
9.8
11.3
8.1
12.2
9.7
9.3
11.0
11.7
2001
9 . 6 *
9 . 4 '
10.1
10.9
10.1 p
9.7 p
8.9 p
9.0 p
7.7 '
9.5 '
8.4
8.7
9.2
10.2
9.4
10.5
10.0
2002
9 .8 *
9 .6 *
10.3 p
10.9
10.2"
9.5 '
9 .0 '
9.1 p
7.5*
9 .9 '
8.4
8.9 p
9.4 e
10.2"
9.5
10.6
10 .3 '
Infant mortality rate
(per
1980
12.4
12.5
12.1
8.4
12.4
17.9
12.3
10.0
11.1
14.6
11.5
8.6
14.3
24.3
7.6
6.9
12.1
1000 live births)
2001
4 . 7 *
4 . 5 '
4.5
4.9
4.3
5.1
3.5 p
4.5 p
5.8 p
4.7 p
5.9
5.4
4.8
5.0
3.2
3.7
5.5
2002
4 . 5 *
4 . 4 *
4.9 p
4.4
4 . 3 '
5 .9 '
3 .4*
4.5 e
5.1 p
4 . 7 *
5.1
5.1 p
4.1
5.0 p
3.0
2.8
5.3 p
Life expectancy at birth
males
1980
70.5
70.4
70.0
71.2
69.6
72.2
72.5
70.2
70.1
70.6
69.1
72.7
69.0
67.7
69.2
72.8
70.2
2002
75.5 1
*
75.4 1
'
74.5 1
74.7
74.8 5
75.4"
75.7 p
75.6 p
73.0 p
76.8 '
75.3 1
75.9 p
75.6 1
73.4 p
74.9
77.7
75.7 1p
females
1980
77.2
77.4
76.8
77.3
76.1
76.8
78.6
78.4
75.6
77.4
75.9
79.3
76.1
75.2
77.6
78.8
76.2
2002
81.6 ' ·
81.8 ' *
80.8 1
79.2
80.8 5
80 .7 '
83.1 p
82.9 p
78.5 p
82 .9 '
80.8 1
80.6 p
81.6 1
80.4 p
81.5
82.1
80.4 1p
Other Council of Europe Member States
Albania
Andorra
Armenia
Azerbaijan
Bosnia and Herzegovina
Bulgaria
Croatia
Cyprus
Czech Republic
Estonia
Georgia
Hungary
Iceland
Latvia
Liechtenstein
Lithuania
Malta
Moldova
Norway
Poland
Romania
Russian Federation
San Marino
Slovak Republic
Slovenia
Switzerland
"The former Yug. Rep. of Macedonia"
Turkey
Ukraine
6.4
4.2
5.5
7.0
6.4
11.1
10.9
9.3
13.1
12.3
8.5
13.6
6.7
12.8
6.9
10.5
9.9
10.1
10.1
9.9
10.4
11.0
7.8
10.1
9.9
9.4
9.6
11.4
4.9 3
3.6
7.5
5.6
14.2 p
11.1
6 .9 "
10.5
13.6
8.2 2
13.0
6.1
14.0
6.6 p
11.6
7.5
11.0
9.7
9.5
11.9 "
15.6
7.1
9.7
9.3
8.5
8.3
7.1 p
15.1
8.0
5.7
7.6 p
14.2 p
7.1 "
10.6
13.5
13.1
6.3 p
13.9
6.4 p
11.8 p
7.7
11.6
9.9 p
9.4 p
12.3 p
9.6
9.3 p
8.5 p
7.1 p
51.9
26.2
30.3
31.5
20.2
20.6
12.0
16.9
17.1
25.4
23.2
7.7
15.3
7.6
14.5
15.2
35.0
8.1
25.4
29.3
22.0
20.9
20.9
15.3
9.1
54.2
95.4
16.6
15.7 3
2.6
15.5
12.7
7.6
14.4
7.7
4 . 9 '
4.0
8.8
11.8
8.1
2.7
11.0
-7.9
4.4
16.4
3.9
7.7
18.4
14.6
3.2
6.2
4.2
5.0
11.9
38.7"
11.4
14.0
12.6
9.1 p
13.2 p
4.1
5.7
7.2
2.2 p
9.8
2.5 p
7.9 p
6.0
14.8
7.5
17.3
7.6
3.9 p
4.5 p
67.7
69.5
64.5
67.9
68.7
66.6
72.3
66.8
64.1
67.0 s
65.5
73.4
63.6
65.5
68.5
72.3
66.9
66.5
61.5 8
73.2
66.8
67.4
72.8
68.1
59.2
64.6 7
71.7 3
71.0 1
69.4
71.3 1
68.5 1
70.5 2
76.1 1
72.1 '
65.2 p
68.6 3
68.3
78.5 p
65.5 '
65.9 '
75.8
64.5 1
76.2 1
70.2 1
67.2
58.5 '
77.4 2
69.5 1
72.1 1
77 .2 '
70.5 3
66.2 p
63.0 4
72.2
75.7
72.2
72.9
74.0
74.2
77.0
73.9
74.1
74.8 6
72.7
80.1
74.2
75.4
72.7
79.2
75.4
71.8
73.1 8
79.1
74.3
75.2
79.6
71.8
64.8
74.0 7
76.4 3
75.9 1
75.0
76.7 1
75.2 1
77.8 2
8 1 . 0 '
78.5"
77.0 p
75.6 3
76.6
82.3 p
7 7 . 0 '
77.4 1
80.5
71.8 1
81.5 1
78.4 1
74.3
71 .9 '
84.0 2
77.6 1
79.6 1
82.8 1
75.3 3
70.9 p
74.0 4
Council of Europe non-Member States
Belarus
Serbia and Montenegro
Other countries/regions
United States of America
Japan
Other more developed countries
India
China
Other less developed countries
9.9
9.1
8.6
6.2
13.6
14.1
10.6 9
8.7
8.2
7.4
8.7
6.7
9.3
14.8
11.2 9"
8.5
8.4
7.5
8.6
6.7
9.3
16.2
33.3
12.6
7.5
116.4
9.1
13.1
7.0
3.3
5.1
63.1
27.4
64.5
7.8
12.4 9p
6.9
3.3
5.1
61.3
26.3
65.1
65.9
70.0
73.3
52.9
66.7
62 .3 '
70.1 1 9
74.1
77.5
76.5
62.6
70.1
75.5
77.4
78.8
52.1
68.9
74.1 '
75.2 1 9
79.7
84.3
83.0
64.0
74.0
ρ provisional data; * national estimate (including in small instances projections); e Eurostat estimate 1 2001
;22000;
3 1999;
4 1998;
51998/2000;
6 1980-81;
71979-80;
81977-86;
s does not include Kosovo and Metohija.
Sources: Eurostat, Council of Europe, US Bureau of the Census - International Program Center.
Statistics in focus — Theme 3 — 20/2003 ■ eurostat
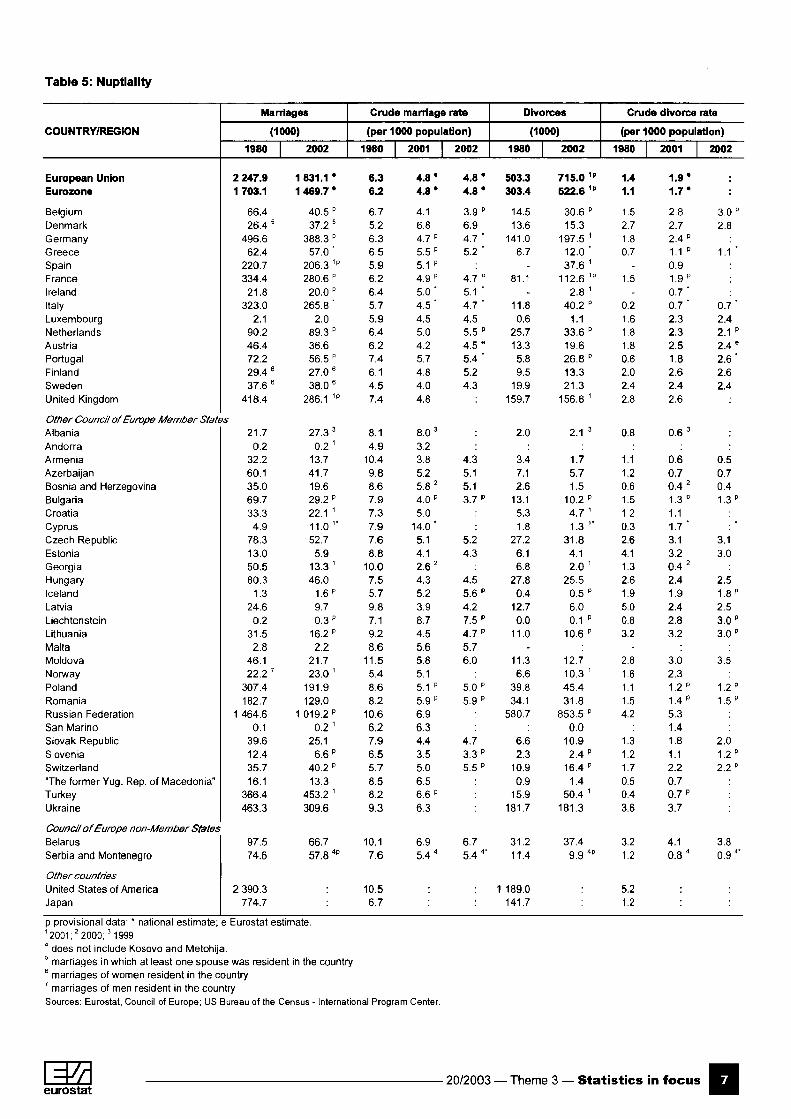
Table 5: Nuptiality
COUNTRY/REGION
European Union Eurozone
Belgium Denmark Germany Greece Spain France Ireland Italy Luxembourg Netherlands Austria Portugal Finland Sweden United Kingdom
Marriages
(1000)
1980
2 247.9 1 703.1
66.4 26.4 5
496.6 62.4
220.7 334.4
21.8 323.0
2.1 90.2 46.4 72.2 29.4 6
37.6 6
418.4
2002
1 831.1 * 1 469.7 *
40.5 p
37.2 5
388.3 p
57 .0 ' 206.3 1p
280.6 p
20.0 p
265.8 ' 2.0
89.3 p
36.6 56.5 " 27.0 6
38.0 6
286.1 1p
Crude marriage rate
(per 1000 population)
1980
6.3 6.2
6.7 5.2 6.3 6.5 5.9 6.2 6 4 5.7 5.9 6.4 6.2 7.4 6.1 4.5 7.4
2001
4 . 8 ' 4 . 8 '
4.1 6.8 4.7 p
5.5 p
5.1 p
4.9 p
5.0" 4.5" 4.5 5.0 4.2 5.7 4.8 4.0 4.8
2002
4 . 8 * 4 . 8 *
3.9 p
6.9 4.7 * 5 . 2 '
4.7 p
5.1 ' 4.7 * 4.5 5.5 p
4.5 e
5 . 4 ' 5.2 4.3
Divorces
(1000)
1980
503.3 303.4
14.5 13.6
141.0 6.7
-81.1
-11.8 0.6
25.7 13.3
5.8 9.5
19.9 159.7
2002
715.0 1p
522.6 1p
30.6 p
15.3 197.5 1
1 2 . 0 ' 37.6 1
112.6 1p
2.8 1
40.2 p
1.1 33.6 p
19.6 26.8 p
13.3 21.3
156.8 1
Crude divorce rate
(per 1000 population)
1980
1.4 1.1
1.5 2.7 1.8 0.7
-1.5
-0.2 1.6 1.8 1.8 0.6 2.0 2.4 2.8
2001
1 .9 · 1 . 7 '
2.8 2.7 2.4 p
1.1 p
0.9 1.9 p
0.7" 0.7" 2.3 2.3 2.5 1.8 2.6 2.4 2.6
2002
3.0 p
2.8
1.1 "
0 . 7 ' 2.4 2.1 p
2.4 e
2 . 6 ' 2.6 2.4
ρ provisional data; * national estimate; e Eurostat estimate. 1 2001 ;2 2000;31999 4 does not include Kosovo and Metohija. 5 marriages in which at least one spouse was resident in the country b marriages of women resident in the country ' marriages of men resident in the country Sources: Eurostat, Council of Europe; US Bureau of the Census - International Program Center.
Other Council of Europe Member States Albania Andorra Armenia Azerbaijan Bosnia and Herzegovina Bulgaria Croatia Cyprus Czech Republic Estonia Georgia Hungary Iceland Latvia Liechtenstein Lithuania Malta Moldova Norway Poland Romania Russian Federation San Marino Slovak Republic Slovenia Switzerland "The former Yug. Rep. of Macedonia" Turkey Ukraine
21.7 0.2
32.2 60.1 35.0 69.7 33.3
4.9 78.3 13.0 50.5 80.3
1.3 24.6
0.2 31.5
2.8 46.1 22.2 7
307.4 182.7
1 464.6 0.1
39.6 12.4 35.7 16.1
366.4 463.3
27.3 3
0.2 1
13.7 41.7 19.6 29.2 p
22.1 1
11.0 1" 52.7
5.9 13.3 1
46.0 1.6 p
9.7 0.3 p
16.2 p
2.2 21.7 23.0 1
191.9 129.0
1 019.2 p
0.2 1
25.1 6.6 p
40.2 p
13.3 453.2 1
309.6
8.1 4.9
10.4 9.8 8.6 7.9 7.3 7.9 7.6 8.8
10.0 7.5 5.7 9.8 7.1 9.2 8.6
11.5 5.4 8.6 8.2
10.6 6.2 7.9 6.5 5.7 8.5 8.2 9.3
8.0 3
3.2 3.8 5.2 5.8 2
4.0 p
5.0 14.0*
5.1 4.1 2.6 2
4.3 5.2 3.9 8.7 4.5 5.6 5.8 5.1 5.1 p
5.9 p
6.9 6.3 4.4 3.5 5.0 6.5 6.6 p
6.3
4.3 5.1 5.1 3.7 p
5.2 4.3
4.5 5.6 p
4.2 7.5 p
4.7 p
5.7 6.0
5.0 p
5.9 p
4.7 3.3 p
5.5 p
2.0
3.4 7.1 2.6
13.1 5.3 1.8
27.2 6.1 6.8
27.8 0.4
12.7 0.0
11.0 -
11.3 6.6
39.8 34.1
580.7
6.6 2.3
10.9 0.9
15.9 181.7
2.1 3
1.7 5.7 1.5
10.2 p
4.7 1
1.3 1 ' 31.8
4.1 2.0 '
25.5 0.5 p
6.0 0.1 p
10.6 p
12.7 10.3 1
45.4 31.8
853.5 p
0.0 10.9 2.4 p
16.4 p
1.4 50.4 1
181.3
0.8
1.1 1.2 0.6 1.5 1.2 0.3 2.6 4.1 1.3 2.6 1.9 5.0 0.8 32
-2.8 1.6 1.1 1.5 4.2
1.3 1.2 1.7 0.5 0.4 3.6
0.6 3
0.6 0.7 0.4 2
1.3 p
1.1 1.7* 3.1 3.2 0.4 2
2.4 1.9 2.4 2.8 3.2
3.0 2.3 1.2 p
1.4 p
5.3 1.4 1.8 1.1 2.2 0.7 0.7 p
3.7
0.5 0.7 0.4 1.3 p
:" 3.1 3.0
2.5 1.8 p
2.5 3.0 p
3.0 p
3.5
1.2 p
1.5 p
2.0 1.2 p
2.2 p
Council of Europe non-Member States Belarus Serbia and Montenegro
Other countries United States of America Japan
97.5 74.6
2 390.3 774.7
66.7 57.8 4p
10.1 7.6
10.5 6.7
6.9 5.4 4
6.7 5.4 4 '
31.2 11.4
1 189.0 141.7
37.4 9.9 4p
3.2 1.2
5.2 1.2
4.1 0 . 8 "
3.8 0.9 4 '
eurostat 20/2003 — Theme 3 — Statistics in focus

Further information: > Databases
New Cronos, Theme 3, Domain: demo
To obtain information or to order publications, databases and special sets of data, please contact the Data Shop network:
D A N M A R K D E U T S C H L A N D E S P A N A F R A N C E ITALIA - R o m a
DANMARKS STATISTIK
Bibliotek og Information
Eurostat Data Shop
Sejrøgade 11
DK-2100 KØBENHAVN 0
Tlf. (45)3917 30 30
Fax (45) 39 17 30 03
E-mail: [email protected]
URL:: http://viww.dst.dlt/bibliotak
STATISTISCHES BUNDESAMT
Eurostat Data Shop Barlin
Otto-Braun-Straße 70-72
(Eingang: Karl-Marx-Allee)
D-10178 BERLIN
Tel. (49) 1888-644 94 27/28
(49)61175 94 27
Fax (49) 1888-644 94 30
E-Mail: [email protected]
URL:http://www.eu-datashop.de/
ME Eurostat Data Shop
Paseo de la Castellana, 183
Despacho 011Β
Entrada por Estébanez Calderón
E-28046 MADRID
Tel (34) 915 839 167/ 915 839 500
Fax (34) 915 830 357
E-mall: [email protected]
URL: http://www.ine.es/prodyser/datashop/
index htm!
INSEE Info Service
Eurostat Data Shop
195, ruede Bercy
Tour Gamma A
F-75582 PARIS CEDEX 12
Tél. (33) 153 17 88 44
Fax (33) 153 17 88 22
E-mail: [email protected]
(STAT
Centro dl Informazione Statistica
Seda di Roma, Eurostat Data Shop
Via Cesare Balbo, 11a
1-00184 ROMA
Tel. (39) 06 46 73 32 28
Fax (39) 06 46 73 31 01/07
E-mail: [email protected]
URL: http://www.istat.it/Prodotti-
e/Allegati/Euros tatdatashop.html
ITALIA-Milano NEDERLAND NORGE PORTUGAL SCHWELZ/SUISSE/SVIZZERA
ETAT
Ufficio Regionale per la Lombardia
Eurostat Data Shop
Via Fieno 3
1-20123 MILANO
Tel. (39) 02 80 61 32 460
Fax (39) 02 80 61 32 304
E-mall: [email protected]
URL: http://www.istat it/Prodotti-
e/Allegati/Eurostatdatashop.html
Centraal Bureau voor de Statistia k
Eurostat Data Shop-Voorburg
Postbus 4000
2270 JM VOORBURG
Nederland
Tel. (31-70)337 49 00
Fax (31-70) 337 59 84
E-mail: [email protected]
URL: www.cbs.nl/eurodatashop
Statistici Norway
Library and Information Centre
Eurostat Data Shop
Kongens gate 6
Boks 8131 Dep.
N-0033 OSLO
Tel (47) 21 09 46 42/43
Fax (47) 21 09 45 04
E-mail: [email protected]
URL: http://www.ssb.no/biblioteket/datashop/
Eurostat Data Shop Lisboa
INE/ServlcodeD!hjsåo
Av. Antonio José de Almeida, 2
P-1000-043 LISBOA
Tel.(351)21842 6100
Fax (351) 21 842 63 64
E-mall: [email protected]
Statistisches Amt des Kantons
Zürich, Eurostat Data Shop
Bleicherweg 5
CH-8090 Zürich
Tel. (41)12251212
Fax (41) 1225 12 99
E-mail: [email protected]
URL: http://www.statlstlk.zh.ch
S U O M I / F I N L A N D S V E R I G E UNITED K I N G D O M UNITED S T A T E S O F A M E R I C A
STATISTICS FINLAND
Eurostat Data Shop Helsinki
PL2B
FIN-00022 Tilastokeskus
Työpajakatu 13 B, 2. kerros. Helsinki
P. (358-9) 17 34 22 21
F. (358-9)17 34 22 79
Sähköposti: datashop@stat fi
URL: http://tilastokeskus fi/tk/kk/datashop/
STATISTICS SWEDEN
Information service
Eurostat Data Shop
Karlavägen 100-Box 24 300
S-104 51 STOCKHOLM
Tfn (46-8) 50 69 48 01
Fax (46-8) 50 69 48 99
E-post: ¡[email protected]
URL:http://www.scb.se/tjanster/datasho
p/datashop.asp
Eurostat Data Shop
Office for National Statistics
Room 1.015
Cardiff Road
Newport NP10 8XG
South Wales
United Kingdom
Tel. (44-1633) 81 33 69
Fax (44-1633) 81 33 33
E-mail: eurostat [email protected] uk
HAVER ANALYTICS
Eurostat Data Shop
60 East 42nd Street
Suite 3310
NEWYORK, NY 10165
USA
Tel. (1-212) 986 93 00
Fax (1-212) 986 69 81
E-mail: [email protected]
URL: http://www.haver.com/
Media Support Eurostat (for professional Journalists only):
Bech Building Office Α4.Ό17 ■ L-2920 Luxembourg · Tel (352) 4301 33408 · Fax (352) 4301 35349 ■ e-mail: [email protected]
For information on methodology:
This publication has been produced jointly with NiDi (for Eurostat) and David Pearce (for the Council of Europe).
For further information, contact François-Carlos Bovagnet, Eurostat/E4, L-2920 Luxembourg, Tel. (352) 4301 33527, Fax (352) 4301 34029,
E-mail: [email protected]
ORIGINAL: English
Please visit our web site at www.europa.eu.int/coinm/eurostat/ for further information!
A list of worldwide sales outlets is available at the Office for Official Publications of the European Communities
2 rue Mercier - L-2985 Luxembourg
Tel. (352) 2929 42118 Fax (352) 2929 42709
URL: http://publications.eu.int
E-mail: [email protected]
BELGIQUE/BELGIE - DANMARK - DEUTSCHUND - GREECE/ELLADA - ESPANA - FRANCE - IRELAND - ITALIA - LUXEMBOURG - NEDERLAND - OSTERREICH
PORTUGAL - SUOMI/FINLAND - SVERIGE - UNITED KINGDOM - ¡SLAND - NORGE - SCHWEIZ/SUISSE/SVIZZERA - BALGARIJA - CESKÂ REPUBLIKA - CYPRUS
EESTI - HRVATSKA - MAGYARORSZÂG - MALTA - POLSKA - ROMANIA - RUSSIA - SLOVAKIA - SLOVENIA - TÜRKIYE - AUSTRALIA - CANADA - EGYPT - INDIA
ISRAEL - JAPAN - MALAYSIA - PHILIPPINES - SOUTH KOREA - THAILAND - UNITED STATES OF AMERICA
Order form κ
ι would like to subscribe to Statistics in focus (from 1.1.2003 to 31.12.2003):
(for the Data Shop and sales office addresses see above)
All 9 themes (approximately 200 issues)
□ Paper: EUR 240
Language required: □ DE Π EN □ FR
Statistics in focus can be downloaded (pdf file) free of charge from the Eurostat
web site. You only need to register. For other solutions, contact your Data
Shop.
□ Please send me a free copy of 'Eurostat mini-guide' (catalogue
containing a selection of Eurostat products and services)
Language required: Π DE □ EN □ FR
α I would like a free subscription to 'Statistical References', the information
letter on Eurostat products and services
Language required: □ DE □ EN □ FR
Π Mr □ Mrs
(Please use block capitals)
Surname:
Company:
Function:
□ Ms
Forename:
Department:
Address:
Postcode:
Country:
Tel.:
E-mail:
Town:
Fax:
Payment on receipt of invoice, preferably by:
Π Bank transfer
Π Visa □ Eurocard
Card No: Expires on: _
Please confirm your intra-Community VAT number:
hf no number is entered, VAT will be automatically applied. Subsequent
reimbursement will not be possible.
/