first scattered light detection of a nearly edge-on ... · ry lup in the 890 micron dust continuum...
TRANSCRIPT

Astronomy & Astrophysics manuscript no. 31624corr c©ESO 2018February 13, 2018
First scattered light detection of a nearly edge-on transition diskaround the T Tauri star RY Lup
M. Langlois1, 2 A. Pohl3, 4, A.-M. Lagrange5 , A.- L. Maire3, D. Mesa6, A. Boccaletti7, R. Gratton6, L. Denneulin1, 2, H.Klahr3, A. Vigan2, M. Benisty5, C. Dominik8, M. Bonnefoy5, F. Menard5, H. Avenhaus9, A. Cheetham10, R. Van
Boekel3, J. de Boer11, G. Chauvin5, S. Desidera6 , M. Feldt3, R. Galicher7, C. Ginski11, J. Girard2, T. Henning3, M.Janson12, 3, T. Kopytova7, Q. Kral7, 15, R. Ligi2, S. Messina13, S. Peretti10, C. Pinte5, E. Sissa6, T Stolker14, A. Zurlo2,
Y. Magnard5, P. Blanchard2, T. Buey7, M. Suarez16, E. Cascone17, O. Moller-Nilsson3, L. Weber10, C. Petit18, J. Pragt19
1 CRAL, UMR 5574, CNRS, Université Lyon 1, 9 avenue Charles André, 69561 Saint Genis Laval Cedex, Francee-mail: [email protected]@univ-lyon1.fr
2 Aix Marseille Université, CNRS, LAM (Laboratoire d’Astrophysique de Marseille) UMR 7326, 13388, Marseille, France3 Max Planck Institute for Astronomy, Königstuhl 17, D-69117 Heidelberg, Germany4 Heidelberg University, Institute of Theoretical Astrophysics, Albert-Ueberle-Str. 2, D-69120 Heidelberg, Germany5 Univ. Grenoble Alpes, CNRS, IPAG, F-38000 Grenoble, France6 INAF-Osservatorio Astronomico di Padova, Vicolo dell Osservatorio 5, 35122 Padova, Italy7 LESIA, Observatoire de Paris, PSL Research University, CNRS, Sorbonne Universités, UPMC Univ. Paris 06, Univ. Paris Diderot,
Sorbonne Paris Cité, 5 place Jules Janssen, 92195 Meudon, France8 Anton Pannekoek Institute for Astronomy, University of Amsterdam, Science Park 904, 1098 XH Amsterdam, The Netherland9 ETH Zurich, Institute for Astronomy, Wolfgang Pauli Strasse 27, CH 8093, Zurich, Switzerland
10 Observatoire Astronomique de l’Université de Genève, 51 Ch. des Maillettes, 1290 Versoix, Switzerland11 Leiden Observatory, Leiden University, P.O. Box 9513, 2300 RA Leiden, The Netherlands12 Department of Astronomy, Stockholm University, AlbaNova University Center, 10691 Stockholm, Sweden13 Osservatorio Astrofisico di Catania, Via S.Sofia 78, 95123 Catania ITALY14 Anton Pannekoek Institute for Astronomy, University of Amsterdam, Science Park 904, 1098 XH Amsterdam, The Netherlands15 Institute of Astronomy, University of Cambridge, Madingley Road, Cambridge CB3 0HA, UK16 European Southern Observatory, Karl-Schwarzschild-Strasse 2, 85748 Garching bei Munchen, Germany17 INAF, Astrophysical Observatory of Capodimonte, Salita Moiariello 16, 80131 Napoli, Italy18 ONERA, 29 avenue de la Division Leclerc, 92322 Chatillon Cedex, France19 NOVA Optical-Infrared Instrumentation Group at ASTRON, Oude Hoogeveensedijk 4, 7991 PD Dwingeloo, The Netherlands
February 13, 2018
ABSTRACT
Context. Transition disks are considered sites of ongoing planet formation, and their dust and gas distributions could be signposts ofembedded planets. The transition disk around the T Tauri star RY Lup has an inner dust cavity and displays a strong silicate emissionfeature.Aims. Using high-resolution imaging we study the disk geometry, including non-axisymmetric features, and its surface dust grain, togain a better understanding of the disk evolutionary process. Moreover, we search for companion candidates, possibly connected tothe disk.Methods. We obtained high-contrast and high angular resolution data in the near-infrared with the VLT/SPHERE extreme adaptiveoptics instrument whose goal is to study the planet formation by detecting and characterizing these planets and their formationenvironments through direct imaging. We performed polarimetric imaging of the RY Lup disk with IRDIS (at 1.6 µm), and obtainedintensity images with the IRDIS dual-band imaging camera simultaneously with the IFS spectro-imager (0.9–1.3 µm).Results. We resolved for the first time the scattered light from the nearly edge-on circumstellar disk around RY Lup, at projectedseparations in the 100 au range. The shape of the disk and its sharp features are clearly detectable at wavelengths ranging from 0.9to 1.6 µm. We show that the observed morphology can be interpreted as spiral arms in the disk. This interpretation is supported byin-depth numerical simulations. We also demonstrate that these features can be produced by one planet interacting with the disk. Wealso detect several point sources which are classified as probable background objects.
Key words. Protoplanetary disks – Exoplanets – Techniques: Angular differential imaging –Techniques: Coronography – Tech-niques: Polarimetry – Hydrodynamics – Radiative transfer – Scattering
1. Introduction
High-resolution and high-contrast imaging capabilities providedby the new generation of adaptive optics based instruments suchas the Spectro-Polarimeter High-contrast Exoplanet REsearch
(SPHERE) instrument (Beuzit et al. 2008) and the Gemini PlanerImager (GPI) (Macintosh et al. 2014) open the path to directlyimage new protoplanetary disks in scattered light. Protoplanetarydisks are optically thick in the optical and near-infrared (NIR),so that scattered light imaging probes micron-sized dust grains
Article number, page 1 of 12
arX
iv:1
802.
0399
5v1
[as
tro-
ph.E
P] 1
2 Fe
b 20
18

A&A proofs: manuscript no. 31624corr
in the disk’s surface layer, while mm observations trace larger,mm-sized grains located close to the disk’s mid-plane. Transi-tion disks (TD) with gas and dust gaps (e.g. Brown et al. 2007;Merín et al. 2010; van der Marel et al. 2016; Ansdell et al. 2016;van Boekel et al. 2017) are particularly interesting since theymight correspond to the stage where planet forming processesare active, thus we expect to see signposts of planet–disk in-teractions. The Atacama Large Millimeter Array (ALMA) nowprovides sufficient sensitivity and resolution at sub-mm wave-lengths to detect these gaps (Fedele et al. 2017) and to estimatethe mass of protoplanetary disks around YSOs (Ansdell et al.2016; Trapman et al. 2017), although the bulk mass (H2 andHe) is not directly observable. In recent observational studiesof transition disks, giant gaps and cavities have also been di-rectly imaged in scattered light (e.g. Thalmann et al. 2010, 2015;Hashimoto et al. 2012; Avenhaus et al. 2014; Follette et al. 2015;Ohta et al. 2016; Stolker et al. 2016; Benisty et al. 2017; Pohlet al. 2017; van Boekel et al. 2017). In addition, the detectionof non-axisymmetric disk features that could be related to thepresence of planets is fundamental in order to improve our cur-rent understanding of the disk evolution and the planet formationprocess. However, the small angular separations involved posegreat observational challenges.
RY Lup has been classified as a T Tauri G-type star show-ing type III variability located in the Upper Centaurus Lupus(UCL) association with an estimated age of 10 – 20 Myr (e.g.Manset et al. 2009; Pecaut et al. 2012). However, a colder ef-fective temperature of 5000 K and a best fit spectral type of K2have been estimated by Biazzo et al. (2017) in the most recentliterature based on X-Shooter spectroscopy. Its distance has beenestimated by recent measurements using GAIA (first GAIA datarelease, Gaia Collaboration et al. 2016), which provided a dis-tance estimate of 151pc ± 1 pc. RY Lup is a TD, as confirmedby Ansdell et al. (2016) using the ALMA data, but was not pre-viously identified as such from its SED (Manset et al. 2009). Thespectral energy distribution of RY Lup shows an infrared excess,as well as a modest UV excess (Evans et al. 1982; Gahm et al.1989). Its strong 10 µm silicate emission feature, seen in its IRSspectrum (Kessler-Silacci et al. 2006), washes out the mid-IR dipin its broad-band fluxes.
The photometric variability of the star has been revealed byWoods using Harvard plates in 1921. The star was classified asa typical RW Aur star (a variable eruptive T Tauri-type star) onthe basis of its light curve. From a long-term study of the opticalphotometry of the star, Gahm et al. (1989) reported significantphotometric variations (up to 1.5 mag at visible wavelengths) ontimescales of hours, a constant variability with a 3.75 day periodover 50 years, and a decline in the mean and maximum pho-tometric magnitudes over decades. This photometric behaviourof RY Lup is typical of type III variability defined by variablestellar obscuration by circumstellar dust. These stars are char-acterized by an increase in the degree of linear polarization asthe star becomes faint, supporting the idea that variable obscura-tion is responsible for the fading of the star. Historically the starhas been observed to be redder when it is at a fainter magnitude(Evans et al. 1982; Liseau et al. 1987; Hutchinson et al. 1989;Covino et al. 1992), and the amplitude of the variations also de-creases with wavelength. The intrinsic position angle of T Tauristar polarization is generally a function of both wavelength andtime (Bastien 1981, 1985). These authors also noticed remark-ably large and rapid variations in both polarization and positionangle in RY Lup. More recently, Manset et al. (2009) has in-vestigated these photometric and polarimetric variabilities usingsimultaneous BV polarimetric and UBV photometric observa-
tions. They showed that the polarization is high (3.0%) when thestar is faint and red (V = 12.0 mag, B - V = 1.3 mag), and low(0.5%) when it is bright and bluer (V = 11.0 mag, B -V = 1.1mag). The photometric and polarimetric variations share a com-mon period of 3.75 d. They concluded that linear polarization isproduced by dust scattering in an asymmetric (flat) circumstellarenvelope, and they explained the photometric and polarimetricvariations by an almost edge-on circumstellar disk that is warpedclose to the star, where it interacts with the star magnetosphere.They claim that the inhomogeneous disk matter contained in thewarp could be corotating with the star and could partially occultit during part of the rotation period, which explains the dips inluminosity and the accompanying increase in polarization. How-ever, the most recent estimate of vsini = 16.3 ± 5.3km/s from(Alcalá et al. 2017) is smaller than earlier measured. This im-plies that the stellar rotation axis has an inclination likely < 70deg. Therefore, the disk is probably misaligned with respect tothe star’s equatorial plane.
Recent ALMA high-resolution sub-mm observations ofRY Lup in the 890 micron dust continuum (Ansdell et al. 2016)provide a detailed map of the spatial distribution of large, mm-sized dust, at a linear spatial resolution of 35 au. They showa clear signature of an inner mm dust cavity with a diameterof 0.8” ( 60 au) and a clearly resolved dust ring. These contin-uum emission measurements constrain Mdust to less than 0.2 M�and additional CO isotopologue emission (13CO and C18O 3-2lines) constrain Mgas to less than 2.6 M�.The gas-to-dust ratiohas been estimated to be 5–50 when using their parameterizedmodel framework. Although the gas mass estimation may be un-derestimated due to their assumption of an ISM-like abundance,the weak CO isotopologue emission indicates rapid disk evolu-tion, either directly in the gas-to-dust ratio or chemically via per-manent loss of volatiles to solids. All previous works on RY Lupare consistent with a system comprising a star surrounded by anearly edge-on disk. Manset et al. (2009) estimate the mass ofRY Lup to M?/M�=1.4, with an age of 12 Myr. This region’sproximity and age makes it ideal for a baseline study of diskproperties.
Dodson-Robinson & Salyk (2011) demonstrate that transi-tional disks with wide cavities (>15 AU) and high accretionrate greater than 10−8M�/Yr presents unambiguous evidence fortidal clearing by multiple planets. The cavity formation can onlyoccur once evaporation rates exceed accretion rates, as otherwisethe hole will be replenished by accretion. Photoevaporation mod-els do not appear to be able to explain the existence of disks withsuch characteristics. The RY Lup disk clearly falls in that cat-egory with an estimated mass accretion rate 10−8.2M�/Yr fromGahm et al. (1993).
As part of the SPHERE guaranteed time observations dedi-cated to a large survey to search for planets and to study circum-stellar disks around members of young and nearby associations,we recently recorded high-contrast images of RY Lup. The dataresolve the disk for the first time in intensity in the near-infraredand in polarized light. This article presents the observational re-sults, and aims to develop qualitative arguments on the detecteddisk. In parallel to the observation, detailed numerical hydrody-namical simulations in the context of planet–disk interaction incombination with radiative transfer calculations were performedto study the disk morphology. We first describe the observationsand the data analysis (Sect. 2), then the results obtained on thedisk and the search for planets in this system (Sect. 3). This isfollowed by detailed numerical modelling of the disk (Sect. 4).
Article number, page 2 of 12

Langlois et al.: Transition Disk around the T Tauri star RY Lup
2. Observations and data reduction
2.1. Observations
All observations were part of the SPHERE consortium guaran-teed time programme (SPHERE High-Contrast Imaging Surveyfor Exoplanets and SPHERE Disk Survey). The Infra-Red Dual-beam Imager and Spectrograph (IRDIS, Dohlen et al. 2008) andIntegral Field Spectrograph (IFS, Claudi et al. 2008) were used.The first RY Lup datasets were recorded on 16 April 2016 withthe IRDIFS instrumental configuration, where observations aresimultaneously carried out with the IRDIS subsystem dual-bandimaging (DBI) mode using H2,H3 filters respectively centred at1.59 and 1.67 µm (Vigan et al. 2010), and the Integral FieldSpectrometer operating in YJ bands (0.95 – 1.35 µm) with aspectral resolution of 42 in Y band to 40 in J Band. Follow-ing the discovery of the disk in intensity, we obtained Dual-bandPolarimetric Imaging (DPI, Langlois et al. 2010) observations infield stabilized mode on 27 May 2016. IRDIS provides a 10–12′′ square field of view (1500–1800 square au, given the star’sdistance 151 pc, using 12.25 mas/pixel platescale i.e. 1.85 auper pixel). The IFS dataset consists of 21000 spectra each spreadover 5.1 x 41 pixels on the detector. After extraction, the FoVis 1.7′′ square and the spaxel size is 7.46 x 7.46 mas, i.e. 1.13au per pixel. We used an apodized Lyot coronagraph (Soummer2005; Boccaletti et al. 2008; Carbillet et al. 2011; Guerri et al.2011), including a 185 mas focal mask, as well as a pupil mask(N-ALC-YJH-S). The IRDIFS observations were performed inpupil stabilized mode in order to perform Angular DifferentialImaging (ADI) post-processing (Marois et al. 2006). The fieldrotation for this set of data is 73 degrees. The observing se-quences for both IRDIS and IFS can be summarized as follows:1) point spread function (PSF) imaging, including a small staroffset to displace the star away from the coronagraphic maskin order to record the unsaturated PSF which provides relativephotometric calibration (we note that a neutral density filter wasalso inserted to avoid saturation); 2) imaging of the star behindthe coronagraphic mask, with four crosswise faint replicas of thestar artificially generated using the deformable mirror (Langloiset al. 2013) used for fine monitoring of the star centre; and 3)science coronographic sequence. At the end of the observing se-quence, we repeated the first and second steps followed by a cal-ibration of the sky background, with detector integration times(DITs) corresponding to the DITs of the coronagraphic obser-vations. Finally, the true north (TN) and pixel plate scales weremeasured using the astrometric calibrator NGC3603 (Khorramiet al. 2016) observed as part of the standard SPHERE calibra-tion routines performed for the Guaranteed Time Observations(GTO) survey (Maire et al. 2016). More details on the datasetsare presented in Table 1. The observing conditions were verygood for all observing sequences. The Strehl ratio estimationprovided in Table 1 is based on an extrapolation of the phasevariance deduced from the reconstruction of the SPHERE Adap-tive Optics system open-loop data using deformable mirror andtip-tilt voltages, and wavefront sensor closed-loop data (Fuscoet al. 2004). The observing conditions and the different data re-duction methods for each dataset are described in more detail inSects. 2.2 and 2.3.
2.2. Intensity images using IRDIS-DBI (H2,H3 bands) andIFS (YJ band)
The IRDIS data were first corrected for cosmetics and sky back-ground using the SPHERE Data Reduction and Handling (DRH)
pipeline (Pavlov et al. 2008) implemented at the SPHERE DataCentre. The outputs include cubes of left and right images recen-tred onto a common origin (the centre of the field rotation) usingthe satellite spots. This preprocessing also includes backgroundsubtraction, bad-pixel interpolation, flat-field correction, distor-tion correction, and wavelength calibration (for IFS). After thesefirst steps, the best frames were selected according to their qual-ity, leading to the use of 72 frames out of 80 for IRDIS and of allthe available frames for IFS. The IRDIS frame selection criteriais based on the central coronagraphic spot flux being within a ±2σ deviation from the median value of the full sequence.
Following these steps the data were processed to removethe stellar halo (i.e. in order to achieve high-contrast) with theSpeCal pipeline (Galicher et al., in prep.) developed to reduceand analyse our GTO data from the SPHERE High-contrastImaging Survey for Exoplanets (SHINE) survey. This pipelineimplements a variety of ADI-based algorithms from which weused classical Angular Differential Imaging (cADI, Marois et al.2006), Template Locally Optimized Combination of Images(TLOCI, Marois et al. 2014), and reference differential imaging(RDI) using a compatible reference star from our SPHERE GTOtarget library. In parallel, the IFS data were also processed usingangular and spectral principal component analysis (PCA-ASDI)as described in Mesa et al. (2015). In the following we discussthe results based on the noADI (classical averaging with no sub-traction), cADI (see Fig. 1), and RDI for the disk morphology.On the other hand, the photometric analysis of the point sourcesis based on TLOCI since it delivers more accurate photometry(Galicher et al., in prep.)
2.3. IRDIS-DPI (BBH band)
The IRDIS-DPI observations of RY Lup were carried out on 27May 2016 with the BBH filter (1.625 µm, width= 290 nm) us-ing the same apodized pupil Lyot coronagraph (N-ALC-YJH-S) as for the IRDIFS observations. Sixty-four polarimetric cy-cles were taken, each consisting of one data cube for each ofthe four half wave plate (HWP) positions (0, 45, 22.5, 67.5 de-grees). Dedicated coronagraphic images were taken at the be-ginning and at the end of the science sequence to determine ac-curately the star centre behind the coronagraph using the fourcrosswise faint replicas created by the deformable mirror. TheIRDIS data were first corrected for cosmetics using the DRHpipeline implemented at the SPHERE Data Centre and follow-ing the same steps as the DBI data. The outputs include cubesof left and right images (parallel and perpendicular polarizedbeams, respectively) recentred onto a common origin. The datawere then reduced following the prescriptions of Avenhaus et al.(2014), using the azimuthal Stokes formalism (Qϕ, Uϕ) and rela-tive polarimetric measurements. The parallel and perpendicularpolarized images are combined to produce Q and U Stokes im-ages. To obtain clean Stokes Q and U images, that is to correctfor instrumental polarization downstream of the HWPs positionin the optical path, Q+ and Q- (0 and 45 degrees), and U+ and U-(22 and 67.5 degrees) are included in the image combination andused to compute the azimuthal Stokes components. The azimuthis defined with respect to the star position as shown by Canovaset al. (2015) and the Uϕ signal is very small for centrally sym-metric disks, but not for very inclined disks as shown by Pohlet al. (2017).
However, there might still be an instrumental polarizationleft upstream of the HWP in the final Q and U images, which isassumed to be proportional to the total intensity image as shownin Canovas et al. (2011). Since the RY Lup disk is inclined, the
Article number, page 3 of 12

A&A proofs: manuscript no. 31624corr
Table 1. Observational parameters
Date Mode DIT(s) x NDIT Seeing (”) Strehl (%) ADI FOV rotation (deg)2016-04-16 IRDIS DB-H23 64 x 80 0.25 78 712016-04-16 IFS YJ 64 x 80 0.25 78 742016-05-27 IRDIS DPI BB-H 32 x 256 0.3 68
-5.0 -4.5 -4.0 -3.5 -3.0 -2.5 -2.0
E
N
0.10 " 15 au
-4.0 -3.5 -3.0 -2.5 -2.0 -1.5 -1.0
E
N
0.10 " 15 au
-5.0 -4.5 -4.0 -3.5 -3.0 -2.5 -2.0
E
N
0.10 " 15 au
-4.0 -3.5 -3.0 -2.5 -2.0 -1.5 -1.0-4.0 -3.5 -3.0 -2.5 -2.0 -1.5 -1.0
E
N
0.10 " 15 au
Fig. 1. IRDIS cADI (top left) and noADI (top right) H2+H3 image normalized to the maximum of the unsaturated non-coronagraphic PSFshowing the close-in environment of RY Lup. cADI (bottom left) and noADI (bottom right) IFS YJ image normalized to the maximum of theunsaturated non-coronagraphic PSF showing the close-in environment of RY Lup. The dark central region corresponds to the area masked by thecoronagraph. The intensity scale is logarithmic. The orientation is standard: north is up and the east is towards the left
first standard reduction did not include Uϕ minimization of thesignal in an annulus around the central star. We also reducedthe IRDIS-DPI data with a new method based on an inverse ap-proach method (Denneulin et al., (in prep.)). This method alsoenables the use of any set of frames with incomplete polarimet-ric cycles. The method is based on an optimization using theelectric field (Jones Matrix) rather than the intensity (Muellermatrix) and relies on the inverse approach (i.e. fitting a model ofthe data to the observed dataset) which is significantly less biasedand more efficient at minimizing instrumental artefacts. No as-sumptions about the angle of linear polarization of the source aremade to correct for the instrumental polarization. The methodis based on the use of an instrumental model describing the ef-fect of the instrument on the incident electromagnetic field. Theelectric field is divided into non-polarized and polarized compo-nents,
Ik = ‖vk‖2ρ + |〈vk,m〉|2 + noise,
where Ik is the flux measured on the detector, ρ is the non-polarized intensity (unknown), m is the electric field linearlypolarized (unknown), and v describes the effect of the instru-
ment/telescope for a given half wave plate polarizer position.The model describes every polarimetric measurement and thepolarized intensity is obtained by solving for both polarized andunpolarized components of the electrical field for every pixel in-dividually using the criteria
minm, ρ
∑k
ωk
2
∥∥∥‖vk‖2ρ + |〈vk,m〉|2 − Ik
∥∥∥2,
where ωk is a weighting factor calculated from the inverse ofthe noise variance. The derived Qϕ and Uϕ estimations usingthis latest method is similar to the standard reduction we haveperformed, but the estimation of the polarization angles is moreaccurate. In the RY Lup case the disk is very bright which makesthe level of instrumental polarization left in the Qϕ and Uϕ im-ages very small compared to the disk signal, and we concludethat the disk morphology is not affected by these polarimetricresiduals. The Qϕ and Uϕ images are displayed in Fig. 2 andFig. 3. Figure 4 shows the polarized intensity overplotted withpolarization vectors representing the angle of linear polarization.This strengthens the hypothesis that there is a clear departurefrom azimuthal polarization in inclined disks such as RY Lup.
Article number, page 4 of 12

Langlois et al.: Transition Disk around the T Tauri star RY Lup
Fig. 2. IRDIS DPI Qϕ (left) and Uϕ (right) images showing the close environment of RY Lup. The dark central region corresponds to the areamasked by the coronagraph. The intensity scale follows the inverse hyperbolic sine.
Fig. 3. (Top) Polarized intensity image showing the close-in environment of RY Lup. (Bottom) Unsharp masking of the polarized intensity imageshowing the close-in environment of RY Lup. The intensity scale follows the inverse hyperbolic sine.
3. Results
We obtained a very clear detection of the RY Lup disk in alldatasets presented in this paper. The analysis of the morphologyof the detected disk primarily focuses on the IRDIS and IFS in-tensity images and IRDIS-DPI (see Sects. 2.2 and 2.3). Further-more, the cADI IFS and IRDIS images are used to search forpoint-sources focusing on non-polarized companions becausethe intensity images reach higher contrast (Sect. 3.2). Our phys-ical modelling of the polarimetric and total intensity images al-lows a qualitative analysis of the disk, and is presented in Sect. 4.
3.1. Disk properties
The IRDIS and IFS datasets reveal clearly the inclined diskaround RY Lup as seen in Fig. 1 in intensity and in Fig. 2 inpolarimetry. Figure 1 for IFS is a median image over wavelengthrange from Y to J band. In our images, the disk appears as adominating double-arch structure in the SE–NW direction ex-tending to 0.53′′ (80 au) in radius. Our observations support ahigh disk inclination with respect to the line of sight, with a po-sition angle of 107 ±1 degrees. The position angle was estimatedby considering the brightest parts of the disk. In addition to these
bright components the images reveal the presence of two fainterspiral-like features on the SE direction as seen on the display ofthe Qϕ image (Fig. 2). A spiral-like feature is also visible on theopposite side of the disk along its major axis. This either meansthat the m = 1 and m = 2 modes are basically seen on oppo-site sides of the disk or, together with the inner SE spiral arm,these two components could be approximately traced by an el-lipse. In Fig. 3 we also applied an unsharp mask to the polarizedintensity in order to enhance the disk structure. Other double-arch structures in TDs have been recently reported with high-contrast imaging instruments such as SPHERE (Janson et al.2016; Garufi et al. 2016; Pohl et al. 2017), but spiral-like fea-tures such as the one observed here have not yet been detectedin very inclined disks. The spiral-like features detected in theRY Lup disk images could be created by an interaction of thedisk with a planet located in its surrounding (Dong et al. 2016).We demonstrate in Sect. 5 that it is a reliable hypothesis.
We note that the ADI processing of these images may havebeen biased and are not a faithful representation of the true in-tensity and geometry. In this particular case the disk is brightand these artefacts are negligible, as shown by the similaritiesbetween the cADI, noADI, and the DPI images.
Article number, page 5 of 12

A&A proofs: manuscript no. 31624corr
The reduced Uϕ image signal can be interpreted as radialpolarization. The high peak-to-peak ratio between Uϕ and Qϕ
(30%) can be attributed to the high inclination of the disk (∼70degrees as determined from the total intensity image). In a highlyinclined disk, multiple scattering can occur (i.e. where light thathas already been polarized is scattered). In this case, this is theprime contributor to the Uϕ signal. This is consistent with a the-oretical study by Canovas et al. (2015) and Pohl et al. (2017),who found that multiple scattering can produce significant non-azimuthal polarization. They showed that the peak-to-peak ratiobetween Uϕ and Qϕ can even be as high as 50 % for a disk in-clination of 70 degrees depending on the mass and grain sizedistribution of the disk model.
We used the RDI IFS, RDI IRDIS, and DPI IRDIS im-ages to derive the relative surface brightness (SB-M?) profilesof the disk along its major axis (Fig. 5), assuming that the ma-jor axis has a position angle of 107 degrees. These profiles arecalculated using an average width of 5 pixels along the mid-plane with the following formula: SB-M?=2.5 ∗ log(normalizedIntensity/pixel − area2)−M?. The conversion of the intensityinto mag.arcsec−2 was performed using the 2MASS stellar mag-nitudes (J = 8.54 mag, H = 7.69 mag, Cutri et al. 2003) and theratio of the maximum to the total flux of the measured unsat-urated non-coronagraphic PSF. With this normalization choice,the profiles provide information on the scattering efficiency ofthe dust grains. We note some brightness asymmetry betweenthe west and east disk wings which is slightly more pronouncedin the polarimetric intensity (represented with arbitrary surfacebrightness scale) than on the intensity cADI profiles (IFS andIRDIS). We also note that the radial profiles are very simi-lar from the Y to H band, which suggests a shallow depen-dence efficiency of the scattering with wavelength. This is con-firmed by the RY Lup disk spectrum ranging from 5.05 to 5.25mag.arcsec−2 − M? across the 0.9 – 2.3 µm wavelength range.This spectrum was estimated by computing the integrated fluxfrom the IFS image at each wavelength in a constant area, de-fined by the area where the flux is above 1.5 σ of the collapsedimage over all wavelengths. The observed brightness and colourof scattered light images put strong constraints on the scatter-ing properties of protoplanetary dust as shown by Mulders &Dominik (2012). The very flat spectrum of the RY Lup disk sug-gests a minimum grain size of ∼ 3 µm assuming astrosilicatesand a grain size distribution slope of - 3.5.
3.2. Search for planets
Twenty candidate companions (CC) were detected in the IRDISfield of view (Fig. 7) using DBI with H2H3 filters, whereas nopoint-like source was found in the IFS image. The photome-try and astrometry of the companions were measured using theTLOCI algorithm applied to each spectral band separately aspresented in Table 2. We divided each science frame into annuliof 1.5 full width at half maximum (FWHM, where FWHM =41 mas). For each science frame and annulus, we computed thestellar residuals using the best linear combination of the mostcorrelated frames for which the self-subtraction of mock pointsources was at maximum 20%. The astrometry and the photom-etry were estimated by a fit of the point spread function templateonto the data. The photometric errors were estimated conserva-tively by including the variations in the stellar flux during the se-quence (estimated from the fluctuations of the stellar residuals),the accuracy of the fitting procedure, and the PSF variability be-tween the beginning and the end of the sequence. The astrometryof the detected companions was calibrated using pixel scales of
Fig. 4. Polarized intensity image showing the close-in environment ofRY Lup. The white stripes represent the angle of linear polarization(fixed length, not scaled with the degree of polarization). The intensityscale follows the inverse hyperbolic sine.
12.255 mas and a TN angle offset of -1.742 degrees (Maire et al.2016). The astrometric errors include the accuracy of the fittingprocedure and the star centring error.
Fig. 5. RY Lup disk surface brightness profile measured alongthe midplane on the IFS intensity image (asterisk line) expressed inmag.arcsec−2−M?, IRDIS intensity image (red dotted line) expressed inmag.arcsec−2−M?, and IRDIS polarimetry image (blue dashed line) ex-pressed in arbitrary units. The grey area represents the separation rangemasked by the coronagraph. The intensity is normalized to the unsatu-rated non-coronagraphic PSF intensity peak. The error bars are within0.1 mag.arcsec−2.
Because of the photometric bias from the TLOCI algorithm,we estimated the throughput of the technique at each position inthe field using fake planet injection and produced throughput-corrected final images. The contrast curve for each spectralchannel is estimated by the azimuthal standard deviation of thethroughput corrected image in an annulus of 0.5 FWHM width.
Article number, page 6 of 12

Langlois et al.: Transition Disk around the T Tauri star RY Lup
No small statistical correction at short separation was applied(Mawet et al. 2014). The azimuthally averaged contrast curvesshown in Fig. 6 were estimated for the TLOCI reduction forIRDIS and PCA ASDI reduction for IFS because these reduc-tions provide the best compromise for contrast, stellar rejection,and self-subtraction correction for the point source detection.The disk is bright, but strongly attenuated by the TLOCI algo-rithm (which is optimized for point-source detection). As a con-sequence, the disk residuals increase the measured noise levelby a small amount leading to slightly pessimistic contrast curvesat very short distances. For the conversion of the contrast lim-its to mass limits in Fig. 6, we used the COND atmospheric andevolutionary models of Baraffe et al. (2015) and Baraffe et al.(2003). All the point sources were classified as probable back-ground stellar objects using the SPHERE consortium tools de-veloped for the classification and the ranking of the companioncandidates discovered in SPHERE/SHINE. With the same suiteof tools, we derived the colour magnitude diagram (CMD) ofall point sources, as shown in Fig. 8, to compare their H2-H3colour to those of field and young dwarfs covering the M, L, T,and Y types. Further details about the derivation of this colourmagnitude diagram are provided in Zurlo et al. (2016). We alsocomputed a background probability for the point sources by as-suming the Besancon model predictions (Robin et al. 2003). Asseen in Table 2, there is only one candidate with low probabilityof contamination, but its position on the CMD diagram corre-sponds to a background star. All the detected point sources alsohave very similar offsets from the M-L sequence and their sep-arations are also greater than a hundred au, so we can concludethat they have a very low likelihood of being bound companions.
4. Physical disk modelling
Our physical disk modelling aims to reproduce the polarizedintensity, the orientation of the polarization vectors, and thetwo faint spiral arms observed on the SE and SW sides in theSPHERE intensity and polarimetric images. This requires theloss of disk symmetry, which could be explained by planet–diskperturbation dynamics. Thus, we want to test whether the spiralpattern triggered by a Jupiter-like planet could eventually resultin the scattered light features that we detect around RY Lup, as-suming that its disk is seen close to edge-on. For this purpose,we carry out 3D global numerical hydrodynamical simulationsto study the morphology of spiral arms excited by an outer plan-etary perturber. Using detailed 3D follow-up radiative transfermodels, we produce synthetic scattered light images for a highlyinclined disk configuration at NIR wavelengths. This modellingapproach is motivated by recent work on spiral arms in the con-text of scattered light by Dong et al. (2015, 2016); Juhász et al.(2015); Pohl et al. (2015).
4.1. Hydrodynamical planet–disk simulations
We use the Three-dimensional RAdiation-hydrodynamical Mod-elling Project (TRAMP, Klahr et al. 1999) code in its extendedversion (Klahr & Kley 2006), which applies a flux-limited diffu-sion approximation for the radiation. We consider a giant planetembedded in a fully viscous disk, where the consistent releaseof accretion energy from the planet via radiation is included.The disk model considers a spherical polar coordinate system(r, θ, ϕ), where the disk midplane coincides with the θ = 0 plane.The number of grid cells in the radial (r), polar (θ), and az-imuthal (ϕ) directions are 64, 31, and 89, respectively. The com-
putational disk grid has a radial extent from ∼18 au to 235 au.The complete set of vertical disk structure equations is solvedself-consistently, including both viscous dissipation and heatingby irradiation from the central star (cf. D’Alessio et al. 1998).This results in detailed profiles of the density and temperaturestructure with vertical height and disk radius. Thus, it allows usto determine the 3D temperature structure of the disk at eachstep of the planet–disk interaction processes. More precisely, theinitial 3D dataset, before adding the planet, is determined froma set of 1D vertical structure models for a given accretion rate(which will result in the desired total disk mass). Thus, the dy-namical viscous evolution in the 3D radiation hydro simulationof the disk will not significantly alter the initial global gas dis-tribution, but any development of structure in the 3D simula-tions is the result of the torques exerted by the planet. We makesure that the 1D and 3D models use the same parameters in-cluding the dust opacities and alpha viscosity. We assume a cen-tral stellar mass of M? = 1.4 M�, a radius of R? = 1.72 R�,and an effective temperature of Teff = 5669 K. These parame-ters are consistent with the properties of RY Lup derived by apiecewise linear interpolation of the values from Manset et al.(2009) assuming an object’s distance of 151 pc (Gaia Collab-oration et al. 2016). Furthermore, the input parameters for theviscosity parameter and the mass accretion rate are chosen to beα = 10−3 and Maccr,0 = 3.3 · 10−10 M� yr−1, respectively. Thelatter is rather low compared to typical values for T Tauri disks,but a natural outcome of the disk mass considered. The accre-tion rate is calculated such that the disk gas mass corresponds toMdisk = 2.5 ·10−3 M�, distributed between an inner disk radius ofrin = 18 au and an outer disk radius of rout = 123 au, as measuredby Ansdell et al. (2016).
The position of a possible planetary perturber is uncertain,but spiral arms exterior to a planet’s orbit are unlikely to explainthe observations as they are too tightly wound given typical diskscale height values (Juhász et al. 2015). However, a location fur-ther out in the disk is compatible with the outer disk radius inthe 13CO ALMA emission map. Furthermore, the mm dust con-tinuum suggests a truncation at ∼120 au and a depletion of largedust beyond (Ansdell et al. 2016). Following the approach byrecent spiral arm models (Dong et al. 2015), the planet can beroughly located at a distance three times the location of the in-ner arms. Thus, we consider a planet located at 190 au, that isoutside of the disk radius in both scattered light and in thermalemission. Given that the planet carves out a wide gap in the disk,this location is a justified assumption. We assume a fixed circu-lar orbit, although spiral density waves may be also excited bya companion on an eccentric orbit. The mass of the embeddedgiant planet is considered to be Mpl/M? = 1.4 · 10−3 (∼2 Mjup).This mass is restricted by the mass detection limits for planetarycompanions obtained from our SPHERE contrast curves. Fig-ure 6 shows that the upper mass limit at an angular distance of∼1.1′′is ∼2 Mjup. It is worth noting that the mass limit is modeldependent and slightly higher if a warm start model is assumed(∼5 Mjup) (Marley et al. 2007; Spiegel & Burrows 2012). It isalso worth mentioning that a planet might be at a location behindthe disk or might be geometrically close to the central star, whereit could remain undetected. Hence, it is geometrically likely tohave a projected separation less than ∼1.1′′, at which a higherplanet mass would be possible according to Fig. 6. However, ourchoice of a lower planet mass is thus conservative, which is rea-sonable given the uncertainties on the age of the system and onthe atmospheric/evolutionary models used to estimate the massdetection limits. The planet–disk features, especially the contrastbetween spirals and the background disk, would be even stronger
Article number, page 7 of 12

A&A proofs: manuscript no. 31624corr
Fig. 6. Contrast curves and companion mass limits derived for IFS (black curve) using the ASDI PCA reduction method, and for IRDIS H2and H3 bands (blue and red curves, respectively) using the TLOCI reduction method. The coronagraph inner working angle (radius where thecoronagraphic transmission is 50%) is 0.095 arcsec in radius.
Table 2. Astrophotometric parameters for the CCs. For Candidates 14 and 19 proper astrophotometric measurements could not be extracted at oneof the two wavelengths.The last column gives the contamination probability
CC # Sep (mas) Err Sep (mas) PA (deg) Err PA (deg) Mag H2 Err Mag H2 Mag H3 Err Mag H3 prob (%)1 5047.88 6.51 59.28 0.14 13.84 0.09 13.99 0.11 98.52 3587.47 3.89 67.75 0.13 11.69 0.07 11.76 0.071 60.73 1855.11 2.60 23.80 0.13 9.32 0.07 9.38 0.067 5.84 2704.75 4.29 6.80 0.14 13.63 0.08 13.66 0.08 68.95 4078.96 10.53 273.02 0.19 14.92 0.16 15.08 0.17 97.46 5633.39 9.07 291.21 0.15 14.54 0.16 14.40 0.10 99.87 5632.97 6.45 261.47 0.13 13.57 0.09 13.65 0.09 99.28 6579.01 9.63 258.92 0.14 12.31 0.10 12.49 0.12 98.59 4855.73 5.59 246.86 0.13 11.54 0.08 11.62 0.10 79.110 4545.61 5.30 34.42 0.13 13.18 0.08 13.24 0.084 93.911 3182.06 6.02 15.52 0.16 14.05 0.10 14.09 0.10 83.912 4896.42 12.88 322.20 0.19 15.15 0.24 14.93 0.16 99.613 4840.22 5.53 312.53 0.13 13.10 0.08 13.23 0.08 95.214 5782.48 23.59 298.59 0.26 15.59 0.61 99.915 4922.87 5.096 230.19 0.13 12.68 0.08 12.73 0.08 93.016 6626.06 8.87 124.44 0.14 13.69 0.15 13.62 0.11 99.917 5603.79 6.02 158.70 0.13 13.48 0.08 13.54 0.081 99.118 4892.20 6.83 187.26 0.14 14.23 0.113 14.23 0.093 98.919 7173.35 9.50 136.834 0.14 13.01 0.12 99.820 6639.75 12.95 79.77 0.16 14.59 0.18 14.99 0.22 99.9
for higher planet masses (cf. Dong et al. 2015; Pohl et al. 2015).The simulation is run for 90 orbits at 190 au (∼ 1.8 · 105 yrs),which is sufficiently long for the inner spiral arms to reach aquasi steady state, although this evolutionary timescale wouldbe not enough to carve out a full gap around its orbit. This is,however, reasonable for our modelling purposes since the planetis located outside the disk and we are mainly interested in theobservational appearance of the spiral arms.
A map of the surface density Σgas after an evolutionary timeof 90 orbits at 190 au is shown in Fig. 9. While the planet al-ways excites inner and outer waves, we concentrate here on them = 2 spiral arm configuration inward of the planet’s positionat 190 au. The primary arm originates from the planet location,the secondary is shifted by ∼180◦ in the azimuthal direction. Thedensity contrast of the secondary spiral wave with respect to thebackground disk is weaker than the primary one.
4.2. Radiative transfer models
The resulting 3D disk density and temperature structure pre-sented in Sect. 4.1 is subsequently fed into the Monte Carlo(MC) radiative transfer code RADMC-3D developed by Dulle-mond et al. (2012)1. To convert the gas density to the dust den-sity used in the radiative transfer calculations, we adopt a gas-to-dust ratio of 50, which is lower than the canonical ISM value assuggested by the ALMA Lupus survey of Ansdell et al. (2016).For the dust opacity calculation we consider a species mixtureof silicate (60%), carbonaceous (10%), and icy (30%) material,where the optical constants are taken from Draine (2003); Zubkoet al. (1996); Warren & Brandt (2008). We assume two differ-
1 The RADMC-3D source code is available online athttp://www.ita.uni-heidelberg.de/∼dullemond/software/radmc-3d/.
Article number, page 8 of 12
Langlois et al.: Transition Disk around the T Tauri star RY Lup
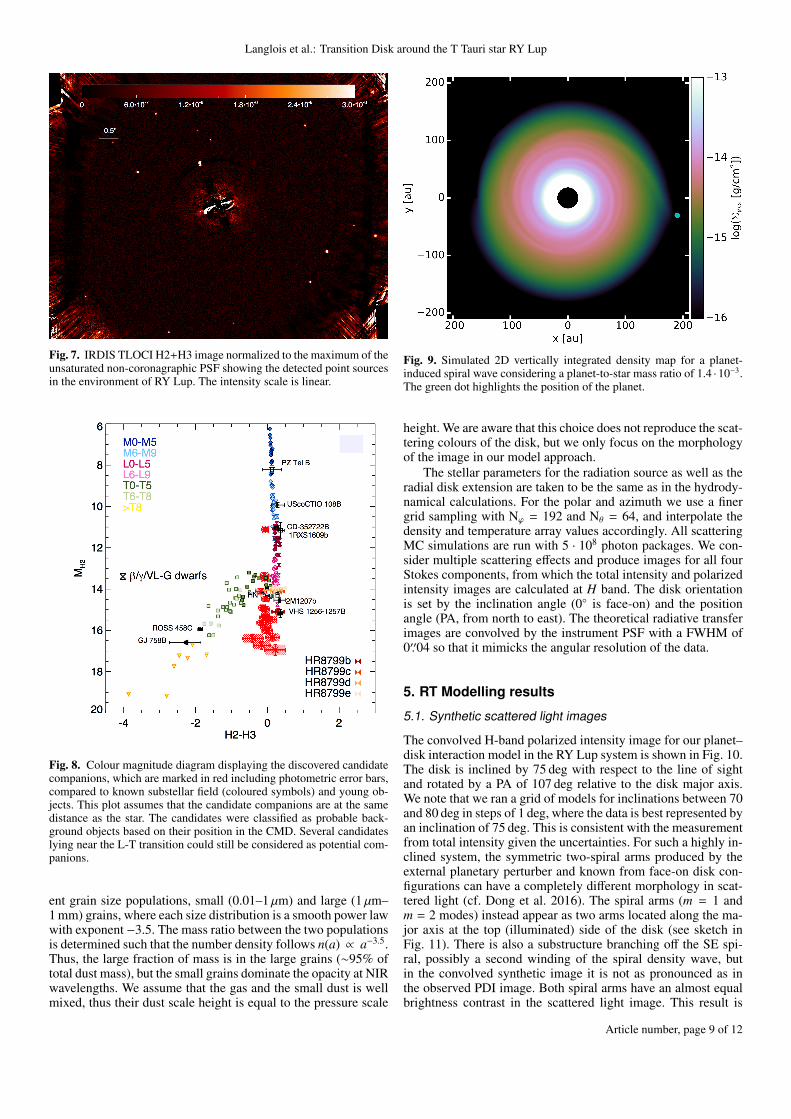
Fig. 7. IRDIS TLOCI H2+H3 image normalized to the maximum of theunsaturated non-coronagraphic PSF showing the detected point sourcesin the environment of RY Lup. The intensity scale is linear.
Fig. 8. Colour magnitude diagram displaying the discovered candidatecompanions, which are marked in red including photometric error bars,compared to known substellar field (coloured symbols) and young ob-jects. This plot assumes that the candidate companions are at the samedistance as the star. The candidates were classified as probable back-ground objects based on their position in the CMD. Several candidateslying near the L-T transition could still be considered as potential com-panions.
ent grain size populations, small (0.01–1 µm) and large (1 µm–1 mm) grains, where each size distribution is a smooth power lawwith exponent −3.5. The mass ratio between the two populationsis determined such that the number density follows n(a) ∝ a−3.5.Thus, the large fraction of mass is in the large grains (∼95% oftotal dust mass), but the small grains dominate the opacity at NIRwavelengths. We assume that the gas and the small dust is wellmixed, thus their dust scale height is equal to the pressure scale
Fig. 9. Simulated 2D vertically integrated density map for a planet-induced spiral wave considering a planet-to-star mass ratio of 1.4 ·10−3.The green dot highlights the position of the planet.
height. We are aware that this choice does not reproduce the scat-tering colours of the disk, but we only focus on the morphologyof the image in our model approach.
The stellar parameters for the radiation source as well as theradial disk extension are taken to be the same as in the hydrody-namical calculations. For the polar and azimuth we use a finergrid sampling with Nϕ = 192 and Nθ = 64, and interpolate thedensity and temperature array values accordingly. All scatteringMC simulations are run with 5 · 108 photon packages. We con-sider multiple scattering effects and produce images for all fourStokes components, from which the total intensity and polarizedintensity images are calculated at H band. The disk orientationis set by the inclination angle (0◦ is face-on) and the positionangle (PA, from north to east). The theoretical radiative transferimages are convolved by the instrument PSF with a FWHM of0′′.04 so that it mimicks the angular resolution of the data.
5. RT Modelling results
5.1. Synthetic scattered light images
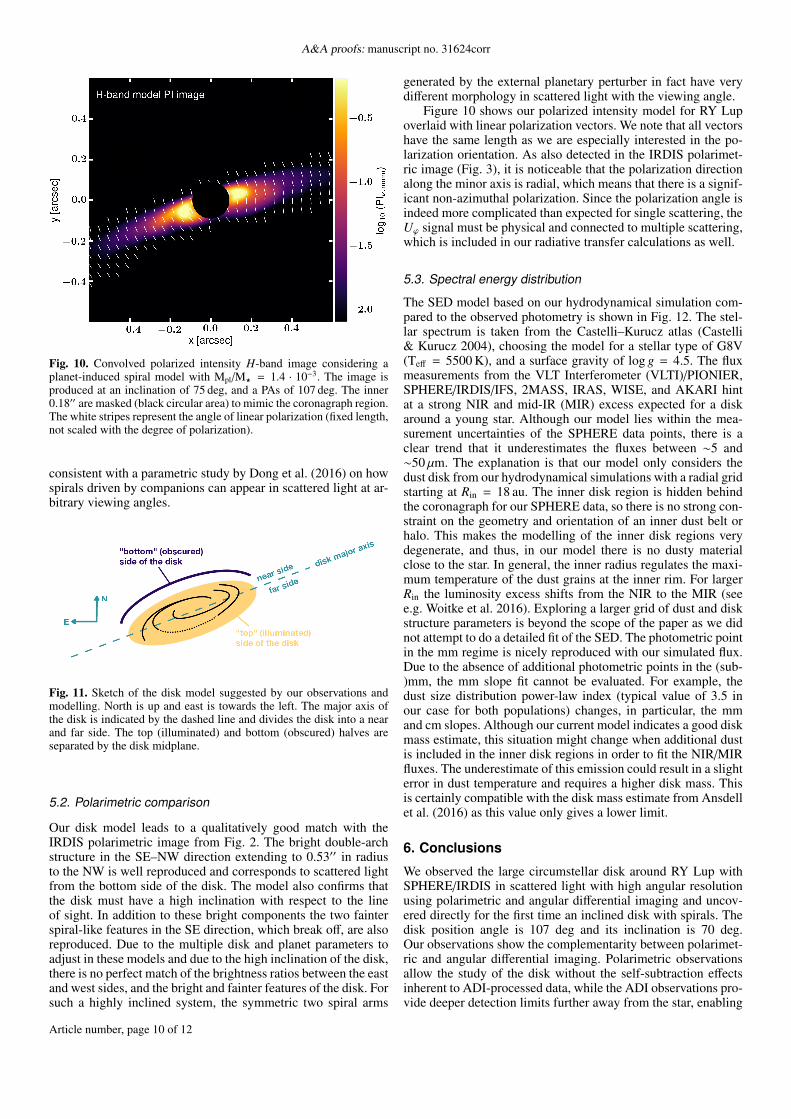
The convolved H-band polarized intensity image for our planet–disk interaction model in the RY Lup system is shown in Fig. 10.The disk is inclined by 75 deg with respect to the line of sightand rotated by a PA of 107 deg relative to the disk major axis.We note that we ran a grid of models for inclinations between 70and 80 deg in steps of 1 deg, where the data is best represented byan inclination of 75 deg. This is consistent with the measurementfrom total intensity given the uncertainties. For such a highly in-clined system, the symmetric two-spiral arms produced by theexternal planetary perturber and known from face-on disk con-figurations can have a completely different morphology in scat-tered light (cf. Dong et al. 2016). The spiral arms (m = 1 andm = 2 modes) instead appear as two arms located along the ma-jor axis at the top (illuminated) side of the disk (see sketch inFig. 11). There is also a substructure branching off the SE spi-ral, possibly a second winding of the spiral density wave, butin the convolved synthetic image it is not as pronounced as inthe observed PDI image. Both spiral arms have an almost equalbrightness contrast in the scattered light image. This result is
Article number, page 9 of 12
A&A proofs: manuscript no. 31624corr
Fig. 10. Convolved polarized intensity H-band image considering aplanet-induced spiral model with Mpl/M? = 1.4 · 10−3. The image isproduced at an inclination of 75 deg, and a PAs of 107 deg. The inner0.18′′ are masked (black circular area) to mimic the coronagraph region.The white stripes represent the angle of linear polarization (fixed length,not scaled with the degree of polarization).
consistent with a parametric study by Dong et al. (2016) on howspirals driven by companions can appear in scattered light at ar-bitrary viewing angles.
Fig. 11. Sketch of the disk model suggested by our observations andmodelling. North is up and east is towards the left. The major axis ofthe disk is indicated by the dashed line and divides the disk into a nearand far side. The top (illuminated) and bottom (obscured) halves areseparated by the disk midplane.
5.2. Polarimetric comparison
Our disk model leads to a qualitatively good match with theIRDIS polarimetric image from Fig. 2. The bright double-archstructure in the SE–NW direction extending to 0.53′′ in radiusto the NW is well reproduced and corresponds to scattered lightfrom the bottom side of the disk. The model also confirms thatthe disk must have a high inclination with respect to the lineof sight. In addition to these bright components the two fainterspiral-like features in the SE direction, which break off, are alsoreproduced. Due to the multiple disk and planet parameters toadjust in these models and due to the high inclination of the disk,there is no perfect match of the brightness ratios between the eastand west sides, and the bright and fainter features of the disk. Forsuch a highly inclined system, the symmetric two spiral arms
generated by the external planetary perturber in fact have verydifferent morphology in scattered light with the viewing angle.
Figure 10 shows our polarized intensity model for RY Lupoverlaid with linear polarization vectors. We note that all vectorshave the same length as we are especially interested in the po-larization orientation. As also detected in the IRDIS polarimet-ric image (Fig. 3), it is noticeable that the polarization directionalong the minor axis is radial, which means that there is a signif-icant non-azimuthal polarization. Since the polarization angle isindeed more complicated than expected for single scattering, theUϕ signal must be physical and connected to multiple scattering,which is included in our radiative transfer calculations as well.
5.3. Spectral energy distribution
The SED model based on our hydrodynamical simulation com-pared to the observed photometry is shown in Fig. 12. The stel-lar spectrum is taken from the Castelli–Kurucz atlas (Castelli& Kurucz 2004), choosing the model for a stellar type of G8V(Teff = 5500 K), and a surface gravity of log g = 4.5. The fluxmeasurements from the VLT Interferometer (VLTI)/PIONIER,SPHERE/IRDIS/IFS, 2MASS, IRAS, WISE, and AKARI hintat a strong NIR and mid-IR (MIR) excess expected for a diskaround a young star. Although our model lies within the mea-surement uncertainties of the SPHERE data points, there is aclear trend that it underestimates the fluxes between ∼5 and∼50 µm. The explanation is that our model only considers thedust disk from our hydrodynamical simulations with a radial gridstarting at Rin = 18 au. The inner disk region is hidden behindthe coronagraph for our SPHERE data, so there is no strong con-straint on the geometry and orientation of an inner dust belt orhalo. This makes the modelling of the inner disk regions verydegenerate, and thus, in our model there is no dusty materialclose to the star. In general, the inner radius regulates the maxi-mum temperature of the dust grains at the inner rim. For largerRin the luminosity excess shifts from the NIR to the MIR (seee.g. Woitke et al. 2016). Exploring a larger grid of dust and diskstructure parameters is beyond the scope of the paper as we didnot attempt to do a detailed fit of the SED. The photometric pointin the mm regime is nicely reproduced with our simulated flux.Due to the absence of additional photometric points in the (sub-)mm, the mm slope fit cannot be evaluated. For example, thedust size distribution power-law index (typical value of 3.5 inour case for both populations) changes, in particular, the mmand cm slopes. Although our current model indicates a good diskmass estimate, this situation might change when additional dustis included in the inner disk regions in order to fit the NIR/MIRfluxes. The underestimate of this emission could result in a slighterror in dust temperature and requires a higher disk mass. Thisis certainly compatible with the disk mass estimate from Ansdellet al. (2016) as this value only gives a lower limit.
6. Conclusions
We observed the large circumstellar disk around RY Lup withSPHERE/IRDIS in scattered light with high angular resolutionusing polarimetric and angular differential imaging and uncov-ered directly for the first time an inclined disk with spirals. Thedisk position angle is 107 deg and its inclination is 70 deg.Our observations show the complementarity between polarimet-ric and angular differential imaging. Polarimetric observationsallow the study of the disk without the self-subtraction effectsinherent to ADI-processed data, while the ADI observations pro-vide deeper detection limits further away from the star, enabling
Article number, page 10 of 12

Langlois et al.: Transition Disk around the T Tauri star RY Lup
Fig. 12. Synthetic SED from our radiative transfer model comparedwith direct measurements obtained with SPHERE IRDIS and IFS inviolet, VLTI/PIONIER (Anthonioz 2015), 2MASS, IRAS, WISE, andAKARI (VizieR online catalogue collection2) and ALMA (Ansdellet al. 2016) in grey.
us to study the disk and search for exoplanets. We also retrieveda high signal-to-noise ratio spectrum for the disk using the IFS.The disk colour is grey, which is an indication that dust grainslarger than the wavelength dominate the scattering opacity in thedisk surface.
We have studied the morphology and surface brightness ofthe disk and formulated a hypothesis on the origin of the spiralarms. An explanation for the spiral arms could not be uniquelydetermined due to the high inclination of the disk. Our numericalmodel shows that the spiral arms could be explained by one low-mass planet (2 Mjup) located at 190 au orbiting exterior to thespiral arms. Although this model describes the formation of spi-ral arms qualitatively similar to the features in the NIR scatteredlight observations of RY Lup, it is only a suggested configura-tion for the system, and not a best-fitting model. However, giventhe high inclination of the disk it is unlikely that the planet’sthermal radiation is directly detectable. While spirals can be ex-cited by the tidal interaction with the companion, they can alsobe triggered by the close proximity of shadows in the disk as dis-cussed in Montesinos et al. (2016); Benisty et al. (2017). Also,we cannot exclude that the 0.8′′ diameter gap detected in sub-mm continuum emission could host additional massive planetsthat could play a role in the disk morphology. The innermost gapdiscovered in the ALMA observation cannot be detected in scat-tered light due to the high inclination of the disk. The scatteredlight flux shows a small profile asymmetry which does not co-incide with the symmetry of the sub-mm continuum emission.This is likely the result of surface density perturbation related tothe presence of the spiral arms and could be strongly related tothe viewing orientation.
Our observations are compatible with the hypothesis madeby Manset et al. (2009) of photometric and polarimetric vari-ations created by an almost edge-on circumstellar disk that iswarped (or inclined) close to the star where it interacts with thestar magnetosphere. This configuration could lead to a partialshadowing of the outer disk and a brightness asymmetry that canremain undetected due to the high inclination of the disk. We alsoperformed a detailed radiative transfer study, which reproducewell our scattered light observations. The planet–disk interactionscenario is in agreement with the ALMA high-resolution dustcontinuum image being truncated at ∼120 au. This modelling ef-
fort cannot fully constrain all the parameters in this case, buthelps to understand the disk structure and distribution of smallgrains in particular.Acknowledgements. We acknowledge our anonymous reviewers for the verycareful reading and constructive suggestions that contributed to improving thispaper. SPHERE is an instrument designed and built by a consortium consistingof IPAG (Grenoble, France), MPIA (Heidelberg, Germany), LAM (Marseille,France), LESIA (Paris, France), Laboratoire Lagrange (Nice, France), INAF- Osservatorio di Padova (Italy), Observatoire astronomique de l’universite deGeneve (Switzerland), ETH Zurich (Switzerland), NOVA (Netherlands), ON-ERA (France), and ASTRON (Netherlands) in collaboration with ESO. SPHEREwas funded by ESO, with additional contributions from CNRS (France), MPIA(Germany), INAF (Italy), FINES (Switzerland), and NOVA (Netherlands).SPHERE also received funding from the European Commission Sixth and Sev-enth Framework Programmes as part of the Optical Infrared Coordination Net-work for Astronomy (OPTICON) under grant number RII3-Ct-2004-001566 forFP6 (2004-2008), grant number 226604 for FP7 (2009-2012), and grant num-ber 312430 for FP7 (2013-2016). This work was supported by the ProgrammeNational de Planétologie (PNP) and the Programme National de Physique Stel-laire (PNPS) of CNRS-INSU co-funded by CNES. This work has also been sup-ported by a grant from the French Labex OSUG2020 (Investissements d’avenir- ANR10 LABX56) and by the ANR grant ANR-14-CE33-0018 (GIPSE). Thiswork has made use of the SPHERE Data Centre, jointly operated by OSUG/IPAG(Grenoble), PYTHEAS /LAM/CeSAM (Marseille), OCA/Lagrange (Nice), andObservatoire de Paris/LESIA (Paris). This research has made use of the VizieRcatalogue access tool, CDS, Strasbourg, France. Q. Kral also acknowledges sup-port from STFC (consolidated grant) via the institute of Asronomy, Cambridge.
ReferencesAlcalá, J. M., Manara, C. F., Natta, A., et al. 2017, A&A, 600, A20Ansdell, M., Williams, J. P., van der Marel, N., et al. 2016, ApJ, 828, 46Avenhaus, H., Quanz, S. P., Schmid, H. M., et al. 2014, ApJ, 781, 87Baraffe, I., Chabrier, G., Barman, T. S., Allard, F., & Hauschildt, P. H. 2003,
A&A, 402, 701Baraffe, I., Homeier, D., Allard, F., & Chabrier, G. 2015, A&A, 577, A42Bastien, P. 1981, A&A, 94, 294Bastien, P. 1985, ApJS, 59, 277Benisty, M., Stolker, T., Pohl, A., et al. 2017, A&A, 597, A42Beuzit, J.-L., Feldt, M., Dohlen, K., et al. 2008, in Proc. SPIE, Vol. 7014,
Ground-based and Airborne Instrumentation for Astronomy II, 701418Biazzo, K., Frasca, A., Alcalá, J. M., et al. 2017, ArXiv e-prints
[arXiv:1706.09684]Boccaletti, A., Abe, L., Baudrand, J., et al. 2008, in Proc. SPIE, Vol. 7015, Adap-
tive Optics Systems, 70151BBrown, J. M., Blake, G. A., Dullemond, C. P., et al. 2007, ApJ, 664, L107Canovas, H., Rodenhuis, M., Jeffers, S. V., Min, M., & Keller, C. U. 2011, A&A,
531, A102Canovas, H., Schreiber, M. R., Cáceres, C., et al. 2015, ApJ, 805, 21Carbillet, M., Bendjoya, P., Abe, L., et al. 2011, Experimental Astronomy, 30,
39Castelli, F. & Kurucz, R. L. 2004, ArXiv Astrophysics e-prints
[astro-ph/0405087]Claudi, R. U., Turatto, M., Gratton, R. G., et al. 2008, in Proc. SPIE, Vol. 7014,
Ground-based and Airborne Instrumentation for Astronomy II, 70143ECovino, E., Terranegra, L., Franchini, M., Chavarria-K., C., & Stalio, R. 1992,
A&AS, 94, 273Cutri, R. M., Skrutskie, M. F., van Dyk, S., et al. 2003, 2MASS All Sky Catalog
of point sources.D’Alessio, P., Cantö, J., Calvet, N., & Lizano, S. 1998, ApJ, 500, 411Dodson-Robinson, S. E. & Salyk, C. 2011, ApJ, 738, 131Dohlen, K., Langlois, M., Saisse, M., et al. 2008, in Proc. SPIE, Vol. 7014,
Ground-based and Airborne Instrumentation for Astronomy II, 70143LDong, R., Fung, J., & Chiang, E. 2016, ApJ, 826, 75Dong, R., Zhu, Z., Rafikov, R. R., & Stone, J. M. 2015, ApJ, 809, L5Draine, B. T. 2003, ApJ, 598, 1026Dullemond, C. P., Juhasz, A., Pohl, A., et al. 2012, RADMC-3D: A multi-
purpose radiative transfer tool, Astrophysics Source Code LibraryEvans, A., Bode, M. F., Whittet, D. C. B., et al. 1982, MNRAS, 199, 37PFedele, D., Carney, M., Hogerheijde, M. R., et al. 2017, A&A, 600, A72Follette, K. B., Grady, C. A., Swearingen, J. R., et al. 2015, ApJ, 798, 132Fusco, T., Nicolle, M., Rousset, G., et al. 2004, in Proc. SPIE, Vol. 5490, Ad-
vancements in Adaptive Optics, ed. D. Bonaccini Calia, B. L. Ellerbroek, &R. Ragazzoni, 1155–1166
Gahm, G. F., Fischerstrom, C., Lindroos, K. P., & Liseau, R. 1989, A&A, 211,115
Article number, page 11 of 12

A&A proofs: manuscript no. 31624corr
Gahm, G. F., Liseau, R., Gullbring, E., & Hartstein, D. 1993, A&A, 279, 477Gaia Collaboration, Brown, A. G. A., Vallenari, A., et al. 2016, ArXiv e-prints
[arXiv:1609.04172]Garufi, A., Quanz, S. P., Schmid, H. M., et al. 2016, A&A, 588, A8Guerri, G., Daban, J.-B., Robbe-Dubois, S., et al. 2011, Experimental Astron-
omy, 30, 59Hashimoto, J., Dong, R., Kudo, T., et al. 2012, ApJ, 758, L19Hutchinson, M. G., Evans, A., Davies, J. K., & Bode, M. F. 1989, MNRAS, 237,
683Janson, M., Thalmann, C., Boccaletti, A., et al. 2016, ApJ, 816, L1Juhász, A., Benisty, M., Pohl, A., et al. 2015, MNRAS, 451, 1147Kessler-Silacci, J., Augereau, J.-C., Dullemond, C. P., et al. 2006, ApJ, 639, 275Khorrami, Z., Lanz, T., Vakili, F., et al. 2016, A&A, 588, L7Klahr, H. & Kley, W. 2006, A&A, 445, 747Klahr, H. H., Henning, T., & Kley, W. 1999, ApJ, 514, 325Langlois, M., Dohlen, K., Augereau, J.-C., et al. 2010, in Proc. SPIE, Vol. 7735,
Ground-based and Airborne Instrumentation for Astronomy III, 77352ULanglois, M., Vigan, A., Moutou, C., et al. 2013, in Proceedings of the Third
AO4ELT Conference, ed. S. Esposito & L. Fini, 63Liseau, R., Lindroos, K. P., & Fischerstrom, C. 1987, A&A, 183, 274Macintosh, B., Graham, J. R., Ingraham, P., et al. 2014, Proceedings of the Na-
tional Academy of Science, 111, 12661Maire, A.-L., Langlois, M., Dohlen, K., et al. 2016, in Proc. SPIE, Vol. 9908,
Ground-based and Airborne Instrumentation for Astronomy VI, 990834Manset, N., Bastien, P., Ménard, F., et al. 2009, A&A, 499, 137Marley, M. S., Fortney, J. J., Hubickyj, O., Bodenheimer, P., & Lissauer, J. J.
2007, ApJ, 655, 541Marois, C., Correia, C., Galicher, R., et al. 2014, in Proc. SPIE, Vol. 9148, Adap-
tive Optics Systems IV, 91480UMarois, C., Lafrenière, D., Doyon, R., Macintosh, B., & Nadeau, D. 2006, ApJ,
641, 556Mawet, D., Milli, J., Wahhaj, Z., et al. 2014, ApJ, 792, 97Merín, B., Brown, J. M., Oliveira, I., et al. 2010, ApJ, 718, 1200Mesa, D., Gratton, R., Zurlo, A., et al. 2015, A&A, 576, A121Montesinos, M., Perez, S., Casassus, S., et al. 2016, ApJ, 823, L8Mulders, G. D. & Dominik, C. 2012, A&A, 539, A9Ohta, Y., Fukagawa, M., Sitko, M. L., et al. 2016, PASJ, 68, 53Pavlov, A., Möller-Nilsson, O., Feldt, M., et al. 2008, in Proc. SPIE, Vol. 7019,
Advanced Software and Control for Astronomy II, 701939Pecaut, M. J., Mamajek, E. E., & Bubar, E. J. 2012, ApJ, 746, 154Pohl, A., Pinilla, P., Benisty, M., et al. 2015, MNRAS, 453, 1768Pohl, A., Sissa, E., Langlois, M., et al. 2017, ArXiv e-prints
[arXiv:1705.03477]Robin, A. C., Reylé, C., Derrière, S., & Picaud, S. 2003, A&A, 409, 523Soummer, R. 2005, ApJ, 618, L161Spiegel, D. S. & Burrows, A. 2012, ApJ, 745, 174Stolker, T., Dominik, C., Avenhaus, H., et al. 2016, A&A, 595, A113Thalmann, C., Grady, C. A., Goto, M., et al. 2010, ApJ, 718, L87Thalmann, C., Mulders, G. D., Janson, M., et al. 2015, ApJ, 808, L41Trapman, L., Miotello, A., Kama, M., van Dishoeck, E. F., & Bruderer, S. 2017,
ArXiv e-prints [arXiv:1705.07671]van Boekel, R., Henning, T., Menu, J., et al. 2017, ApJ, 837, 132van der Marel, N., Verhaar, B. W., van Terwisga, S., et al. 2016, A&A, 592, A126Vigan, A., Moutou, C., Langlois, M., et al. 2010, MNRAS, 407, 71Warren, S. G. & Brandt, R. E. 2008, Journal of Geophysical Research (Atmo-
spheres), 113, D14220Woitke, P., Min, M., Pinte, C., et al. 2016, A&A, 586, A103Zubko, V. G., Mennella, V., Colangeli, L., & Bussoletti, E. 1996, MNRAS, 282,
1321Zurlo, A., Vigan, A., Galicher, R., et al. 2016, A&A, 587, A57
Article number, page 12 of 12