firstservice · pdf fileinvestor presentation ... firstservice corporation overview ......
TRANSCRIPT

FirstService Corporation
Investor Presentation
May 2018

Certain statements included herein constitute “forward‐looking statements” within the meaning of the
U.S. Private Securities Litigation Reform Act of 1995. Such forward‐looking statements involve known
and unknown risks, uncertainties and other factors which may cause the actual results, performance or
achievements of the Company, or industry results, to be materially different from any future results,
performance or achievements expressed or implied by such forward‐looking statements. Such factors
include, among others, the following: general economic and business conditions, which will, among
other things, impact demand for the Company’s services, service industry conditions and capacity; the
ability of the Company to implement its business strategy, including the Company’s ability to acquire
suitable acquisition candidates on acceptable terms and successfully integrate newly acquired
businesses with its existing businesses; changes in or the failure to comply with government
regulations (especially safety and environmental laws and regulations); and other factors which are
described in the Company’s filings with the Canadian securities regulators and the U.S. Securities and
Exchange Commission.
Forward Looking Statements

FirstService Corporation Overview
Leader in essential outsourced property services in U.S. and Canada
FirstService Residential: Largest manager of residential communities
FirstService Brands: One of the largest providers of essential property services
TTM Revenue: $1.75BN(1)
TTM Adjusted EBITDA: $167MM(1)
Geographic Revenue Split: 94% U.S. / 6% Canada
19,000+ Employees
Dual-listing on TSX and NASDAQ (Ticker: FSV)
US$0.54 per share annual dividend
3
68%
32%
FirstService Residential FirstService Brands
Revenue by Division (TTM)(1)
EBITDA by Division (TTM)(1)(2)
(1) Trailing 12 months as of quarter ending March 31, 2018.(2) Excludes unallocated corporate costs.
57%
43%
FirstService Residential FirstService Brands

Strategic FocusOrganic growth; enhanced through tuck-under acquisitions
Service Excellence Culture Strong client retention; repeat business; referrals
High Proportion of Contractual Revenue Highly predictable and recurring cash flow
Modest Capex Strong free cash flow and returns on capital
Conservative Balance Sheet Low financial leverage; well-capitalized to fund growth
4
Proven Business Model

1995 1996 1997 1998 1999 2000 2001 2002 2003 2004 2005 2006 2007 2008 2009 2010 2011 2012 2013 2014 2015 2016 2017
Two Decades of Consistent Growth
5
$37MM
>20 Years Revenue Compounded Annual Growth: 19%Organic Growth: 2/3
$1,705MM

Leading Position in Very Large Markets
We Serve Multi-Billion Dollar Markets
Modest Market Shares (1-5%)
Fragmented Markets
#1 Position in Virtually Every Service Line
National Coverage
6
Positive Growth Trends
Significant Room for Organic Growth
Consolidation via Tuck-Under Acquisitions
Competitive Advantages
Growth OpportunitiesMarket Structure and Position

FirstService Residential – What We Do
Traditional On-Site Staff Transaction
Property Management
Development Consulting
Client Budget (collection & disbursements)
GovernanceOversight
Facility Maintenance & Engineering
Front Desk / Concierge
Pool & Amenity Management
Transfers & Disclosures; Collections
Financial Products (banking, insurance)
EnergyManagement / Procurement
Broad Range of Services
Condominiums / Co-operatives
Homeowner Associations
Master-planned
Active adult / Life-style
High-rise, mid-rise,townhouse, single family home
Management Contracts – Property Types
7

2017 Revenues: $1.2BN (> 2x nearest competitor)Scale enhances competitive position
No. of Communities: 8,000 total (2,800 high-rise condos)Diversified clients & properties with specialized operating expertise
Market Position: 1.6MM+ total units (5% market share)Significant market leadership and future opportunity
Contract Retention Rate: Mid-90%+Sticky customer base; Consistent cash flow profile
Annual HOA Client Budgets:
$8BN under administration
Opportunities to further penetrate existing portfolio with additional ancillary services
No. of Employees: 16,000+ National coverage
8
FirstService Residential – Profile
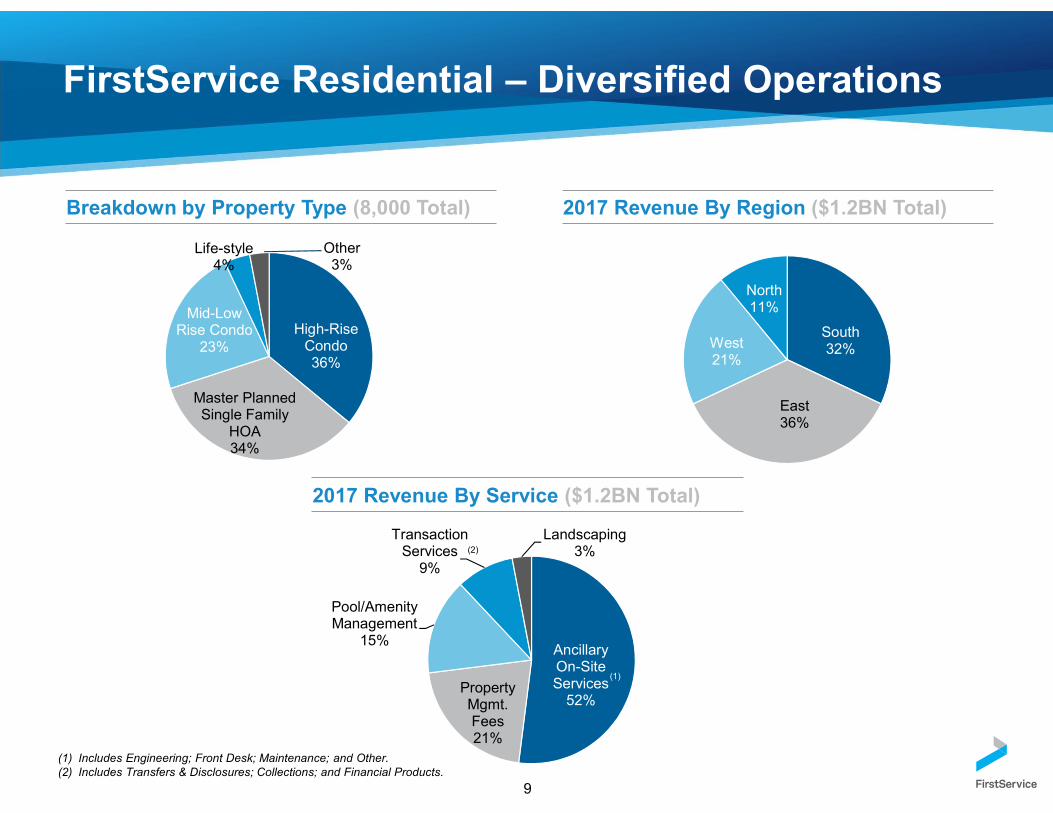
FirstService Residential – Diversified Operations
(1) Includes Engineering; Front Desk; Maintenance; and Other.(2) Includes Transfers & Disclosures; Collections; and Financial Products.
Breakdown by Property Type (8,000 Total) 2017 Revenue By Region ($1.2BN Total)
2017 Revenue By Service ($1.2BN Total)
High-Rise Condo36%
Master PlannedSingle Family
HOA34%
Mid-Low Rise Condo
23%
Life-style4%
Other3%
South32%
East36%
West21%
North11%
AncillaryOn-SiteServices
52%PropertyMgmt.Fees21%
Pool/AmenityManagement
15%
TransactionServices
9%
Landscaping3%
(1)
(2)
9

FirstService Residential – Condo/HOA Market Opportunity
Total # of community associations: 365,000
We Have ~5% Share(1)
in a Sizeable Market(2)Total # of housing units: 28MM
Assessments collected from homeowners: $90+ BN(3)
Community association management companies: 7,000 – 8,000 Fragmented Industry
Percent of self-managed community associations: 35% Conversion Opportunity
Percent of U.S. homes in community associations: 21% Growing Trend Towards HOA Development
1 out of 2 new homes built in HOAs: 50%
Source: Community Associations Institute (2016).(1) Market share based on number of units.(2) Based on CAI data for U.S. market, plus an estimate for Canadian market.(3) Assessments fund many essential association obligations, including professional management services, utilities, security, insurance, common area maintenance,
landscaping, capital improvement projects, and amenities like pools and club houses.
10
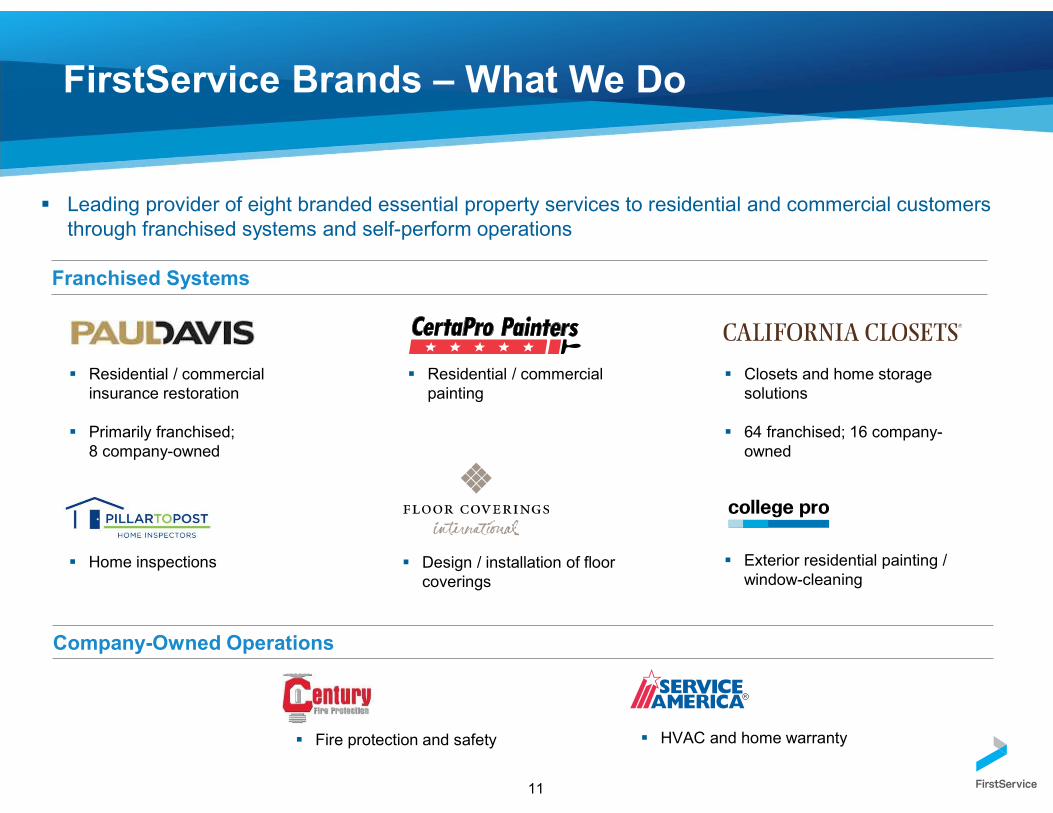
FirstService Brands – What We Do
Franchised Systems
11
Residential / commercial insurance restoration
Primarily franchised; 8 company-owned
Closets and home storage solutions
64 franchised; 16 company-owned
Company-Owned Operations
Residential / commercial painting
Home inspections Design / installation of floor coverings
Exterior residential painting / window-cleaning
Fire protection and safety HVAC and home warranty
Leading provider of eight branded essential property services to residential and commercial customers through franchised systems and self-perform operations

Economies of Scale as Leading Franchisor:
1,935 Franchisees$2.0BN System-Wide Sales (SWS)
2017 Revenue: $531MM
National Coverage:3,000 employees13,000+ in franchised operations
12
FirstService Brands – Profile
2017 SWS By Brand ($2.0BN)
Paul Davis42%
Certa Pro22%
Cal Closets19%
Pillar to Post
4%
Service America
1%
Floor Coverings
3%
College Pro2% Century Fire
7%
2017 Revenue Breakdown ($531MM)
Company-Owned
77%
Royalty/Franchise
23%
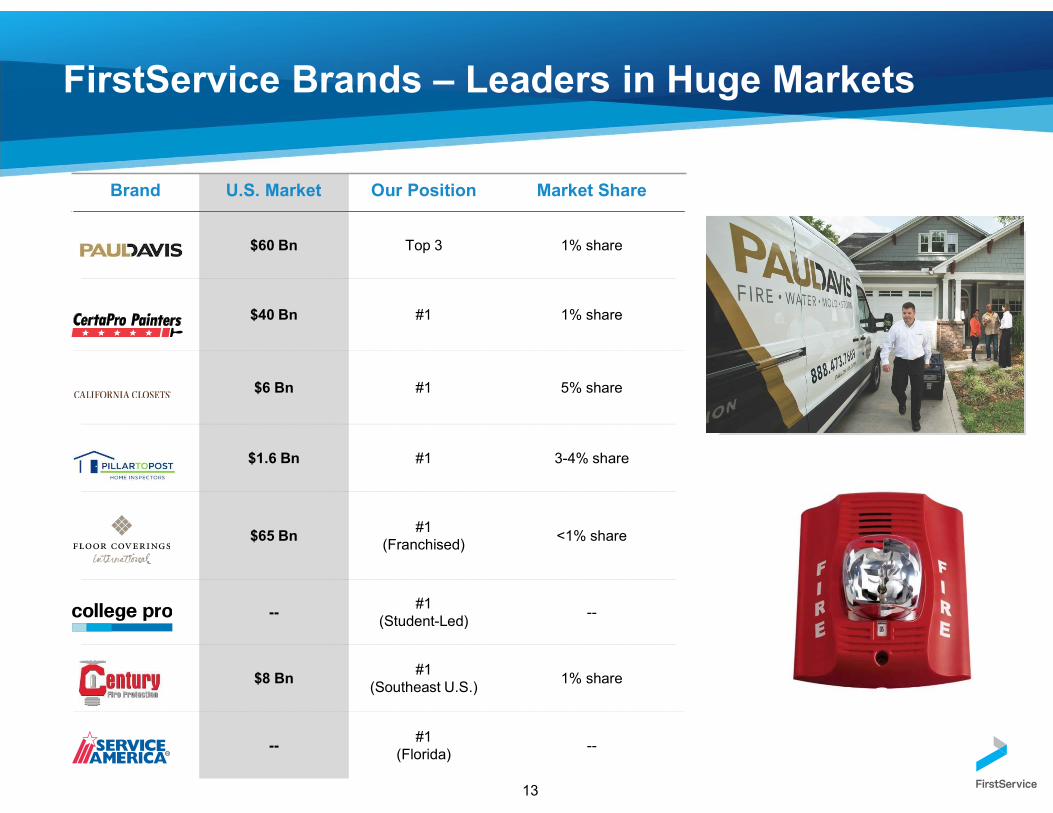
FirstService Brands – Leaders in Huge Markets
Brand U.S. Market Our Position Market Share
$60 Bn Top 3 1% share
$40 Bn #1 1% share
$6 Bn #1 5% share
$1.6 Bn #1 3-4% share
$65 Bn#1
(Franchised)<1% share
--#1
(Student-Led)--
$8 Bn#1
(Southeast U.S.)1% share
--#1
(Florida)--
13
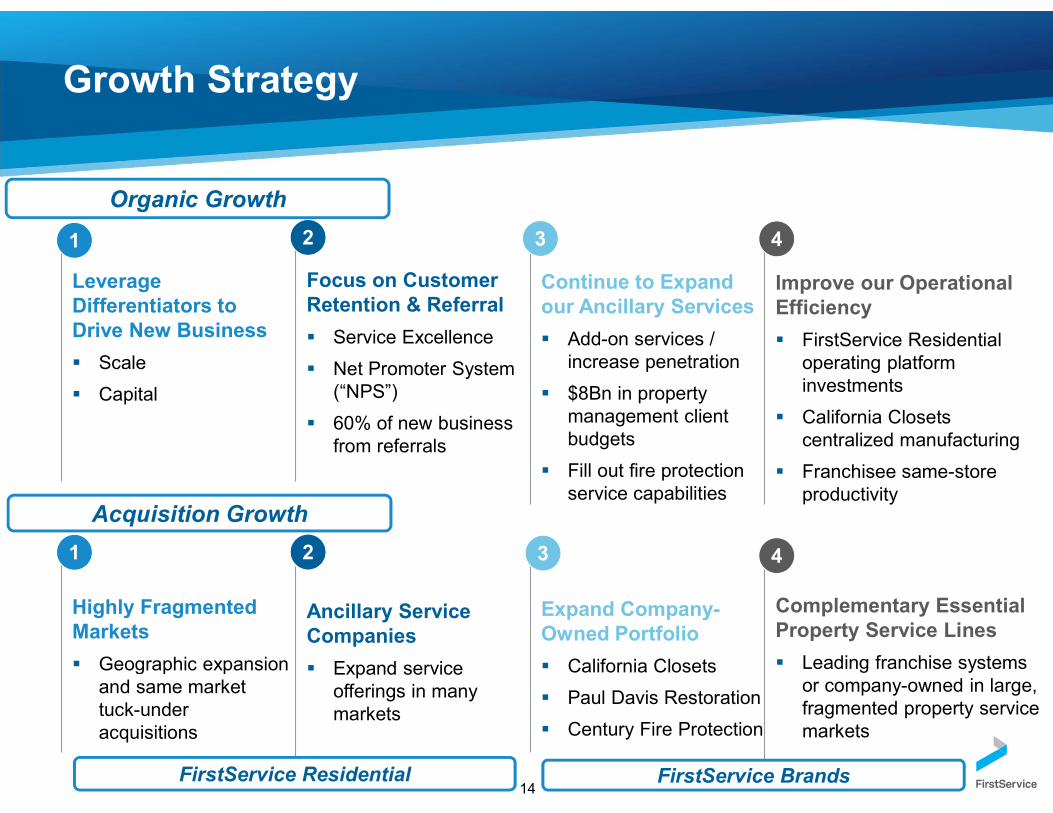
Growth Strategy
Leverage Differentiators to Drive New Business
Scale
Capital
Focus on Customer Retention & Referral
Service Excellence
Net Promoter System (“NPS”)
60% of new business from referrals
Improve our Operational Efficiency
FirstService Residential operating platform investments
California Closetscentralized manufacturing
Franchisee same-store productivity
Continue to Expand our Ancillary Services
Add-on services / increase penetration
$8Bn in property management client budgets
Fill out fire protection service capabilities
1 2 3 4
14
Organic Growth
Acquisition Growth
Highly Fragmented Markets
Geographic expansion and same market tuck-under acquisitions
Ancillary Service Companies
Expand service offerings in many markets
Complementary EssentialProperty Service Lines
Leading franchise systemsor company-owned in large, fragmented property service markets
Expand Company-Owned Portfolio
California Closets
Paul Davis Restoration
Century Fire Protection
3 421
FirstService Residential FirstService Brands

$78 $79 $74 $85
$103
$130
$162
8.3% 7.6% 6.5% 7.4% 8.2% 8.8% 9.5%
2012 2013 2014 Pro Forma2014
2015 2016 2017
Strong Historical Performance
(1) Adjusted EBITDA as presented above is a non-GAAP measure. Investors should consider non-GAAP measures in addition to, not as a substitute for, the comparable GAAP measures.
(2) 2014 Pro forma Adjusted EBITDA reflects annualized contribution from completed acquisitions and add-back of $9MM of non-recurring elevated employee medical benefits costs .
Revenues($ in millions)
($ in millions)
15
Recurring revenue model provides consistency and
predictability
Continue operational improvements to
incrementally expand operating
margins
(2)
$940 $1,038 $1,132 $1,264
$1,483 $1,705
2012 2013 2014 2015 2016 2017
Adjusted EBITDA(1)
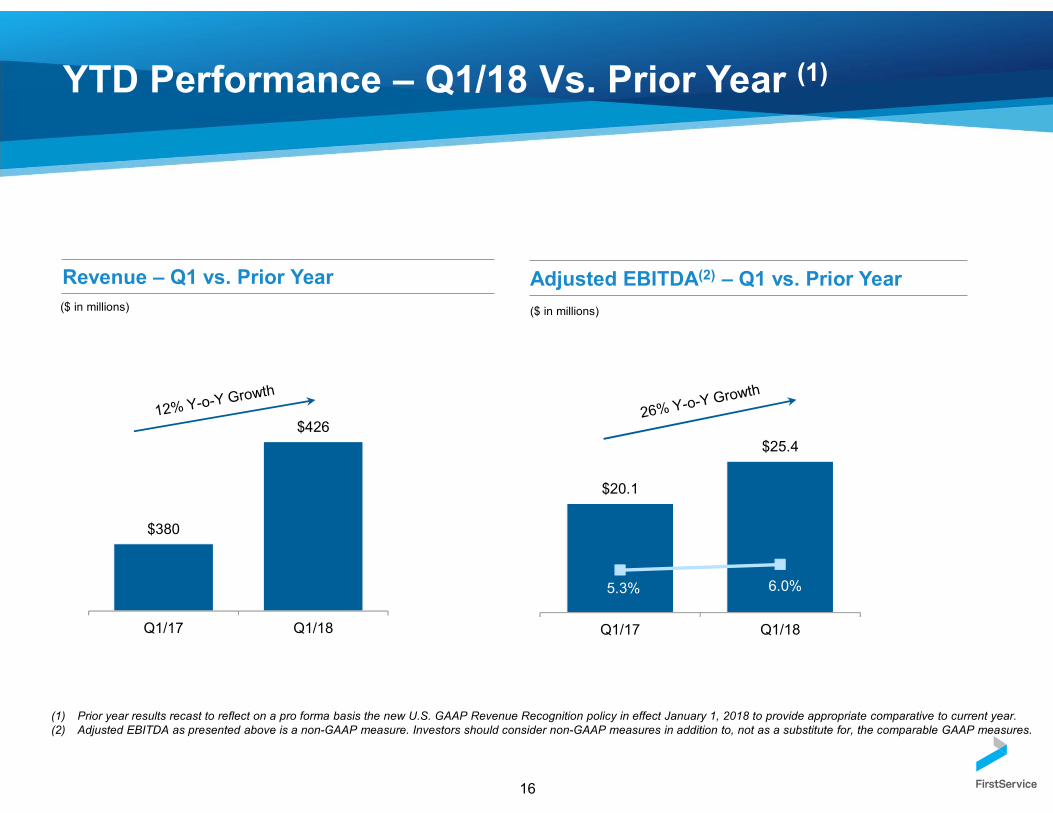
$380
$426
Q1/17 Q1/18
YTD Performance – Q1/18 Vs. Prior Year (1)
(1) Prior year results recast to reflect on a pro forma basis the new U.S. GAAP Revenue Recognition policy in effect January 1, 2018 to provide appropriate comparative to current year.(2) Adjusted EBITDA as presented above is a non-GAAP measure. Investors should consider non-GAAP measures in addition to, not as a substitute for, the comparable GAAP measures.
Revenue – Q1 vs. Prior Year Adjusted EBITDA(2) – Q1 vs. Prior Year($ in millions)
$20.1
$25.4
5.3% 6.0%
Q1/17 Q1/18
($ in millions)
16
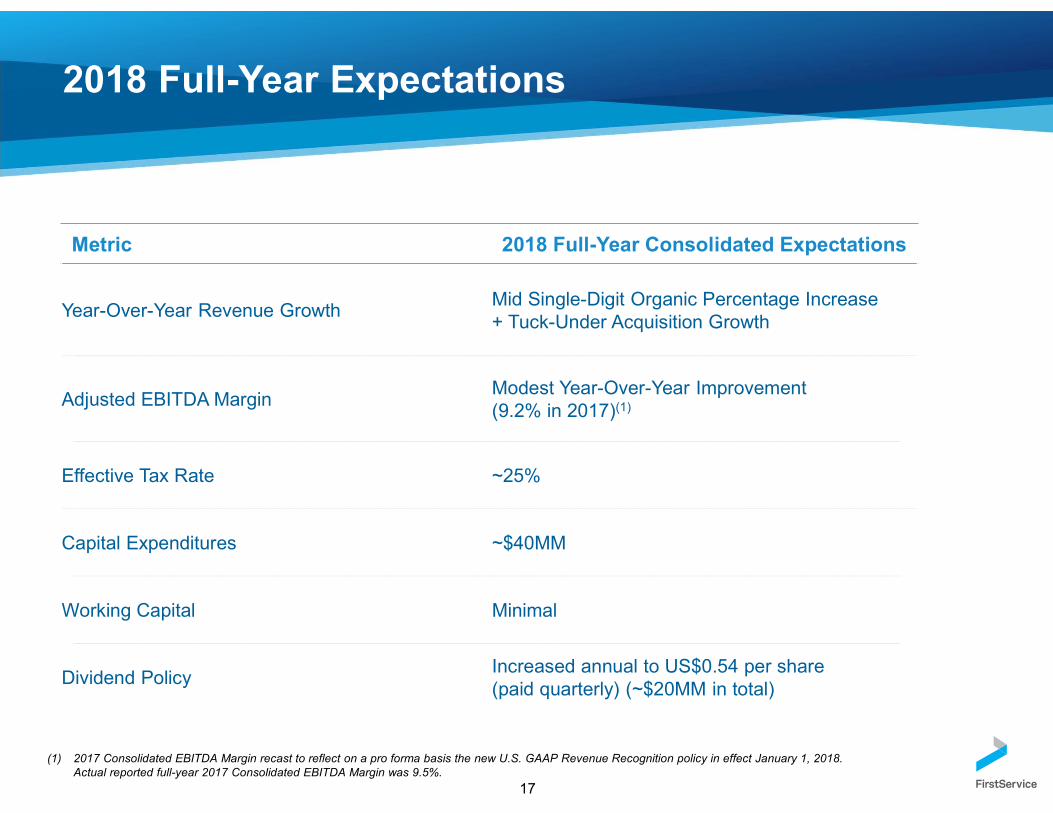
2018 Full-Year Expectations
Metric 2018 Full-Year Consolidated Expectations
Year-Over-Year Revenue GrowthMid Single-Digit Organic Percentage Increase+ Tuck-Under Acquisition Growth
Adjusted EBITDA MarginModest Year-Over-Year Improvement (9.2% in 2017)(1)
Effective Tax Rate ~25%
Capital Expenditures ~$40MM
Working Capital Minimal
Dividend PolicyIncreased annual to US$0.54 per share(paid quarterly) (~$20MM in total)
17
(1) 2017 Consolidated EBITDA Margin recast to reflect on a pro forma basis the new U.S. GAAP Revenue Recognition policy in effect January 1, 2018. Actual reported full-year 2017 Consolidated EBITDA Margin was 9.5%.

Capital Structure Summary
$250MM Bank Credit Facility
$150MM Senior Notes – 3.84% coupon long-term maturity (2025)
(1) Expressed as net debt / Trailing 12 Months Adjusted EBITDA, including annualized contribution from acquisitions.(2) Reflects cash on hand plus availability under revolving bank credit facility.
Attractive Lending Arrangements
Leverage and Liquidity
18
31-Dec-16 31-Dec-17 31-Mar-18
Net Debt / EBITDA (1) 1.5x 1.3x 1.5x
Total Liquidity ($ MM) (2) $140 $188 $141
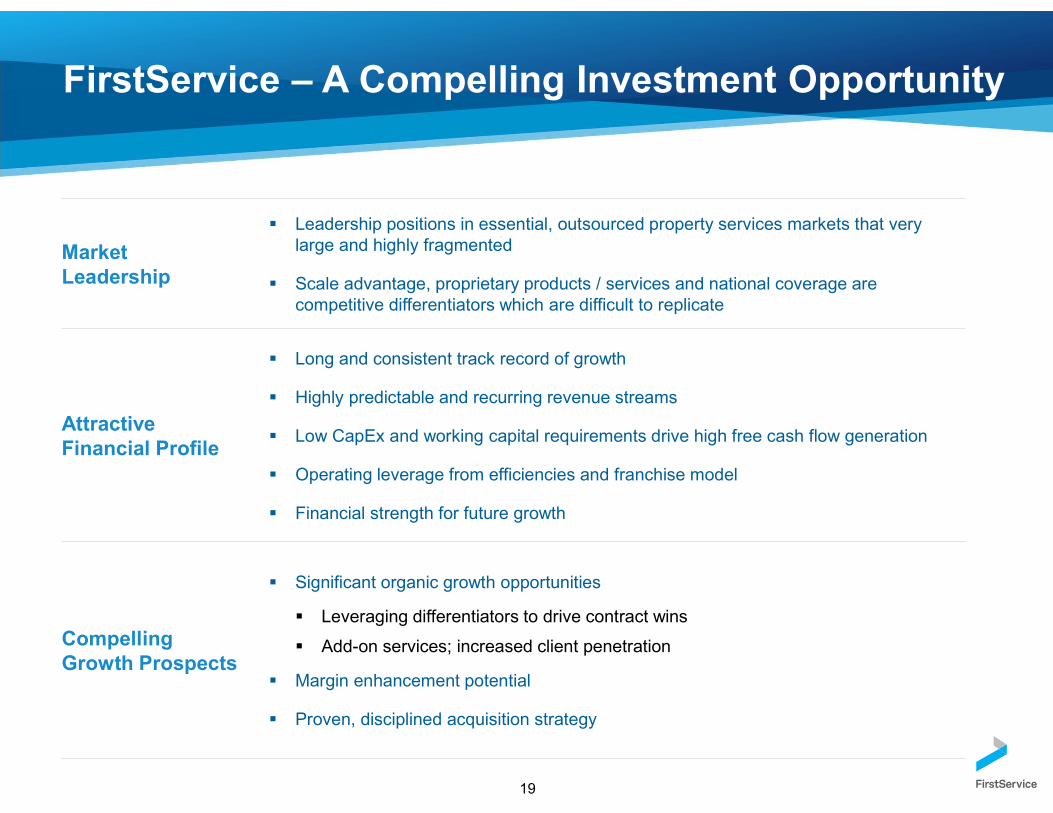
FirstService – A Compelling Investment Opportunity
Market Leadership
Leadership positions in essential, outsourced property services markets that very large and highly fragmented
Scale advantage, proprietary products / services and national coverage are competitive differentiators which are difficult to replicate
Attractive Financial Profile
Long and consistent track record of growth
Highly predictable and recurring revenue streams
Low CapEx and working capital requirements drive high free cash flow generation
Operating leverage from efficiencies and franchise model
Financial strength for future growth
Compelling Growth Prospects
Significant organic growth opportunities
Leveraging differentiators to drive contract wins
Add-on services; increased client penetration
Margin enhancement potential
Proven, disciplined acquisition strategy
19
20
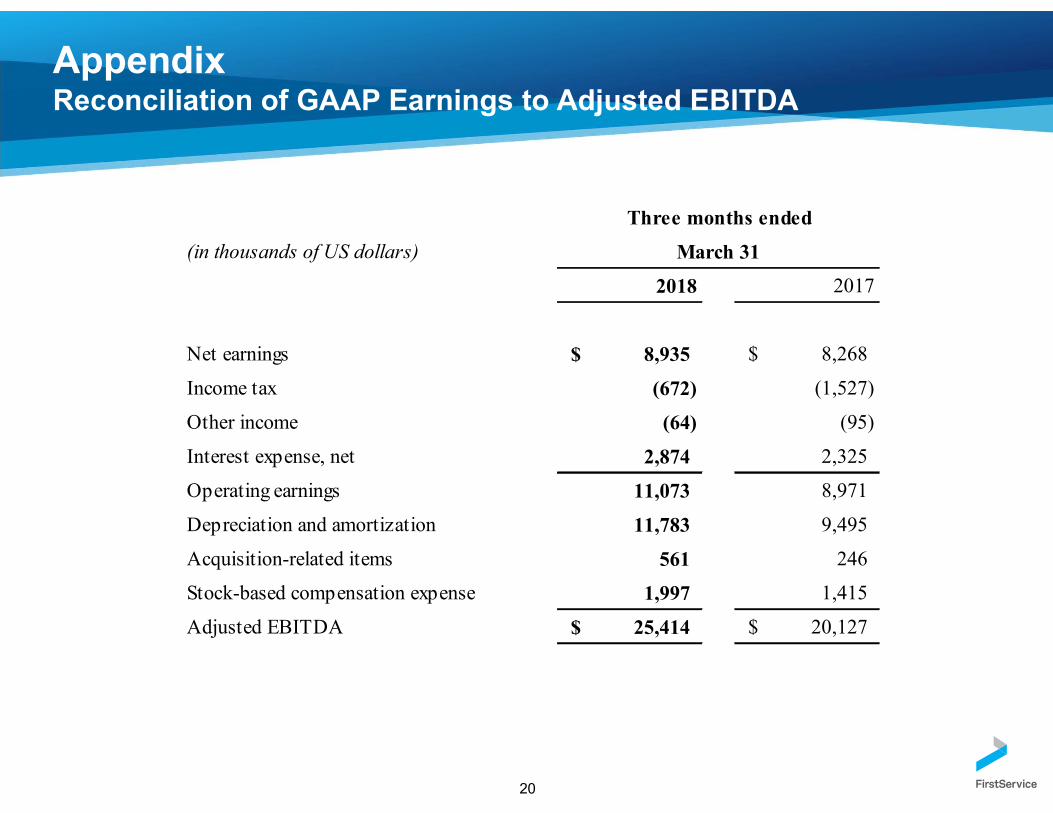
AppendixReconciliation of GAAP Earnings to Adjusted EBITDA
(in thousands of US dollars)
Net earnings $ 8,935 $ 8,268
Income tax (672) (1,527)
Other income (64) (95)
Interest expense, net 2,874 2,325
Operating earnings 11,073 8,971
Depreciation and amortization 11,783 9,495
Acquisition-related items 561 246
Stock-based compensation expense 1,997 1,415
Adjusted EBITDA $ 25,414 $ 20,127
Three months ended
March 31
2018 2017

21
AppendixReconciliation of GAAP Earnings to Adjusted Net Earnings and Adjusted Earnings Per Share
(in thousands of US dollars)
Net earnings $ 8,935 $ 8,268
Non-controlling interest share of earnings (2,320) (1,829)
Acquisition-related items 561 246
Amortization of intangible assets 3,914 3,186
Stock-based compensation expense 1,997 1,415
Stock-based compensation tax adjustment for US GAAP change (2,415) (3,743)
Income tax on adjustments (1,537) (1,770)
Non-controlling interest on adjustments (110) (71)
Adjusted net earnings $ 9,025 $ 5,702
(in US dollars)
Diluted net earnings per share 0.17 $ 0.12
Non-controlling interest redemption increment 0.01 0.06
Acquisition-related items 0.02 0.01
Amortization of intangible assets, net of tax 0.08 0.05
Stock-based compensation expense, net of tax 0.04 0.02
Stock-based compensation tax adjustment for US GAAP change (0.07) (0.10)
Adjusted EPS $ 0.25 $ 0.16
Three months ended
March 31
2018 2017
2018 2017
Three months ended
March 31