fiscal incidence in ghana - ceq institute · gyamfi, santiago herrera, robert intsiful, chris...
TRANSCRIPT

FISCAL INCIDENCE IN GHANA
Working Paper No. 35 December 2015
Stephen D. Younger, Eric Osei-Assibey and Felix Oppong

FISCAL INCIDENCE IN GHANA*
Stephen D. Younger, Eric Osei-Assibey, and Felix Oppong** CEQ Working Paper No. 35 DECEMBER 2015
ABSTRACT We use methods developed by the Commitment to Equity to assess the effects of government taxation, social spending, and indirect subsidies on poverty and inequality in Ghana. We also simulate several policy reforms to assess their distributional consequences. Keywords: fiscal incidence, poverty, inequality, fiscal policy, Ghana JEL: D31, H22, I14 ________________________________ * The CEQ Assessment Ghana has been produced by the Commitment to Equity Institute in collaboration with the World Bank. The study was possible thanks to the generous support from the Bill & Melinda Gates Foundation. **Stephen D. Younger is Scholar in Residence in the Department of Economics, Ithaca College, Ithaca, NY, [email protected]. Eric Osei-Assibey is Senior Lecturer in the Department of Economics, University of Ghana, Legon. [email protected] / [email protected]. Felix Oppong is an Economist at the World Bank’s Accra office, [email protected]. We are grateful to the following people who helped us understand taxation and social expenditure in Ghana: Mawutor Ablo, Eunice Yaa Brimfah Ackwerh, Yvonne Acquah, Benjamin Afful, Zalia Ali, Anthony Amuzu, Jacqueline Anum, Djibodi Apkatoli, Nelly Apo, Samuel Arkhurst, Joseph K. Asenso, Daniel Azubilia, Ernest Enyan, Sylvester Gyamfi, Santiago Herrera, Robert Intsiful, Chris Kuramoah, Adu Kus, Samilia Minta, Yaw Misefa, William Niyuni, Emmanuel Odame, Dan Osei, Abena Osei-Akoto, Michael Owusu, Samuel Set Passoh, Ohemeng Saibu, Azu Sam-Aziakor. We are also grateful to Theo Braimah Awanzam who assisted us with data collection. In addition, we are grateful for comments from Kathleen Beegle, Peter Darvas, Blanca Moreno-Dodson, and participants at seminars hosted by the World Bank Accra office, The University of Ghana, and the Ministry of Finance. Finally, we thank Nora Lustig and her colleagues at the Commitment to Equity Institute, particularly Samantha Greenspun, Ali Enami, Sean Higgins, and Sandra Martinez for many useful discussions on methods and interpretation of the results. Any remaining errors are our own.

1
1. INTRODUCTION One of the functions of government is to redistribute resources, especially to the most disadvantaged members of society. Although there is considerable disagreement over both the extent and the means to effect such redistribution, most people agree that society is better off if inequality and poverty can be reduced, and all governments do, in fact, redistribute income with their tax and expenditure policies, though not always progressively. The purpose of this paper is to examine the extent to which the government of Ghana does so. In particular, the paper addresses three general questions:
• How much redistribution and income poverty reduction is being accomplished through social spending, subsidies, and taxes?
• How progressive are revenue collection, subsidies, and government social spending?
• Within the limits of fiscal prudence, what could be done to increase redistribution and poverty reduction through changes in taxation and spending?
Such information is useful for policymakers in two broad ways. First, the government of Ghana regularly commits itself to reducing poverty and inequality and increasingly adopts policies explicitly intended to alter the distribution of income. Examples include: the Livelihood Empowerment against Poverty (LEAP) program, a conditional cash transfer program; elimination of school fees; free school meals in educationally deprived districts; fee exemptions for the National Health Insurance Scheme (NHIS); and substitution of taxation on gasoline and diesel for taxation on kerosene. This study will give information on the effectiveness of these and other policies at redistributing income. That information is particularly relevant in the context of the current macroeconomic crisis. Government clearly needs some combination of reduced spending and increased taxation. The study will shed light on how the selection of specific expenditures for cuts and specific taxes for increases would affect inequality and poverty. Second, the study will give an estimate of the overall effect of government spending and taxation—the “fisc”—on the distribution of income. As we will see, despite great interest in the country, this effect is rather small, but given the experience of other countries, it is about what one would expect for a country of Ghana’s GDP per capita and overall inequality. Every incidence analysis should include a preemptory caution. When we find that one tax or expenditure is more redistributive to the poor than another, the temptation is to conclude that the former is preferable. But it is important to remember that redistribution is only one of many criteria that matter when making public policy. In particular, efficiency matters, too, so not all redistributive taxes or expenditures are good ones, and not all good taxes or expenditures are redistributive. The results of this study and of all incidence studies are one input to public policymaking, one that should be weighed with other goals before deciding that a tax or expenditure is desirable.
2
2. METHODS AND APPROACH
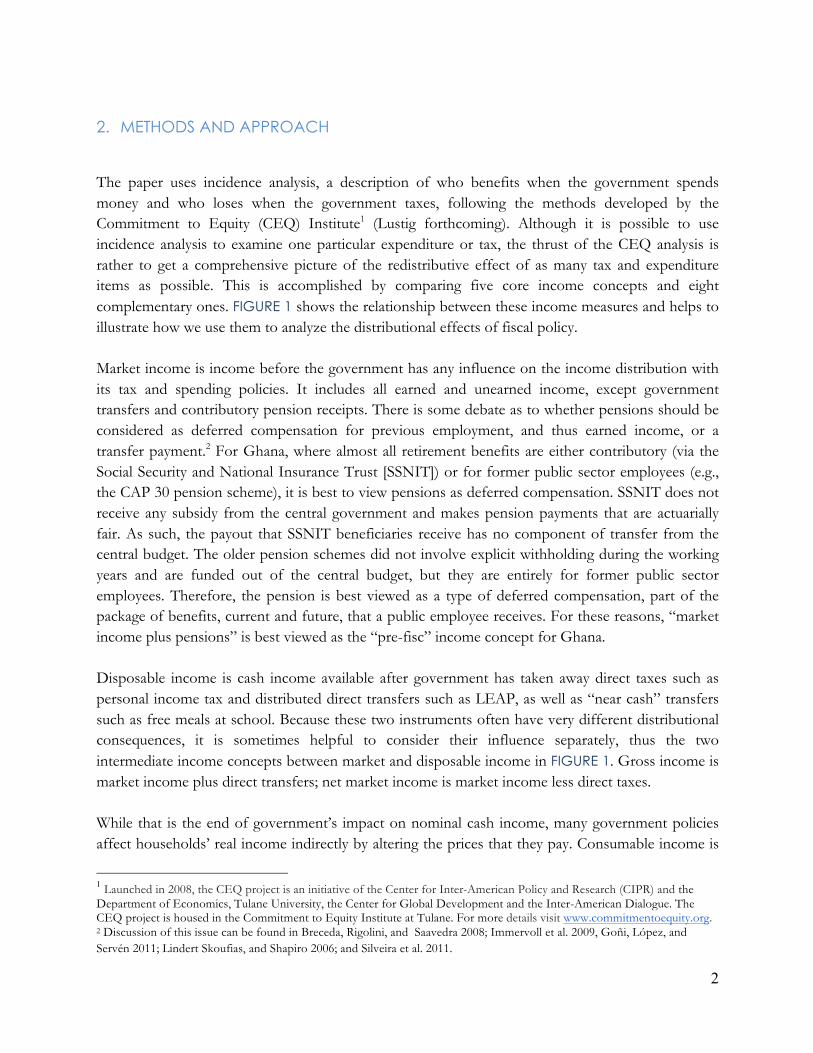
The paper uses incidence analysis, a description of who benefits when the government spends money and who loses when the government taxes, following the methods developed by the Commitment to Equity (CEQ) Institute1 (Lustig forthcoming). Although it is possible to use incidence analysis to examine one particular expenditure or tax, the thrust of the CEQ analysis is rather to get a comprehensive picture of the redistributive effect of as many tax and expenditure items as possible. This is accomplished by comparing five core income concepts and eight complementary ones. FIGURE 1 shows the relationship between these income measures and helps to illustrate how we use them to analyze the distributional effects of fiscal policy. Market income is income before the government has any influence on the income distribution with its tax and spending policies. It includes all earned and unearned income, except government transfers and contributory pension receipts. There is some debate as to whether pensions should be considered as deferred compensation for previous employment, and thus earned income, or a transfer payment.2 For Ghana, where almost all retirement benefits are either contributory (via the Social Security and National Insurance Trust [SSNIT]) or for former public sector employees (e.g., the CAP 30 pension scheme), it is best to view pensions as deferred compensation. SSNIT does not receive any subsidy from the central government and makes pension payments that are actuarially fair. As such, the payout that SSNIT beneficiaries receive has no component of transfer from the central budget. The older pension schemes did not involve explicit withholding during the working years and are funded out of the central budget, but they are entirely for former public sector employees. Therefore, the pension is best viewed as a type of deferred compensation, part of the package of benefits, current and future, that a public employee receives. For these reasons, “market income plus pensions” is best viewed as the “pre-fisc” income concept for Ghana. Disposable income is cash income available after government has taken away direct taxes such as personal income tax and distributed direct transfers such as LEAP, as well as “near cash” transfers such as free meals at school. Because these two instruments often have very different distributional consequences, it is sometimes helpful to consider their influence separately, thus the two intermediate income concepts between market and disposable income in FIGURE 1. Gross income is market income plus direct transfers; net market income is market income less direct taxes. While that is the end of government’s impact on nominal cash income, many government policies affect households’ real income indirectly by altering the prices that they pay. Consumable income is
1 Launched in 2008, the CEQ project is an initiative of the Center for Inter-American Policy and Research (CIPR) and the Department of Economics, Tulane University, the Center for Global Development and the Inter-American Dialogue. The CEQ project is housed in the Commitment to Equity Institute at Tulane. For more details visit www.commitmentoequity.org. 2 Discussion of this issue can be found in Breceda, Rigolini, and Saavedra 2008; Immervoll et al. 2009, Goñi, López, and Servén 2011; Lindert Skoufias, and Shapiro 2006; and Silveira et al. 2011.
3
disposable income less indirect taxes—VAT, import duties, and excise taxes—plus indirect subsidies, such as the support that government gives to electricity generators and distributors. Again, there are two intermediate income concepts between disposable and consumable income to capture the effect of indirect taxes and subsidies separately.
FIGURE 1 – DEFINITION OF CEQ INCOME CONCEPTS
Source: Lustig and Higgins forthcoming. The last way that government influences the income distribution is through the provision of free or subsidized services such as health and education. Final income is consumable income plus the value of these in-kind benefits, less any user fees paid for those services. Moving from consumable to final income highlights the effect on poverty and inequality of public health and education expenditures. Our assumptions on the economic incidence of taxes are simple: direct taxes are born entirely by the income earner; indirect taxes are born entirely by the consumer. This latter assumption is not entirely appropriate if markets are not competitive, and many are not in Ghana. However, the extent to which monopolies or oligopolies shift indirect taxes to consumers is not clear and could be either greater or less than 100 percent, depending on the functional form of the demand function
!
!
!
!
!
!
!
!
!
!
Market'Income'
+'Direct!transfers! Direct!taxes!
Gross'Income'
+'
Net'Market'Income'
Contributory!pensions!
Market'Income'plus'Pensions'
6'
Disposable'Income'
Direct!transfers!+'Direct!taxes! 6'
Disposable'Income'minus'Consumption'Taxes'
Consumption!taxes!6'
Disposable'Income'plus'Consumption'subsidies'
!
Consumption!subsidies! +'
Consumable'Income'
Consumption!subsidies!
!
+'Consumption!taxes! 6'
Final'Income'
Monetized!value!of!education!and!health!
services!
+'
+'
Market'Income'plus'Direct'Transfers'plus'Consumption'Subsidies'
Market'Income'minus'Direct'Taxes'minus'Consumption'Taxes'
6'
+'
Market'Income'plus'All'Transfers!
Net'Market'Income'plus'All'Transfers!
+' 6'
+'
+'
+'
4
(Fullerton and Metcalf 1992). Since we have no information on those functional forms, we assume that 100 percent of taxes are shifted to consumers regardless of market structure. The one exception we have made to these simple incidence assumptions is the fertilizer subsidy, which we assume falls on the food producers that receive it, not food consumers. 3. DATA
To understand the distributional consequences of taxes and public expenditures, we need data on all of the above income concepts for a representative sample of individuals in the country. We can then use those data to construct income distributions for each income concept outlined in the previous section and derive summary statistics for those distributions. In Ghana, we use the 2012/13 Ghana Living Standards Survey, round 6, the most recent such survey in the country.3 In addition, we use administrative tax and expenditure data from fiscal 2013 to estimate some of the information needed, most specifically, the per beneficiary amount of spending on public education and health services.
i. Construction of the Income and Expenditure Variables Disposable Income Our construction of the CEQ income concepts starts with disposable income and works backward to market incomes and forward to final incomes (see FIGURE 1). We assume that the welfare measure most commonly used from the Ghana Living Standards Survey (GLSS), household expenditures, is closest conceptually to disposable income. We use the expenditure variable as constructed by the Ghana Statistical Service, though; as will become evident, we usually divide it by household size rather than an adult equivalence scale to measure “welfare.” This is to keep our results as comparable as possible to CEQ studies in other countries.4 Market Income We construct market income as disposable income plus all direct taxes and less all direct transfers. Gross income and net market income follow in the obvious fashion. Ghana has only one cash transfer program, the Livelihood Empowerment against Poverty (LEAP). The GLSS asks respondents directly about receipt of any payments from LEAP over the past year, but at the time of the survey, LEAP was still a small program that was concentrated in districts that, purely by chance, happened not to be selected for the GLSS sample. As a result, too few households 3 http://www.statsghana.gov.gh/surveys.html
4 Similar studies can be found at http://www.commitmentoequity.org.

5
respond positively to give a reasonable estimate of the program’s incidence. Instead, we have simulated who is eligible for LEAP based on the program’s criteria: the household must be headed by a child, an elderly person, or a disabled person; or it must include an elderly person or a vulnerable child. The latter includes children who have lost one or both parent(s) or are disabled. In addition, the household must have a proxy means test (PMT) value that puts it among the 20 percent of poorest households as indicated by the PMT.5 Finally, we restricted beneficiaries to those living in districts where LEAP was active in 2012–13. We then assume that each eligible person (up to four) in the household receives a monthly benefit of 24 cedis. This yields total benefits paid that are considerably larger than those reported by the LEAP administration, so we scaled them down for each simulated recipient so as to match the administrative total when added up. In addition to direct cash transfers, there are quasi-cash transfers associated with the provision of free school uniforms and free meals at school for some students. GLSS does not allow us to identify who has received a free school uniform or free meals at school. However, it does record the name of the school(s) in students’ communities. We cross that information with a database indicating which primary schools receive free meals. (The program applies to all or none of the students in a particular school.) Students who attend a school in the feeding program receive a meal for which the government pays 0.5 cedis per day. We use that value multiplied by 200 (school days per year) to get a monetary value of the free meals.6 Even though there are a few junior high schools that receive free school meals, we are not able to include them in the analysis. The GLSS does not ask about employee income taxes paid (PAYE), so we must simulate these values. We assume that formal sector workers pay statutory rates for both personal income tax (PIT) and social security contributions (SSC). At the same time, because there is widespread agreement that tax evasion through informality is an important problem in Ghana, we assume that the self-employed pay neither PIT nor SSC. The GLSS questionnaire does ask households who run their own businesses about “taxes paid on product.” We assume that these are presumptive taxes and count them as “direct” taxation, even though they are meant to capture both income tax and VAT. It is not possible to identify the owners of corporations, so we do not simulate the corporate income tax.
5 We have used the old PMT formula, which was in effect at the time of the GLSS survey. It has since been updated using information from the same GLSS to improve targeting. We are grateful to the Ministry of Gender, Children, and Social Protection and to Kathleen Beegle for calculating the PMT scores for us. 6 Some GLSS clusters include more than one community, and some communities have more than one school. Since we do not know whether a particular student attends a particular school, we cannot say with certainty that a student in a cluster with multiple schools receives a free meal or not if some of the schools have the program and others do not. In these cases, for about 30 percent of the total, we distribute the benefit to all students in the cluster, divided by the number of schools recorded for the cluster. So a student in a cluster with three schools, only one of which has a feeding program, will get 0.33*0.50 cedis per school day in benefits.
6
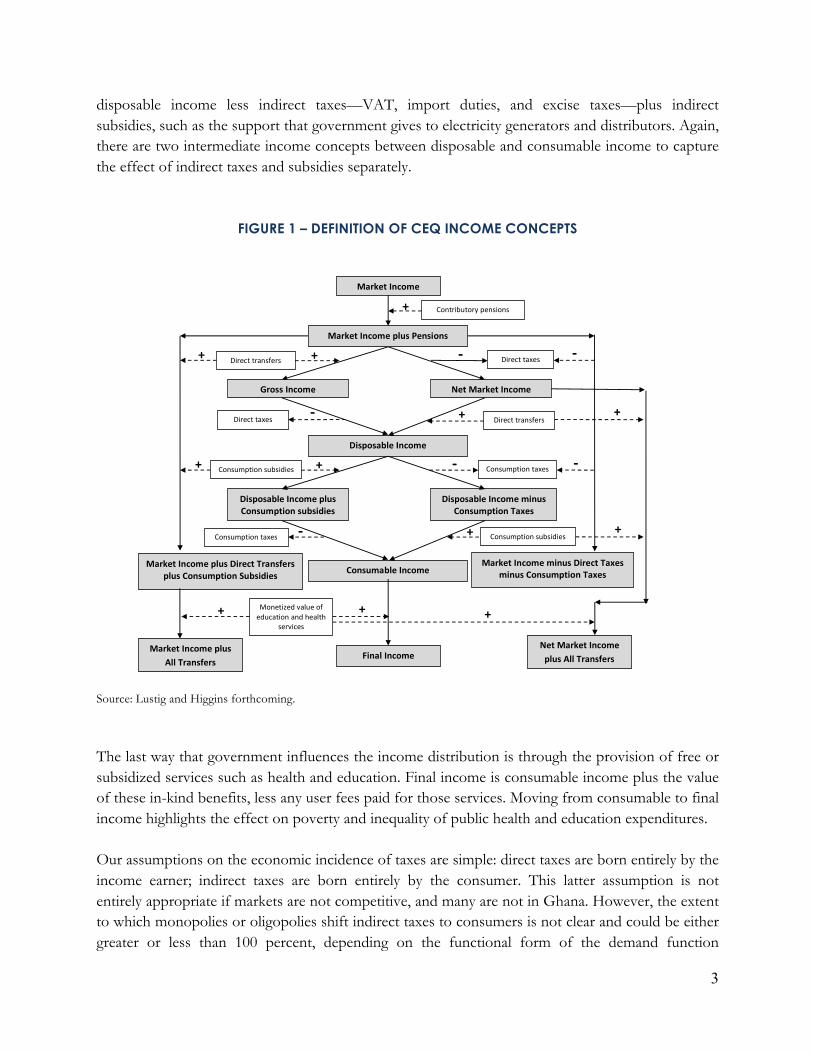
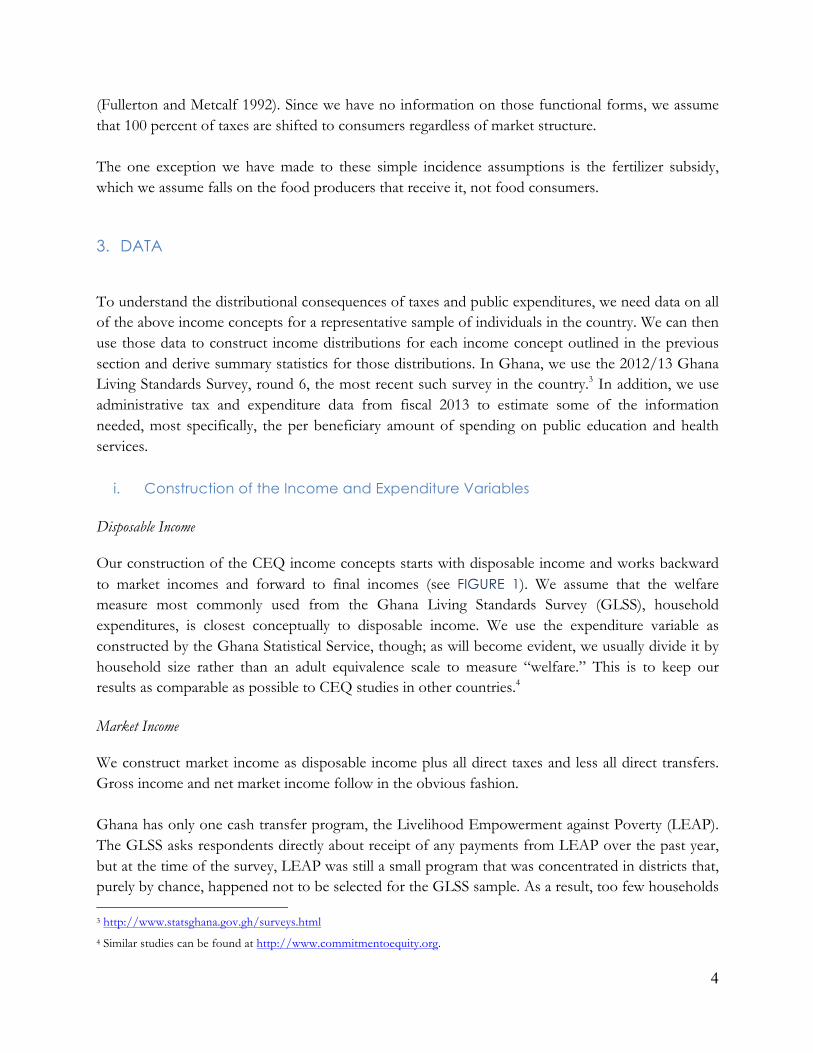
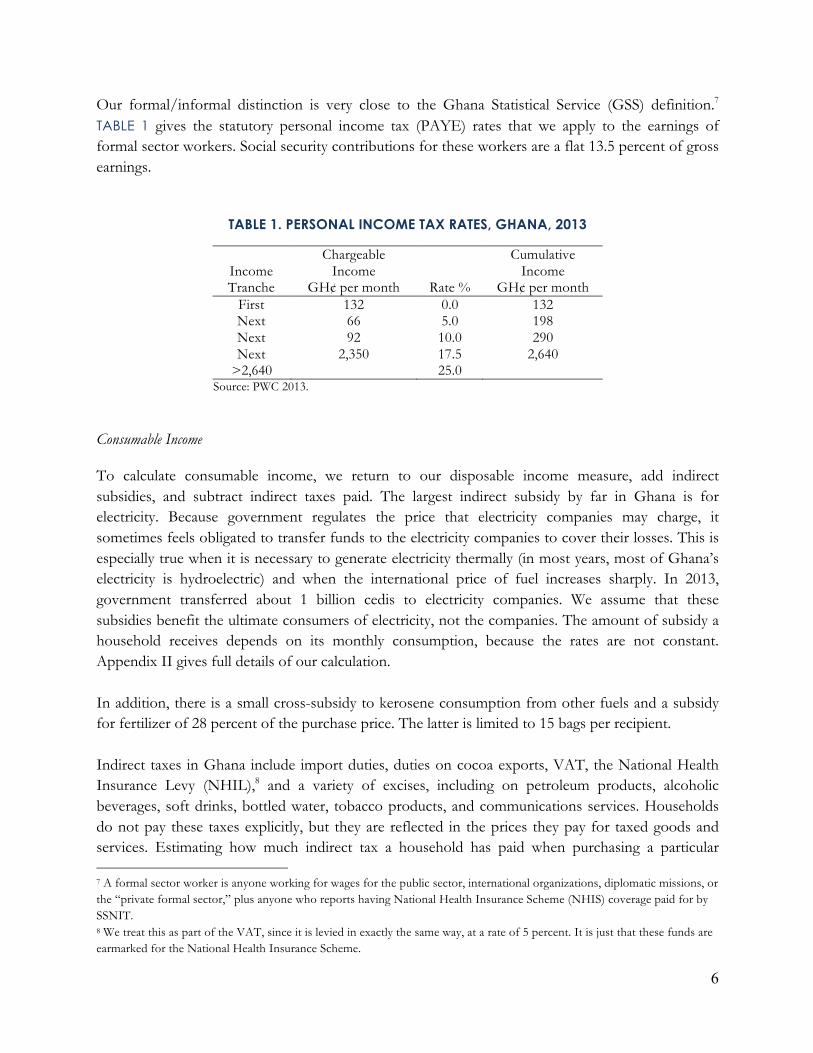
Our formal/informal distinction is very close to the Ghana Statistical Service (GSS) definition.7 TABLE 1 gives the statutory personal income tax (PAYE) rates that we apply to the earnings of formal sector workers. Social security contributions for these workers are a flat 13.5 percent of gross earnings.
TABLE 1. PERSONAL INCOME TAX RATES, GHANA, 2013
Income Tranche
Chargeable Income
GH¢ per month Rate %
Cumulative Income
GH¢ per month First 132 0.0 132 Next 66 5.0 198 Next 92 10.0 290 Next 2,350 17.5 2,640
>2,640 25.0 Source: PWC 2013. Consumable Income To calculate consumable income, we return to our disposable income measure, add indirect subsidies, and subtract indirect taxes paid. The largest indirect subsidy by far in Ghana is for electricity. Because government regulates the price that electricity companies may charge, it sometimes feels obligated to transfer funds to the electricity companies to cover their losses. This is especially true when it is necessary to generate electricity thermally (in most years, most of Ghana’s electricity is hydroelectric) and when the international price of fuel increases sharply. In 2013, government transferred about 1 billion cedis to electricity companies. We assume that these subsidies benefit the ultimate consumers of electricity, not the companies. The amount of subsidy a household receives depends on its monthly consumption, because the rates are not constant. Appendix II gives full details of our calculation. In addition, there is a small cross-subsidy to kerosene consumption from other fuels and a subsidy for fertilizer of 28 percent of the purchase price. The latter is limited to 15 bags per recipient. Indirect taxes in Ghana include import duties, duties on cocoa exports, VAT, the National Health Insurance Levy (NHIL),8 and a variety of excises, including on petroleum products, alcoholic beverages, soft drinks, bottled water, tobacco products, and communications services. Households do not pay these taxes explicitly, but they are reflected in the prices they pay for taxed goods and services. Estimating how much indirect tax a household has paid when purchasing a particular 7 A formal sector worker is anyone working for wages for the public sector, international organizations, diplomatic missions, or the “private formal sector,” plus anyone who reports having National Health Insurance Scheme (NHIS) coverage paid for by SSNIT. 8 We treat this as part of the VAT, since it is levied in exactly the same way, at a rate of 5 percent. It is just that these funds are earmarked for the National Health Insurance Scheme.

7
product is complicated by variable tax rates, significant tax evasion, and the fact that some of these taxes fall on intermediate products that then increase the prices of entirely different products. This latter problem is especially important for petroleum excises and import duties. To incorporate these problems in our analysis, we use the 2005 social accounting matrix (SAM) that the Ghana Statistical Service built (Breisinger, et.al. 2007) and a technique of Roland-Holst and Sancho (1995) that calculates both the direct and indirect effects of VAT, import duties, and petroleum excises on the final prices of all goods and services by tracing their impact through the input-output table. We then map the industries in the SAM to each item in the GLSS expenditure modules, applying the “effective” (direct + indirect) tax rate from the SAM to the corresponding expenditure items. For non-petroleum excises, on the other hand, we apply the statutory rates directly to households’ consumption to estimate the implicit tax paid. This is because formal sector firms produce most of these products, so the taxes are likely to be paid. TABLE 2 gives the excise rates in question.
TABLE 2. EXCISE DUTY RATES, GHANA, 2013
Item Rate Mineral water, bottled water, and soft drinks 17.5%
Malt drinks (0, 30, 50, 70 percent local content) /1 17.5%, 12.5%, 7.5%, 2.5% Beer and stout (0, 30, 50, 70 percent local content) /2 47.5%, 30%, 20%, 10%
Wine 22.5% Spirits, except akpeteshie 25%
Akpeteshie 20% Cigarettes 150%
Snuff and other tobacco 170.65% Gasoline /3 21.93 pesewas per liter
Diesel /3 13.25 pesewas per liter Kerosene /3 -3.71 pesewas per liter
Source: Ministry of Finance Notes: /1 We have assumed maximum local content for a rate of 2.5 percent.
/2 We have maximum local content for beers indicated as “domestic” in the GLSS, for a rate of 10 percent. /3 Includes excise duty, exploratory levies, Energy Fund Levy, Road Fund Levy, Debt Recovery Fund Levy, and a cross-subsidy levy. The latter makes the net tax on kerosene negative, i.e., a subsidy.
We assume that cocoa producers bear the burden of cocoa duties. We have used the statutory rate of 3 percent of the value of sales (Kolavalli et al. 2012).
Final Income To calculate final income, we add in-kind transfers associated with public provision of education and health care to consumable income. This step is important because these items are a large share of social spending in Ghana, but it is difficult because these services are often provided free-of-charge to recipients and even when fees are charged, they do not reflect the government’s full cost of
8
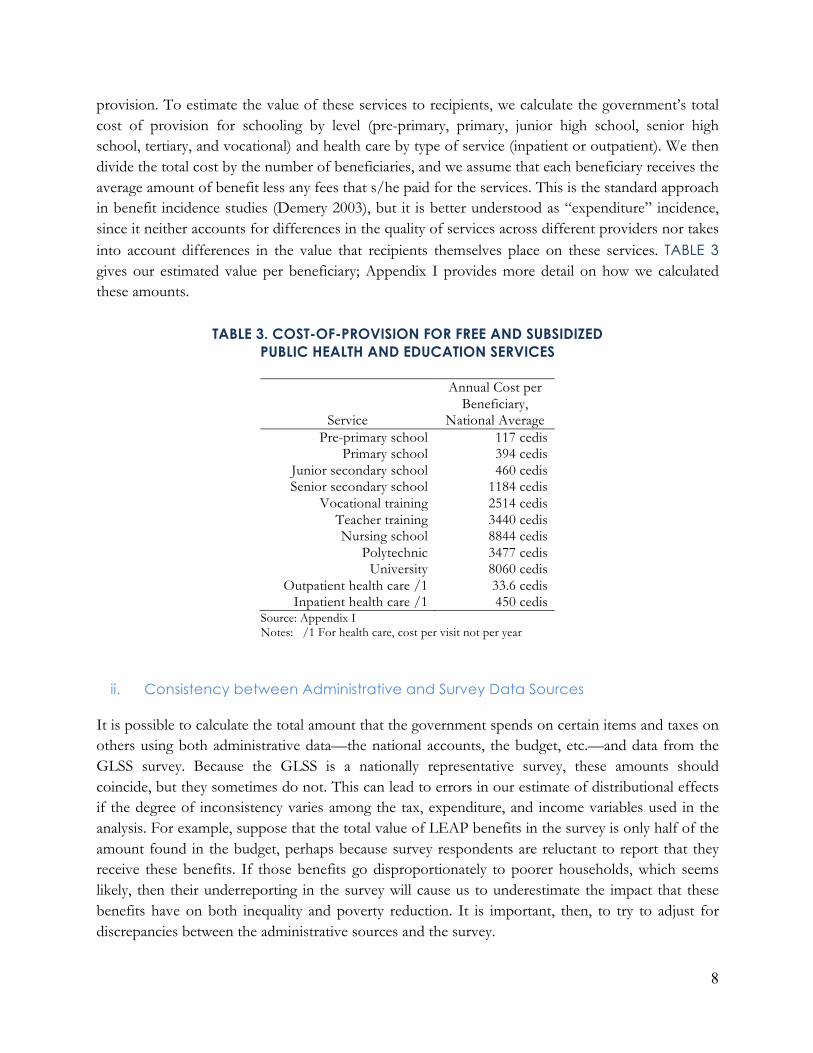
provision. To estimate the value of these services to recipients, we calculate the government’s total cost of provision for schooling by level (pre-primary, primary, junior high school, senior high school, tertiary, and vocational) and health care by type of service (inpatient or outpatient). We then divide the total cost by the number of beneficiaries, and we assume that each beneficiary receives the average amount of benefit less any fees that s/he paid for the services. This is the standard approach in benefit incidence studies (Demery 2003), but it is better understood as “expenditure” incidence, since it neither accounts for differences in the quality of services across different providers nor takes into account differences in the value that recipients themselves place on these services. TABLE 3 gives our estimated value per beneficiary; Appendix I provides more detail on how we calculated these amounts.
TABLE 3. COST-OF-PROVISION FOR FREE AND SUBSIDIZED PUBLIC HEALTH AND EDUCATION SERVICES
Service
Annual Cost per Beneficiary,
National Average Pre-primary school 117 cedis
Primary school 394 cedis Junior secondary school 460 cedis Senior secondary school 1184 cedis
Vocational training 2514 cedis Teacher training 3440 cedis Nursing school 8844 cedis
Polytechnic 3477 cedis University 8060 cedis
Outpatient health care /1 33.6 cedis Inpatient health care /1 450 cedis
Source: Appendix I Notes: /1 For health care, cost per visit not per year !
ii. Consistency between Administrative and Survey Data Sources It is possible to calculate the total amount that the government spends on certain items and taxes on others using both administrative data—the national accounts, the budget, etc.—and data from the GLSS survey. Because the GLSS is a nationally representative survey, these amounts should coincide, but they sometimes do not. This can lead to errors in our estimate of distributional effects if the degree of inconsistency varies among the tax, expenditure, and income variables used in the analysis. For example, suppose that the total value of LEAP benefits in the survey is only half of the amount found in the budget, perhaps because survey respondents are reluctant to report that they receive these benefits. If those benefits go disproportionately to poorer households, which seems likely, then their underreporting in the survey will cause us to underestimate the impact that these benefits have on both inequality and poverty reduction. It is important, then, to try to adjust for discrepancies between the administrative sources and the survey.
9
In Ghana, the GLSS estimates and the public accounts are quite consistent for most of the items we consider in this study. Our original estimates of both the benefit associated with public inpatient health care and the number of in-patients at public facilities was far too high, so we have scaled that benefit down by a factor of 0.33.9
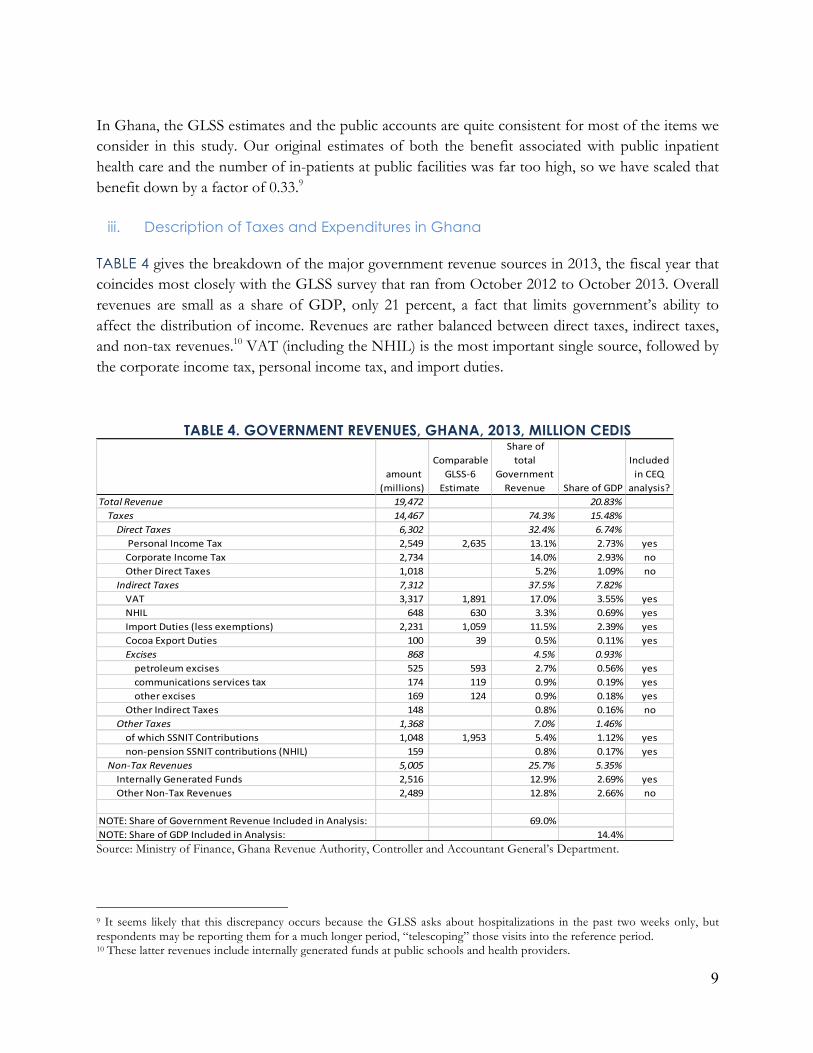
iii. Description of Taxes and Expenditures in Ghana TABLE 4 gives the breakdown of the major government revenue sources in 2013, the fiscal year that coincides most closely with the GLSS survey that ran from October 2012 to October 2013. Overall revenues are small as a share of GDP, only 21 percent, a fact that limits government’s ability to affect the distribution of income. Revenues are rather balanced between direct taxes, indirect taxes, and non-tax revenues.10 VAT (including the NHIL) is the most important single source, followed by the corporate income tax, personal income tax, and import duties.
TABLE 4. GOVERNMENT REVENUES, GHANA, 2013, MILLION CEDIS
Source: Ministry of Finance, Ghana Revenue Authority, Controller and Accountant General’s Department. 9 It seems likely that this discrepancy occurs because the GLSS asks about hospitalizations in the past two weeks only, but respondents may be reporting them for a much longer period, “telescoping” those visits into the reference period. 10 These latter revenues include internally generated funds at public schools and health providers.
!amount!(millions)!
!Comparable!GLSS56!Estimate!
!Share!of!total!
Government!Revenue! !Share!of!GDP!
Included!in!CEQ!
analysis?Total&Revenue 19,472&&&&&& 20.83%&&&&Taxes 14,467&&&&&& 74.3% 15.48%&&&&&&&&Direct&Taxes 6,302&&&&&&&& 32.4% 6.74%!!!!!!!!!!!!!Personal!Income!Tax 2,549!!!!!!!!! 2,635!!!!!!!!!!!!! 13.1% 2.73% yes!!!!!!!!!!!!Corporate!Income!Tax 2,734!!!!!!!!! 14.0% 2.93% no!!!!!!!!!!!!Other!Direct!Taxes 1,018!!!!!!!!! 5.2% 1.09% no&&&&&&&&Indirect&Taxes 7,312&&&&&&&& 37.5% 7.82%!!!!!!!!!!!!VAT 3,317!!!!!!!!! 1,891!!!!!!!!!!!!! 17.0% 3.55% yes!!!!!!!!!!!!NHIL 648!!!!!!!!!!!! 630!!!!!!!!!!!!!!!!! 3.3% 0.69% yes!!!!!!!!!!!!Import!Duties!(less!exemptions) 2,231!!!!!!!!! 1,059!!!!!!!!!!!!! 11.5% 2.39% yes!!!!!!!!!!!!Cocoa!Export!Duties 100!!!!!!!!!!!! 39!!!!!!!!!!!!!!!!!!! 0.5% 0.11% yes&&&&&&&&&&&&Excises 868&&&&&&&&&&&& 4.5% 0.93%!!!!!!!!!!!!!!!!petroleum!excises 525!!!!!!!!!!!! 593!!!!!!!!!!!!!!!!! 2.7% 0.56% yes!!!!!!!!!!!!!!!!communications!services!tax 174!!!!!!!!!!!! 119!!!!!!!!!!!!!!!!! 0.9% 0.19% yes!!!!!!!!!!!!!!!!other!excises 169!!!!!!!!!!!! 124!!!!!!!!!!!!!!!!! 0.9% 0.18% yes!!!!!!!!!!!!Other!Indirect!Taxes 148!!!!!!!!!!!! 0.8% 0.16% no&&&&&&&&Other&Taxes& 1,368&&&&&&&& 7.0% 1.46%!!!!!!!!!!!!of!which!SSNIT!Contributions 1,048!!!!!!!!! 1,953!!!!!!!!!!!!! 5.4% 1.12% yes!!!!!!!!!!!!non5pension!SSNIT!contributions!(NHIL) 159!!!!!!!!!!!! 0.8% 0.17% yes&&&&NonETax&Revenues 5,005&&&&&&&& 25.7% 5.35%!!!!!!!!Internally!Generated!Funds 2,516!!!!!!!!! 12.9% 2.69% yes!!!!!!!!Other!Non5Tax!Revenues 2,489!!!!!!!!! 12.8% 2.66% no
NOTE:!Share!of!Government!Revenue!Included!in!Analysis: 69.0%NOTE:!Share!of!GDP!Included!in!Analysis: 14.4%
10
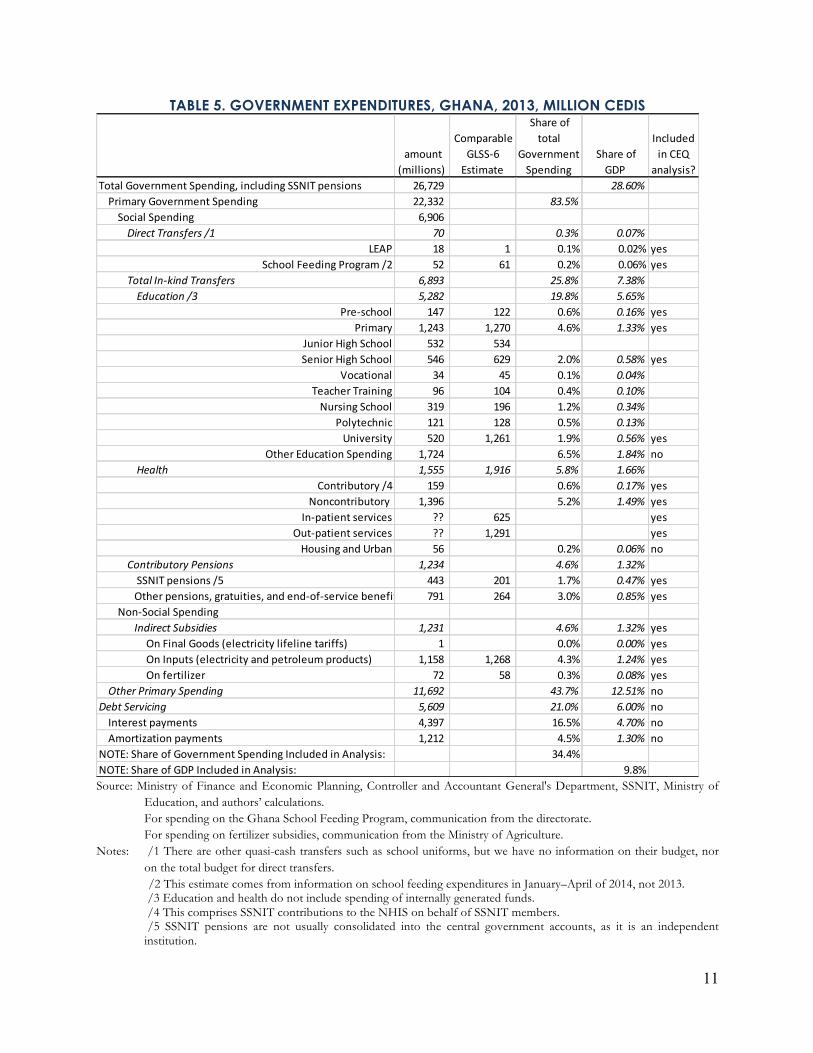
Overall, our analysis treats tax items that account for 69 percent of total government revenues and 14.4 percent of GDP. The most significant items we cannot cover are corporate income tax and non-tax revenues other than internally generated funds. It is much more difficult to attribute the expenditure side of the budget to specific beneficiaries. Governments spend significant amounts of their budgets on genuine public goods: national defense, law enforcement, and public administration. By their nature, these goods and services are not attributable to individuals. The areas in which we can identify specific beneficiaries are usually social expenditures: transfer payments, health, and education. TABLE 5 gives a breakdown of expenditures in Ghana in 2013. Overall, we can analyze only 34.2 percent of total expenditures in our analysis, amounting to 9.8 percent of GDP. Education spending is by far the largest part of social spending in the analysis, followed by health spending and pensions. But notice that indirect subsidies, especially for electricity, are almost as large as pensions.
11
TABLE 5. GOVERNMENT EXPENDITURES, GHANA, 2013, MILLION CEDIS
Source: Ministry of Finance and Economic Planning, Controller and Accountant General's Department, SSNIT, Ministry of
Education, and authors’ calculations. For spending on the Ghana School Feeding Program, communication from the directorate. For spending on fertilizer subsidies, communication from the Ministry of Agriculture.
Notes: /1 There are other quasi-cash transfers such as school uniforms, but we have no information on their budget, nor on the total budget for direct transfers.
/2 This estimate comes from information on school feeding expenditures in January–April of 2014, not 2013. /3 Education and health do not include spending of internally generated funds. /4 This comprises SSNIT contributions to the NHIS on behalf of SSNIT members. /5 SSNIT pensions are not usually consolidated into the central government accounts, as it is an independent
institution.
!amount!
(millions)!
!Comparable!
GLSS56!
Estimate!
!Share!of!
total!
Government!
Spending!
!Share!of!
GDP!
Included!
in!CEQ!
analysis?
Total!Government!Spending,!including!SSNIT!pensions 26,729!!!!!! 28.60%!!!!Primary!Government!Spending 22,332!!!!!! 83.5%!!!!!!!!Social!Spending! 6,906!!!!!!!!
))))))))))))Direct)Transfers)/1 70)))))))))))))) 0.3% 0.07%LEAP 18!!!!!!!!!!!!!! 1!!!!!!!!!!!!!!!!!!!!! 0.1% 0.02% yes
School!Feeding!Program!/2 52!!!!!!!!!!!!!! 61!!!!!!!!!!!!!!!!!!! 0.2% 0.06% yes
))))))))))))Total)In;kind)Transfers 6,893)))))))) 25.8% 7.38%))))))))))))))))Education)/3 5,282)))))))) 19.8% 5.65%
Pre5school 147!!!!!!!!!!!! 122!!!!!!!!!!!!!!!!! 0.6% 0.16% yes
!!!!!!!!!!Primary 1,243!!!!!!!! 1,270!!!!!!!!!!!!! 4.6% 1.33% yes
Junior!High!School 532!!!!!!!!!!!! 534!!!!!!!!!!!!!!!!!
Senior!High!School 546!!!!!!!!!!!! 629!!!!!!!!!!!!!!!!! 2.0% 0.58% yes
Vocational 34!!!!!!!!!!!!!! 45!!!!!!!!!!!!!!!!!!! 0.1% 0.04%Teacher!Training 96!!!!!!!!!!!!!! 104!!!!!!!!!!!!!!!!! 0.4% 0.10%Nursing!School 319!!!!!!!!!!!! 196!!!!!!!!!!!!!!!!! 1.2% 0.34%
Polytechnic 121!!!!!!!!!!!! 128!!!!!!!!!!!!!!!!! 0.5% 0.13%University 520!!!!!!!!!!!! 1,261!!!!!!!!!!!!! 1.9% 0.56% yes
Other!Education!Spending 1,724!!!!!!!! 6.5% 1.84% no
))))))))))))))))Health 1,555)))))))) 1,916)))))))))))) 5.8% 1.66%!Contributory!/4 159!!!!!!!!!!!! 0.6% 0.17% yes
Noncontributory! 1,396!!!!!!!! 5.2% 1.49% yes
In5patient!services ?? 625!!!!!!!!!!!!!!!!! yes
Out5patient!services ?? 1,291!!!!!!!!!!!!! yes
Housing!and!Urban 56!!!!!!!!!!!!!! 0.2% 0.06% no
))))))))))))Contributory)Pensions 1,234)))))))) 4.6% 1.32%!!!!!!!!!!!!!!!!SSNIT!pensions!/5 443!!!!!!!!!!!! 201!!!!!!!!!!!!!!!!! 1.7% 0.47% yes
!!!!!!!!!!!!!!!Other!pensions,!gratuities,!and!end5of5service!benefits 791!!!!!!!!!!!! 264!!!!!!!!!!!!!!!!! 3.0% 0.85% yes
!!!!!!!!Non5Social!Spending
)))))))))))))))Indirect)Subsidies 1,231)))))))) 4.6% 1.32% yes
!!!!!!!!!!!!!!!!!!!!On!Final!Goods!(electricity!lifeline!tariffs) 1!!!!!!!!!!!!!!!!! 0.0% 0.00% yes
!!!!!!!!!!!!!!!!!!!!On!Inputs!(electricity!and!petroleum!products) 1,158!!!!!!!! 1,268!!!!!!!!!!!!! 4.3% 1.24% yes
!!!!!!!!!!!!!!!!!!!!On!fertilizer 72!!!!!!!!!!!!!! 58!!!!!!!!!!!!!!!!!!! 0.3% 0.08% yes
))))Other)Primary)Spending 11,692))))) 43.7% 12.51% no
Debt)Servicing 5,609)))))))) 21.0% 6.00% no
!!!!Interest!payments 4,397!!!!!!!! 16.5% 4.70% no
!!!!Amortization!payments 1,212!!!!!!!! 4.5% 1.30% no
NOTE:!Share!of!Government!Spending!Included!in!Analysis: 34.4%
NOTE:!Share!of!GDP!Included!in!Analysis: 9.8%

12
4. RESULTS
i. Inequality and Poverty TABLE 6 gives the Gini coefficients and headcount indices for three different PPP-based poverty lines for each CEQ income concept. Considering inequality first, TABLE 6 shows that there are only two places in the transition from market income to final income where government taxation and spending have a noticeable effect on the Gini coefficient: from gross income (or market income) to net market income, and from consumable to final income. The transition from gross to net market income reflects the imposition of direct taxes on persons; in Ghana, this is only PAYE and presumptive taxation of small businesses. In the next section, we will see that these are progressive taxes, falling disproportionately on high-income earners. It is also one of the larger sources of tax revenue in Ghana. These two features mean that direct taxes11 have a small but statistically significant effect on the Gini coefficient of about 0.012. TABLE 6. GINI COEFFICIENTS AND POVERTY INDICES FOR CEQ INCOME CONCEPTS
Source: GLSS-6 and authors’ calculations Notes: Data in the columns with US$ poverty lines at PPP are for per capita incomes to be comparable to other CEQ
analyses; those in the columns with cedi poverty lines are per adult equivalent to be comparable to GSS publications. The national poverty line is GH₵1314 per adult equivalent per year. The extreme poverty line is GH₵792.05.
The transition from consumable to final income shows the distributional impact of subsidized in-kind health and education services. These are used rather equally across the income distribution and, like direct taxes, they are large shares of the budget. As such, they also reduce the Gini coefficient by a significant amount, 0.021. The lightly shaded row above final income shows consumable income
11 To be precise, the ones measured here: PAYE and presumptive taxes.
poverty(line:GH₵792(((((per(year
US$1.25(per(day(at(PPP
US$2.50(per(day(at(PPP
US$4.00(per(day(at(PPP
GiniHeadcount(
index Poverty(GapHeadcount(
indexHeadcount(
indexHeadcount(
indexHeadcount(
indexMarket(Income(+(Pensions 0.437 0.240 0.077 0.083 0.042 0.197 0.407
Market(Income 0.438 0.243 0.080 0.086 0.044 0.200 0.412Gross(Income 0.436 0.238 0.076 0.081 0.039 0.195 0.405
Net(Market(Income 0.425 0.244 0.079 0.086 0.043 0.202 0.417Disposable(Income 0.424 0.242 0.078 0.084 0.040 0.200 0.415
Disp.(Income(+(Indirect(Subsidies 0.424 0.235 0.075 0.080 0.039 0.192 0.404Disp.(Income(M(Indirect(Taxes 0.423 0.272 0.089 0.100 0.047 0.225 0.454
Consumable(Income 0.423 0.262 0.086 0.094 0.046 0.218 0.441Cons.(Income(+(InMKind(Education 0.409 0.201 0.057 0.053 0.220 0.163 0.394
Final(Income 0.402 0.186 0.051 0.046 0.019 0.144 0.364
GH₵1314((per(year
13
plus education benefits only. One can see that two-thirds of the reduction in the Gini from consumable to final income come from education benefits, the rest from health. Overall, the effect of the fisc on income distribution in Ghana is quite limited, reducing the Gini by 0.035 or about 8.6 percent. By comparison, Lustig (2015a) gives results for 11 middle-income countries in Latin America that range from a reduction of 0.024 in Guatemala to 0.140 in Brazil, averaging 0.076. Lustig (2015b) includes four non-Latin American countries—Armenia, Ethiopia, Indonesia, and South Africa—with average reduction in the Gini of 0.035, exactly the same as Ghana, ranging from 0.003 in Ethiopia to -0.099 in South Africa. Regressing the reduction in the Gini from market to final income on GDP per capita at PPP and the initial inequality of market income for this (small) set of countries indicates that Ghana does about as well as one would expect, given its relatively low GDP per capita and initial inequality. The effects of the fisc on poverty in Ghana are similar, with one exception. Comparing market income to disposable income, we see that pensions, direct taxes (PAYE), and cash transfers (LEAP and school feeding) have almost no effect on poverty.12 This is because neither pensions nor direct taxes affect the poor in Ghana; they are not in the formal economy or even the informal economy that pays presumptive tax. LEAP does benefit the poor, obviously, as does the school feeding program, but these are such small programs that their overall effect is miniscule. Indirect subsidies for electricity (especially) and fertilizer reduce poverty by a small amount, about 1 percentage point at the higher poverty lines, but only 0.2 percentage points at the lowest poverty line. This reflects the fact that households with incomes in the $1.25 to $4.00 per day range do purchase electricity and thus benefit from this subsidy. Looking at the transition from disposable income to disposable income less indirect taxes, we find one of the more unfortunate results that shows up consistently in CEQ analyses: indirect taxes increase poverty significantly. This is because taxes, even progressive ones that reduce inequality, cannot reduce poverty. Even the poorest households buy goods and services that pay VAT, import duties, and excises. Nevertheless, notice that this effect is larger at the higher poverty lines: only 0.7 percent at the lowest poverty line in the table (US$1.25) but 3.9 percent at the highest (US$4.00), reflecting increasing consumption of taxable goods and services as incomes increase. The last transition, from consumable to final income, is much more encouraging. Here, we see substantial reductions in poverty, especially at the higher poverty lines. Because education and health expenditures are a large part of the budget and because they are relatively progressive, they are particularly helpful to poorer households in Ghana. Overall, the fisc reduces poverty by 2.3 percentage points at the lowest poverty line and 4.4 at the highest. At the national poverty line, the fisc reduces poverty by 5.5 percentage points. Lustig 12 The exception is at the highest poverty line (US$4.00 per day) where direct taxes increase poverty by about 1 percent.
14
(2015a) reports the change in the headcount ratio at the US$2.50 per day poverty line for 11 Latin American countries from market income (plus pensions) to consumable income (not final). These range from a reduction of 3.8 percent in Ecuador to an increase of 1.2 percent in Brazil and average a small reduction of 0.8 percent. TABLE 6 shows that a similar calculation for Ghana is an increase of 2.0 percent, greater than any of the countries that Lustig reviews. This highlights again the importance of in-kind benefits from education and health services in Ghana’s poverty reduction efforts: without them, the net effect of the fisc would be to increase poverty.
ii. Concentration Coefficients A tax or expenditure has a larger distributional impact if it is strongly targeted to the poor or the rich, and if it is large relative to incomes.13 In Ghana, TABLE 4 and TABLE 5 show how large each of the items is that we investigate relative to the budget and to GDP. Thus, we might expect that education expenditures or VAT may have large distributional consequences because they represent a large share of the budget and of GDP. But we also need to know how the benefits and costs of those items are distributed across the population—their incidence. Large taxes or expenditures that are distributed similarly to income will have little influence over the income distribution. To that end, FIGURE 2 shows concentration coefficients for the tax and expenditure items that we analyze in this paper. Concentration coefficients are calculated like Gini coefficients: we order the population from poorest to richest and construct a concentration curve that shows the cumulative share of the taxes paid or benefits received across that income distribution. The concentration coefficient is the area between that concentration curve and an equal distribution (45-degree line) multiplied by 2. Unlike the Gini, a concentration coefficient can be negative. This indicates that the tax or benefit falls disproportionately on poorer people. In general, if we hope that fiscal policy will redistribute from the rich to the poor, then public expenditures should have more negative concentration coefficients and taxes should have more positive ones. In particular, it is customary to consider a tax to be regressive if its concentration coefficient is smaller than the Gini coefficient for the distribution of income (0.437 for market income plus pensions in Ghana). If that is true, yet the concentration coefficient remains positive, poorer people pay a larger share of their income in tax, even though the absolute amount they pay is smaller than for richer people. If the concentration coefficient is negative, poorer people pay a larger absolute amount of tax. The same is true of benefits from expenditures. LEAP is Ghana’s only cash transfer program that explicitly targets the poor. It has a negative concentration coefficient of -0.289, as one would expect, but its concentration coefficient is
13 Lustig, Enami, and Aranda (forthcoming) show that this statement is not strictly true if the tax or benefit generates a significant re-ranking of people in the income distribution. They give examples of transfers targeted to the poorest that are large enough to move them well up the income distribution and show that these transfers reduce the Gini less than similarly sized transfers spread more evenly across the population. Nevertheless, the size of taxes and transfers in Ghana are such that the intuition of the text is adequate.
15
somewhat smaller than that for similar cash transfer programs in middle-income countries that also use a proxy means test for targeting, where they are closer to -0.4, and also in rich countries, where they are around -0.8. We should keep in mind that our estimate is a simulation of beneficiaries based only on the eligibility criteria for individuals (elderly, vulnerable child, etc.) and the PMT scores of GLSS-6 households using the old PMT formula, which was in effect during the GLSS-6 survey period. The LEAP program has another targeting mechanism that we cannot simulate, namely, community participation in the selection of recipients. If communities are more accurate than the PMT score in identifying the poor, the actual LEAP program could have better targeting than what we have calculated. That said, our estimate is close to a previous study that used a survey of actual LEAP recipients, along with GLSS-5, and found a concentration coefficient of -0.33 (Tsimpo and Wodon 2012c). There seems to have been some concern about the original targeting mechanism within the Ministry of Gender, Children, and Social Protection, because the PMT formula has been recalculated using GLSS-6 data. If we apply the revised formula rather than the prior one, the concentration coefficient improves considerably, to -0.65, though this recalculation has the advantage of being optimized to identify low incomes for the same data set we are using, GLSS-6. The expenditure that is best targeted to the poor is the free school feeding program for selected primary and junior secondary schools, with a concentration coefficient of -0.401. This program has expanded significantly in recent years and apparently to good effect. A previous study of school meals based on GLSS-5 found a concentration coefficient of 0.126 (Joseph and Wodon 2012). Given its excellent targeting, it is unfortunate that the government has fallen into arrears with the caterers who provide the meals, sometimes to the point of jeopardizing their willingness to continue delivering them. Public spending on pre-primary, primary, and junior high school is also quite progressive, more so than is typical in middle-income countries. One might think that this result reflects the fact that we have used per capita income as a welfare measure, but these concentration coefficients change relatively little if we use GSS’s adult equivalence scale instead. The more plausible explanation is that richer households are more likely to choose private schools so that the benefits of public schools are more concentrated among the poor (see TABLE 7 below). Ghana has had excellent success expanding enrolment in pre-primary and primary schooling in recent years. These concentration coefficients show that this has been a very progressive change. Higher levels of education are less progressive, though senior high school has a lower concentration coefficient than one might expect (0.125), given that relatively few students continue their studies to this level in Ghana. Benefits from teacher training and vocational schools are concentrated among better-off households, though somewhat less so than income itself. Nursing school and polytechnic education are distributed about as (un)equally as income, while university education is far more concentrated among the rich than is income.

16
These patterns are similar to those found in many countries and, indeed, to Ghana’s own past. They support the argument that, on equity grounds, it is better to subsidize lower levels of schooling than higher ones.
FIGURE 2 – CONCENTRATION COEFFICIENTS OVER MARKET INCOME PLUS PENSIONS
Source: GLSS-6 and authors’ calculations.
Ghana has also expanded access to public health facilities in recent years, not least through the creation of the National Health Insurance Scheme (NHIS), which provides free access to poor households. The concentration coefficients for inpatient and outpatient services at public facilities are close to zero, as they should be for a health system that provides access to the entire population. As with education, though, we might expect that richer households would opt for private health care providers, making the use of public facilities more progressive than we see here. The three indirect subsidies in Ghana for fertilizer, kerosene, and electricity have markedly different incidences. The fertilizer subsidy is equally distributed across incomes, with a concentration coefficient near zero. Kerosene has a slightly positive concentration coefficient, indicating that
!0.401!0.336
!0.289!0.267
!0.174!0.118
!0.0330.0400.0460.048
0.1250.1290.1330.134
0.3640.3860.3950.4150.4240.4290.4370.4400.4600.4710.4840.4940.509
0.5670.6110.6130.6170.625
0.6640.6910.7160.7170.731
0.7950.796
Value2of2free2school2mealsBenefits2from2public2pre!school
LEAP2payments2(simulated)Benefits2from2public2primary2school
Other2tobacco2exciseBenefits2from2public2JSS/JHS
Fertlizer2subsidyOut!patient2health2benefits
Cigarette/cigar2exciseIn!patient2health2benefits,2scaled
Benefits2from2public2SSS/SHSKerosene2cross!subsidy
Cocoa2dutiesAkpeteshi2excise
Benefits2from2public2teaching2collegeBenefits2from2public2vocational
Retirement2benefitsImport2duties
Benefits2from2public2polytechnicSpirits2excise
Market2income2plus2contrib2pensionsVAT
Benefits2from2public2nursing2schoolElectricity2subsidy
Diesel2exciseCommunication2services2excise
Petrol2exciseSocial2security2pension
Beer2exciseWine2exciseSoda2exciseMalta2excise
"Taxes2on2products"2of2self!employed,2informalBenefits2from2public2university
SSNIT2contributionsState2pension2(CAP!30)
PAYE2paidBottled2water2excise
"Taxes2on2products"2of2self!employed,2formal

17
kerosene consumption rises with income, but its expenditure share declines with income. This is somewhat surprising, given that the rationale for reversing taxes on kerosene came from earlier incidence studies that found it to be a regressive tax (which it was). The subsidy for electricity is actually regressive; electricity consumption is more concentrated among richer households than poorer ones. This is true even though we have taken into account the lifeline tariff structure in our analysis (see Appendix II). The most likely explanation is that many of the poor do not have access to electricity connections. This subsidy has been quite large in recent years, and government has moved to eliminate it as part of its efforts to reduce the budget deficit. Our analysis suggests that, on equity grounds, this is a good decision, though as we noted in the previous section, it will affect some poor households, primarily in urban areas. To be concrete, we have calculated poverty headcounts for each of the main CEQ income concepts on a per adult equivalent basis, with and without the electricity subsidy. Our calculation indicates that the subsidy removal would increase the headcount by something between 0.52 percent (market income) and 0.85 percent (consumable income), significant setbacks, to be sure. At the same time, we calculate the increase in LEAP payments needed to offset this poverty increase, distributing them among our simulated LEAP beneficiaries. The total cost of this is between 25 percent and 38 percent of the expenditure on the electricity subsidy.14 The last broad class of public expenditures in our analysis is pensions: social security (SSNIT), legacy pensions like CAP 30, and “retirement benefits,” which are probably some combination of end-of-service benefits and other retirement schemes outside the public sector. Both social security and pension benefits are collected disproportionately by richer households, which is to be expected since these benefits are garnered only by former formal sector workers. It is worth noting that changing from per capita values to an adult equivalence scale does not change this result. Ghana is unlike many other middle- and upper-income countries in that pensioners do not live alone, but rather are more likely to live with extended family members. Therefore, the switch from per capita values to an adult equivalence scale does not change pensioners’ positions in the income distribution much. On the tax side, personal income taxes (PAYE) are very progressive in Ghana, in part because Ghana has a progressive rate structure, but also because the taxes fall on formal sector employees only. Social security contributions are not a tax per se, but their distribution is similar to that of PAYE. Both of these results are typical of other countries. Taxes on the self-employed are also highly progressive. This is not too surprising for those whose enterprise is formal (coefficient of 0.796), but it is also true of those who report that their enterprise is informal (coefficient of 0.664).
14 Clementi, Molini, and Schettino (2015) make a similar calculation for the elimination of fuel subsidies and find that the cost of offsetting the poverty impact via an expansion of LEAP would be less than 50 percent of the expenditure on fuel subsidies.
18
An unusual result is the progressivity of a large number of indirect taxes. VAT is neutral, and import duties are slightly regressive, as is often the case for indirect taxes. Several of the excise taxes, however, are quite progressive, including those on several beverages (bottled water, soda, non-alcoholic malted drinks, beer, and wine); petroleum products (diesel and gasoline, but not kerosene); and communications services. As noted above, our estimate of the impact of petroleum duties includes indirect effects on the prices of goods and services that use petroleum as an input. Despite that estimation, petroleum taxes remain progressive. There are also some quite regressive indirect taxes, including those on cigarettes and cigars; other tobacco products; the cocoa export duty; and the excise tax on akpeteshie, a local spirit. For tobacco products and akpeteshie, government thus faces a trade-off. On the one hand, it presumably would like to reduce consumption of these products for public health reasons, which argues for higher taxes. But those taxes will fall more heavily on poorer households than other taxes in the system. For the cocoa duty, however, there is no such dilemma. On both equity and efficiency grounds, there is no reason for this tax.
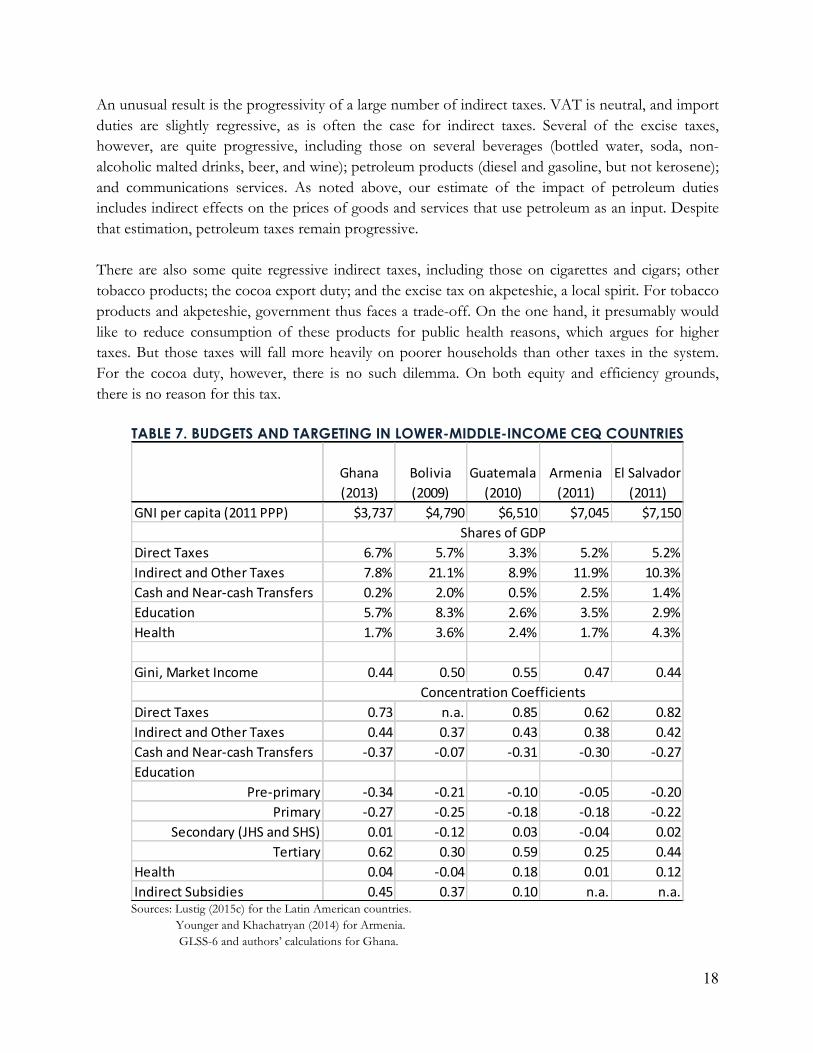
TABLE 7. BUDGETS AND TARGETING IN LOWER-MIDDLE-INCOME CEQ COUNTRIES
Sources: Lustig (2015c) for the Latin American countries. Younger and Khachatryan (2014) for Armenia. GLSS-6 and authors’ calculations for Ghana.
Ghana%
(2013)
Bolivia%
(2009)
Guatemala%
(2010)
Armenia%
(2011)
El%Salvador%
(2011)
GNI%per%capita%(2011%PPP) $3,737 $4,790 $6,510 $7,045 $7,150
Direct%Taxes 6.7% 5.7% 3.3% 5.2% 5.2%
Indirect%and%Other%Taxes 7.8% 21.1% 8.9% 11.9% 10.3%
Cash%and%NearOcash%Transfers 0.2% 2.0% 0.5% 2.5% 1.4%
Education 5.7% 8.3% 2.6% 3.5% 2.9%
Health 1.7% 3.6% 2.4% 1.7% 4.3%
Gini,%Market%Income 0.44 0.50 0.55 0.47 0.44
Direct%Taxes 0.73 n.a. 0.85 0.62 0.82
Indirect%and%Other%Taxes 0.44 0.37 0.43 0.38 0.42
Cash%and%NearOcash%Transfers O0.37 O0.07 O0.31 O0.30 O0.27
Education
PreOprimary O0.34 O0.21 O0.10 O0.05 O0.20
Primary O0.27 O0.25 O0.18 O0.18 O0.22
Secondary%(JHS%and%SHS) 0.01 O0.12 0.03 O0.04 0.02
Tertiary 0.62 0.30 0.59 0.25 0.44
Health 0.04 O0.04 0.18 0.01 0.12
Indirect%Subsidies 0.45 0.37 0.10 n.a. n.a.
Shares%of%GDP
Concentration%Coefficients
19
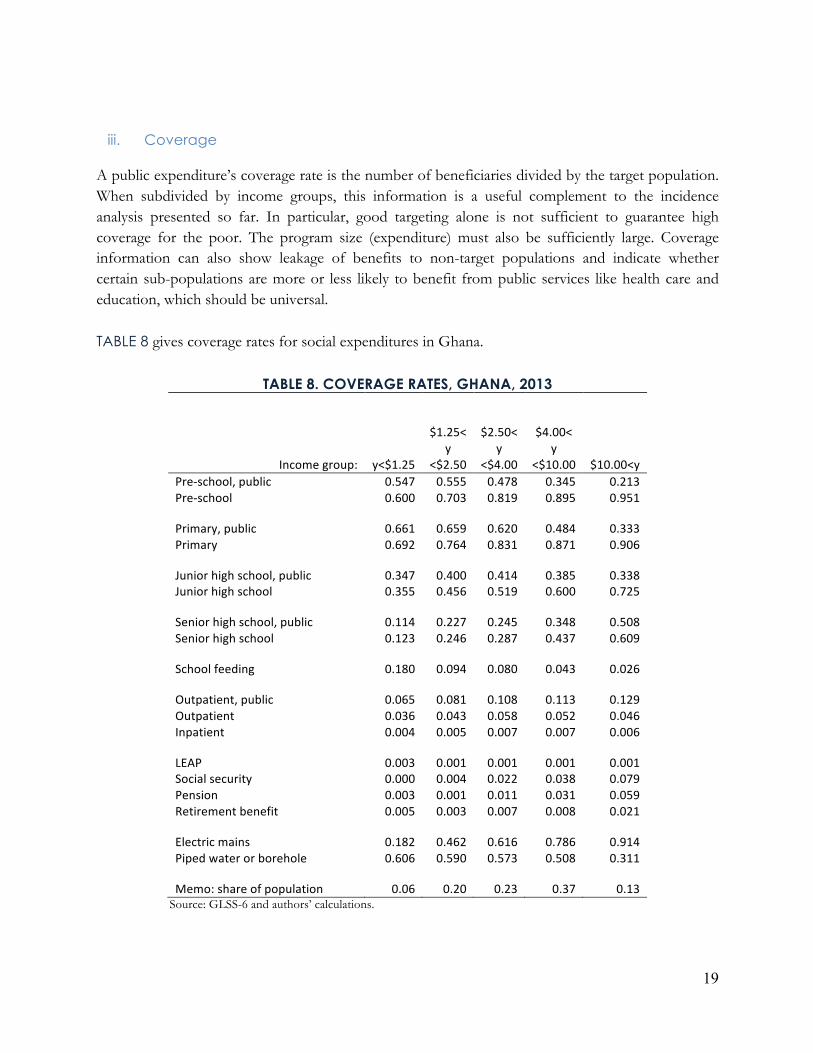
iii. Coverage A public expenditure’s coverage rate is the number of beneficiaries divided by the target population. When subdivided by income groups, this information is a useful complement to the incidence analysis presented so far. In particular, good targeting alone is not sufficient to guarantee high coverage for the poor. The program size (expenditure) must also be sufficiently large. Coverage information can also show leakage of benefits to non-target populations and indicate whether certain sub-populations are more or less likely to benefit from public services like health care and education, which should be universal. TABLE 8 gives coverage rates for social expenditures in Ghana.
TABLE 8. COVERAGE RATES, GHANA, 2013
Income'group:' y<$1.25'
$1.25<'y'
<$2.50'
$2.50<'y'
<$4.00'
$4.00<'y'
<$10.00' $10.00<y'Pre7school,'public' 0.547' 0.555' 0.478' 0.345' 0.213'Pre7school' 0.600' 0.703' 0.819' 0.895' 0.951'
' Primary,'public' 0.661' 0.659' 0.620' 0.484' 0.333'Primary' 0.692' 0.764' 0.831' 0.871' 0.906'
' Junior'high'school,'public' 0.347' 0.400' 0.414' 0.385' 0.338'Junior'high'school' 0.355' 0.456' 0.519' 0.600' 0.725'
' Senior'high'school,'public' 0.114' 0.227' 0.245' 0.348' 0.508'Senior'high'school' 0.123' 0.246' 0.287' 0.437' 0.609'
' School'feeding' 0.180' 0.094' 0.080' 0.043' 0.026'
' Outpatient,'public' 0.065' 0.081' 0.108' 0.113' 0.129'Outpatient' 0.036' 0.043' 0.058' 0.052' 0.046'Inpatient' 0.004' 0.005' 0.007' 0.007' 0.006'
' LEAP' 0.003' 0.001' 0.001' 0.001' 0.001'Social'security' 0.000' 0.004' 0.022' 0.038' 0.079'Pension' 0.003' 0.001' 0.011' 0.031' 0.059'Retirement'benefit' 0.005' 0.003' 0.007' 0.008' 0.021'
' Electric'mains' 0.182' 0.462' 0.616' 0.786' 0.914'Piped'water'or'borehole' 0.606' 0.590' 0.573' 0.508' 0.311'
' Memo:'share'of'population' 0.06' 0.20' 0.23' 0.37' 0.13' Source: GLSS-6 and authors’ calculations.

20
iv. Income Mobility
Most fiscal incidence studies focus on expenditures; some examine taxes, but relatively few look at both. Although either expenditures or taxes can be progressive and thus make the income distribution more equal, only expenditures can reduce poverty. Taxes at best leave it unchanged. This means that the fiscal system as a whole may increase or decrease any individual’s income on net, and may move her/him up or down the income distribution. Most measures used to evaluate fiscal incidence are anonymous—they do not consider who is in the pth quantile of the income distribution, only the income that that pth person has. Lustig (forthcoming) proposes the use of mobility matrices to describe the extent to which the fiscal system increases or decreases people’s incomes. TABLE 9 gives these matrices for mobility from market income to disposable income, consumable income, and final income where the income ranges are defined by PPP$ poverty lines standard to the CEQ analysis.15
TABLE 9. MOBILITY MATRICES BY INCOME GROUP, MARKET INCOME TO DISPOSABLE, CONSUMABLE, AND FINAL INCOME
Disposable Income Groups
Market Income groups y <
$1.25
$1.25 <= y < $2.50
$2.50 <= y < $4.00
$4.00 <= y < $10.00
$10.00 <= y < $50.00
$50.00 <= y
Percent of Population
Average Market Income (cedis /
year) y < $1.25 97% 3% 0% 0% 0% 0% 6% 372
$1.25 <= y < $2.50 0% 99% 0% 0% 0% 0% 20% 787
$2.50 <= y < $4.00 0% 2% 98% 0% 0% 0% 23% 1,321
$4.00 <= y < $10.00 0% 0% 3% 97% 0% 0% 37% 2,523
$10.00 <= y < $50.00 0% 0% 0% 8% 92% 0% 13% 6,563
Consumable Income Groups y < $1.25 98% 2% 0% 0% 0% 0% 6% 372
$1.25 <= y < $2.50 4% 95% 1% 0% 0% 0% 20% 787
$2.50 <= y < $4.00 0% 11% 89% 1% 0% 0% 23% 1,321
$4.00 <= y < $10.00 0% 0% 9% 91% 0% 0% 37% 2,523
$10.00 <= y < $50.00 0% 0% 0% 15% 85% 0% 13% 6,563
Final Income Groups
y < $1.25 48% 50% 2% 0% 0% 0% 6% 372
$1.25 <= y < $2.50 1% 69% 29% 1% 0% 0% 20% 787
$2.50 <= y < $4.00 0% 3% 77% 20% 0% 0% 23% 1,321
$4.00 <= y < $10.00 0% 0% 3% 94% 2% 0% 37% 2,523
$10.00 <= y < $50.00 0% 0% 0% 11% 89% 0% 13% 6,563
15 It is important to remember that the analysis includes quite a bit more of taxes (69 percent) than it does in benefits (34 percent), so there is, on average, a bias towards lowering incomes.
21
The most striking thing about these results is the extremely large share of the population found on the diagonal: these are households that do not change income group, as we move from market income to disposable, consumable, or final income. The only real exceptions to this are found in the transition from market to final income, where a large share of households move up from the lower three income groups due to receipt of substantial in-kind education and health benefits. In addition, from 8 to 15 percent of households in the top group move down a level because of taxes paid. Overall, the table confirms the sense that the fisc in Ghana does relatively little to redistribute income, either positively or negatively, except through its provision of education and health services.
!v. How Does Ghana Compare to Other Countries?
CEQ has completed analyses in more than 20 countries around the world, though most are in Latin America. TABLE 10 gives comparative information for all the studies in low-, lower-middle-, and African countries completed to date. It is important to note that these data are derived entirely from the respective household surveys, not administrative accounts. Ghana starts as one of the poorer and, ex ante, more equal countries in this group, characteristics which, as we have noted, would lead us to expect it to redistribute less. That redistribution requires both significant budget shares and good targeting, so the table provides information on both. For taxes, Ghana’s direct taxes are a little above average as a share of GDP, despite its lower GNI per capita,16 while its indirect taxes are well below average. The concentration coefficients for both direct and indirect taxes are right on the averages, but because Ghana starts with a more equal distribution of market income, both direct and indirect taxes are somewhat more equalizing in Ghana than the average. On the expenditure side, budgets for cash and near-cash transfers in Ghana are far below average, constituting only 0.2 percent of GDP, but are better targeted to the poor than in any of these countries.17 Education spending is a little above average while health spending is a little below average. Concentration coefficients for (pre-)primary education in Ghana are the lowest in the table, showing better targeting of basic education in Ghana than any of the countries in the CEQ analysis. Secondary education is right on the average, while tertiary education is less well targeted in Ghana than any of the other countries. Targeting of health expenditures is about average, while that for indirect subsidies (which are mostly electricity subsidies in Ghana) is worse in Ghana than any of the other countries.
16 One would expect richer countries to have larger formal sectors and thus be able to levy direct taxes more effectively. 17 That said, targeting in Ghana is not as good as in middle-income countries, where the concentration coefficient for transfer payments tends to be around -0.45, or in rich countries, where it is around -0.75.

22
TABLE 10. COMPARATIVE INFORMATION FOR CEQ ANALYSES IN LOW-, LOWER-MIDDLE-, AND AFRICAN COUNTRIES
Source: World Development Indicators, Inchauste and Lustig, forthcoming
vi. Comparisons to Other Incidence Studies in Ghana
There are many incidence studies for Ghana, in part because Ghana has a long history of excellent household data collection. TABLE 11 gives a summary of many of those papers, presenting concentration coefficients as estimated here and in the studies referenced.18,19 Looking first at taxes, our results are similar to those of Akazili et al. (2012) for PAYE and VAT, but less close for import duties and petroleum excises. This probably reflects the fact that we have used the input-output table to calculate both the direct and indirect incidence of these taxes, whereas Akazili et al. calculate the direct incidence only. For the fuel tax, especially, this makes a big difference because households consume only a fraction of all gasoline and diesel sold in the country.
18 We have concentrated only on papers whose main purposes are incidence analyses. There are doubtless many other papers and reports that include incidence analyses incidentally. We do not review those here, but note that they likely will have used the same GLSS data sets cited in these papers. In addition, there are far too many papers and reports that estimate the poverty impact of one policy or another for us to review them here. 19 Most of these papers do not report concentration coefficients, but rather quintile shares of benefits. We have calculated concentration coefficients from those shares. For concentration curves that are entirely convex or concave, this calculation is biased toward zero, because we have only the five data points rather than the entire distribution.
Ethiopia((2011)
Ghana((2013)(/1
Bolivia((2009)
Guatemala((2010)
Armenia((2011)
El(Salvador((2011)
Indonesia((2012)(1/
South(Africa(
(2010)(2/ AverageGNI(per(capita((2011(PPP) $1,163 $3,737 $5,090 $6,474 $7,045 $7,389 $9,017 $11,833 $6,469
Direct(Taxes 3.9% 6.7% 5.7% 3.3% 5.2% 5.2% 5.6% 14.3% 6.2%Indirect(and(Other(Taxes 7.8% 7.8% 21.1% 8.9% 11.9% 10.3% 6.3% 12.8% 10.9%Cash(and(NearRcash(Transfers 1.3% 0.2% 2.0% 0.5% 2.5% 1.4% 0.4% 3.8% 1.5%Education(Spending 4.6% 5.7% 8.3% 2.6% 3.5% 2.9% 3.4% 7.0% 4.8%Health(Spending 1.2% 1.7% 3.6% 2.4% 1.7% 4.3% 0.9% 4.1% 2.5%
Gini,(Market(Income 0.32 0.44 0.50 0.55 0.47 0.44 0.39 0.77 0.49
Direct(Taxes 0.60 0.73 n.a. 0.85 0.62 0.82 n.a. 0.90 0.75Indirect(and(Other(Taxes 0.37 0.44 0.37 0.43 0.38 0.42 0.35 0.69 0.43Cash(and(NearRcash(Transfers R0.37 R0.37 R0.07 R0.31 R0.30 R0.27 R0.25 R0.27 R0.28Education
PreRprimary n.a. R0.34 R0.21 R0.10 R0.05 R0.20 n.a. R0.11 R0.17Primary R0.03 R0.27 R0.25 R0.18 R0.18 R0.22 R0.08 R0.19 R0.18
Secondary((JHS(and(SHS) 0.27 0.01 R0.12 0.03 R0.04 0.02 … R0.12 0.01Tertiary 0.41 0.62 0.30 0.59 0.25 0.44 0.47 0.50 0.45
Health 0.07 0.04 R0.04 0.18 0.01 0.12 0.12 R0.06 0.06Indirect(Subsidies 0.40 0.43 0.37 0.10 n.a. n.a. 0.34 … 0.33
%(of(GDP
Concentration(Coefficients

23
Compared to the much older estimates of Younger (1993), most taxes now appear to be more progressive. Mostly, this is because the income distribution is less equal than it was in the 1980s. Thus, concentration coefficients for VAT, alcohol excises, and petroleum duties have all increased by roughly the same amount as the increase in the Gini. But it is notable that the concentration coefficient for PAYE has increased much more than the Gini, most likely because the inequality is driven by increases in formal sector (and thus, income-taxable) incomes. There are also some taxes, whose concentration coefficients have not increased, mostly notably tobacco excises and cocoa duties, which despite being the most regressive taxes in 1987 are even more regressive than they were previously. Taxes on kerosene remain equally regressive as in the mid-1980s. For expenditures, our estimates for LEAP, which are for simulated beneficiaries based on the districts where LEAP operated during the time of the GLSS-6 survey and the proxy means test, are a little less progressive than those from Tsimpo and Wodon (2012c), while our estimate for the fertilizer subsidy is a little more progressive. In both cases, the broad sense of the targeting of these policies is similar: the fertilizer subsidy is spread evenly across the income distribution, while LEAP is targeted to the poor. For in-kind benefits of education, it is interesting to note that more recent estimates for primary schooling, including ours, are more progressive than the estimates from the 1980s and 1990s. In part, this may reflect how today’s junior high school (middle school) students were spread across primary and secondary school in the past. But it is also true that coverage has expanded in Ghana, and in doing so, has included more poor students. This, together with richer Ghanaians’ preference for private school, make these services about as progressive as the explicitly targeted LEAP transfer, even though they are meant to be universal, not targeted services. Targeting of higher levels of education is less progressive and has not changed much since the early estimates of Demery et al. (1995) and Canagarajah and Ye (2001). One very large difference with previous studies is our estimate for free school lunches. We find this to be quite progressive, in fact, the most progressive spending item we have analyzed, while Wodon, et.al. find the opposite. Both studies must simulate beneficiaries as neither the GLSS-5 questionnaire used by Wodon, et.al, nor the GLSS-6 that we use asks clearly whether students receive this benefit. Wodon, et.al. attribute the benefits of this program to every person in districts where the program was active, on a pro-rata basis, while we assume that they go only to students (and their households) enrolled in schools that participate in the program. Ours seems the more accurate approach, so the perception of the targeting for this program should change: it does much better than previously believed. It is also interesting to note that the GSFP achieves this without using household-level information for targeting as LEAP does and as is under consideration in the universal targeting discussions. In particular, GSFP uses only district-level poverty maps and information on the schools.

24
For health, our estimates are similar to the recent estimates from Akazili, et.al. who use the GLSS-5 data, but for in-patient services, our estimates are significantly more progressive than those from the earlier work of Demery et al. and Canagarajah and Ye. As with primary education, access to these services has improved over the years, and the expansion is reaching more poor people, improving its targeting.

25
TABLE 11. SUMMARY OF INCIDENCE STUDIES IN GHANA
Source:Younger,,1993
Sahn,and,Younger,,1999
Canagarajah,and,Ye,,2001
Coulombe,and,
Wodon,,2012
Azakili,,et.al.,,2012
Wodon,,et.al.,,2012
dataset(s),and,year:GLSSG1,,1987/88
GLSSG3,,1991/92
GLSSG2,,1988/89
GLSSG3,,1991/92
GLSSG4,,1998/99
GLSSG5,,2005/06
GLSSG5,and,SHIELD
GLSSG5,,2005/06
household,expenditures,scaled,by: per,capitaper,adult,equivalent per,capita per,capita per,capita per,capita per,capita
per,capita
per,adult,equivalent
per,adult,equivalent
per,adult,equivalent
per,adult,equivalent
Gini$coefficient,$HH$expenditures 0.42 0.41 0.35 0.35 0.36 0.38 0.41 0.43 0.45 0.45 0.45 0.45Taxes
PAYE 0.63 0.61 0.45 0.68SelfGemployment,presumptive,tax 0.46 0.44 0.39
VAT,/,Sales,tax 0.44 0.43 0.33 0.47Import,duties 0.42 0.40 0.55
Tobacco,excise 0.06 0.00 0.15Alcohol,excise 0.36 0.32 0.31
Soda,excise 0.62 0.61 0.44Gasoline,(direct,effect,only) 0.68 0.67 0.87
Fuel,(indirect,via,personal,transport) 0.38Gasoline,(direct,and,indirect),/2 0.51 0.49 0.63
Kerosene 0.14 0.15 0.15All,petroleum,duties 0.50 0.48 0.44 0.38Cocoa,export,duties 0.15 0.13 0.20
Expenditures,,,,LEAP,/1 G0.26 G0.23 G0.33,,,,Fertilizer,subsidy G0.02 G0.04 0.04,,,,Education
Public,Primary G0.26 G0.26 G0.08 G0.06 G0.08 G0.03 G0.18 G0.02Public,Middle,/3 G0.11 G0.15
Public,Secondary,/4 0.12 0.07 0.09 0.05 0.04 0.04 0.06 0.21,Public,Vocational 0.39 0.33
Public,Teacher,Training 0.34 0.29Public,Nursing,School 0.47 0.44
Public,Polytechnic 0.42 0.37Public,University 0.66 0.63
Public,PostGsecondary 0.18 0.40 0.36 0.22 0.50 0.49School,meals G0.38 G0.37 0.13
,,,,HealthInGpatient,care 0.05 0.07
OutGpatient,care 0.04 0.05Public,clinic/health,centre,,outpatient 0.06
Public,health,centres 0.07 0.20 0.19 G0.09 0.08Public,clinics 0.03
District,hospital,,outpatient 0.11District,hospital,,inpatient G0.01
Regional/teaching,hospital,,outpatient 0.21Regional/teaching,hospital,,inpatient 0.16
All,public,hospitals 0.23 0.21 0.23All,public,hospitals,,outpatient 0.23 0.19 0.13All,public,hospitals,,inpatient 0.16 0.21 0.08
All,public,facilitiesAll,public,facilities,,outpatient 0.12All,public,facilities,,inpatient 0.08
this,study
GLSSG6,,2012/13
Demery,et.al,,1995
GLSSG5,,2005/06
ISODEC,,2009

26
vii. How Can Ghana Do Better? Assuming that the government of Ghana would like its taxation and social expenditure policies to be more redistributive than is currently the case, what can it do? This section simulates several policy changes and analyzes their impact on inequality and poverty.
Subsidies to Electricity and Fuel We start with the most topical policies: the government has announced that it will no longer subsidize electricity and fuel. These are significant changes in fiscal policy. In 2013, the year of this study, the government spent 1.1 billion cedis (1.24 percent of GDP) on electricity subsidies and indirectly subsidized fuel imports by offering the bulk oil companies an artificially low exchange rate, saving them about 600 million cedis in 2013. These are also controversial policies, eliciting significant public protest, and a principal complaint is that they will harm the poor.
TABLE 12. SHARES OF POPULATION, ELECTRICITY AND FUEL SUBSIDIES BY POVERTY STATUS
Source: GLSS-6 and authors’ calculations.
TABLE 12 shows that the share of electricity and fuel subsidies captured by the poor are small, as one would expect given their concentration coefficients. Still, eliminating these subsidies will harm some (few) poor people. How much is the damage? TABLE 13 gives the results for poverty and inequality measures of three CEQ income concepts for four simulations for elimination of electricity subsidies. The first simulation simply removes the subsidy. This increases the headcount by a little less than one percentage point at the national poverty line, and less than half that at the extreme poverty line. These are small, but statistically significant increase in poverty. The compensation for government is a sizeable budget savings of 1.4 percent of GDP.20
20 This is larger than the 1.25 percent reported above, because we use the estimate of the subsidy from the GLSS, which is slightly larger than the amount in Ministry of Finance accounts.
Electricity Fuel PopulationExtreme2Poor2 0.008 0.011 0.084
22222222Poor2 0.041 0.042 0.1582222Not2Poor2 0.951 0.947 0.758

27
TABLE 13. SIMULATION RESULTS FOR ELIMINATING ELECTRICITY SUBSIDIES
Source: GLSS-6 and authors’ calculations. Simulation descriptions:
(1) Eliminates the electricity subsidy with no compensation. (2) Eliminates subsidy except for lifeline tariff for the first 50kwh, which is held constant. (3) Eliminates electricity subsidy and uses all the funds to expand LEAP, in both coverage and payments. (4) Eliminates electricity subsidy and uses enough funds for LEAP to leave poverty roughly unchanged.
The second simulation preserves the lifeline tariff rate for the first 50 kWh consumed for all consumers. This option has been proposed as a way to protect the poor from the price increases. The results suggest that this does in fact work for poverty, reducing the increase to 0.5 percentage points, but it does not help much for extreme poverty, which increases by about the same as in the first simulation. The budgetary savings are only half as much as the first simulation, but still substantial at 0.7 percent of GDP. The third simulation eliminates the electricity subsidy and dedicates all the money saved to LEAP. This would be a huge increase in LEAP’s budget: from 30 million (in 2013) to over a billion cedis. It is not realistic to distribute this sum to existing LEAP beneficiaries only, so we expand coverage nationwide to all people who meet the 2013 eligibility requirements.21 Even that does not exhaust the budgetary savings from the electricity subsidy, so we also increase the LEAP payment (24 cedis per person in 2013) by 89 percent. By construction, the net budgetary effect of these changes is zero, but they produce significant poverty reductions. This is because LEAP is much better targeted to the poor than are electricity subsidies. Note that disposable income changes in this simulation by the amount of additional LEAP payments only; indirect subsidies only affect consumable and final
21 We use the older proxy means test when determining eligibility. The Ministry of Gender, Children, and Social Protection has changed the proxy means test using GLSS-6 data, an effort that may improve LEAP’s targeting and make results even better than what we simulate here.
Change'in: (1) (2) (3) (4)Disposable'Income 90.013 90.007
Consumable'Income 0.004 0.003 90.011 90.003Final'Income 0.001 0.001 90.007 90.003
Disposable'Income 90.022 90.009Consumable'Income 0.009 0.005 90.013 0.000
Final'Income 0.008 0.005 90.014 90.003Disposable'Income 90.010 90.005
Consumable'Income 0.003 0.002 90.008 90.002Final'Income 0.002 0.001 90.006 90.002
Disposable'Income 90.009 90.004Consumable'Income 90.001 0.000 90.010 90.005
Final'Income 90.001 0.000 90.009 90.005Budgetary'savings'(share'of'GDP): 0.014 0.007 0.000 0.008
Extreme'Poverty'
Headcount
Poverty'Headcount
Poverty'Gap
Gini
Simulation

28
income. So the impact of expanding LEAP in the manner we suppose is to reduce poverty by 2.2 percentage points and extreme poverty by 1.3 percentage points. Including the negative effect of the subsidy removal, poverty still declines by about 1.3 percentage points, with extreme poverty a little less. Note that in this simulation, the Gini coefficient also decreases by a percentage point. The last simulation also eliminates the electricity subsidy and expands LEAP to all eligible recipients nationwide, but in this case, only enough extra money is allocated to LEAP to keep poverty roughly constant. How much this should be varies slightly by income concept and poverty measure. We allocate enough money to LEAP to ensure that the largest poverty increase from the subsidy removal, consumable income at the national poverty line, stays at zero. This means all the other poverty measures improve slightly. The main point of this simulation is in the final row: government can keep poverty constant in the face of electricity subsidy removal by increasing expenditures on LEAP, and save itself 0.8 percent of GDP in the process.
TABLE 14. SIMULATION RESULTS FOR ELIMINATING FUEL SUBSIDIES
Source: GLSS-6 and authors’ calculations. Simulation descriptions:
(1) Eliminates the fuel subsidy with no compensation. (2) Eliminates fuel subsidy and uses all the funds to expand LEAP, both coverage and payments. (3) Eliminates fuel subsidy and uses enough funds for LEAP to leave poverty roughly unchanged.
TABLE 14 gives similar results for fuel subsidies. These were about half as large in 2013 as electricity subsidies, so their impact is less. But the same broad results emerge: eliminating the fuel subsidy by itself (Simulation 1) increases poverty by small, but statistically significant amounts, while producing budgetary savings of 0.5 percent of GDP. If all of the budgetary savings were dedicated to expanding LEAP, poverty reduction would be a little less than 1 percentage point, with extreme
Change'in: (1) (2) (3)Disposable'Income 80.008 80.003
Consumable'Income 0.003 80.005 80.001Final'Income 0.001 80.004 80.001
Disposable'Income 80.011 80.004Consumable'Income 0.003 80.006 0.000
Final'Income 0.003 80.008 80.001Disposable'Income 80.005 80.002
Consumable'Income 0.001 80.004 80.001Final'Income 0.001 80.003 80.001
Disposable'Income 80.004 80.002Consumable'Income 80.001 80.005 80.002
Final'Income 80.001 80.005 80.002Budgetary'savings'(share'of'GDP): 0.006 0.000 0.004
Simulation
Extreme'Poverty'
Headcount
Poverty'Headcount
Poverty'Gap
Gini

29
poverty reduction about half that. And if the government increases LEAP only just enough to offset the poverty impact of the fuel subsidy removal, the budgetary savings decline to 0.4 percent of GDP. Overall, electricity and fuel subsidies are not effective ways to reduce poverty. The government can do better using expenditures that are well targeted to the poor, like LEAP.
viii. Make Taxation More Progressive? In Ghana as in many countries, direct taxation is more progressive than indirect.22 Thus, the government might consider shifting from the use of indirect to direct taxation.
TABLE 15 gives results for an extreme simulation along these lines: it eliminates the VAT and import duties, and increases the direct taxes we study here—PAYE and presumptive taxes on small enterprises—by enough to offset the revenue loss. This is clearly unrealistic as the direct tax rates would have to be extremely high. But the extremity of the example has a point: despite it, the impact on poverty and inequality is small, the largest effect being a 0.7 percentage point decline in final income poverty. Note that the poverty gaps hardly change and the change in the Gini is small.
TABLE 15. SIMULATION RESULTS FOR SHIFTING FROM INDIRECT TO DIRECT TAXATION
Source: GLSS-6 and authors’ calculations.
Why are the effects so small? Certainly, the amounts are large: VAT plus import duties was about 6 percent of GDP in 2013. However, the concentration coefficients for indirect and direct taxes are not so different: 0.42 for import duties, 0.44 for VAT, and 0.73 for PAYE, by far the largest source of direct taxation in this study. The difference between these is about 0.3, whereas the difference between the concentration coefficients for electricity subsidies and LEAP studied in the previous section is 0.76. This result is important for policymakers in two ways. First, broad-based indirect taxes like the VAT are generally considered to be more efficient than direct taxes, while direct taxes are more equitable.
22 The exception is for some of the excise taxes.
Change'in:
Extreme'Poverty'
HeadcountPoverty'
HeadcountPoverty'Gap Gini
Consumable'Income =0.003 =0.006 0.000 =0.003Final'Income 0.000 =0.007 0.000 =0.004

30
Thus, there is a trade-off between equity and efficiency when choosing tax instruments.23 But the results here suggest that the trade-off is not too severe. The government of Ghana can continue to rely on VAT, knowing that its use instead of direct taxation has only a minor effect on poverty and inequality. Second, the result suggests that to have a large redistributional impact, government needs to consider combinations of taxes with large positive concentration coefficients and expenditures with large negative concentration coefficients, which are usually those like LEAP and school meals, which are explicitly targeted to the poor.
ix. Change LEAP We next consider options to expand LEAP, Ghana’s conditional cash transfer program. We should note that LEAP is not the largest nor the best-targeted social protection program in our study, but other alternatives would not make sense. The school feeding program could not expand hugely, for example, even if it were to provide quite luxurious meals. TABLE 16 gives the results for five simulated changes in the LEAP program. All but the last of the changes increase LEAP expenditures to 0.5 percent of GDP,24 an amount that is typical in middle-income countries with long established CCTs. Each simulation also pays for this increase with a VAT increase of a similar amount. The first simulation expands LEAP to all eligible persons in the entire country using the old proxy means test: a complete expansion of the existing program. To keep the total cost to 0.5 percent of GDP, this requires scaling down the benefit to each recipient by 30 percent. The second simulation changes the targeting to the new proxy means tests, allocating LEAP to all people judged to be extremely poor with that test. This greatly improves the targeting of LEAP, from a concentration coefficient of -0.29 to -0.65, better than most middle-income countries.25 For this simulation, LEAP is given to everyone who is extremely poor, not just the elderly, handicapped, and vulnerable children currently targeted. To keep the total cost to 0.5 percent of GDP, this requires scaling down the benefit to each recipient by 49 percent in this simulation. The third simulation targets LEAP to the poorest people, as judged by the new proxy means test at current benefit rates (no scaling down), until total LEAP payments are 0.5 percent of GDP. This in some sense is perfect targeting: the money goes to the poorest people in the sample.
23 Administrative efficiency should also enter the policy mix. 24 At the time of the GLSS-6 survey, LEAP was still a quite small program, limited to only select districts in the country. Government has gradually expanded coverage since then. 25 In practice, the new PMT will not work this well. Because it is estimated using the same GLSS-6 data that we use here, it is particularly well suited to identifying the poor in this sample, but because of sampling error, will do less well in the general population.

31
The fourth simulation increases benefits to current beneficiaries only until total LEAP payments reach 0.5 percent of GDP—that is, it uses the current targeting only. Because current (2013) beneficiaries are so few, this produces a huge and unrealistic payment to them: 16 times larger than the current 24 cedis per person per month. The fifth simulation keeps the program size constant at the 2013 level of 0.02 percent of GDP, much smaller than the other simulations, and changes the targeting to the new proxy means test.
TABLE 16. RESULTS OF SIMULATED CHANGES TO LEAP
Source: GLSS-6 and authors’ calculations. Simulation descriptions:
(1) Expands LEAP program to all eligible persons in the entire country using the old proxy means test, then scales benefits down so the total LEAP expenditure is 0.5 percent of GDP.
(2) Expands LEAP program to all people judged to be extremely poor using the new proxy means test, then scales benefits down so the total LEAP expenditure is 0.5 percent of GDP.
(3) Expands LEAP program to the poorest people as judged by the new proxy means test at current benefit rates until total LEAP payments are 0.5 percent of GDP.
(4) Increases benefits to current beneficiaries only until total LEAP payments are 0.5 percent of GDP. (5) Keeps LEAP program payments constant, but changes to the new proxy means test.
Note: In all simulations except (5), VAT is increased to pay for the increased program size.
To interpret the results, recall that disposable income comes prior to VAT, so the impact shown for disposable income is the impact of the LEAP increase only, while impacts for consumable and final income account for both the additional LEAP and its assumed financing via additional VAT. The first simulation shows that increasing LEAP to nationwide coverage using existing targeting accuracy while holding the overall budget to 0.5 percent of GDP would reduce disposable poverty
Change'in: (1) (2) (3) (4) (5)Disposable'Income :0.007 :0.017 :0.019 :0.007 :0.002
Consumable'Income :0.004 :0.015 :0.017 :0.005 0.000Final'Income :0.003 :0.012 :0.013 :0.005 0.000
Disposable'Income :0.009 :0.016 :0.012 :0.008 0.000Consumable'Income :0.004 :0.011 :0.009 :0.005 0.000
Final'Income :0.006 :0.014 :0.014 :0.006 0.000Disposable'Income :0.004 :0.012 :0.012 :0.005 0.000
Consumable'Income :0.003 :0.012 :0.011 :0.004 0.000Final'Income :0.002 :0.009 :0.009 :0.003 0.000
Disposable'Income :0.004 :0.008 :0.008 :0.004 0.000Consumable'Income :0.004 :0.009 :0.009 :0.004 0.000
Final'Income :0.003 :0.008 :0.007 :0.004 0.000Note:'Scaling'Factor 0.70 0.51 1.00 16.29 1.00
Simulation
Extreme'Poverty'
Headcount
Poverty'Headcount
Poverty'Gap
Gini
32
by 0.9 percentage points and extreme poverty by 0.7. Including the effect of the VAT increase reduces the gains, to between 0.3 and 0.6 percentage points, depending on the poverty line and income concept. Reductions in the Gini are small: 0.4 percentage points. The second simulation does much better, demonstrating the advantages of better targeting. Here, disposable income poverty declines by 1.6 percentage points and extreme poverty by 1.7. Including the losses from imposing additional VAT, the gains are still much larger: between 1.1 and 1.5 percentage points. The improvements in the poverty gap are even stronger, reflecting the fact that some of the poorest recipients of LEAP will not cross the poverty line even with its assistance, but their poverty gap will decrease nonetheless. The third simulation is “perfect targeting,” but it does just about as well as the second. In fact, it does a little worse on some of the measures. How can this be? Here, LEAP is perfectly targeted to the PMT value, but not the actual incomes used to calculate the poverty rates, and the rank correlation of the PMT and incomes is not perfect. The key conclusion from this simulation, though, is more that using the targeting of the second simulation is about as good as can be achieved with the new PMT. Results for the fourth simulation are very similar to the first, as both use the old PMT. It is interesting, though, to note that the poverty and inequality effects of an expansion of LEAP’s extensive margin (adding new beneficiaries) and intensive margin (increasing benefits to existing beneficiaries) are broadly similar. Finally, the fifth simulation shows almost no change in poverty or inequality measures, despite the switch to the better targeting of the new PMT, because the program size does not change here. Thus, even greatly improved targeting of a small program cannot have much impact on poverty and inequality. Larger program size is essential. !5. Conclusions The analysis began with three questions about the redistributive effect of taxes and expenditures:
• How much redistribution and poverty reduction is being accomplished through social spending, subsidies and taxes?
• How progressive are revenue collection, subsidies, and government social spending? • Within the limits of fiscal prudence, what could be done to increase redistribution and
poverty reduction through changes in taxation and spending? The answer to the first question is: with the exception of public spending on health care and (especially) education, not much. Overall, the government spending and taxation analyzed here,
33
which we should remember are only a fraction of all spending and taxation, reduce the Gini coefficient by 0.035, which is at the low end of the mostly middle-income countries analyzed by CEQ. Most of this reduction comes from public spending on health care and (especially) education, which between them lower the Gini by 0.021. Of the remaining 0.014 reduction, 0.012 comes from imposition of direct taxes, which are strongly progressive in Ghana. Results for poverty reduction are even less encouraging. Were it not for the in-kind benefits from health and education spending, the fisc would actually increase poverty in Ghana, by about 2 points for the headcount index at the national poverty line.26 This is almost entirely because poor people pay indirect taxes in Ghana, as in every other country. Again, the temptation is to argue for a switch from indirect to direct taxes, but given the already high rate of direct taxation, that may not be feasible. Further, there are efficiency arguments in favor of broad-based indirect taxes like VAT that an equity analysis such as this one does not address. For the second question, Ghana certainly imposes some highly progressive taxes. It is not surprising that PAYE or income taxes on the self-employed in the formal sector are progressive, but perhaps more so that taxes on the informally self-employed are as well. In addition, several excise taxes, including those on petrol and diesel, on most drinks, and on communications are all progressive. But taxes on tobacco products and akpeteshie are regressive, presenting policymakers with a dilemma: taxing these products may be wise on efficiency grounds, as they are associated with important negative externalities, but such taxes are inequitable. For cocoa duties, which are also regressive, there is no such dilemma, however. Ghana has removed taxation of kerosene by cross-subsidizing it from petrol and diesel taxes, a policy that this study shows has clear distributional advantages. On the expenditure side, Ghana also has some moderately well-targeted expenditures. Some of these like LEAP and the school feeding program are explicitly targeted to the poor, while others like schooling through junior high school should be universal, but achieve better targeting as wealthier households self-select out of public schools. There are also some very poorly targeted expenditures in Ghana, most notably subsidies to electricity, which were substantial in 2013, and the occasional subsidies to petrol and diesel that are necessitated by holding down the retail price. Subsidies to higher education, especially university education, are also captured by richer households. Within the limits of fiscal prudence, what could be done to increase redistribution and poverty reduction through changes in taxation and spending? Unfortunately for Ghana, the limits of fiscal prudence are quite strict these days. The deficit is large and persistent, which yields little fiscal space for expanded social welfare spending. Nevertheless, there are some clear policies that both reduce the deficit and reduce inequality. Most importantly, the government’s move to eliminate all subsidization of fuel and electricity is welcome. These are regressive subsidies and, at times, are quite
26 This result is worse than any other CEQ country analyzed to date at the US$2.50 per day poverty line.
34
costly to the fisc. It is true that elimination of these subsidies will increase poverty, as some poor people consume fuel, some have electricity connections, and most importantly, many poor people consume items like transport that are indirectly affected by subsidy removal. But it is also true that, if poverty reduction is the main goal, government could achieve a similar level of poverty reduction with much less expenditure by focusing on its well-targeted programs rather than energy subsidies. Indeed, Ghana taxes fuel less heavily than many other countries, and less than it has taxed it in the past, so there is room to raise the taxes on gasoline and diesel, but it is advisable to maintain the cross-subsidy for kerosene, whose consumption is less concentrated among the rich. Given the progressivity of the direct taxes analyzed here, one might be tempted to conclude that Ghana should reduce the deficit by raising PAYE and presumptive tax rates.27 But Ghana is already seen as a relatively high tax country. Increasing rates may only encourage greater informality among enterprises and, thus, a loss of direct tax revenue and the equalizing effect that direct taxation has. More careful study of how firms respond to higher taxes would be in order before drawing this conclusion. The same argument holds for the many excise duties that are also quite progressive in Ghana: it is tempting to consider increases in these rates, but understanding how these goods’ prices influence both their demand and tax revenues, in addition to the balance between informal and formal production, is important before taking such a decision. While it may seem odd to argue for tax reductions in the current fiscal situation, there is a strong case for eliminating the cocoa duty. This is a regressive tax, and it is also inefficient, discouraging production of a key export product. Within the education sector, our results are similar to prior results in Ghana and everywhere else in the world: lower levels are more progressive and higher levels, less. So reallocation of subsidies from post-secondary to primary would be progressive. For health, however, Ghana does not currently show the typical pattern of outpatient care being more progressive than inpatient. A more subtle lesson comes from the comparison of our results with previous incidence analyses in Ghana. Several public services whose coverage has expanded over the past 25 years—primary and junior high school, inpatient health care—have also seen their progressivity improve. This is a fairly common pattern that Lanjouw and Ravallion (1998) call “early capture” by the rich. The politics of rationing programs or services that are small tend to favor the better-off and better-connected households. But as those same programs or services expand, the new beneficiaries tend to be poorer, so the targeting improves. Given this, efforts to increase social welfare spending may be better placed in expanding existing programs and services, especially those that should be universal (like schooling through secondary school and access to health services) that still do not reach their target (poor) population like LEAP or the school feeding program. This often has the benefit of improving targeting, and at the same time, can minimize the share of the program budget dedicated to administration, which is always higher for new programs.
27 Recall that this study does not address corporate taxes.
35
Appendix I – Calculation of In-Kind Health and Education Benefits
To calculate the expenditure per beneficiary for in-kind services, we need estimates of both total public expenditures to provide these services and the total number of beneficiaries. We have gathered this information from several sources. For public schooling from pre-primary to junior high, the Ministry of Education provided us with total enrolment figures for 2013. We received enrolment for vocational schools and teacher training from Ministry of Education (2013). The National Council for Tertiary Education provided us with enrolment for tertiary education, except for nursing schools. We could find no administrative data for the number of nursing students, so we estimated the total from GLSS-6. We could not get expenditures by level of schooling for 2013 from administrative sources. The Ministry of Finance did provide us with detailed budgets for that year, but we know that budget over-runs were quite large in 2013. The Controller and Accountant General (2013) reports that the budget for all education was 2.89 billion cedis, while actual expenditures were 4.44 billion. To account for this discrepancy, we scale up the budgets for each level of schooling that the Ministry of Finance gave us by the ratio of actual to budgeted education expenditures from the Controller. These expenditure estimates include internally generated funds, mostly school fees, so they are an estimate of the total expenditure per student, not the benefit per student net of fees. To capture the latter, we give each public school student in the GLSS a net benefit equal to the average expenditure per student for her/his type of school, less any expenses that student reports for school fees and PTA dues. For health care, the Ministry of Health (2014) provides a careful estimate of both the number of outpatient visits in 2013 and the cost of provision for each visit. We have used those estimates without modification. For inpatient care, the Ministry of Health (2014) only has information on Korle Bu Hospital, the main teaching hospital, and that information is for total expenditures for both outpatient and inpatient care. To get an estimate of the cost per inpatient visit, we subtracted from the total expenditures at Korle Bu the number of outpatient visits multiplied by our estimate of the national (not Korle Bu) cost per outpatient visit. This gives us estimated expenditures on inpatient care, which we divide by the reported number of inpatients at Korle Bu to get an estimate of the average cost per inpatient. When multiplied by the reported number of inpatient visits, however, this estimate produces a total health expenditure which is much greater than what administrative accounts report. It is likely that there is an error in the number of patients, not the cost estimate. GLSS asks about health care in the past two weeks. Far more people than is reasonable report having been an inpatient in the past two weeks, perhaps because respondents “telescope” what should be a rare event and report inpatient

36
care from further in their past. To adjust for this, we scale down the estimated benefit for inpatient care by two-thirds.
7. Appendix II – Calculation of Electricity Subsidies The government regulates rates that electric utilities may charge. TABLE 17 gives the residential rates for the period October 2012–October 2013, which matches the timing of the GLSS-6 perfectly.
TABLE 17. ELECTRICITY RATES FOR RESIDENTIAL USERS
Source: Public Utilities Commission of Ghana
To calculate the subsidy, we calculated an average cost of a kilowatt-hour purchased by the electricity distribution companies (Electricity Corporation of Ghana and Northern Electricity Department) based on the total purchases by these companies reported in Energy Commission of Ghana (2014) for 2013: 9,416 gigawatt-hours. We multiplied that by the average tariff from the same source, 0.307 cedis per kWh to get the total electricity sales at market prices. To this, we added the subsidy to electricity companies reported by the Ministry of Finance for 2013: 1,079 million cedis to get the total cost of electricity. Dividing by total production yields a cost per kWh of 0.42 cedis. Using the rate structure in TABLE 17, we calculated the subsidy a household receives as the difference between the 0.42 cedi average cost per kWh and the amount paid for each kWh consumed.
lower upper
Rate+(pesewas+per+mo.)
0 50 9.550 300 17.5785300 600 22.8135600 25.3483
Consumption+(kWh+per+mo.)

37
References Akazili, James, Bertha Garshong, Moses Aikins, John Gyapong and Di McIntyre, 2012,
“Progressivity of health care financing and incidence of service benefits in Ghana.” Health Policy and Planning. 27:i13–i22.
Breceda, Karla, Jamele Rigolini, and Jaime Saavedra. 2008. “Latin America and the Social Contract:
Patterns of Social Spending and Taxation,” Policy Research Working Paper 4604, World Bank Latin American and Caribbean Region Poverty Department Poverty Reduction and Economic Management Division, World Bank, Washington, DC.
http://go.worldbank.org/BWBRP91A50 Canagarajah, Sudharshan, and Xiao Ye, 2001, “Public Health and Education Spending in Ghana in
1992-1998: Issues of Equity and Efficiency.” Policy Research Working Paper 2579. Washington, DC: World Bank.
Clemens Breisinger, Magnus Duncan and James Thurlow, 2007, “A 2005 Social Accounting Matrix
for Ghana,” Ghana Statistical Services (GSS) and International Food Policy Research Institute (IFPRI).
Clementi, Fabio, Vasco Molini, and Francesco Schettino. 2015. “Poverty and Social Impact Analysis.
Ghana: The Fuel Subsidies Reduction and Its Impact,” draft. Controller and Accountant General. 2013. Annual Report and Financial Statement of the Public Accounts on
the Consolidated Fund of the Republic of Ghana. Coulombe, Harold, Caroline Ly, and Quentin Wodon, 2012, “Benefit Incidence of Public Education
Spending in Ghana,” Ch. 11 of Wodon, 2012, op. cit. Demery, Lionel. 2003. “Analyzing the Incidence of Public Spending.” In Francois Bourguignon and
Luiz A. Pereira da Silva, eds., The Impact of Economic Policies on Poverty and Income Distribution: Evaluation Techniques and Tools. Oxford University Press and the World Bank.
Demery, Lionel, Shiyan Chao, René Bernier, and Kalpana Mehra, 1995, “The Incidence of Social
Spending in Ghana.” PSP Discussion Paper Series 82. Washington, DC: World Bank. Energy Commission of Ghana. 2014. National Energy Statistics, 2000–2013. Fullerton, D. and Metcalf, G. (2002) “Tax Incidence,” in Handbook of Public Economics 4, Auerbach, A. and Feldstein, M. (eds.), Elsevier Science, Amsterdam, 1787-1872.

38
Ghana Education Trust Fund. 2013. Annual Report on the Activities of the Ghana Education Trust Fund for the Year Ended 31st December 2012.
Goñi, Edwin, J. Humberto López, and Luis Servén. 2011. “Fiscal Redistribution and Income
Inequality in Latin America.” World Development 39(9): 1558–1569. GSS (Ghana Statistical Service). 2014. Ghana Living Standards Survey 6 (GLSS 6): Main Report. Immervoll, Herwig, Horacio Levy, José Ricardo Nogueira, Cathal O’Donoghue, and Rozane Bezerra
de Siqueira. 2009. “The Impact of Brazil’s Tax-Benefit System on Inequality and Poverty.” In Stephan Kasen, and Felicitas Nowak-Lehmann, eds., Poverty, Inequality, and Policy in Latin America, pp. 271–302. Cambridge, MA: MIT Press.
Inchauste, G. and Lustig, N. ed., (forthcoming). The Distributional Impact of Fiscal Policy: Emerging
evidence from developing countries. Washington D.C.: The World Bank. International Labor Office, Social Protection Department. 2014. “Rationalizing Social Protection
Expenditure in Ghana.” Joseph, George and Quentin Wodon, 2012, “Targeting Performance of School Lunches in Ghana,”
ch.12 of Wodon, 2012, op. cit. Kolavalli, Shashidhara, Marcella Vigneri, Haruna Maamah, and John Poku. 2012. “The Partially
Liberalized Cocoa Sector in Ghana: Producer Price Determination, Quality Control, and Service Provision,” IFPRI Discussion Paper 01213, International Food Policy Research Institute, Washington, DC.
Lanjouw, Peter F., and Martin Ravallion. 1998. “Benefit Incidence and the Timing of Program
Capture,” Policy Research Working Paper No. 1956, World Bank, Washington, DC. Lindert, Kathy, Emmanuel Skoufias, and Joseph Shapiro. 2006. “Redistributing Income to the Poor
and Rich: Public Transfers in Latin America and the Caribbean,” Social Protection Discussion Paper 0605, World Bank, Washington, DC.
Lustig, Nora, ed. Forthcoming. Commitment to Equity Assessment (CEQ): Estimating the Incidence of Social
Spending, Subsidies and Taxes. Tulane University and World Bank. Lustig, Nora. 2015a. “El impacto del sistema tributario y el gasto social en la distribución del ingreso
y la pobreza en América Latina: Bolivia, Brasil, Chile, Colombia, Costa Rica, Ecuador, El Salvador, Guatemala, México, Perú y Uruguay: Una aplicación del marco metodológico del proyecto Compromiso con la Equidad (CEQ),” draft.

39
Lustig, Nora. 2015b. “The Redistributive Impact of Government Spending on Education and
Health: Evidence from 13 Developing Countries in the Commitment to Equity Project,” CEQ Working Paper No 30, Center for Inter- American Policy and Research and Department of Economics, Tulane University and Inter-American Dialogue.
Lustig, Nora. 2015c. “El impacto del sistema tributario y el gasto social en la distribución del ingreso
y la pobreza en América Latina: Bolivia, Brasil, Chile, Colombia, Costa Rica, Ecuador, El Salvador, Guatemala, México, Perú y Uruguay,” draft.
Lustig, Nora, Ali Enami, and Rodrigo Aranda. Forthcoming, “The Analytics of Fiscal
Redistribution.” In Nora Lustig, and Sean Higgins, eds. Commitment to Equity Handbook: Estimating the Redistributive Impact of Fiscal Policy. Tulane University and the World Bank.
Lustig, Nora, and Sean Higgins, eds., Forthcoming. Commitment to Equity Handbook: Estimating the
Redistributive Impact of Fiscal Policy. Tulane University and the World Bank. McKay, A., and E. Aryeetey. 2007. “Growth with Poverty Reduction, but Increased Spatial
Inequality: Ghana over the 1990s. In M. Grimm, S. Klasen, and A. McKay, eds., Determinants of Pro Poor Growth: Analytical Issues and Findings from Country Cases. Palgrave-Macmillan.
McKay, Andy, Jukka Pirttilä, and Finn Tarp. 2015. “Ghana: Poverty Reduction over Thirty Years,”
WIDER Working Paper 2015/052, UNU-WIDER, Helsinki. Ministry of Education. 2013. Education Sector Performance Report. Ministry of Employment and Social Welfare. 2012. Livelihood Empowerment Against Poverty Program
(LEAP), Operations Manual. Ministry of Food and Agriculture. 2013. 2013 Fertilizer and Seed Subsidy Programme Implementation
Guidelines. Ministry of Health. 2014. Holistic Assessment of the Health Sector Programme of Work 2013. National Health Insurance Authority. 2013. 2012 Annual Report. Parra Osorio, Juan Carlos, and Quentin Wodon, 2012, “Simulating Conditional Cash Transfers for
Education in Ghana,” Ch. 8 of Wodon, 2012, op. cit. PWC. 2013. “Charting tax trends in Ghana: A quick guide to taxation in Ghana.”
www.pwc.com/gh.

40
Roland-Holst, David W., and Ferran Sancho. 1995. “Modeling Prices in a SAM Structure.” The
Review of Economics and Statistics. 77 (2): 361–371. Schieber, George, Cheryl Cashin, Karima Saleh, and Rouselle Lavado. 2012. “Health Financing in
Ghana,” Directions in Development: Human Development, #71894, World Bank, Washington, DC.
Silveira, Fernando Gaiger, Johnathan Ferreira, Joana Mostafa and José Aparecido Carlos Ribeiro.
2011. “Qual o Impacto da Tributação e dos Gastos Públicos Sociais na Distribuição de Renda do Brasil? Observando os Dois Lados da Moeda.” In José Aparecido Carlos Ribeiro, Álvaro Luchiezi Jr., and Sérgio Eduardo Arbulu Mendonça, eds., Progressividade da Tributação e Desoneração da Folha de Pagamentos Elementos para Reflexão, pp. 25–63. Brasilia: IPEA.
SSNIT (Social Security and National Income Trust). 2013. 2012 Annual Report. Terkper, Seth E. 2014. Mid-Year Review of the Budget Statement and Economic Policy and Supplementary
Estimates of the Government of Ghana for the 2014 Financial Year, Ministry of Finance. Tsimpo, Clarence, and Quentin Wodon, 2012a, “Tax Cuts for Rice and Fertilizer Subsidies in
Ghana,” Ch. 9 of Wodon, 2012, op. cit. Tsimpo, Clarence, and Quentin Wodon, 2012b, “Electricity Subsidies in Ghana,” Ch. 10 of Wodon,
2012, op. cit. Tsimpo, Clarence, and Quentin Wodon, 2012c, “Ghana’s Livelihood Empowerment Against
Poverty,” Ch. 10 of Wodon, 2012, op. cit. Wodon, Quentin, ed., 2012, Improving the Targeting of Social Programs in Ghana. Washington, DC: World
Bank. World Bank. World Development Indicators. http://data.worldbank.org/data-catalog/world-
development-indicators. Younger, Stephen D., 1993, “Estimating Tax Incidence in Ghana: an Exercise Using Household
Data.” CFNPP working paper 48. Ithaca, NY: Cornell University.

WHAT IS CEQ?
The CEQ logo is a stylized graphical representation of a Lorenz curve for a fairly unequal distribution of income (the bottom part of the C, below the diagonal) and a concentration curve for a very progressive transfer (the top part of the C).
Led by Nora Lustig since 2008, the Commitment to Equity (CEQ) project is an initiative of the Center for Inter-American Policy and Research (CIPR) and the Department of Economics, Tulane University, the Center for Global Development and the Inter-American Dialogue. The project’s main output is the CEQ Assessment, a methodological framework designed to analyze the impact of taxation and social spending on inequality and poverty in individual countries. The main objective of the CEQ is to provide a roadmap for governments, multilateral institutions, and nongovernmental organizations in their efforts to build more equitable societies.
6LQFH�LWV�LQFHSWLRQ��WKH�&(4�KDV�UHFHLYHG�ÀQDQFLDO�VXSSRUW�IURP�Tulane University’s Center for Inter-American Policy and Research, the School of Liberal Arts and the Stone Center for Latin American Studies as well as the Bill & Melinda Gates Foundation, the Inter-American Development Bank (IADB), the World Bank, the United Nations Development Programme’s Regional Bureau for Latin America and the Caribbean (UNDP/RBLAC), the Development Bank of Latin America (CAF), the African Development Bank, the International Fund for Agricultural Development (IFAD), the Canadian International Development Agency (CIDA), the Norwegian Ministry of Foreign Affairs, and the General Electric Foundation. www.commitmentoequity.org