fiscal institutions in resource-rich economies ... -...
TRANSCRIPT

Fiscal Institutions in Resource-Rich Economies:
Lessons from Chile and Norway *
Klaus Schmidt-Hebbel **
March 2012
Abstract
Resource-rich economies in general, and Arab oil exporters in particular, are at a critical juncture, facing the challenge of revamping their fiscal policy institutions and conduct to strengthen macroeconomic and financial stability, raise growth, and improve intra/inter-generational equity. This paper starts by reviewing the international evidence on fiscal policies and outcomes in resource-rich economies at large and Arab oil-exporting countries in particular, which suggests that strong fiscal (and political) institutions can turn the resource curse into a blessing. Then the paper provides comparative reviews of Chile’s and Norway’s decade-long experience in setting up new fiscal institutions and rules to manage their resource rents, aiming at and, in fact, attaining more macroeconomic and financial stability, higher growth, and improved equity. Specific reform lessons to strengthen fiscal institutions and policies are drawn for resource-rich economies and Arab oil exporters.
JEL Classification: E61, E62, E63, H61. Key Words: Fiscal institutions, Fiscal rules, Resource-rich economies, Chile, Norway. * I thank Hasan Ersel, Raimundo Soto, and, in particular, Ibrahim Elbadawi for excellent comments to previous drafts. I also thank Francisco Muñoz for very proficient assistance. ** Catholic University of Chile. email: [email protected]

1
1. INTRODUCTION
Resource-rich economies (RREs) in general, and Arab oil-exporting countries in particular, are at a critical juncture, facing the challenge to revamp their fiscal policy institutions and conduct to strengthen macroeconomic and financial stability, raise growth, and improve intra/inter-generational equity. The ongoing world price boom that benefits exporters of oil and other commodities offers RREs a very favorable window of opportunity to adopt deep fiscal reforms.
Section 2 reviews the recent international evidence on fiscal policies and outcomes in
REEs in general and Arab oil exporters in particular. Among RREs, Chile and Norway revamped their fiscal policy frameworks one decade ago, setting up new fiscal institutions and rules to manage their resource rents, aiming at more macroeconomic and financial stability, higher growth, and improved inter-generational equity. Sections 3 and 4 describe and assess the conduct of policy under the new fiscal institutions and rules in Chile and Norway, and relate them to fiscal and macroeconomic performance. Section 3 analyzes Chile’s case, focusing on the country’s fiscal institutions and outcomes, fiscal rule, sovereign wealth funds (SWFs), and shortcomings of its current institutional framework and proposals for reform. Section 4, on Norway, review’s the country’s institutional set-up, fiscal rule, budget performance, and SWFs. The subsequent section derives specific policy lessons from Chile and Norway for RREs and Arab oil exporters. Section 6 concludes. 2. EVIDENCE ON FISCAL POLICIES AND OUTCOMES IN RESOURCE-RICH ECONOMIES AND ARAB OIL-PRODUCING COUNTRIES
Economic history abounds with negative examples of inconsistent and inefficient design and execution of fiscal policy in RREs, which lead to macroeconomic and financial crises, debt defaults, financial under-development, low growth, and inequity.
Next I summarize briefly the evidence on fiscal policies and their outcomes in RREs in
general, and then I review the corresponding evidence available for oil-producing Arab countries in particular. 2.1 Resource-Rich Economies Natural resources: curse or blessing? In countries where the relative size of the resource sector is similar, a resource boom is more likely to benefit those economies with better initial institutions (Robinson et al. 2003). A more refined, subsequent analysis shows that institutions are endogenous to both resource rents and the size of tax revenue from the non-resource sector. When the latter taxes are low and the resource sector is large, resource rents corrupt institutions and lead to low growth; the opposite – a resource blessing – is observed where non-resource taxes are large (Salti 2008). Complementary evidence shows that RREs typically raise less revenue from non-resource taxation, as a result of high resource rents. This causes governance problems as lower domestic taxation reduces the incentive for public scrutiny by governments (Bornhorst et al. 2008).

2
Fiscal pro-cyclicality A large body of empirical international research shows that fiscal (and monetary) pro-cyclicality is more likely in countries with poor fiscal governance, high levels of corruption, low fiscal credibility, domestic financial under-development, and weak integration into world financial markets (Ilzetzki and Végh 2008, Calderón and Schmidt-Hebbel 2008, Abdih et al. 2010, Calderón, Duncan and Schmidt-Hebbel 2011). This evidence is particularly relevant for many RREs, where fiscal policy is pro-cyclical. For example, non-oil primary government balances worsened substantially in oil-producing countries during the 2003-2008 oil-price boom and improved in 2009 – hence exhibiting strong policy pro-cyclicality (Villafuerte and López-Murphy 2010). Weak fiscal sustainability
Fiscal policy sustainability is weak in many resource-rich economies. Long-term fiscal sustainability positions (measured by fiscal policy positions relative to estimated sustainable fiscal benchmarks) have worsened in oil-producing countries during the 2003-2008 boom (Villafuerte and López-Murphy 2010). Fiscal vulnerability to resource-price reversals Fiscal positions are often vulnerable to reversals after price booms in resource-rich economies. In oil-producing countries, a relatively small decline in oil prices leads to a substantial increase in net financing needs, as a result of absent fiscal and exchange-rate adjustment (Villafuerte and López-Murphy 2010). Macroeconomic volatility, Dutch disease, and lower growth Fiscal pro-cyclicality and lack of strong fiscal fundamentals lead to macroeconomic volatility, reflected particularly in large volatility of the real exchange rate and activity. Fiscal policy pro-cyclicality has amplified business cycles in oil-producing countries (Villafuerte and López-Murphy 2010, Abdih et al. 2010). Pro-cyclical government spending leads to Dutch disease during revenue booms, reflected in exchange-rate misalignment, loss of export competitiveness, and large non-resource current account deficits.1 Moreover, contrary to the expectation that resource rents are used to finance much-needed public investment, public capital is lowered by resource rents world-wide – a perverse effect that is mitigated by better institutions and lower macroeconomic volatility (Bhattacharyya and Collier 2011). Fiscal and political institutions Growing cross-country evidence and country studies show that political institutions generally and fiscal institutions in particular help turning a natural resource curse into a blessing. Weak fiscal-policy institutions have adverse effects that go well beyond policy pro-cyclicality and Dutch disease. Opaque budgetary management and external control, lack of
1 Recent evidence shows that the size of the fiscal balance coefficient as a determinant of the current account balance as much larger in OPCs that in other industrial and emerging economies (Morsy 2009).

3
transparent fiscal policies and budgets, and poor budgetary accountability lead to ineffective and inefficient government spending, misuse of government resources, and corruption. At the heart of good fiscal and political institutions is good governance, based on adequate political checks and balances, transparency and accountability, and well-designed and strongly-enforced incentives faced by politicians – ultimately democracy (Torvik 2012). RREs that have been blessed by natural resource rents are those that have put in place strong fiscal and political institutions, including Botswana, Chile, Malaysia, Mauritius, and Norway (Gylfason 2012). Strong systematic empirical evidence for the world on the links between resource rents, political institutions, and growth is provided by Elbadawi and Soto (2012). They show that RREs with both a high degree of inclusiveness (a measure of democracy) and strong political checks and balances turn resources rents into a blessing, exhibiting larger growth than with the rents. On the contrary, RREs that lack democracy and/or strong checks and balances, suffer from the ultimate manifestation of a resource curse: low growth. 2.2 Arab Oil-Exporting Countries The 22-country Arab League includes 11 hydrocarbon (oil and gas)-exporting countries, which are included in the group of RREs discussed above. On average, the dependence of Arab oil-exporting countries on oil (and gas) is larger than the dependence of the average RRE in the world on its resource exports. The 11 Arab economies account for 55% of oil reserves and 29% of natural gas reserves in the world, and their hydrocarbon sector represents 50% of GDP and 80% of government revenue. Like RREs in general, many Arab oil exporters show evidence of a natural-resource curse reflected in fiscal pro-cyclicality, macroeconomic volatility, RER misalignment, and lack of productive diversification. In oil and gas-exporting Gulf Cooperation Council (GCC) countries, government spending follows oil revenue, confirming expenditure pro-cyclicality (Fasano and Wang, 2002). Of the 11 oil-exporting Arab countries, 7 countries are rich labor-importing economies and 4 are less-rich labor-abundant economies. Fiscal policy institutions tend to be more developed in the labor-importing, richer Arab countries. For example, among the world’s oldest, largest, and best-managed sovereign wealth funds are those belonging to UAE (Abu Dhabi), Kuwait, and Saudi Arabia.
However, many manifestations of Dutch Disease are not found to be correlated with the divide between non-populous and populous Arab oil exporters. Fiscal policy (reflected by the fiscal balance) is found to be pro-cyclical in 3 GCC countries – Bahrain, Kuwait, and Saudi Arabia – just as it is in populous Arab countries, such as Algeria and Libya (El-Gamal and Selim 2012). Only in Qatar fiscal policy is found to be counter-cyclical. While there is no evidence of very large real exchange-rate appreciation in response to higher oil rents, 6 Arab countries, including two GCC countries, exhibit moderate Dutch Disease reflected by exchange-rate appreciation (El-Gamal and Selim 2012). Recent case studies provide in-depth evidence on the links between oil rents, fiscal institutions, and macroeconomic performance in Arab oil exporters. Saudi Arabia’s large government sector pays wages that are significantly higher than those paid by the private

4
sector, crowding out private business and contributing to high unemployment (AlSheikh and Erbas, 2011). Yemen exhibits some of the standard oil-curse symptoms derived from its new oil and gas wealth. Weak fiscal and political institutions have led to pro-cyclical fiscal policy, Dutch Disease, a sub-optimal use of oil-wealth, and political instability and conflict in Yemen (Al-Iriani, 2011). Sudan’s experience has been similar to Yemen’s: oil rents and weak fiscal and political institutions have led to fiscal policy pro-cyclicality, real exchange-rate misalignment, negative TFP growth, and an exacerbation of political conflict (Suliman, 2011). 3. CHILE’S FISCAL INSTITUTIONS AND OUTCOMES 3.1 Chile’s Institutional Framework for Fiscal Policy
A modern institutional framework for the conduct of fiscal policy and financial management should aim at addressing the principal-agent problems that arise between voters and political authorities due to government impatience, lack of representation of future generations, electoral competition, sensitivity to special-interest lobbies, corruption, and use of asymmetric and biased information (von Hagen 2005, Wren-Lewis, 2010). To overcome these distortions and negative externalities, the academic literature and international experience suggests adopting an institutional framework for fiscal policy based on the following components (Ter-Minassian 2010, IMF 2009, 2010, Debrun et al. 2009): a fiscal responsibility law, modern financial management, a planning horizon that exceeds one year, a fiscal rule for the budget, rules for government asset and liability management, requirements on accountability and public information on the government’s financial management, effective external control and auditing, and establishment of a fiscal council and/or fiscal committees.
Next I describe Chile’s development of the eight latter components of a modern
institutional framework. Fiscal Responsibility Law
Several countries have adopted fiscal responsibility laws, specifying budgetary procedures and rules to strengthen fiscal policy transparency, accountability, and stability. Fiscal responsibility laws establish requirements on the executive to state transparently its short and medium-term policy objectives, to set short and medium-term targets for fiscal flows and stocks, to provide transparent information on budget planning and execution to the legislature, to implement a fiscal policy conducive to fiscal stability and solvency, and to account ex-post for its fiscal policy execution and attainment of policy objectives (Lienert 2010).
However, fiscal responsibility laws do not always spell out an explicit fiscal rule.
Conversely, fiscal rules are often adopted in the absence (or outside) a fiscal responsibility law. For example, Germany adopted in 2008 a fiscal rule by constitutional amendment, not as part of a fiscal responsibility law.
Fiscal responsibility laws are often enacted as legal tools in support of fiscal
consolidation, which sometimes occurs under a stabilization program agreed with the IMF, so that its emphasis is on budgetary control rather than effective fiscal policy. However, in other conditions such laws are adopted with the aim of strengthening the institutional framework for

5
fiscal policy, focusing on the above mentioned components of a modern institutional framework – like in Chile’s case. Chile enacted Law No. 20128 on Fiscal Responsibility in 2006 to strengthen the institutional framework for its fiscal rule. The rule had been adopted as an administrative decision five years earlier by a previous administration, as a way to tie its own hands and possibly its successors’, but lacking legal support. Therefore the 2006 law was not adopted to enforce fiscal adjustment but to develop the institutional framework required to strengthen the links between the fiscal rule, the use of government savings, and the establishment of two sovereign wealth funds. Its major provisions are the following (Rodríguez et al. 2006): (i) Legal requirement for a new government administration to define and publish the fiscal policy framework for its 4-year term and its implications for the government’s “structural” (i.e., cyclically-adjusted) balance. (ii) Legal requirement for the administration to issue an annual report on the financial state of the government, its fiscal sustainability, and the macroeconomic and financial implications of fiscal policy, as well as an estimation of its cyclically-adjusted balance. (iii) Requirement of annual estimation of government contingent liabilities (required to determine the cyclically-adjusted balance target). (iv) Establishment of a Pension Reserve Fund (PRF) to finance future pension liabilities of the government. During its 10 first years of existence, the PRF accumulates funds at a yearly floor equivalent to 0.2% of GDP and a ceiling of 0.5%, where the actual figure within the aforementioned range is determined by the government. The funding sources for the floor are government revenues or government saving. (v) Establishment of an Economic and Social Stabilization Fund (ESSF), starting with the foreign resources accumulated in the former Copper Revenue Compensation Fund (which is abolished) and other foreign asset holdings of the government at the end of 2006 (Table 5). The budget surplus (after payment into the PRF) is transferred into the ESSF and resources are withdrawn from the ESSF to finance budget deficits (including payments into the PRF). (vi) Government option to engage in annual capital transfers to the Central Bank of Chile (CBC) for the latter’s capitalization during five years (2007-11), on an amount bound by a ceiling of 0.5% of GDP and subject to availability of a government surplus after payment into the PRF. The government holds the right to decide how to allocate the budget surplus to the ESSF and to CBC capitalization, subject to the above mentioned restrictions. (vii) International investment of the resources held in the two sovereign wealth funds – PRF and ESSF – can be executed directly by the Treasury (under the Ministry of Finance, MoF) or can be outsourced to the CBC or private fund managers hired by the CBC. The law also establishes a new Advisory Financial Committee for Fiscal Responsibility Funds of the MoF to advise the minister on investment regulations and decisions related to the two sovereign wealth funds. Note that the latter law does not impose any specific fiscal rule on the government. It rather implies a requirement to adopt and implement a fiscal policy framework aiming at fiscal sustainability, based on a distinction between actual and cyclically-adjusted government balances. This provides sufficient flexibility to new governments to define the explicit formula for the fiscal rule they commit to at the start of their administration. In addition, the law defines new institutions – adopted in 2006-2007 – that strengthen operation of the fiscal rule.

6
Financial Management of the Budget International best practice of budgetary management is based on the adoption of the
following core elements for efficient financial management by the MoF (Ter-Minassian 2010): (a) Strong constitutional and legal powers granted to the MoF on legal initiatives with
budgetary impact, (b) Strong political power of the MoF in adopting and implementing the budget
regarding other ministries, regional and municipal governments, independent government agencies and public enterprises,
(c) High technical capacity for budgetary planning and ensuring its consistency with the government’s fiscal policy objectives,
(d) Adoption of modern accounting principles, (e) Efficient legislative approval of the budget, limiting the possibility of legislative
amendments that contradict government fiscal policy, and (f) Significant capacity in monitoring and obtaining early information on budget and in
implementing budgetary corrections of observed deviations.
International evidence shows that countries that meet the latter requirements attain better performance in budget execution, stability, and sustainability of fiscal policy (Alesina and Perotti 1996, Stein et al. 1998, Alesina et al. 1999, Ter-Minassian 2010).
Chile’s strong presidential system empowers the government with budgetary initiative
(not shared with congress) and strong control over budget design and negotiation with congress. The executive holds the sole power of tax initiative. Congress lacks line-item veto and is only entitled to vote for or against the Government’s proposed budget bill. Congress also lacks in-house capabilities to assess and evaluate in depth current fiscal policy, projections in the budget bill, and underlying macroeconomic assumptions.
However, significant budget negotiations take place between the government represented by the MoF and congress before the budget comes to vote. The latter negotiations tend to focus on budget (i.e., spending) composition rather than on taxation or the overall resource constraint, not the least because of the constraints imposed by the fiscal rule on the budget’s overall resource envelope. Budget Planning Horizon
Many countries are reforming their budget planning, shifting from one-year to multi-
year horizons. This change is aimed at different objectives: (i) achieving greater transparency, consistency, and intertemporal sustainability of fiscal policy, (ii) reducing government short-term bias in public spending decisions, and (iii) committing to a path of gradual correction of initially unsustainable fiscal positions.
On one hand there are governments that lack fiscal rules but adopt multi-annual
budgeting to enhance sustainability and credibility of fiscal policy. On the other hand, there are governments with one-year budgeting but that have adopted fiscal rules based on cyclical adjustments. The latter governments have an implicit multi-annual budget horizon by distinguishing between actual and cyclically-adjusted government accounts and balances. However, in the latter case, adopting explicit multi-year budgetary and fiscal targets contributes

7
to additional potential gains in fiscal policy sustainability and credibility, as well as in macroeconomic stability.
Chile has in place a one-year budgeting framework. However, the aforementioned 2006 Fiscal Responsibility Law includes two provisions that require governments to adopt a fiscal policy that is, at least in principle, consistent with a horizon that exceeds one year: (i) the requirement imposed on new administrations to present their four-year fiscal policy framework and its implications for the cyclically-adjusted government balance , (ii) the requirement on the MoF to submit annually, together with the draft budget law, a medium-term budget projection.
Moreover, by adhering to a cyclically-adjusted balance rule, governments are required
to base next year’s budget proposal on medium-term projections for GDP and the price of copper.
With one exception, Chile’s governments are not required to submit long-term
projections for government accounts and budgets, based on a systematic assessment of fiscal sustainability and regular evaluation of long-term consequences of fiscal decisions with budgetary implications, like those conducted by the U.S. Congressional Budget Office and other governments in the world. The one exception is the undertaking of a technical study, required by the 2006 Law, to assess the long-term funding needs of the Pension Reserve Fund (one of Chile’s sovereign wealth funds) to meet the government liabilities derived from the government pension subsidy (Pensión Básica Solidaria). Fiscal Rules
The number of countries with fiscal rules at national level has grown steadily over the
past two decades, from a universe of 10 countries in 1990 to 30 in 2001 (the year of adoption of the Chilean fiscal rule) and 51 in 2009 (IMF, 2009). Countries with fiscal rules had in place on average 2.5 active fiscal rules in 2009.
Fiscal rules are adopted to attain one or more of three objectives: sustainability of
public debt, control of government size, and contribution to cyclical stability. Rules differ widely across countries in how they are defined. A major category of rules are those that define numerical targets (targets, ceilings or floors) for government balances, overall revenue or expenditure levels that are independent of the business cycle. A paramount example of the latter rules is the Stability and Growth Pact ceilings on government deficits (3% of GDP) and debt levels (60% of GDP) for euro zone member countries – which were systematically violated before 2008 and almost universally thereafter. A second category are fiscal rules that aim at stabilizing cyclically-adjusted balances, allowing for cyclical changes in actual government balances, with the aim of implementing a counter-cyclical fiscal policy or at least avoiding pro-cyclical policy bias. According to the IMF (2009), some 10 countries (including Chile) had such rules in place in 2009. Among them, only Germany, the UK, and Sweden had a fiscal rule in place that defines a numerical target for the actual budget balance throughout the economic cycle.
The cited study (IMF, 2009) reviews the relative advantages of different fiscal rules,
their design and complementarity with other institutional changes, the institutional of

8
deviations. It also assesses positively the fiscal and macroeconomic effects of fiscal rules in the world.
A recent world-wide panel data study by Elbadawi et al. (2011) provides empirical
evidence on why countries adopt and maintain rule-based fiscal policy regimes. Their reported evidence shows that fiscal conditions, government stability, inflation targets, fixed exchange rates, global financial integration, democracy, political checks and balances, and overall development raise countries’ likelihood to have fiscal rules in place.
Chile is among the 10 countries with a fiscal rule that aims at stabilizing cyclically-
adjusted government balances. Together with Norway, and in contrast to the other 8 cases, Chile corrects not only for the cyclical influence of the business cycle as reflected by GDP deviations from trend but also for the cyclical deviations of the price of the main commodity export good from its trend level. Hence Chile’s and Norway’s experiences are unique in the world and are exemplary for commodity-exporting countries, as highlighted by IMF (2009).
However, unlike other countries with fiscal rules in place, Chile has neither established
ex-ante escape clauses from the rule that would apply under pre-specified conditions nor ex-post sanctions for violating the rule and ex-post corrections of deviations from the rule. More on Chile’s rule is discussed below. Rules for Management of Government Assets and Liabilities
As the commodity-exporting countries benefited from significant fiscal surpluses
during the extended boom in commodity prices over the last decade, many of them have started to save their surpluses in sovereign wealth funds (SWFs) invested in internationally diversified portfolios. This is observed in countries with and without fiscal rules. Until 2009, 37 countries had SWFs in place, with outstanding aggregate assets of US$ 3.8 trillion. In the case of Chile, the outstanding investments of its two SWFs added up to US$ 16.6 billion at the end of 2010 (Table 5).
Countries with SWFs have committed to rules for saving in and dissaving from their
funds. In the case of countries with a fiscal rule in place, accumulation into and withdrawal from their funds is determined by the rule. In addition, many countries have adopted legislation and institutions that define investment policies and management principles of their funds.
As mentioned above, in the case of Chile, its two SWFs were established by the 2006 Fiscal Responsibility Law. The latter also established the Financial Advisory Committee on Sovereign Funds of the Ministry of Finance, which advises the MoF on investment policies of these funds. More on Chile’s SWFs is discussed below.
However, Chile (like most countries in the world) lacks both a policy and an institution
focused on consistent management of government financial assets and liabilities, with explicit financial objectives including risk, return, liquidity, or benchmarking. Moreover, there is no comprehensive management of the government’s total balance sheet, including financial and non-financial assets, as well as explicit and contingent financial liabilities.
9
Requirements on Budget Accountability and Provision of Information on Financial Management
World-wide efforts are observed by governments to improve accountability of their
fiscal policy and transparency in the provision of financial information. This trend responds to the growing political and academic consensus on the democratic and economic efficiency gains of fuller accountability and transparency in fiscal policy. Although there is little empirical evidence on the benefits of high levels of accountability and transparency in fiscal policy, it seems legitimate to infer qualitatively from the evidence of accountability and transparency benefits identified in the case of monetary policy (e.g. Geraats and Eijffinger 2006, Geraats 2008).
The International Budget Partnership (2010) compiles the “Open Budget Survey”, an
international comparative database on partial and aggregate measures of global transparency and accountability of the budgets of central governments in the world. In its 2010 version, Norway ranks fifth and Chile ranks eighth among 94 countries (Figure 1 depicts ranking results for a selective sub-sample).
In Chile, transparency on the forecasts of the two key variables for the budget – future GDP growth and copper prices – was ensured almost from the start of the fiscal rule, as projections for the two latter variables made by two ad hoc committees were made public (more on them below). However, mapping of the latter projections into the actual budget calculations could not easily be replicated, particularly after several changes were introduced to the rule in 2008-2009. However, the 2010 Report of Public Finances for the Budget Law 2011 made significant improvements in the provision of information on the calculation of the cyclically-adjusted balance, which was coherent with the recommendations provided by the Advisory Committee on Fiscal Policy (2010, 2011).
Regarding SWFs, international heterogeneity in their management and investment accountability and transparency is large. In the most recent international ranking of transparency in the management of sovereign wealth funds, published by the Sovereign Wealth Fund Institute (2011), Chile and Norway rank in first place, together with seven other SWFs (Figure 2). Therefore the current state of transparency and accountability of Chile’s government accounts is varied, ranging from moderate to high. External Control and Auditing
External control and auditing of government accounts and budget execution is performed by the legislature, the government’s general comptroller or auditor, and fiscal councils and committees. In most countries, congress and especially the general comptroller exercise traditional accounting, financial, and managerial control of budget execution and government accounts. More recently, countries are adopting fiscal committees and councils, which are empowered to provide an economic assessment of fiscal policy design and execution, as discussed below.
10
Government accountability of budgetary compliance in Chile is limited to a large extent to oversight and control by the General Comptroller’s Office (Contraloría General de la República). This institution focuses on accounting, procedural, and legal compliance by the government in its implementation of fiscal policy and execution of the budget. This oversight and control function by the General Comptroller is exercised for all levels of government. In this way the Comptroller’s Office has contributed decisively – both in the past and today – to limit the extent of illegal government actions and government corruption. However, there is almost nil substantive ex-ante, real-time or ex-post evaluation of fiscal policy implementation and its compliance with the fiscal rule, of government spending (either mandatory or discretionary), and of the efficiency and effectiveness of government programs and tax collection efforts. There are simply very few resources spent by congress, political parties, think tanks or academia in conducting systematic evaluation of fiscal policy and its implementation. There is no independent fiscal council and/or a think tank that focuses on fiscal policy. The only exceptions to this dearth of fiscal policy evaluation are a few academic papers and some exceptional initiatives at the MoF to assess partial aspects of fiscal policy. Fiscal Committees and Fiscal Councils
Fiscal committees are temporary or permanent advisory bodies to the MoF, responsible for specific, narrow tasks such as providing advice on institutional changes or investments of SWFs. Their recommendations could be binding or not for the government.
Independent fiscal councils (and budget offices) are permanent government or
congressional agencies entrusted with much broader tasks. Their recommendations could be binding for governments – which is more often the case than it is for fiscal committees.
While fiscal committees and fiscal councils have different tasks, the latter may include
the following (Debrun and Kumar 2007, Debrun et al. 2009, Ter-Minassian 2010, Calmfors and Wren-Lewis 2011): (a) Evaluation and validation of financial and macroeconomic assumptions for the budget, (b) Provision of independent projections for the budget and government financial conditions, for both base and risk scenarios, for the short term and the long term, (e) Provision of policy assessments and recommendations on fiscal policy and budgetary management, based on ex-ante evaluation whether fiscal policy is likely to meet its targets, (c) Assessment and advice to the government and/or the legislature on the stance of fiscal policy, its long-term sustainability and optimality, and its macroeconomic effects, (d) Assessment of and recommendations on policies for government asset and liability management, (f) Monitoring of budget implementation and provision of recommendations on budgetary corrections when facing deviations in budget execution, and (g) Analysis of fiscal transparency.
Some governments – like Chile’s – have adopted advisory committees of the Ministry
of Finance, which provide recommendations – some or binding and others not – on some aspects of the menu of possible tasks identified above.

11
Other countries have adopted advisory offices of the legislature to provide
independent assessments of budget assumptions, budget projections, and fiscal policy effects. That is the case of the U.S. Congressional Budget Office, which began in 1974 (Rivlin 2010) and the Parliamentary Budget Office in Canada, founded in 2008 (Levy 2008), among other countries, like Japan, Korea, and Mexico.
Among the countries with some kind of fiscal council are many members of the
European Union (EU) (several having more than one fiscal council), including Austria, Belgium, Denmark, Estonia, France, Germany, Greece, Hungary, Italy, Luxembourg, Netherlands, Portugal, and the UK (Debrun et al. 2009). Outside the EU, Sweden and Japan have in place fiscal agencies that provide tax advice. Debrun and Kumar (2007) provide some statistical evidence in support of the notion that fiscal councils in the 25 member countries of the EU have contributed to fiscal discipline, especially when such advice is provided by an agency mandated by an ad hoc law. Yet the more recent fiscal crisis in several euro zone member countries casts doubts about the latter findings, based on pre-2007 data.
More recently, and partly in response to fiscal crises, several countries (including France and the United Kingdom) have adopted or are adopting stronger fiscal councils, based on an ad hoc law, which grants them substantial degrees of government independence, strengthening their capabilities to provide independent assessment and advice. This new brand of fiscal councils – and some of the existing councils – tend to exhibit the following features:
1. Independence from government, 2. created by special laws, which define their mandate, functions, responsibilities,
corporate structure, staffing, financing, accountability and transparency in the delivery of studies and activities,
3. with board members chosen by congress among academics or experts with fiscal policy experience, and
4. sometimes entitled with the authority to propose sanctions in case of significant deviations in budget execution.
Chile lacks an independent fiscal council. But it has in place three independent fiscal
committees or expert groups: the Advisory Committee for Trend GDP of the MoF (ACTG), the Advisory Committee for the Reference Copper Price of the MOF (ACRCP), and the Advisory Financial Committee for Fiscal Responsibility Funds of the MoF (AFCFRF). Their role is limited to an advisory function, defined by the 2006 Fiscal Responsibility Law. ACTG provides the MoF with medium-term projections for the rate of growth of capital, the labor force, and productivity, which are used by the MoF to generate projections of trend GDP and the output gap, based on a MoF methodology. ACRCP provides the MoF with projections of the international long-term copper price. Current-year projections for trend GDP growth and the long-term copper price, and for next year’s GDP growth and copper price, are key for budgeting the overall government resource envelope, i.e., for setting the levels of government spending, cyclically-adjusted and actual government revenue, and hence the cyclically-adjusted and actual government balance.

12
The three individual projections made by each of the 16 members of the ACTG and the single projection made by each of the 12 members of the ACRCB are binding. Each member provides projections which are averaged after elimination of the two extreme observations to generate MoF’s official estimates for the four variables. However, the MoF maintains significant discretionary power in defining the methodology – equations and parameters – that determines the cyclically-adjusted fiscal balance rule and how the four variable foreasts translate into budgetary projections. While the MoF has been increasingly transparent about the details of its method – as reflected in technical papers, the summary notes of the ACTG and ACRCH annual meetings, and the 2010 Budget Law for 2011 – this information also reflects the residual discretion maintained by the MoF in defining the government’s overall resource envelope. Independent members of both advisory committees are invited by the MoF to serve for one budgetary exercise. Members are selected by the MoF among the local communities of macroeconomists (for the ACTG) and copper market experts (for the ACRCB). They attend one technical meeting held at the MoF in July or August of each year and are then invited to submit their individual projections in the following weeks. The MoF publishes between August and October of each year two official notes, one for each advisory committee, that reports individual and averaged forecasts and, in the case of the ACTG, trend growth and output gap estimates. There is no formal or direct communication by any of the two committees with Congress or the press.
In contrast to the two previous committees, the AFCFRF is based on a more formal institutional setup. The six independent members are selected by the MoF among the local community of macroeconomists and financial experts and their overlapping tenure is two years. The AFCFRF is comprised by its chair or President, a Vice-President, and four additional members. The Committee meets on average every six weeks at the MoF. Members are remunerated for their attendance of Committee meetings. The Secretariat of the AFCFRF is the International Financial Directorate of the MoF. Its head acts as secretary of the AFCFRF and his staff (also present at Committee meetings) prepare technical reports on international financial conditions and financial performance of sovereign wealth fund investments at each meeting. AFCFRF members discuss financial developments and their implications for the performance of the funds, evaluate fund management by the Central Bank of Chile and meet occasionally with Bank managers of the funds, and issue recommendations about fund investment policy and regulation to the MoF. AFCFRF recommendations – in contrast to the projections submitted by the two aforementioned committees – are not binding for the Minister of Finance. AFCFRF issues a press communiqué after each meeting and publishes an annual report on the funds’ financial results and the Committee’s investment policy recommendations to the Minister. 3.2 Chile’s Fiscal Rule The Rule
Chile’s fiscal rule for the central government budget was developed in 2000 and implemented in 2001 by Finance Minister Nicolás Eyzaguirre and his main advisors. While the

13
rule has been subject to several changes, its main features have remained unaltered, Therefore it is now in its twelfth year of operation, applied by three different administrations: the governments of presidents Lagos (2000-2006), Bachelet (2006-2010), and Piñera (since 2010), which has committed to its continuation through the 2010-14 term of office.
Chile’s fiscal rule aims at contributing to two policy objectives: fiscal sustainability and fiscal/macroeconomic stability. Fiscal stability is ensured by committing to a target level for the government’s cyclically-adjusted balance (CAB) that is consistent with government saving needs (net of government investment). Fiscal (and possibly macroeconomic stability) is attained by committing to a government spending path that is consistent with cyclically-adjusted government revenue. 2 Therefore Chile’s CAB rule combines a partial application of the permanent income theory to government spending with a target level for long-term government saving. Hence the rule’s aim is to save during high-revenue periods in order to withdraw from the latter savings in bad times, over and above the saving or dissaving target reflected by the CAB.
Chile’s largest sources of government cyclical volatility – i.e., the budget’s largest sensitivity to cyclical variables – are non-mining tax revenue and mining tax and transfer revenue. The business cycle reflected in the cyclical component of GDP largely determines the cyclical behavior of non-mining tax revenue, while the cyclical components of copper and molybdenum prices largely determine the cyclical behavior of mining tax and transfer revenue.
Chile’s government spending, compared to other OECD countries, is relatively
insensitive to the business cycle because of the small size of automatic stabilizers on the expenditure side, such as government-financed unemployment benefits or institutionalized public employment programs during cyclical downturns. Hence the fiscal rule distinguishes between actual and cyclically-adjusted government revenue but not between actual and cyclically-adjusted government expenditure.
The fiscal rule is represented by the following equation for the cyclical component of the government balance, i.e., the difference between the CAB and the actual balance of the central government. This difference boils down to the difference between cyclically-adjusted and actual government revenue, determined by the difference between cyclically-adjusted and actual non-mining tax revenue and social security receipts (driven by the output gap) and the differences between cyclically-adjusted and actual private mining tax revenue, CODELCO (the government-owned copper corporation) copper transfers to the budget, and CODELCO molybdenum transfers to the budget: 3
2 The rule is only partly consistent with a permanent-income approach, namely making government spending consistent with cyclically-adjusted government revenue. Therefore other sources of differences between temporary and permanent revenue – like temporary changes in taxes or interest rates – are not considered in adjusted revenue estimations due to political and economic difficulties in doing so. This partial approach to permanent revenue estimation, limited to cyclical adjustments of government revenue and balance, is adopted by all other countries that compute adjust government accounts or adopt fiscal rules to account for temporary deviations of relevant budget variables. 3 Tax revenue from private mining companies comprises income taxes and royalty payments. Transfers from public mining company CODELCO comprise income taxes, royalty payments, and payments of dividends. Copper dominates molybdenum revenue by far.

14
(1) B*
t - Bt = (Rt
* -Gt )- (Rt -Gt ) =
= NMTRt
* - NMTRt + MTRt
* - MTRt +CRt
* -CRt + MRt
* - MRt
where:
cyclically-adjusted central government balance (CAB)
actual central government balance
cyclically-adjusted central government revenue
actual central government revenue
actual central government expenditure
net non-mining tax revenue and social security receipts
NMTR* = cyclically-adjusted net non-mining tax revenue and social security receipts
actual tax revenue from private mining companies
cyclically-adjusted tax revenue from private mining companies
actual transfers from CODELCO copper production
cyclically-adjusted transfers from CODELCO copper production
actual transfers from CODELCO molybdenum production
cyclically-adjusted transfers from CODELCO molybdenum production
t = time period subscript. Simple reordering of the identity part of equation (1) shows that the fiscal rule boils down to limit actual government spending to cyclically-adjusted revenue net of the CAB:
(2) Gt = Rt
* - Bt
*
Cyclically-adjusted – i.e. trend or long-term – variables are non-observable and
therefore their estimates are required for implementation of the fiscal rule. As discussed above, forecasts for GDP growth and copper prices – the key variables for budgeting next year’s and future trend revenue receipts – are outsourced on a yearly basis to two advisory committees (ACTG and ACRCP) in preparation of the budget law submitted to congress. Implementation of fiscal policy during the subsequent budget (i.e., calendar) year abides by the fiscal rule and the budget law. There are three key elasticities in the fiscal rule. The first is the output gap elasticity of non-mining tax revenue. Until 2008, the Ministry of Finance (MoF) set this parameter at 1.05, which implicitly assumes that non-mining government revenue varies almost proportionately with GDP. This aggregate elasticity was replaced in 2009 by separate elasticities for different categories of tax revenue, varying between 1.0 and 2.4 (Rodriguez et al. 2009, Velasco et al., 2010). The Advisory Committee on Fiscal Policy (2011) recommended maintaining for now
*
tB
tB
*
tR
tR
tG
tNMTR
tMTR
*
tMTR
tCR
*
tCR
tMR
*
tMR

15
the latter set of elasticities (except one) but encouraged the MoF to engage in systematic revision of elasticities based on a distinction between cyclical and long-term elasticities.
The second and third key elasticities are the copper and molybdenum price elasticities of the three mining revenue items in equation (1). There are no explicit values attached by the MoF to the latter elasticities. Instead, the Budget Office of the Ministry of Finance (DIPRES) produces annual estimates for mining tax and transfer receipts at actual and trend prices for both minerals. Rule Implementation, Changes, and Budget Performance
Now let’s turn to how the rule was implemented, the changes that were introduced to
its definition and implementation, and the budget performance under the rule.
While the fiscal rule has been in place since January 2001, several institutional and methodological amendments were introduced subsequently (Velasco et al. 2010, Advisory Committee 2011). During the initial phase, the following refinements were introduced:
First Advisory Committee for Trend GDP (ACTG) of the MoF is invited to submit trend growth projections (August 2001).
Methodology for CAB is published (Marcel et al., 2001) (September 2001).
First Advisory Committee for the Reference Copper Price (ACRCP) of the MOF is invited to submit long-term copper price projections (August 2004).
Government statistics are changed from cash basis to accrual basis, following the 2001 IMF methodology (February 2004). The following methodological changes were introduced to the fiscal rule on the
treatment of mining revenue:
Inclusion of cyclical adjustment of private mining tax revenue (August 2005).
Inclusion of cyclical adjustment of the revenue paid by CODELCO based on MoF estimates of the cyclical component of the price of molybdenum (December 2005).
Inclusion of cyclical adjustment of the new royalty tax on mining ((January 2006).
Inclusion of cyclical adjustment of the additional tax on mining (December 2006).
Amendment to the cyclical adjustment of the royalty tax on mining, considering monthly provisional payments (December 2007).
The following changes were introduced to the fiscal rule, extending the principle of
cyclical adjustment to other variables (beyond GDP and prices of minerals) and to temporary tax changes:
Inclusion of cyclical adjustment of interest receipts on government financial assets (September 2008).
Inclusion of adjustments to non-mining tax revenue considering temporary tax cuts (January 2009).
Inclusion of cyclical adjustment of operational income and property income on non-financial government assets (January 2010).
16
On advice of the Advisory Committee on Fiscal Policy (2010, 2011), the three latter changes were reverted by the government in 2010 in preparing the budget for 2011. Therefore the 2008-2010 attempts to extend the fiscal rule from a CAB rule to a structural rule based on an estimate of permanent government income – introducing adjustments to all variables with temporary components, including tax rates and government incoeme from fijancial and non-financial assets – was reverted to the methodology used for rule during 2001-2007. Following international best practice adopted by individual countries and endorsed by the OECD, the IMF, and the European Commission (Ter-Minassian 2010), Chile’s fiscal rule is limited to cyclical adjustments. Therefore, in contrast to most other countries, the rule adjusts for the cyclical component of GDP and Chile’s key commodity prices: copper and molybdenum.
As discussed above, the independent Advisory Committee for Trend GDP (ACTG) of
the MoF provides annual growth forecasts (5 years ahead) for production factors, used subsequently by the MoF to generate potential GDP growth and output gap projections.4 The most recent (September) potential GDP growth and output gap projections by the MoF – based in part on Committee input projections – are reported in Fig. 3. The latter forecasts for future variables determine the resource envelope for the 2012 budget. Note that the latter figures are ex post (September 2011) estimates of Chile’s current and past output gap estimates and hence are not the actual output gap estimates used in implementing the fiscal rule in previous years (2001-2010).
In contrast to the previous figure, Figure 4 depicts, for any given year, that year’s actual
GDP growth and that year’s trend GDP growth forecast made by the ACTG, i.e., that year’s medium-term GDP growth forecast for the next 5 years (from years t to t+4), as well as actual growth. A significant gap between high Committee growth forecasts and low actual average future growth rates is observed between 2005 to 2009. This has implied, as time has passed, a significant upward correction of output gap estimates and hence a downward correction of budgeted government expenditure, i.e., ceteris paribus, a contractionary fiscal policy. The second committee, i.e., the independent Advisory Committee for the Reference Copper Price (ACRCP)of the MOF, provides a point estimate for the average world (London Metal Exchange) copper price over the subsequent decade. Fig. 5 shows, for any given year, that year’s actual copper price and that year’s long-term copper price forecast submitted by the ACRCP, as well as the actual copper price. A significant gap between low ommittee long-ternm copper price forecasts and high actual average future copper prices developed since 2002 but has narrowed in recent years. This has implied, as time has passed, a significant upward correction of the long-term copper price and hence an upward correction of budgeted government expenditure, i.e., ceteris paribus, an expansionary fiscal policy.
4 The projection method and the variables projected by the Committee have been refined over the years. The most recent MoF actual and potential growth methodology (Ministerio de Hacienda 2009a) is based on a simple Solow-type growth decomposition equation, based on a Cobb-Douglas Harrod-neutral production function, with capital services (capital stock adjusted by utilization), labor services (hours worked adjusted by educational attainment of the labor force), and residual total factor productivity. Trend growth is generated by filtering actual growth projections. It is important to note that the MoF – not the independent Committee – estimates the levels of actual and trend output and hence the output gap, which is the key variable for forecasting non-mining tax revenue.
17
How much do current observations of GDP growth and the copper price influence committees’ forecasts? Significantly for copper prices but not significantly for GDP growth, when using contemporaneous values. However, when using lagged vales, the correlations exceed 0.80. This suggests that last year’s realizations influence significantly and strongly trend GDP and long-term copper price forecast. A key policy variable of the fiscal rule is the target value for the CAB (B*). For the first seven years of the fiscal rule, the CAB was set at a positive 1% of GDP. The rationale behind this very conservative fiscal policy was the need for positive central government saving to finance government pension liabilities and recapitalize the Central Bank of Chile (CBC) and finance several government contingent liabilities, including the government pension subsidy. For 2008 the CAB was lowered to 0.5% of GDP, based on recommendations of fiscal sustainability studies (Engel et al. 2007, Velasco et al. 2007). Facing in January 2009 a domestic recession due to the international crisis, the CAB was further reduced to zero (0% of GDP) CAB for 2009. Yet the two latter figures were based on the methodological changes introduced between September 2008 and January 2010, which were reverted subsequently.
Using the current methodology for the fiscal rule (returning to the principles applied between 2001 and 2007), the actual CAB ratio was -0.6% of GDP in 2008 and -3.0% of GDP in 2009. The new 2010 administration prepared a medium-term fiscal policy framework that implies a gradual correction of the large negative CAB recorded in 2009. The CAB was set at -2.0% of GDP in 2010 and -1.8% of GDP in 2011. The current administration is committed to further fiscal adjustment toward attaining a CAB ratio of -1.0% of GDP in 2014. Fig. 6 depicts the CAB ratio to GDP, the actual balance ratio to GDP, and their difference (the cyclical balance ratio to GDP) during the 1990s (without a fiscal rule) and the 2000s (with the fiscal rule in place). 5 The data supports the following policy conclusions:
(i) cyclical shocks to the government budget (reflected by the cyclical balance ratio to GDP) are very large,
(ii) cyclical shocks to the budget are dominated by the volatility of copper prices, not by the volatility of GDP, as reflected by the larger magnitude of cyclical components (largely driven by copper price shocks) recorded in 2001-2010,
(iii) the fiscal rule allows for large government saving flows during cyclical booms, (iv) even without a fiscal rule, fiscal policy was conservative during most of the 1990s, (v) the fiscal rule provides insufficient space for a stronger counter-cyclical policy
during domestic cyclical downturns (the 1998 and 2009 recessions), leading to significant downward adjustments of the CAB. In 2008 the fiscal rule was effectively suspended by substituting the 0.5% ex-ante CAB ratio to GDP by a -0.6% ex-post CAB ratio to GDP, reduced further to a -3.0% ex-post CAB ratio to GDP in 2009.
Figures 7 and 8 depict the behavior of government revenue and expenditure ratios to GDP and growth rates during the 1990s (without a fiscal rule) and the 2000s (under the fiscal rule). Government revenue reflects the cycles of GDP and, more strongly, of copper prices.
5 In the absence of a fiscal rule during 1990-2000, the CAB and cyclical balance ratios depicted in Figure 6 for the
latter years are counter-factual estimations based on the fiscal rule methodology applied since 2001.

18
The upward correction in long-term copper price forecasts (dominating the downward correction in trend GDP forecasts) and the downward adjustment in CAB targets explain the large rise of government expenditure growth, from 1.6% in 2003 to 17.8% in 2009. The average government spending increase attained 10% during the Bachelet administration (2006-2009), when GDP growth averaged only 2.7%. This large fiscal expansion led to a 24.8% share of government expenditure to GDP in 2009, the largest ratio of government spending to GDP recorded in Chile in several decades. The current administration’s commitment to raise gradually the CAB toward -1.0% in 2014, is likely to entail government expenditure growth below GDP growth, hence reducing the share of government spending in GDP, as observed in 2010. Figure 9 shows the mining and non-mining component of government revenue since 2005, reflecting the large volatility of mining revenue due to mineral price volatility. Finally I report simple correlations between budget variables and GDP growth, and between budget variables and the price of copper for 1990-2010 and sub-periods before and during the fiscal rule. The data in Table 3 reflect:
(i) a large rise in the correlation between the price of copper and overall government revenue in the 2000s, due to the rising volatility of copper prices observed in the 2000s,
(ii) a large increase in the correlation (using quarterly data) between the price of copper and the actual government balance,
(iii) a reversal of a large negative correlation between the price of copper and net government assets (at -0.4 in the 1990s) to a large positive correlation between the two latter variables (at +0.9 in the 2000s).
The latter results suggest that adoption of the fiscal rule has made a difference for fiscal
policy in Chile: a copper price shock is more likely to be saved and reflected in higher government assets since 2001 than before the fiscal rule was adopted.
Chile’s conservative fiscal stance, reflected in government surpluses or low deficits, has
led to a massive improvement in the country’s fiscal strength. Net government assets have increased from -23% of GDP in 1990 to 8% of GDP in 2010 due to government debt repayment and accumulation of assets, in particular, SWF investments (Figure 10). Moreover, since the start of the fiscal rule, net government assets are strongly pro-cyclical, moving with the cyclical components of GDP and the price of copper.
This improvement in the government’s financial position has contributed to a
significant reduction in country risk. The sovereign risk spreads of government external debt has declined from 175 bp in 1990 (when the first issuance of government debt in many years took place) to 129 bp in 2010. The same trend improvement is reflected by the International Country Risk Guide measure for Chile (Figure 11). Evaluation of the Fiscal Rule and its Macroeconomic Impact Several studies have provided qualitative arguments or quantitative estimates about the fiscal policy benefits and macroeconomic effects of Chile’s fiscal rule. The main fiscal policy
19
consequences of the CAB rule, which implies an a-cyclical government expenditure path, have been the following:
(1) a reduction of pro-cyclical bias in fiscal policy, de-linking government expenditure from cyclical shocks and strengthening the role of government saving in buffering cyclical shocks (Larraín and Parro 2006, Rodríguez et al. 2006, Kumhof and Laxton 2009, Velasco et al. 2010, Frankel 2010, Marcel 2010, IMF (2010), Ter-Minassian 2010, Schmidt-Hebbel 2010, OECD 2010, Schmidt-Hebbel 2011);
(2) gains in fiscal sustainability and credibility, reflected in lower sovereign risk premiums (Fiess 2004, Larraín and Parro 2006, Lefort 2006, Rodríguez et al. 2006, Kumhof and Laxton 2009, Velasco et al. 2010, Marcel 2010, IMF (2010), Ter-Minassian 2010, Schmidt-Hebbel 2010, OECD 2010, Schmidt-Hebbel 2011).
Simulation studies for Chile’s fiscal rule show that:
(1) the rule performs well if the policymaker puts a small weight on output volatility
relative to inflation volatility in his objective function and a more aggressive counter-
cyclical fiscal rule can attain a lower output volatility, but at the cost of a higher
volatility in fiscal variables and in inflation (Kumhof and Laxton 2009, using a DSGE
model for Chile);
(2) the efficiency frontier derived from counter-cyclical government spending dominates the frontier attainable when spending is cyclically neutral, like it is under the current fiscal rule. The major welfare gain of a counter-cyclical rule is due to lower output volatility, while spending volatility rises (García 2011, using a DSGE model for Chile);
(3) government spending volatility is increased by a broader government objective function that puts a positive weight on counter-cyclical spending and is lowered by a broader government objective function that puts a negative weight on large changes in government spending (Advisory Committee on Fiscal Policy 2011, using a generalized government objective function in partial equilibrium).
Other studies argue that the rule has implied or have measured the following
macroeconomic effects of the fiscal rule:
(1) generally, lower macroeconomic uncertainty and volatility (Fiess 2004, Larraín and Parro 2006, Rodríguez et al. 2006, Kumhof and Laxton 2009, Velasco et al. 2010, Marcel 2010, IMF (2010), Ter-Minassian 2010, Schmidt-Hebbel 2010, OECD 2010);
(2) a reduction in GDP volatility (Larraín and Parro 2006, Schmidt-Hebbel 2011);
(3) lower interest-rate volatility (Rodríguez et al. 2006);
(4) lower exchange-rate volatility and less RER appreciation during booms (Velasco et al. 2010);

20
(5) less dependence on foreign financing during downturns (Rodríguez et al. 2006, Velasco et al. 2010);
(6) better protection of social spending during cyclical downturns (Rodríguez et al. 2006,
Velasco et al. 2010), and,
(7) an unexpected copper-price shock in 2001-2010 (with the fiscal rule in place) leads to a rise in government saving, a decline in the sovereign risk premium, and higher GDP growth, all in contrast to the pre-rule 1990-2000 period (Schmidt-Hebbel 2011).
3.3 Government Assets, Sovereign Wealth Funds, and Net Foreign Assets
Chile’s conservative fiscal policy applied since the mid 1980s has been reflected in a trend decline of government liabilities and a trend rise in government assets. Over the business and copper price cycles, government assets and liabilities exhibit a cyclical pattern that reflects operation of the counter-cyclical fiscal rule. A weak form of a fiscal rule to save copper price windfalls in Chile was in place since the 1980s, with government copper windfalls were saved in a Copper Revenue Compensation Fund (CRCF), from which resources where drawn when needed during copper price downturns. However, the rule and institutional set-up of this rule were weak and under the discretion of each government. Resources saved in the CRCF and other government foreign assets added up to US$ 637 m. in December 2000 (equivalent to 0.3% of 2000 GDP), just before the January 2001 start of the formal fiscal rule. Subsequent government deficits in 2001-2003 were reflected in issues of government debt and withdrawals from the government’s foreign assets, which fell to US$ 304 m. or 0.1% of GDP in late 2003. The CRCF was abolished with the start of the two SWFs, as mandated by the 2006 Fiscal Responsibility Law. Subsequent government surpluses were saved abroad according to the rules by the latter law set for savings into and withdrawals from the two funds, discussed above. Table 5 reports outstanding gross foreign assets in 2000-2010 saved in the CRCF, the two SWFs, and other assets of the government. Figure 12 depicts the evolution of government foreign assets held in CRCF, ESSF, and PRF during the last decade. Large government surpluses were accumulated into the two sovereign wealth funds in 2007-08, while the government deficit observed in 2009 led to significant withdrawal from the ESSF. At the end of 2010, US$ 16.6 b. were held at the SWFs, equivalent to 8% of GDP. Since March 2007, foreign investments of the two sovereign wealth funds are managed by the Central Bank of Chile. The investment policy is defined by MoF, on recommendations issued by the Advisory Financial Committee for Fiscal Responsibility Funds (AFCFRF). The funds’ portfolio has been invested to date in low-risk, short-maturity financial instruments: 30% in money-market instruments, 66.5% in non-indexed investment-grade sovereign bonds, and 3.5% in inflation-indexed investment-grade sovereign bonds. The currency composition is 50% in US$, 40% in euro and 10% in yen-denominated instruments.

21
The AFCFRF recommended in 2007 a change in portfolio composition toward higher yield instruments for both funds. But at the start of the global financial crisis, the Committee decided to reverse its previous recommendation. With the recovery in world financial markets, the Committee again recommended in August 2009 to diversify the portfolio towards higher-yield investments, but now limiting its recommendation to the PRF. 6 Figure 13 depicts the current portfolio composition and the recommended portfolio composition for the PRF, which opens up investment to investment-grade corporate bonds (20%) and equity (15%). Implementation of this recommendation is expected to take place in 2012. The rates of return of both sovereign funds are closely aligned to international fixed-income securities. Compared to other sovereign wealth funds that invest in variable income assets, Chile’s returns have been less volatile, avoiding the world-wide swings in variable-income asset returns observed since 2007 (Table 6). Chile’s average 2007-10 return of 5.1% compares favorably to the average returns of eight other sovereign wealth funds, which range from -0.6% (Ireland) to 9.8% (Australia). Yet for medium to longer-term investment periods, diversification toward variable-income assets should bring longer-maturity funds closer to the investment efficiency frontier. 3.4 Shortcomings of Chile’s Fiscal Policy Framework and Proposals for Reform By and large, Chile’s fiscal rule has proven to be a successful instrument for strengthening fiscal sustainability, reducing the pro-cyclical bias in fiscal policy and spending, contributing to macroeconomic stability, and strengthening the political economy of fiscal policy. Yet several shortcomings are still observed in the design and implementation of the fiscal rule, and in Chile’s institutional framework that governs fiscal policy. Hence the Minister of Finance of the new Piñera administration, Felipe Larraín, convened an “Advisory Committee for the Design of a Fiscal Policy based on a Second-Generation Structural Balance or Chile” to assess shortcomings and propose reforms of the rule and fiscal institutions. The Advisory Committee was formed in May 2010 and met through January 2011, delivering a preliminary report in August 2010 (Advisory Committee 2010) and a final report in January 2011 (Advisory Committee 2011). Next I summarize the main recommendations made by the Committee.
The Committee made the following recommendations on the general methodology of
the fiscal rule:
(1) Define a rule based on the definition of the cyclically-adjusted balance (CAB), limited to cyclical adjustments in revenue due to cyclical shocks of GDP and world prices of copper and molybdenum, without considering other sources of deviations of current revenue from permanent revenue. As discussed above, this recommendation has already been applied since 2010, reverting the changes in the rule that were introduced between late 2008 and early 2010.
6 The reason for this is that PRF has a long-term investment horizon, consistent with the long-term pension liabilities of the government, while the ESSF has a short-term investment horizon, consistent with the cyclical frequency of the average Chilean business and international copper price cycles.

22
(2) Supplement the rule of the CAB with an expenditure component that allows for an ex-ante counter-cyclical policy. This expenditure component could be a negative function of the ex-ante projected output gap.
(3) Supplement the rule with a partial-adjustment mechanism for expenditure in response to large changes in the projections of trend GDP growth and long-term copper and molybdenum prices, in order to avoid large changes in expenditure like those observed in 2006-2009.
(4) Define ex-ante escape clauses to the rule, which apply in exceptional circumstances that require an exceptional fiscal expansion or adjustment that is not feasible to implement without a temporary suspension of the rule. Invocation of such clauses would avoid de facto suspension or ad hoc modification of the rule, like those implemented in 2008-2009. Invocation of an escape clause would proceed under pre-defined conditions and would require a policy commitment to converge back to full application of the rule in a reasonable time horizon.
(5) For operational reasons, maintain institutional coverage of the rule to the CAB of the consolidated central government level, i.e., avoid extending the rule to the general government. However, complement the rule with measures to prevent the risk of quasi-fiscal operations in support of decentralized government agencies, public enterprises, and municipalities.
(6) Maintain the rule for the overall or aggregate balance of the central government (without adjusting for interest payments on government financial assets and liabilities) in the short term. However, after a transition period in which both balance measures (overall and primary balance) should be calculated and reported, define the rule for the primary balance of the central government. This option has the following benefits: (i) it avoids the effect of temporary changes in interest rates on the CAB, (ii) it eliminates the pro-cyclical bias caused by the accumulation into and withdrawal from net financial assets, and (iii) it links the balance measures with the standard analysis of long-term fiscal sustainability.
(7) Choose a target level for the CAB determined by long-term fiscal solvency objectives. This requires engaging in systematic assessments of the values of contingent liabilities of the government (pensions, health, education, etc.) over time. Similar studies should be devoted to the time profile of government assets (such as the decline in mining assets of state company CODELCO).
The Committee made the following recommendations on the methodology for
estimating the cyclically-adjusted revenue associated to GDP and the methods for estimating trend GDP:
1. Maintain the role of the Advisory Committee for Trend GDP (ACTG) but extend the
minutes of the Committee to include explicitly its estimates for the level of trend GDP and the corresponding output gap measure.
2. Maintain the revenue elasticities to GDP at the values presented in Velasco et al. (2010), except the GDP elasticity of health insurance contributions, set at 1.17.
3. Avoid any cyclical adjustments to revenues and to the CAB due to temporary tax measures, except for provisional payments of taxes that shift resources between years.

23
On the methodology for forecasting the cyclically-adjusted revenue associated to mining prices and the methods for estimating long-term prices of copper and molybdenum, the Committee made the following recommendations:
1. Maintain the role of the Advisory Committee for the Reference Copper Price
(ACRCP) but provide the members of the Committee with better information on world copper markets and prices.
2. Delegate preparation of molybdenum trend price forecasts (which are now prepared by the Budget Directorate) to ACRCP, Cochilco (the government copper analysis agency) or a new Advisory Committee for the Long-term Molybdenum Price.
3. Simplify and publish the calculation of the cyclically-adjusted mining revenue, possibly in line with the suggestions offered by IMF (2010).
Regarding the institutional framework, international best practice in recent years
suggests that fiscal policies and the adoption of fiscal rules are strengthened by the establishment of agencies that audit fiscal projections, assess the achievement of fiscal policy objectives, and promote policy transparency. In this regard, the Committee recommended adoption of a Fiscal Council (FC) with a mandate and tasks defined by a statutory law, supported by council members, staff, and consultants. The FC’s main task would comprise:
(1) assessing the methodology of the fiscal rule, (2) providing binding assumptions and projections for the cyclical adjustment,
variables, required to estimate the CAB, based on the forecasts made by ACTG and ACRPC,
(3) evaluating fiscal policy, including implementation of the fiscal rule and the sustainability of medium and long-term fiscal policy,
(4) issuing a technical report on any changes in accounting principles and methodologies used in preparation of the budget,
(5) evaluating the relevance of invoking escape clauses and the convergence strategy to the target level of the CAB, and
(6) expressing a position on the government’s report on contingent liabilities and the impact of the latter on the CAB target.
Finally, the Committee made recommendations to strengthen transparency,
accountability, and consistency of fiscal policy in Chile, among which the following are the most important:
1. Communicate publicly any changes in the methodology used in calculating the CAB
before their adoption, 2. Establish as legal requirement the convening of both ACTG and ACRPC and the
publication of the minutes of their meetings, 3. Improve publication of information required in replicating or checking fiscal,
macroeconomic, and mining-revenue calculations for the CAB, 4. Provide more detailed information in the annual presentation of medium-term
financial projections for the budget, 5. Establish as legal requirement the publication of the Annual Report of Public Sector
Financial Management and updating of fiscal projections, including assessment of expected budgetary deviations and discussion of actions for corrections,

24
6. Expand the coverage of information provided in the Annual Report on Contingent Liabilities,
7. Establish as legal requirement the regular delivery of actuarial long-term fiscal projections, and
8. Improve assessment and information provided in the financial reports of new laws.
4. NORWAY’S FISCAL POLICY INSTITUTIONS AND OUTCOMES Norway, one of the world’s richest countries, started oil production in 1971 and became an increasingly important oil exporter in the 1980s and 1990s. Prudent and transparent management of government oil rents is a major component of Norway’s fiscal policy framework, which targets both cyclical stabilization and inter-generational equity as key policy objectives. In the following I describe Norway’s institutional framework of fiscal policy, its fiscal rule and performance, and the government’s SWFs. 4.1 Institutional Framework for Fiscal Policy Norway’s oil production has grown exponentially since the mid 1990s and peaked at 250 m. scm in the mid 2000s. Future oil production is projected to decline over the next decades as current reserves are depleted, although production from existing and still undiscovered oil resources will retard full depletion of all oil resources (Figure 14).
As early as 1990 Norway’s parliament passed a law establishing the Government Petroleum Fund to invest part of the government’s oil rents in financial assets. Norway’s oil revenues in the 1990s were substantially higher than projected, resulting in large capital transfers from the government to the GPF. This partly unexpected rise in government financial wealth raised the issue of government use of the Fund’s return for financing a large future increase in long-term government pensions and health expenditure. In 2001 the government implemented a major overhaul of its fiscal policy framework, based on a sophisticated but simple fiscal rule that has been in place for the last decade. The 2001 guidelines for Norway’s new fiscal policy framework are geared toward three major objectives (following closely Norwegian Ministry of Finance 2001):
i) Macroeconomic stability. Fiscal policy should contribute to economic stability, avoiding pronounced cyclical fluctuations.
ii) Sustainable fiscal policy and intergenerational equity. Fiscal policy should be
sustainable over time to avoid the need for major policy shifts that weaken the provision of public services. Hence government budgets should show substantial surpluses over the next years, with sizeable transfers to the GPF. However, over time oil revenues will decline while government spending on pensions and health care will increase.
iii) Resource use efficiency. Economic policy should contribute to the efficient use of
resources in both public and private sectors. Long-term welfare are not determined primarily by oil revenue but by the size and skill of the labor force and the level of
25
resource efficiency. Fiscal policy should also support efficient functioning of the economy.
To attain the latter objectives, Norway’s fiscal policy framework is based on three
pillars for the conduct of fiscal policy:
1. Intergenerational sharing of the oil wealth by its transformation from oil in the ground into a diversified portfolio of financial investments in world capital markets through Norway’s SWF.
2. Sustainable annual withdrawal from the SWF’s investments at its expected long-term (imputed) 4% real rate of return, transferred to the government budget.
3. A structural fiscal rule, consistent with permanent-income behavior, that targets a cyclically-adjusted non-oil government deficit, financed by an average 4% SWF transfer to the budget. Annual deviations of the latter transfer from the 4% return rule are allowed for further discretionary government spending geared at counter-cyclical stabilization and expenditure smoothing, as discussed below.
Projections of the structural non-oil budget deficit are presented to parliament and the
public in budget documents that are published twice a year, on occasion of submission of the National Budget in October and the Revised National Budget in May of each year. Therefore Norway’s institutional framework for fiscal policy is based on a fiscal rule, a sovereign wealth fund for investment of oil rents, and full integration of the fund into the government’s annual budget. I discuss the latter components and their performance in more detail next. 4.2 Fiscal Rule
Norway’s fiscal rule for the non-oil budget is based on the distinction between actual and cyclically-adjusted projections for the following key budget items: tax revenue, excise duty revenue, transfers from the central bank (Norges Bank), the central government’s net interest payments, and unemployment benefit payments. Over the business cycle, government expenditure (other than on net interest payments and unemployment benefits) is determined by projected levels of cyclically-adjusted government tax and non-tax revenue plus an imputed 4% real return on GPFG investments.
The 2001 fiscal policy guidelines do not require that spending to be strictly limited to the ceiling imposed by the 4% real return on GPFG every year. On the contrary, fiscal policy is expected to contribute to short-term stabilization of the economy by making use of discretionary government spending. Therefore the Norwegian fiscal rule allows fiscal policy to play a counter-cyclical role that goes well beyond a strict structural or cyclically-adjusted income rule (like Chile’s a-cyclical spending rule). In contrast to Chile, Norway’s government budget allows for less (more) government expenditure growth during the expansionary (contracting) phase of the business cycle, when projected output gaps are positive (negative).
In addition (and also in contrast to Chile), Norway’s rule also allows for government
26
spending growth to be smoothened over several years when the market value of GPFG investments suffers large changes. The latter provision reduces government expenditure volatility induced by large changes in the 4% real investment return that accrues to the budget when world capital markets exhibit large swings, like those observed in the last 5 years.
In sum, Norway’s fiscal rule implies that government spending is determined by:
(a) trend values of government tax and excise duty revenue and Norges Bank transfers to the budget; less trend values of unemployment benefit payments and of net interest payments by the central government; less government transfers; and plus the 4% real return on GPFG investments,
(b) additional spending (positive or negative) determined by discretionary fiscal policy for counter-cyclical stabilization, and
(c) additional spending (positive or negative) determined by discretionary fiscal policy to avoid excessive spending volatility induced by large swings in market value of GPFG investments.
Finally, the calculation of estimations and projections of structural government
revenues from taxes and excise duties is based on the time-series behavior of actual taxes and excise duties, extended by projections for their relevant cyclical determinants. Calculations are carried out as follows:
(i) Reported tax and excise duty items are adjusted for the estimated impact of any discretionary measures (i.e. changes in rates and/or delimitation of tax bases), as published at an aggregate level in annual National Budget reports. Therefore all discretionary tax rate or base changes, of a temporary or permanent nature, are reflected in structural and cyclically-adjusted revenue items alike.
(ii) A preliminary cyclical adjustment of the various tax and excise duty items are based on the percentage deviation between actual and trend levels of relevant cyclical indicators, using the Hodrick-Prescott filter. For example, national account figures on employment are used to adjust personal taxes and payroll taxes. A weighted indicator of private consumption and sales in the construction industry is used to adjust VAT revenue.
(iii) The structural level for different taxes and excise duties is calculated as the trend in the adjusted series, measured at constant prices. Separate price indices are used for the various taxes and excise duties. The cyclical components of taxes and excise duties are calculated as residuals, i.e. as the deviations between actual and trend estimations and forecasts.
4.3 Government Budget Performance Norway’s fiscal policy performance is reflected in Figure 15. Panel A of the latter figure depicts the evolution of the structural non-oil deficit and the 4% real return on GPFG investments since the start of the new fiscal framework in 2001. While both variables are clearly related, they are not identical to each other, reflecting the fact that deviations of the structural non-oil deficit – stemming from deviations of government spending due to additional discretionary spending – have been actively put in place. Indeed, the real growth rate of government spending exhibits significant annual variation. For example, real government

27
spending grew by 5.5% during the recession year 2009, while its average rate of growth was less than half the latter figure during the preceding decade (Panel B). Consistent with projected lower oil production and population ageing in the future, the increase in the use of oil revenue is projected to decline in the next 14 years (2012-2025) in comparison to the past decade (2001-2011), while pension expenditure is projected to grow more in the future than in the past (Panel C). Finally, Panel D depicts Norway’s actual consolidated government budget balance (the consolidated balance of GPFG and the non-oil government budget) during the last quarter century. The consolidated balance exhibits a full turnaround from moderate deficits in the early 1990s to attain a very large average surplus of 20% of GDP during recent years. The actual non-oil budget balance hovers around -5% of GDP since the start of Norway’s new fiscal framework adopted in 2001. The difference – the GPFG surplus – grows from close to nil in the early 1990s to more than 25% of GDP during recent years, reflecting high oil prices and a massive accumulation of GPFG funds, as discussed next. 4.4 Government’s Sovereign Wealth Fund Rules and Performance
As discussed above, Norway’s Parliament passed a law in 1990 establishing the Government Petroleum Fund (GPF) to manage the government’s oil rents. In 2006 Parliament established the Government Pension Fund, comprised by two separate sovereign wealth funds: the Government Pension Fund Global (GPFG) – the successor of GPF – and the Government Pension Fund Norway (GPFN). The renaming of GPF highlights its role in support of saving current government revenue to fund the future rise in government pension payments. However, and this is key, neither sovereign wealth fund is related to the government’s pension liabilities. The returns of both funds simply finance the structural non-oil deficit of the government, according to the above mentioned fiscal rule. The MoF regularly transfers oil revenue to GPFG – the first transfer took place in 1996. GPFG is fully integrated into the government’s budget. Therefore net allocations to GPFG reflect the total actual consolidated government budget surplus, including oil rents (as reflected in Panel D of Figure 15).
GPFG is managed by Norges Bank Investment Management (NBIM) on behalf of the Ministry of Finance. The latter determines GPFG’s investment strategies, following advice from NBIM and Parliament, among others.7 GPFG funds are fully invested in international capital markets, according to MoF guidelines. Over time, GPFG investments were allowed to be diversified away from government bonds only (1996), to include equities (1997), corporate and securitized bonds (2002), and real estate (2010); and from industrial countries only to include emerging markets (2000).
7 Ethical guidelines for GPFG investments were established in 2004. A Council on Ethics for the GPFG prepares
recommendations on whether to invest or not in particular companies, based on the ethical guidelines. Recommendations may be followed up by the Ministry of Finance. Both Council recommendations and MoF decisions are made public.
28
As of 2011, GPFG investments represent close to 275% of Norway’s GDP (Figure 16). Its portfolio is comprised by 56% invested in equity, 43% in fixed income, and nearly 0.5% in real estate. GPFG’s average annual return has been 5% during 1998-2010 (Table 7).
The second government fund, GPFN, was initially established under the name of National Insurance Scheme Fund in 1967 and its current name was adopted in 2006. Operational management of the GPFN is delegated to the National Insurance Scheme Fund (NISF).
GPFN funds are restricted to be invested in equity instruments traded in regulated markets in Norway, Denmark, Finland, and Sweden, as well as in interest-bearing instruments of issuers that are residents of Norway, Denmark, Finland, and Sweden or that have equity capital traded in regulated markets in the latter countries.
Investment guidelines established by the MoF for GPFN mandate a portfolio share of
equity (interest-bearing) instruments in the range of 50-70% (30-50%). 80-90% (10-20%) of equity (fixed-income) portfolios are to be placed in Norway (Denmark, Finland, and Sweden).8
As of 2011, GPFN investments represent close to 6% of Norway’s GDP. Its portfolio is largely comprised by bonds and shares and other equities (Figure 17). GPFN’s average annual return has been 7% in 1998-2010 (Table 7).
5. LESSONS ON FISCAL INSTITUTIONS FOR RESOURCE-RICH ECONOMIES AND OIL-EXPORTING ARAB COUNTRIES The review of the world evidence on the links between resource rents, fiscal and political institutions, and macroeconomic outcomes presented in section 2, and the more detailed review of Chile’s and Norway’s successful experience in managing their resource wealth in subsequent sections, point to significant policy lessons for RREs in general and oil-exporting Arab countries in particular. Here I limit the drawing of policy implications to those referred to fiscal policy institutions, not referring to additional inferences that can be drawn for the reform of political institutions. Adoption of a modern institutional framework for fiscal policy can make a major contribution to lessen the adverse impact of resource booms and strengthen timely and efficient use of government resources. Such a framework is instrumental for the triple goal of fiscal policy: attaining and maintaining fiscal solvency (or budgetary sustainability), contributing to macroeconomic stability, and ensuring intergenerational equity.
International experience in general and Chile’s and Norway’s successful development of sound fiscal policy frameworks since 2001 suggest lessons in four key policy areas to strengthen fiscal policy institutions and conduct in RREs and in Arab oil-exporting countries.
8 The MoF has determined a strategic benchmark portfolio which consists of 40% interest-bearing instruments
and 60% equity instruments. Ex ante relative volatility is not allowed to exceed 3 percentage points on an annualized basis.

29
The subsequent lessons apply to varying degrees to both richer, labor-importing and less rich, populous Arab oil exporters, because the divide between the two latter country groups is not clearly correlated with large differences in fiscal institutions, management of oil booms, and their macroeconomic consequences, as suggested by El-Gamal and Selim (2012). However, large country differences are observed across all 11 oil-exporting Arab countries. Therefore the relevance of the subsequent policy recommendations varies significantly from country to country. 1. Strengthening the institutional framework of fiscal policy Developing the institutional framework for fiscal policy and budget planning and execution comprises six components.
(1) Fiscal responsibility law: adopt a legal framework, specifying budgetary procedures and rules to strengthen fiscal policy transparency, accountability, and stability. Fiscal responsibility laws establish requirements for governments to state transparently their short and medium-term policy objectives, to set short and medium-term targets for fiscal flows and stocks, to provide transparent information on budget planning and execution to the legislature, to implement a fiscal policy conducive to fiscal stability and solvency, and to account ex-post for fiscal policy execution and attainment of policy objectives.
(2) Effective financial management of the budget: the core elements for efficient budgetary management by the MoF comprise granting strong powers to the MoF on legal initiatives with budgetary impact and in budget decisions regarding other ministries and government levels, commanding a high technical capacity for budgetary planning, adopting modern accounting principles, ensuring an efficient process of legislative approval of the budget that limits the possibility of congressional amendments, and developing strong capacity for monitoring budget execution.
(3) Budget planning horizon: extend budgetary planning from one-year to multi-year horizons.
(4) Fiscal policy accountability and transparency of budgetary information: both for economic efficiency and political legitimacy goals, accountability of fiscal policy and transparency in provision of information of government accounts should be improved significantly.
(5) External control and auditing: countries should strengthen external control and auditing functions of fiscal policy, budget execution, and government accounts at three levels: congress, the government’s general comptroller or auditor, and fiscal councils and committees (more on the latter below).
(6) Analysis of fiscal stance: resource-rich economies should rely on a varied set of key fiscal indicators to strengthen analysis of their fiscal stance.9
9 Villafuerte and Lopez-Murphy (2010) suggest developing and using for policy analysis the following fiscal indicators in oil-producing countries: overall fiscal balance, non-oil balance, non-oil primary balance, cyclically-

30
2. Adoption of a Fiscal Rule Adoption of a fiscal rule based on a cyclically-adjusted balance (CAB), as in Chile and Norway, and for intergenerational equity, as in Norway, is the key reform required to avoid pro-cyclical bias and pro-current generation bias in fiscal policy and government spending. While for non-commodity exporters cyclical adjustment may be limited to domestic GDP shocks, for commodity exporters it is key to add cyclical adjustments to price shocks of their commodities. Like in Chile and Norway, in resource-rich countries the largest source of government revenue volatility is price volatility of their commodity exports, not domestic GDP volatility. However, domestic GDP volatility is likely to be lowered (as is the case in Chile and Norway) by adopting a rule that accounts for both GDP and commodity price volatility. In addition, finite resource reserves require saving part of the current temporary revenue for future generations, as implemented in Norway. A successful fiscal rule will have a positive impact on the stability of government spending and government programs, fiscal policy sustainability and credibility, and overall macroeconomic stability. In order to be effective, the fiscal rule should satisfy the following conditions:
(1) Based on calculations and formulas that are relatively stable over time,
(2) Based on assumptions and calculations that should be made public, together with the relevant budgetary information, to be replicated by independent analysts, and
(3) Part of an institutional environment that supports independent or unbiased provision
of key economic and financial forecasts (such as independent committees or councils).
The actual formula of the fiscal rule will be country-specific, and so will be the budget balance for which it is defined (total or primary), the government level to which it applies (central or general government), the degree of spending a-cyclicality (as in Chile) or counter-cyclicality (as in Norway), the target level for the CAB, and the degree of inter-generational re-distribution (as in Norway, with very large re-distribution toward future generations). 3. Adoption of a SWF Fiscal rules that target CABs and re-distribute resources toward the future require a SWF where government savings are deposited cyclically (during booms and withdrawn during downturns) and permanently (for inter-generational distribution). Such funds are particularly important in commodity exporting countries, where they are typically invested in foreign-currency investments that are held abroad, as government revenue comes also in foreign-currency from the revenue obtained by commodity-exporting firms.
adjusted non-oil primary balance, and non-oil GDP as the relevant scale variable. As discussed in section 3, Norway is the paramount example of successful application of the latter concepts in its analysis and public discussion of fiscal policy performance.

31
Several RREs, including many Arab oil exporters, have established SWFs. UAE-Abu Dhabi’s SWFs add up to the largest SWF savings among all countries, states, and emirates in the world. Saudi Arabia and Kuwait also have large SWFs, followed in the Arab world (by size) by Qatar, UAE-Dubai, Libya, Algeria, Bahrain, Oman, and UAE-Ras Al Khaimah (Sovereign Wealth Fund Institute, 2012). The world’s oldest SWF (except for the US state of Texas) was established by Kuwait in 1953 and remains a model for many other SWF managers within and outside the region. According to Sovereign Wealth Fund Institute (Figure 2), transparency in corporate governance and financial management varies significantly across SWFs in the world. Among the SWFs of Arab oil-exporting countries, only UAE-Abu Dhabi’s SWFs get the world’s highest marks in transparency, together with the SWFs of Chile, Norway and a few other countries.
Corporate governance and investment policies of SWFs could be strengthened in many countries in the following dimensions:
(1) Establishing of effective and transparent corporate governance,
(2) Provision of transparent information on transfers between the budget and SWFs,
(3) Portfolio choice determined by investment strategies based on maturity concerns (determined by the nature of the fund and the length of commodity-price and GDP cycles), hedging objectives, and the government’s degree of risk aversion, and
(4) Efficient portfolio management set by transparent guidelines and closely monitored by
the government and the public. 4. Establishment of Government Committees and a Fiscal Council Specialized government or MoF committees set up with narrow tasks – such as provision of independent forecasts of key variables for the budget or a board for the SWF – and staffed by independent members is an efficient way to bring expertise and independence to the government, strengthening fiscal institutions. Moving beyond the latter committees, several industrial countries have already put in place or are starting independent fiscal councils that have broad mandates to improve the quality of fiscal policy assessment, budget planning, and monitoring its execution. To my best knowledge, no resource-rich country has started a fiscal council to date. However, they are particularly needed in countries with weaker fiscal institutions, where such councils could make a major difference. Among their tasks are the following:
(1) Evaluation and validation of financial and macroeconomic assumptions for the budget, (2) Provision of independent projections for the budget and government financial
conditions, (3) Provision of policy assessments and recommendations of budgetary corrections, (4) Advice on the stance of fiscal policy, its long-term sustainability and optimality, and its
macroeconomic effects, (5) Recommendations on policies for government asset and liability management, (6) Monitoring of budget implementation and provision of recommendations on
32
budgetary corrections when facing deviations in budget execution, and (7) Recommendations to improve fiscal transparency.
6. CONCLUSIONS Prudent and far-sighted conduct of fiscal policy is at the core of macroeconomic and development objectives geared at attaining macroeconomic and financial stability, high growth, poverty reduction, and intergenerational equity. Over the last decades, economists and policy makers alike have learned that fiscal institutions are the foundation of an effective fiscal framework that aims at the latter policy objectives. Economic history abounds with negative examples of inconsistent and inefficient design and execution of fiscal policies that lead to macroeconomic and financial crises, debt defaults, financial under-development, low growth, and inequity. A long and dismal history of fiscal mismanagement characterized most emerging economies in the past. Yet a growing number of developing economies is learning from past failures and changing radically toward better fiscal institutions and policies. In the industrial world, the opposite trend is observed in many high-income countries, reflected in current conditions that range from fiscal fragility to outright fiscal and financial crisis. The need for revamping fiscal policies and institutions is particularly acute in resource-rich economies in general and Arab oil exporters in particular. A modern fiscal policy in support of inter-generational and of pro-cyclical saving should be based on explicit recognition that natural resources are not unlimited (hence requiring saving for the future) and commodity prices are highly volatile (hence requiring saving temporary windfalls).
I have reviewed in this paper the international evidence on fiscal policies and outcomes in resource-rich economies at large and Arab oil-exporting countries in particular, which suggests that strong fiscal (and political) institutions can turn the resource curse into a blessing. Then I have turned to detailed assessment’s of Chile’s and Norway’s decade-long experience in more macroeconomic and financial stability, higher growth, and improved equity. Finally I have drawn specific reform lessons to strengthen fiscal institutions and policies for resource-rich economies and Arab oil exporters. References
Abdih, Y., P. Lopez-Murphy, A. Roitman, and R. Sahay, 2010. “The Cyclicality of Fiscal Policy in the Middle East and Central Asia: Is the Current Crisis Different?”. IMF Working Paper No. 10/68, March.
Advisory Committee on Fiscal Policy (Comité Asesor para el Diseño de una Política Fiscal de Balance Estructural de Segunda Generación para Chile), 2010. “Propuesta para Perfeccional la Regla Fiscal” (Informe Preliminar), manuscript, Ministry of Finance of Chile.
Advisory Committee on Fiscal Policy (Comité Asesor para el Diseño de una Política Fiscal de Balance Estructural de Segunda Generación para Chile Chile), 2011. “Propuesta para Perfeccional la Regla Fiscal” (Informe Final), manuscript, Ministry of Finance of Chile.
33
Advisory Committee for Trend GDP (Comité Consultivo del PIB Tendencial, agosto de 2011), 2011. “Acta Comité Consultivo PIB Tendencial”, manuscript, Ministry of Finance of Chile, several years.
Advisory Committee for the reference Copper Price (Acta del Comité Consultivo del PIB Tendencial, agosto de 2011), 2011. “Acta Comité Consultivo PIB Tendencial”, manuscript, Ministry of Finance of Chile, several years.
Advisory Committee for Sovereign Funds (Comité Asesor del Ministerio de Hacienda para los Fondos de Responsabilidad Fiscal), 2010, “Informe Anual Comité Financiero”, manuscript, Ministry of Finance of Chile.
Alesina, A., S. Ardagna, R. Perotti and F. Schiantarelli, 1999. "Fiscal Policy, Profits, and Investment," NBER Working Papers, No7207.
Alesina. A and R. Perotti, 1996. "Budget Deficits and Budget Institutions," NBER Working Papers, No. 5556.
Al Iriani, M., 2011. “Oil Curse in Yemen: The Role of Institutions and Policies”. ERF manuscript, December.
Al Sheikh, H., 2011. “Oil Curse and Labor Markets: The Case of Saudi Arabia”. ERF manuscript, December.
Bhattacharyya, S. and P. Collier, 2011. “Public Capital in Resource Rich Economies”. CSAE manuscript, August.
Bornhorst, F., S. Gupta, and J. Thornton, 2008. “Natural Resource Endowments, Governance, and the Domestic Revenue Effort: Evidence from a Panel of Countries. 2008”. IMF Working Paper No. 08/170, July.
Cáceres, C., A. Corbacho, and L. Medina, 2010. “Structural Breaks in Fiscal Performance: Did Fiscal Responsibility Laws have Anything to Do with Them?”. IMF Working Paper No. 10/248.
Calderón, C. and K. Schmidt-Hebbel, 2008. “The Choice of Fiscal Regime in the World”. Central Bank of Chile Working Paper.
Calderón, C., R. Duncan and K. Schmidt-Hebbel, 2011. "Institutions and Cyclical Properties of Macroeconomic Policies in the Global Economy," Documentos de Trabajo 372.
Calmfors, L. and S. Wren-Lewis, 2011. “What Should Fiscal Council Do?”. Discussion Paper Series University of Oxford Department of Economics.
Debrun, X., D. Hauner and M. Kumar, 2009. “Independent Fiscal Agencies”. Journal of Economic Surveys Vol. 23, No. 1.
Debrun, X. and M. S. Kumar, 2007. "The Discipline-Enhancing Role of Fiscal Institutions: Theory and Empirical Evidence," IMF Working Papers No. 171.
Eijffinnger S., Geraats P., and C. van der Cruijsen, 2006. "Does Central Bank Transparency Reduce Interest Rates?," DNB Working Papers 085.
Elbadawi, I., K. Schmidt-Hebbel, and R. Soto, 2011. “Why do Countries have Fiscal Rules?”, manuscript presented at the Conference on Economic Policy in Emerging Countries, in Honor of Vittorio Corbo, Catholic University of Chile, October 27-28, Santiago, Chile.
Elbadawi, I.A. and R. Soto, 2012. “Resource Rents, Political Institutions, and Economic Growth”. ERF manuscript, March.
El-Gamal, M. and H. Selim, 2012. “Oil Curse or Lack Thereof in the Arab World: Exploring Similarities and Differences”. Presented at the ERF Conference on Understanding and Avoiding the Resource Curse in the Arab World, Kuwait, January 15-16.
Engel, E., M. Marcel and P. Meller, 2007. “Meta Superávit Estructural: Elementos para su Análisis”.

34
Fasano, U. and Q. Wang, 2002. “Testing the Relationship between Government Spending and Revenue: Evidence from GCC Countries”. IMF Working Paper No. 02/201, November.
Fiess, N., 2004. “Chile’s Fiscal Rule”,Econometric Society 2004 Latin American Meetings 348, Econometric Society.
García, S., 2011. “Regla Fiscal Contracíclica, Análisis para Chile”. Tesis de Magister en Economía, Universidad de Chile.
Gelb, A., 2012. “Economic Diversification and the Role of Government in Resource Rich Economies”. Presented at the ERF Conference on Understanding and Avoiding the Resource Curse in the Arab World, Kuwait, January 15-16.
Geraats, P., 2008. "ECB Credibility and Transparency," European Economy - Economic Papers, 330.
Gylfason, T., 2012. “Omternational Experiences with the Management of Natural Resources”. Presented at the ERF Conference on Understanding and Avoiding the Resource Curse in the Arab World, Kuwait, January 15-16.
International Monetary Fund, 2010. “Navigating the Fiscal Challenges Ahead”. World Economic and Financial Surveys.
International Monetary Fund, 2009. “Fiscal Rules - Anchoring Expectations for Sustainable Public Finance”. Discussion Paper approved by Carlo Cottarelli, December 19.
International Budget Partnership. 2010: www.internationalbudget.org/files/OBI2010-Chile.pdf
Ilzetzki, E. and C. Vegh, 2008. "Procyclical Fiscal Policy in Developing Countries: Truth or Fiction?," NBER Working Papers, 14191.
Kumhof, M. and D. Laxton, 2009. “Chile’s Structural Fiscal Surplus Rule: A Model-Based Evaluation”. IMF Working Paper No. 09/88.
Larraín, F. and F. Parro, 2006. “Chile menos volátil”. Instituto de Economía, Pontificia Universidad Católica de Chile.
Levy, G., 2008. A Parliamentary Budget Officer for Canada. Canadian Parliamentary, Review 39.
Lienert, I., 2010. “Should Advanced Countries Adopt a Fiscal Responsibility Law?”. IMF Working Paper.
Marcel, M., 2010. La regla de balance estructural en Chile: diez años, diez lecciones. Banco Interamericano de Desarrollo.
Marcel, M., M. Tokman, R. Valdés and P. Benavides, 2001. “Balance estructural del Gobierno Central, metodología y estimaciones para Chile: 1987-2000”. Serie de Estudios de Finanzas Públicas N°1, DIPRES.
Morsy, H., 2009. “Current Account Determinants for Oil-Exporting Countries”. IMF Working Paper No. 09/28, February.
Norwegian Ministry of Finance (2011). “The National Budget 2012”. Norwegian Ministry of Finance (2010). “The Management of the Government Pension
Fund in 2010”, Report No. 15 (2010–2011) to the Storting.
Norwegian Ministry of Finance (2010). “The structural non-oil budget deficit”, Memorandum.
Norwegian Ministry of Finance (2001). “Guidelines for economic policy”, Report No. 29 (2000-2001) to the Storting.
Norwegian Petroleum Directorate (2011). “Petroleum Resources on the Norwegian Continental Shelf”.
OECD, 2010. “Economic Survey of Chile 2010: Fiscal policies for enhanced resilience

35
and equity”. OECD Economic Survey of Chile, Chapter 2. Rivlin, A. M., 2010. “Helping Politicians Face Difficult Choice. Conference on
Independent Fiscal Institutions”. Budapest, March 2010.
Rodríguez, J., C. Tokman and A. Vega, 2006. “Política de Balance Estructural: Resultados y Desafíos tras Seis Años de Aplicación en Chile”, Estudios de Finanzas Públicas, DIPRES.
Rodríguez, J., L. Escobar and M. Jorratt, 2009. “Los Ingresos Tributarios en el Contexto de la Política de Balance Estructural”. Estudios de Finanzas Públicas, DIPRES.
Salti, N., 2008. “Oil Greasing the Wheels: When Do Natural Resources Become a Blessing?”. American University of Beirut Working Paper No. 439, September.
Schmidt-Hebbel, K. 2010. “Fiscal Rules and Institutions in the World and in Chile”. Manuscript, Catholic University of Chile.
Schmidt-Hebbel, K. 2011. “Fiscal Policy for Commodity-Exporting Countries: Experience from Chile”, presented at the IMF Seminar on “Commodity Price Volatility and Inclusive Growth in LIC”, Washington, DC, September 21.
Sovereign Wealth Fund Institute, 2011. http://www.swfinstitute.org/statistics-research/linaburg-maduell-transpa- rency-index/
Sovereign Wealth Fund Institute, 2012. http://www.swfinstitute.org/fund-rankings/ , March.
Stein, E., A. Talvi and A. Grisanti. 1998. “Institutional Arrangements and Fiscal Performance: The Latin American Experience”. NBER Working Paper, N° 6358.
Suliman, K.M., 2011. “Understanding and Avoiding the oil Curse in Sudan”. ERF manuscript, December.
Ter-Minassian, T., 2010. “Preconditions for a successful introduction of structural fiscal balance-based rules in Latin America and the Caribbean: a framework paper”. Inter-American Development Bank, Discussion Paper No. IDB-DP-157.
Torvik, R. “Transparency and Accountability in Resource Rich Countries”. Presented at the ERF Conference on Understanding and Avoiding the Resource Curse in the Arab World, Kuwait, January 15-16.
Velasco, A., A. Arenas, L. Céspedes and J. Rodríguez, 2007. “Compromisos fiscales y la meta de superávit estructural”. Estudios de Finanzas Públicas, DIPRES.
Velasco, A., A. Arenas, J. Rodríguez, M. Jorrat and G. Gamboni, 2010. “El Enfoque de Balanace Estructural en la Política Fiscal en Chile: Resultados, Metodología y Aplicación al Período 2006-2009”. Estudios de Finanzas Públicas No 15.
Villafuerte, M. and P. Lopez-Murphy, 2010. “Fiscal Policy in Oil Producing Countries during the Recent Oil Price Cycle”. IMF Working Paper No. 10/28, February.
Von Hagen, J., 2005. “Political Economy of Fiscal Institutions”. GESY Discussion Paper No. 149.
Wren-Lewis, S., 2010. “Comparing the Delegation of Monetary and Fiscal Policy”. Conference on Independent Fiscal Institutions. Budapest, March 2010.
Frankel, J. 2010. “A Solution to Fiscal Procyclicality: The Structural Budget Institutions Pioneered by Chile”. Fourteenth Annual Conference of the Central Bank of Chile Fiscal Policy and Macroeconomic Performance, Santiago.
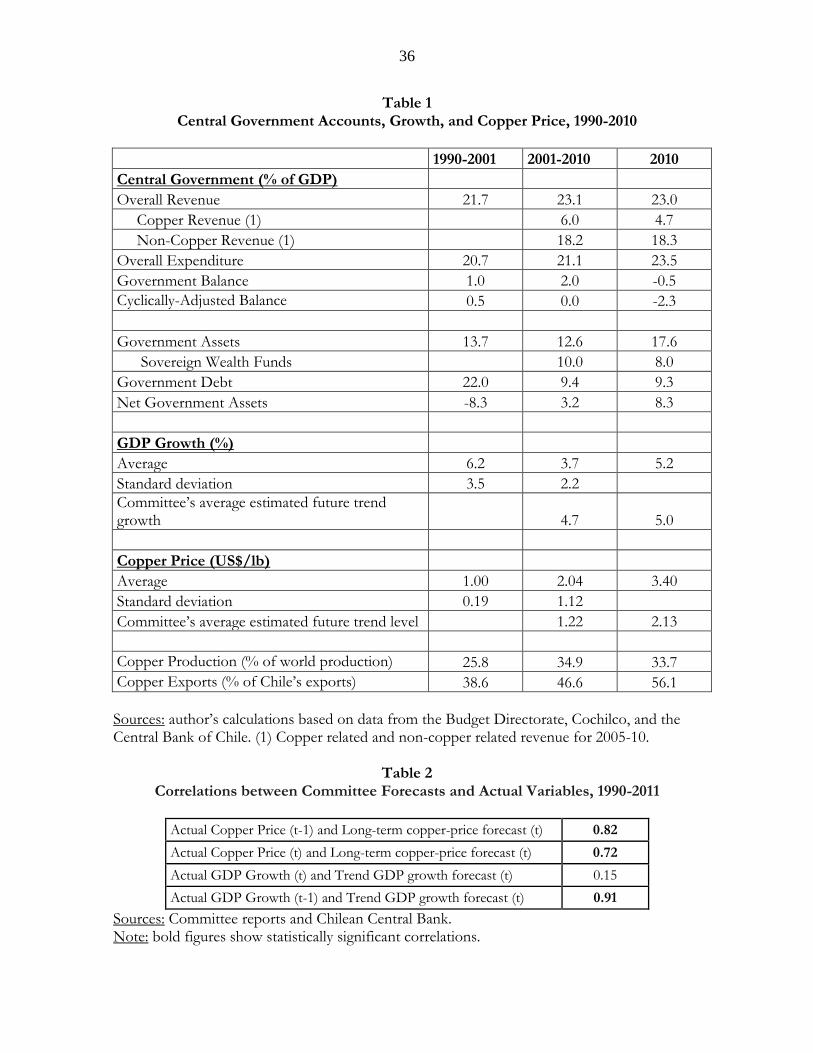
36
Table 1 Central Government Accounts, Growth, and Copper Price, 1990-2010
1990-2001 2001-2010 2010
Central Government (% of GDP)
Overall Revenue 21.7 23.1 23.0
Copper Revenue (1) 6.0 4.7
Non-Copper Revenue (1) 18.2 18.3
Overall Expenditure 20.7 21.1 23.5
Government Balance 1.0 2.0 -0.5
Cyclically-Adjusted Balance 0.5 0.0 -2.3
Government Assets 13.7 12.6 17.6
Sovereign Wealth Funds 10.0 8.0
Government Debt 22.0 9.4 9.3
Net Government Assets -8.3 3.2 8.3
GDP Growth (%)
Average 6.2 3.7 5.2
Standard deviation 3.5 2.2
Committee’s average estimated future trend growth 4.7 5.0
Copper Price (US$/lb)
Average 1.00 2.04 3.40
Standard deviation 0.19 1.12
Committee’s average estimated future trend level 1.22 2.13
Copper Production (% of world production) 25.8 34.9 33.7
Copper Exports (% of Chile’s exports) 38.6 46.6 56.1
Sources: author’s calculations based on data from the Budget Directorate, Cochilco, and the Central Bank of Chile. (1) Copper related and non-copper related revenue for 2005-10.
Table 2 Correlations between Committee Forecasts and Actual Variables, 1990-2011
Actual Copper Price (t-1) and Long-term copper-price forecast (t) 0.82
Actual Copper Price (t) and Long-term copper-price forecast (t) 0.72
Actual GDP Growth (t) and Trend GDP growth forecast (t) 0.15
Actual GDP Growth (t-1) and Trend GDP growth forecast (t) 0.91
Sources: Committee reports and Chilean Central Bank. Note: bold figures show statistically significant correlations.
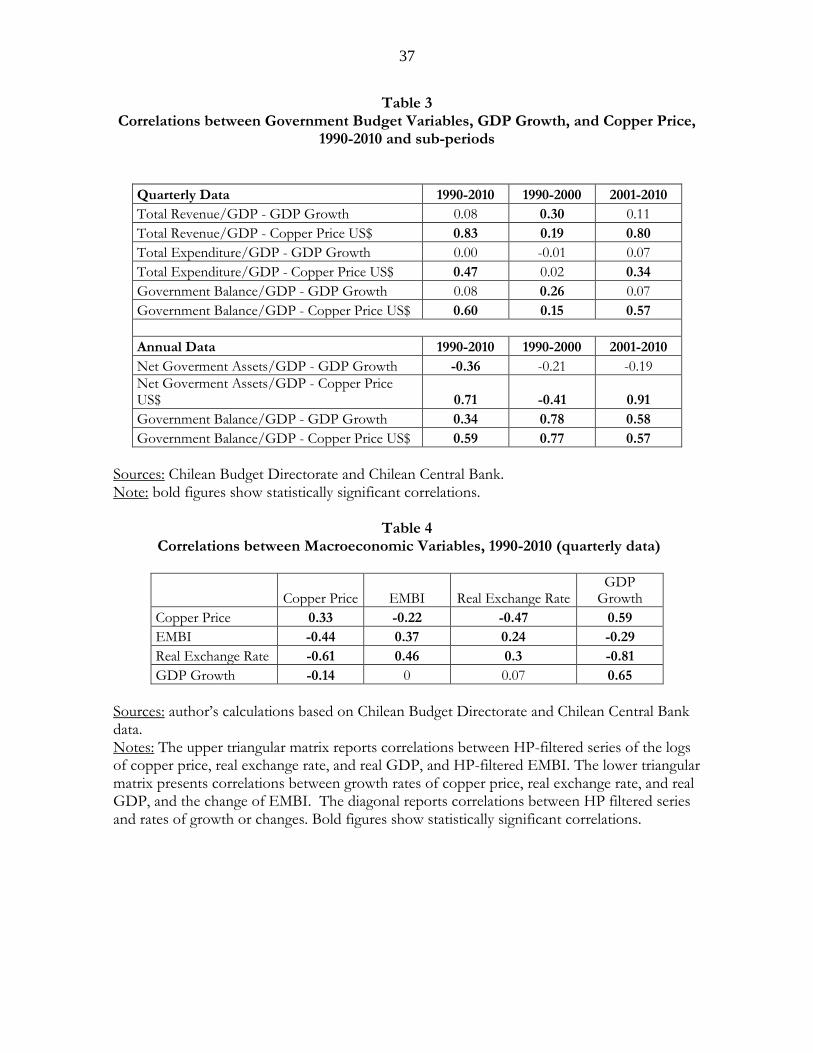
37
Table 3 Correlations between Government Budget Variables, GDP Growth, and Copper Price,
1990-2010 and sub-periods
Quarterly Data 1990-2010 1990-2000 2001-2010
Total Revenue/GDP - GDP Growth 0.08 0.30 0.11
Total Revenue/GDP - Copper Price US$ 0.83 0.19 0.80
Total Expenditure/GDP - GDP Growth 0.00 -0.01 0.07
Total Expenditure/GDP - Copper Price US$ 0.47 0.02 0.34
Government Balance/GDP - GDP Growth 0.08 0.26 0.07
Government Balance/GDP - Copper Price US$ 0.60 0.15 0.57
Annual Data 1990-2010 1990-2000 2001-2010
Net Goverment Assets/GDP - GDP Growth -0.36 -0.21 -0.19
Net Goverment Assets/GDP - Copper Price US$ 0.71 -0.41 0.91
Government Balance/GDP - GDP Growth 0.34 0.78 0.58
Government Balance/GDP - Copper Price US$ 0.59 0.77 0.57
Sources: Chilean Budget Directorate and Chilean Central Bank. Note: bold figures show statistically significant correlations.
Table 4 Correlations between Macroeconomic Variables, 1990-2010 (quarterly data)
Copper Price EMBI Real Exchange Rate GDP
Growth
Copper Price 0.33 -0.22 -0.47 0.59
EMBI -0.44 0.37 0.24 -0.29
Real Exchange Rate -0.61 0.46 0.3 -0.81
GDP Growth -0.14 0 0.07 0.65
Sources: author’s calculations based on Chilean Budget Directorate and Chilean Central Bank data. Notes: The upper triangular matrix reports correlations between HP-filtered series of the logs of copper price, real exchange rate, and real GDP, and HP-filtered EMBI. The lower triangular matrix presents correlations between growth rates of copper price, real exchange rate, and real GDP, and the change of EMBI. The diagonal reports correlations between HP filtered series and rates of growth or changes. Bold figures show statistically significant correlations.

38
Table 5 Gross Foreign Assets of the Central Government by Funds, 2000-2011 (US$ m.)
Year CRCF ESSF PRF Other Assets
Total Gross Foreign Assets
2000 673 1,237 1,910
2001 621 576 1,197
2002 277 190 467
2003 75 229 304
2004 208 683 891
2005 967 950 1,917
2006 2,564 605 7,208 10,377
2007 14,033 1,466 5,766 21,265
2008 20,211 2,507 4,884 27,602
2009 11,285 3,421 4,927 19,633
2010 12,720 3,837 5,750 22,307
Source: Ministry of Finance. Notes: CRCF is Copper Revenue Compensation Fund, ESSF is Economic and Social Stabilization Fund and PRF is Pension Reserve Fund.
Table 6
Asset Composition (%) and US$ Returns (%) of Selected Sovereign Wealth Funds, 2007-2010
Portfolio Composition US $ Return
Funds Holdings
(US$ mmm)
Type Money Market
Fixed Income
Equity Other
Investments 2007 2008 2009 2010
2007-2010
(Average)
Australia 71 P 19 19 35 27 -26.3 44 24.8 9.8
Chile 17 P/E 30 70 0 0 8.9 7.6 2.4 1.8 5.1
East Timor 15 A 1 25 53 21 20.7 -31.7 28.7 15.7 5.3
Canada 7 E 1 99 0 0 7.4 6.9 0.6 3.8 4.6
New Zealand 14 P 1 8 69 23 15.1 -44.2 48.4 24.3 4.3
Trinidad and Tobago
4 E 28 48 24 0 4.2 3.1 3 5.1 3.8
Norway 528 A 0 39 61 0 10.2 -27.2 30.8 8.8 3.4
Alaska 39 A 3 18 51 28 8.8 -24.7 18.9 11.9 2.2
Ireland 20 P 15 8 57 20 14.2 -33.3 23.6 3.8 -0.6
Source: Financial committee report (2010). Notes: Outstanding holdings at end of period. Type is defines as “S” savings, “P” pensions and “E” Stabilization. Other investments include private equity, hedge funds, commodities, and real state. Average is calculated as the geometric average.

39
Table 7 Norway: Average Rates of Return on GPGF and GPFN investment portfolios,
1998-2010 (%)
2010 2008-2010 1998-2010
GPFG
Actual Portfolio 9.60% 1.84% 5.04%
Equity Portfolio 13.34% -3.37% 4.51%
Fixed Income Portfolio 4.11% 5.22% 5.15%
GPFN
Actual Portfolio 15.27% 4.84% 7.01%
Norwegian Equity Portfolio 19.11% -1.26% 8.42%
Nordic Equity Portfolio 28.18% 0.46% 3.74%
Norwegian Fixed Income Portfolio 7.47% 8.77% 6.10%
Nordic Fixed Income Portfolio 3.65% 6.23% 5.53%
Source: “The Management of the Government Pension Fund in 2010”, Report No. 15
(2010–2011) to the Storting. Note: Annual geometric average.
Figure 1 Selected Countries: Government Budget Transparency and Accountability, 2010
Source: Open Budget Survey, International Budget Partnership (2010).
92
90
87
87
83
83
82
72
71
71
68
65
63
61
58
56
52
SouthAfrica
NewZealand
UK
France
Norway
Sweden
US
Chile
Brazil
SouthKorea
Germany
Peru
Spain
Colombia
Portugal
Argen ne
Mexico

40
Figure 2 Transparency of Sovereign Wealth Funds, 2011
Source: Sovereign Wealth Fund Institute (2011).

41
Figure 3 Chile: Trend GDP Growth and Output Gap Projection by MoF in 2010, 1990-2015 (%)
Sources: Committee’s Report Trend GDP 2011.
Figure 4 Chile: Committee’s Projections, Average Actual Future GDP Growth, and Actual GDP
Growth, 2002-2010 (%)
Sources: author’s calculations based on data published by Committee Report 2011.
Notes: GDP Growth is the actual GDP growth, in the case of 2011 I use 5% as my own calculation. Committee’s projected average trend GDP growth is the average of all future
projections made by the Committee at the corresponding year. Average actual future growth is average GDP growth from a rolling window from year t through year t+4.
-6%
-4%
-2%
0%
2%
4%
6%
8%
1990 1992 1994 1996 1998 2000 2002 2004 2006 2008 2010 2012 2014
Trend/actualoutputgap TrendGDPGrowthRate
-2%
-1%
0%
1%
2%
3%
4%
5%
6%
2002 2003 2004 2005 2006 2007 2008 2009 2010 2011
GDPGrowth Commi ee'sProjectedAverageTrendGDPGrowth AverageActualFutureGrowth
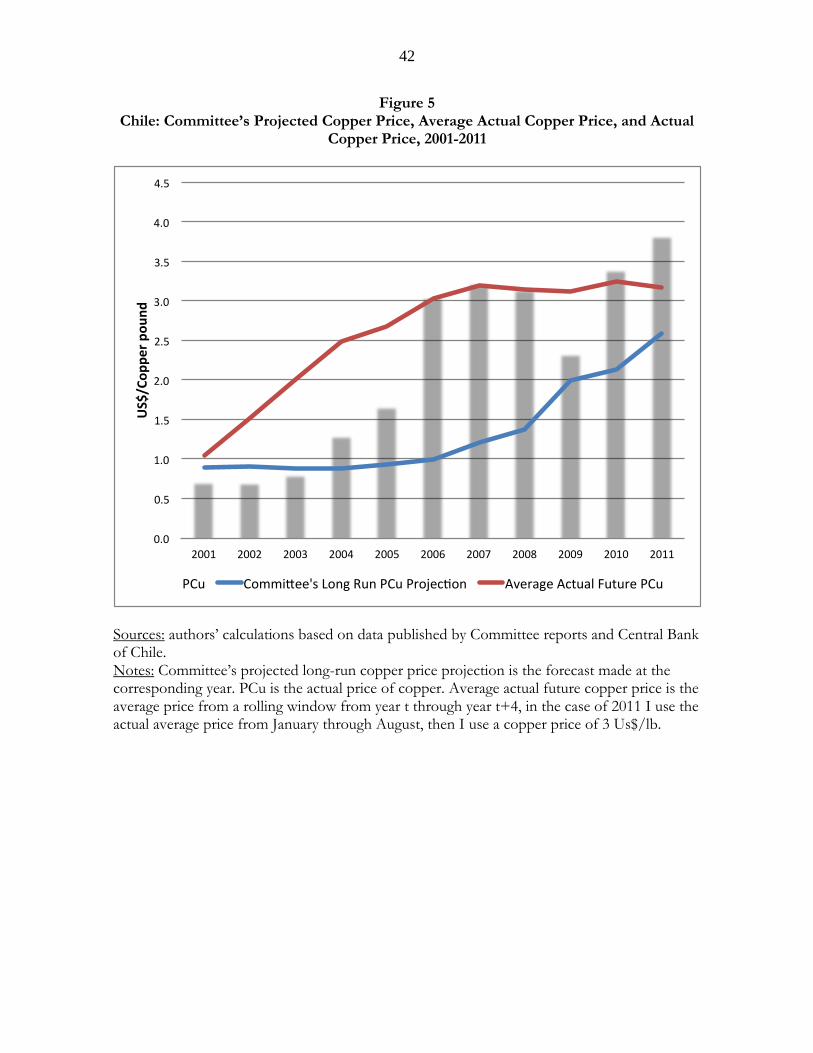
42
Figure 5 Chile: Committee’s Projected Copper Price, Average Actual Copper Price, and Actual
Copper Price, 2001-2011
Sources: authors’ calculations based on data published by Committee reports and Central Bank of Chile. Notes: Committee’s projected long-run copper price projection is the forecast made at the corresponding year. PCu is the actual price of copper. Average actual future copper price is the average price from a rolling window from year t through year t+4, in the case of 2011 I use the actual average price from January through August, then I use a copper price of 3 Us$/lb.
0.0
0.5
1.0
1.5
2.0
2.5
3.0
3.5
4.0
4.5
2001 2002 2003 2004 2005 2006 2007 2008 2009 2010 2011
US$/Copperpound
PCu Commi ee'sLongRunPCuProjec on AverageActualFuturePCu
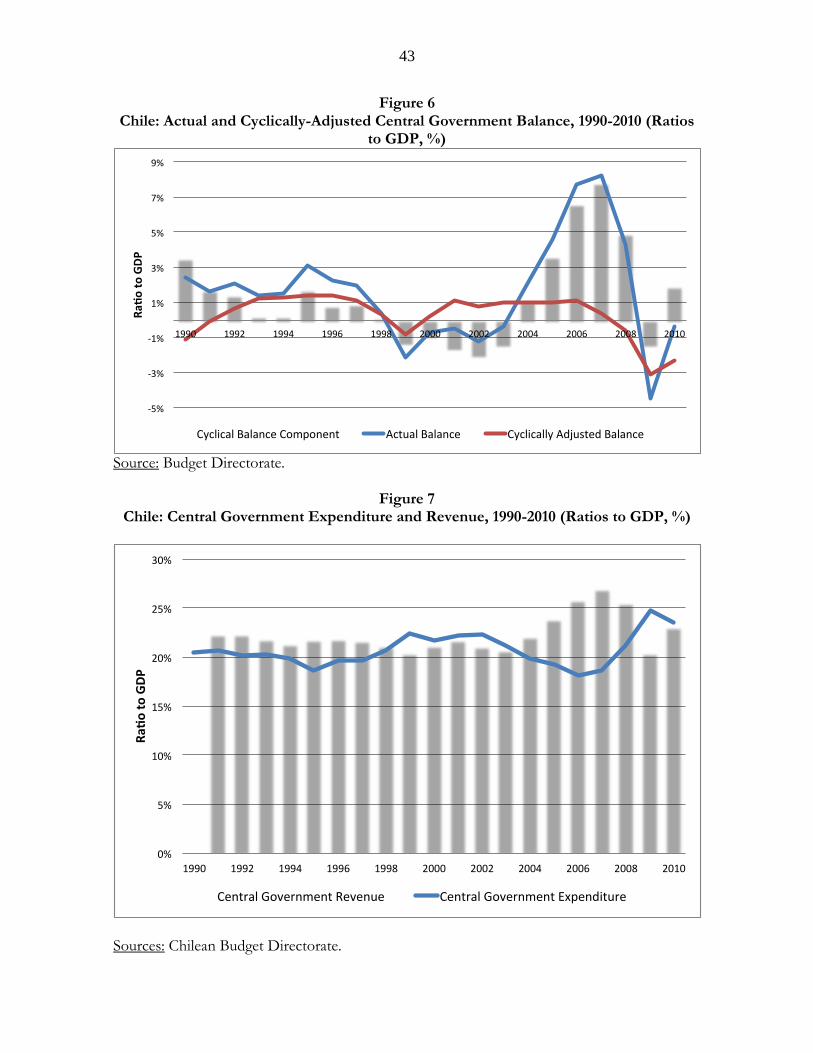
43
Figure 6 Chile: Actual and Cyclically-Adjusted Central Government Balance, 1990-2010 (Ratios
to GDP, %)
Source: Budget Directorate.
Figure 7
Chile: Central Government Expenditure and Revenue, 1990-2010 (Ratios to GDP, %)
Sources: Chilean Budget Directorate.
-5%
-3%
-1%
1%
3%
5%
7%
9%
1990 1992 1994 1996 1998 2000 2002 2004 2006 2008 2010
Ra
otoGDP
CyclicalBalanceComponent ActualBalance CyclicallyAdjustedBalance
0%
5%
10%
15%
20%
25%
30%
1990 1992 1994 1996 1998 2000 2002 2004 2006 2008 2010
Ra
otoGDP
CentralGovernmentRevenue CentralGovernmentExpenditure

44
Figure 8 Chile: Central Government Revenue and Expenditure Growth Rates, 1991-2010 (%)
Sources: Chilean Budget Directorate.
Figure 9 Chile: Government Revenue, 2005-2010 (Ratio to GDP, %)
Source: Chilean Budget Directorate.
-25%
-15%
-5%
5%
15%
25%
1991 1993 1995 1997 1999 2001 2003 2005 2007 2009
Realrateofgrowth
CentralGovernmentRevenue CentralGovernmentExpenditure
0%
5%
10%
15%
20%
25%
30%
2005 2006 2007 2008 2009 2010
Ra
otoGDP
OverallRevenue CopperRevenue Non-CopperRevenue

45
Figure 10 Chile: Gross Assets, Gross Liabilities, and Net Assets of the Government, 1990-2010
(Ratios to GDP, %)
Source: Ministry of Finance
Figure 11 Chile: Sovereign Risk Measures: International Country Risk Guide Index and EMBI
Spread, 1990-2010
Source: Chilean Central Bank and Notes: Left axis shows CRG Composite Index and right axis shows EMBI Chile. The ICRG Index ranges from 0 to 100 and the EMBI Chile spread is in basis points EMBI Chile was created in 1999, thus we use an estimated EMBI Chile from 1990-1998 using a backward prediction from a regression of EMBI on ICRG.
-40%
-30%
-20%
-10%
0%
10%
20%
30%
1991 1993 1995 1997 1999 2001 2003 2005 2007 2009
RaotoGDP
GrossAssets GrossLiabili es NetAssets
50
70
90
110
130
150
170
190
210
230
250
65
67
69
71
73
75
77
79
81
83
85
1990 1992 1994 1996 1998 2000 2002 2004 2006 2008 2010
EMBIChile ICRGComposite

46
Figure 12 Chile: Government Foreign Assets held in CRCF, ESSF, and PRF, 2001-2010
(Ratio to GDP, %)
Note: CRCF is the Copper Revenue Stabilization Fund, ESSF is the Economic and Social Stabilization Fund, and PRF is the Pension Reserve Fund. Other Gross Foreign Assets of the Government (included in Table 5) are not included here. Source: Ministry of Finance.

47
Figure 13 Chile: Current International Portfolio Composition of Sovereign Wealth Funds (PRF
and ESSF) and Recommended Composition for PRF (%)
Source: Financial Advisory Committee on Sovereign Funds to the Minister of Finance (Financial committee report 2010)
66.5
45
3.5
15
15
30
5
20
0
10
20
30
40
50
60
70
80
90
100
CurrentPor olio RecommendedPor olio
SovereignBonds IndexedSovereignBonds Equity
MoneyMarket CorporateBonds

48
Figure 14 Norway: Past (1970-2010) and Projected (2011-2030) Oil Production
Source: Norwegian Petroleum Directorate (2011).
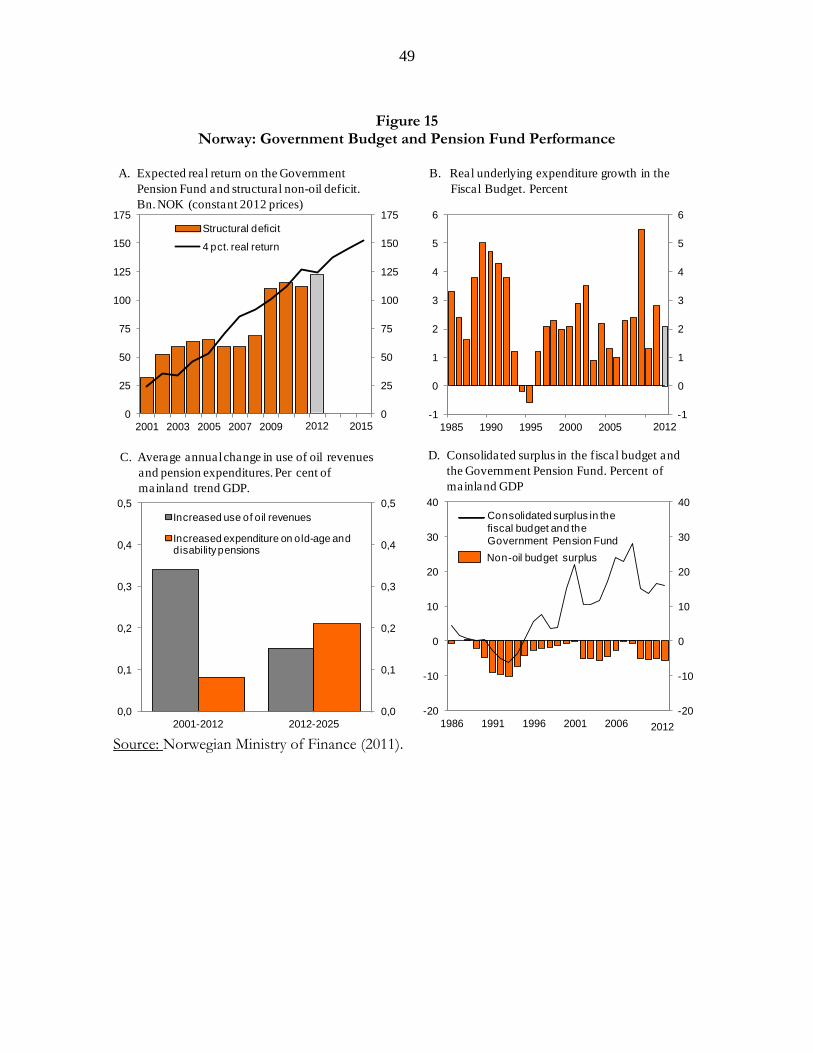
49
Figure 15
Norway: Government Budget and Pension Fund Performance
Source: Norwegian Ministry of Finance (2011).
The National Budget 2012 7
market value of the GPFG at the end of 2010, and thus the 4 pct. real return on the Fund in 2011, was somewhat higher than expected last autumn.
The proposed 2012 Budget implies an increase in spending of petroleum revenues in line with the average expected increase in the four percent path in the years ahead. Measured as a share of trend GDP for Mainland Norway, the structural non-oil budget deficit will increase by about ¼ percentage point from 2011 to 2012. Macroeconomic model simulations indicate that the overall impact of the Government's proposed budget on mainland GDP is broadly neutral.
These calculations take into account that different budget items may affect the activity level of the Norwegian economy differently.
The main features of the proposed Budget for 2012 are as follows:
- The spending of petroleum revenues, as
measured by the structural, non-oil budget deficit, is estimated at NOK 122.2 billion, which is NOK 2.4 billion below the expected real return on the GPFG.
- An increase in the structural non-oil deficit from 2011 to 2012 corresponding to ¼ pct. of mainland trend GDP. The overall impact of
Figure 3.1 Fiscal policy
B. Real underlying expenditure growth in the
Fiscal Budget. Percent
A. Expected real return on the Government
Pension Fund and structural non-oil deficit.
Bn. NOK (constant 2012 prices)
Fiscal policy
D. Consolidated surplus in the fiscal budget and
the Government Pension Fund. Percent of
mainland GDP
-1
0
1
2
3
4
5
6
1985 1990 1995 2000 2005
-1
0
1
2
3
4
5
6
0
25
50
75
100
125
150
175
2001 2003 2005 2007 20090
25
50
75
100
125
150
175
Structural deficit
4 pct. real return
2015 20122012
C. Average annual change in use of oil revenues
and pension expenditures. Per cent of
mainland trend GDP.
0,0
0,1
0,2
0,3
0,4
0,5
2001-2012 2012-2025
0,0
0,1
0,2
0,3
0,4
0,5
Increased use of oil revenues
Increased expenditure on old-age and disability pensions
-20
-10
0
10
20
30
40
1986 1991 1996 2001 2006-20
-10
0
10
20
30
40
2012
Non-oil budget surplus
Consolidated surplus in the
fiscal budget and the
Government Pension Fund
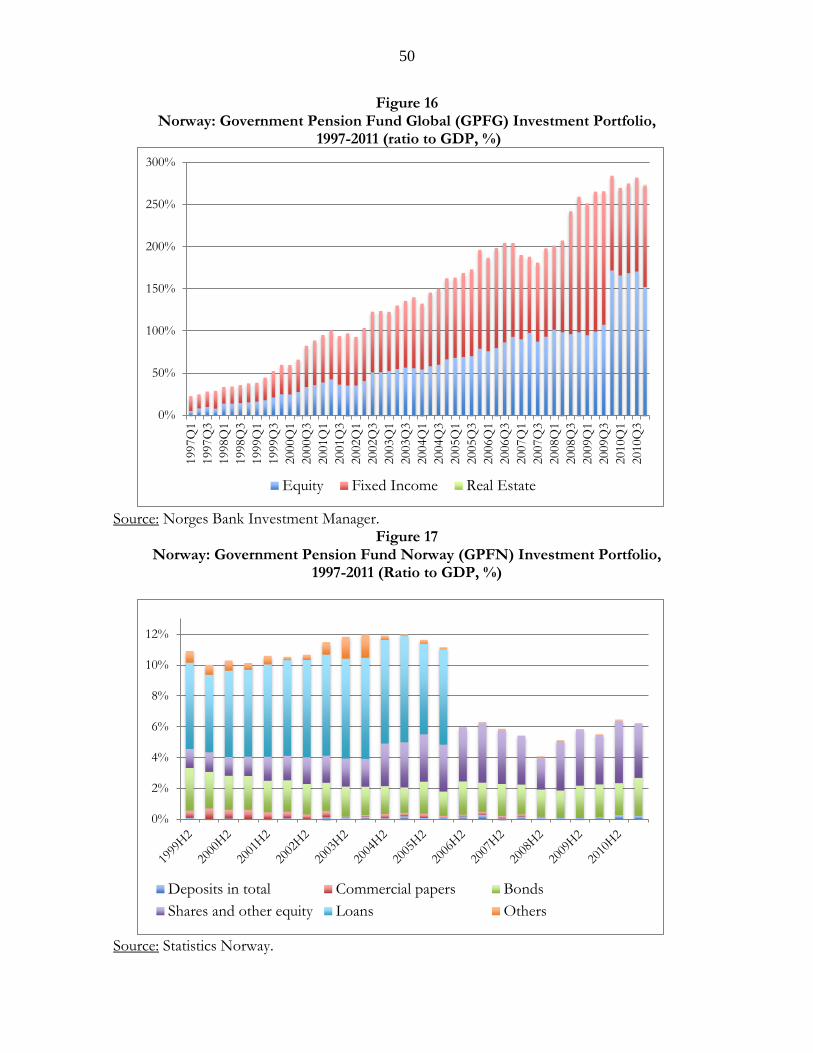
50
Figure 16 Norway: Government Pension Fund Global (GPFG) Investment Portfolio,
1997-2011 (ratio to GDP, %)
Source: Norges Bank Investment Manager.
Figure 17 Norway: Government Pension Fund Norway (GPFN) Investment Portfolio,
1997-2011 (Ratio to GDP, %)
Source: Statistics Norway.
0%
50%
100%
150%
200%
250%
300%
1997Q
1
1997Q
3
1998Q
1
1998Q
3
1999Q
1
1999Q
3
2000Q
1
2000Q
3
2001Q
1
2001Q
3
2002Q
1
2002Q
3
2003Q
1
2003Q
3
2004Q
1
2004Q
3
2005Q
1
2005Q
3
2006Q
1
2006Q
3
2007Q
1
2007Q
3
2008Q
1
2008Q
3
2009Q
1
2009Q
3
2010Q
1
2010Q
3
Equity Fixed Income Real Estate
0%
2%
4%
6%
8%
10%
12%
Deposits in total Commercial papers Bonds
Shares and other equity Loans Others