fiscal sustainability report 2017 - pbo-dpb oct... · current fiscal policy at the federal level is...
TRANSCRIPT

Fiscal Sustainability Report 2017
Ottawa, Canada 5 October 2017 www.pbo-dpb.gc.ca
The Parliamentary Budget Officer (PBO) supports Parliament by providing analysis, including analysis of macro-economic and fiscal policy, for the purposes of raising the quality of parliamentary debate and promoting greater budget transparency and accountability.
This report provides PBO’s assessment of the sustainability of government finances over the long term for the federal government, subnational governments and public pension plans.
The PBO would like to thank federal and provincial government officials for providing feedback on PBO’s projections. The feedback provided, however, should not be construed as an endorsement of PBO’s projections or of its fiscal sustainability assessment.
This report was prepared by the staff of the Parliamentary Budget Officer. Govindadeva Bernier, Negash Haile, Jason Jacques, Chris Matier, Tim Scholz, Trevor Shaw and Alex Smith drafted the report and contributed to the analysis. Mostafa Askari provided comments. Nancy Beauchamp and Jocelyne Scrim assisted with the preparation of the report for publication. Please contact [email protected] for further information.
Jean-Denis Fréchette Parliamentary Budget Officer
Table of Contents Executive Summary 1
1. Introduction 5
2. Federal government 9
3. Newfoundland and Labrador 15
4. Prince Edward Island 23
5. Nova Scotia 30
6. New Brunswick 37
7. Quebec 44
8. Ontario 51
9. Manitoba 58
10. Saskatchewan 65
11. Alberta 72
12. British Columbia 79
13. The Territories 86
14. Canada Pension Plan 93
15. Quebec Pension Plan 96
References 99

Financial data sources 100 Appendix A:
Projecting provincial and territorial GDP 102 Appendix B:
Fiscal projection methodology 104 Appendix C:
Fiscal gap definition 114 Appendix D:
Sensitivity analysis 116 Appendix E:
Notes 119

Fiscal Sustainability Report 2017
1
Executive Summary Medium-term budget plans are insufficient to evaluate the sustainability of current fiscal policy. To assess whether a government’s fiscal policy is sustainable requires projecting current policy beyond a budget’s medium-term planning horizon. Fiscal sustainability means that government debt does not grow continuously as a share of the economy.
The objective of this report is to identify if changes to current fiscal policy are required to avoid unsustainable government debt accumulation and to estimate the magnitude of these changes—the “fiscal gap”. Since 2010, PBO has published an annual fiscal sustainability report (FSR) and has endeavoured to expand and improve its analysis.
This year’s report expands our analysis to disaggregate the subnational government sector (which consists of provincial, local and aboriginal governments) by province and territory.
Considerable uncertainty surrounds any long-term projection, and the projections in this report are not a forecast of what will happen over the coming decades. They are reported to motivate parliamentary discussion about the adequacy of current fiscal policy to deal with expected long-term demographic and economic challenges. The earlier that a required policy intervention can be identified, the lower will be the cost of its implementation.
Conclusions Total general government sector
Taken from the perspective of the government sector as a whole (that is, federal and subnational governments and public pension plans combined), current fiscal policy in Canada is sustainable over the long term. Relative to the size of the economy, total government net debt is projected to remain below its current level over the long term (Summary Figure 1).
However, this perspective masks unsustainable fiscal policy at the subnational level. While federal net debt is projected to be eliminated entirely in just over 40 years, we project that subnational government net debt will rise from 28.0 per cent of gross domestic product (GDP) to over 100 per cent of GDP within the next 75 years under current fiscal policy.

Fiscal Sustainability Report 2017
2
Fiscal sustainability and the fiscal gap
PBO assesses fiscal sustainability using the fiscal gap—the difference between current fiscal policy and a policy that is
sustainable over the long term.
The fiscal gap represents the immediate and permanent change in revenues,
program spending, or combination of both, expressed as a share of GDP, that is required to stabilize a government’s
net debt-to-GDP ratio at its current level over the long term.
A negative gap indicates that net debt is projected to decline as a share of GDP
and that there is room available to increase spending or reduce taxes while
maintaining fiscal sustainability.
For each public pension plan, the fiscal gap represents the immediate and
permanent change in contributions or expenses that returns the net asset-to-
GDP ratio to its current level over the long term.
Government net debt relative to GDP % of GDP
Sources: Statistics Canada and Parliamentary Budget Officer.
Note: The projection period covers 2017 to 2091.
Federal government
Current fiscal policy at the federal level is sustainable over the long term. To maintain net debt at its current (2016) level of 33.2 per cent of GDP over the long term, PBO estimates that the federal government could permanently increase spending or reduce taxes by 1.2 per cent of GDP ($24.5 billion in current dollars) while maintaining fiscal sustainability. This is up from 0.9 per cent of GDP in last year’s assessment. The upward revision to the amount of federal fiscal room largely reflects downward revisions to interest rate assumptions.
Subnational governments
For the subnational government sector as a whole, current fiscal policy is not sustainable over the long term. PBO estimates that permanent tax increases or spending reductions amounting to 0.9 per cent of GDP ($18.7 billion in current dollars) would be required to stabilize the consolidated subnational government net debt-to-GDP ratio at its current level of 28.0 per cent of GDP over the long term.
The amount of required policy actions has decreased from 1.5 per cent of GDP in last year’s assessment. This revision reflects, in part, changes to PBO’s assumption regarding excess cost growth in health care spending (that is, growth exceeding combined growth in nominal GDP and growth due to population ageing).
-75
-50
-25
0
25
50
75
100
125
150
175
200
2008 2018 2028 2038 2048 2058 2068 2078 2088
Federal government Subnational governments
Public pension plans Total general government
Summary Figure 1

Fiscal Sustainability Report 2017
3
PBO’s subnational government sustainability assessment concludes:
• With the exception of Quebec and Nova Scotia, current fiscal policies across provinces and territories are not sustainable over the long term (Summary Figure 2).
• We estimate that the subnational governments in Quebec and Nova Scotia have fiscal room amounting to 3.0 per cent and 0.4 per cent of provincial GDP, respectively, to increase spending or reduce taxes while maintaining sustainability.
• Based on our estimates, the amount of policy actions required to achieve fiscal sustainability ranges from 0.4 per cent of provincial GDP in Ontario to 7.2 per cent of territorial GDP for the Territories.
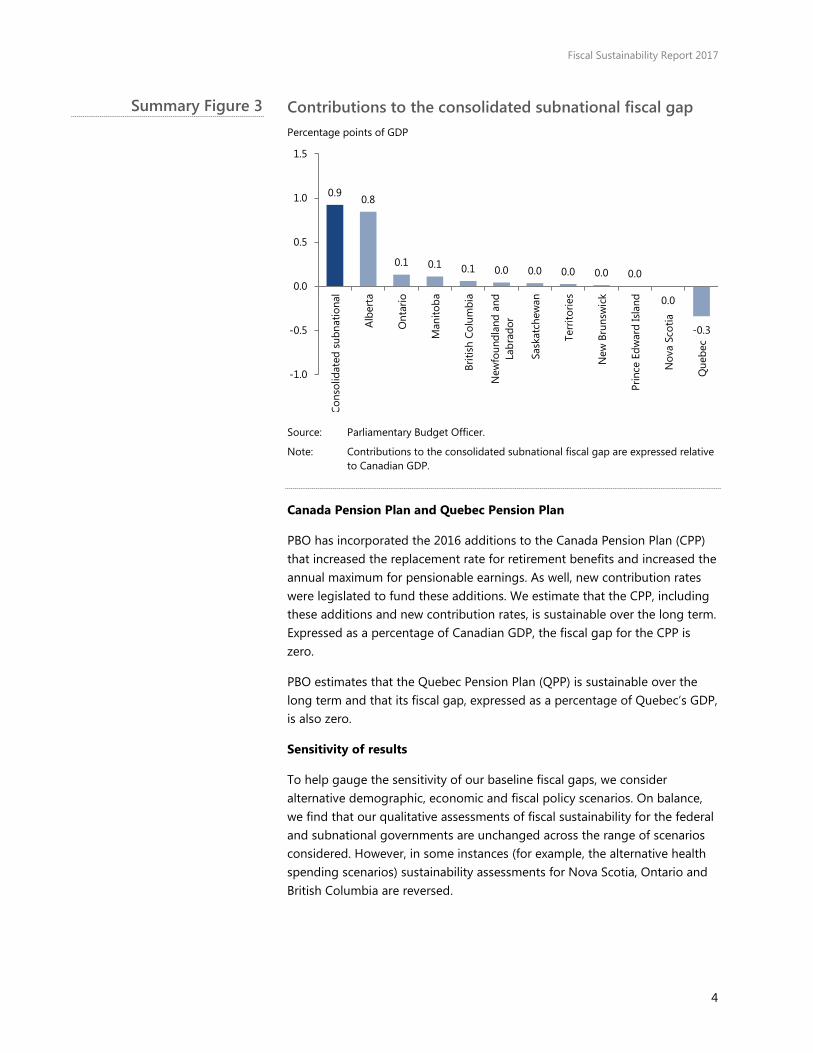
• We estimate that Alberta makes the largest contribution to the consolidated subnational fiscal gap: 0.8 percentage points of Canadian GDP, or 92 per cent of the total (Summary Figure 3).
• Achieving fiscal sustainability for the subnational government sector in each province and territory would require policy actions at the subnational level, such as reductions in spending on programs or higher taxes, and/or increased transfers from the federal government.
Subnational government fiscal gap estimates by province and territory % of GDP
Source: Parliamentary Budget Officer.
Note: Fiscal gaps for each province and the territories are expressed relative to their corresponding provincial and territorial GDP. The consolidated subnational fiscal gap is expressed relative to Canadian GDP.
0.9
-3.0
-0.4
0.4 0.6 1.1 1.3 1.5
3.8 4.6
6.5 7.2
-4
-2
0
2
4
6
8
10
Cons
olid
ated
sub
natio
nal
Que
bec
Nov
a Sc
otia O
ntar
io
Briti
sh C
olum
bia
Sask
atch
ewan
Prin
ce E
dwar
d Is
land
New
Bru
nsw
ick
Man
itoba
Albe
rta
New
foun
dlan
d an
dLa
brad
or
Terr
itorie
s
Summary Figure 2
Fiscal Sustainability Report 2017
4
Contributions to the consolidated subnational fiscal gap Percentage points of GDP
Source: Parliamentary Budget Officer.
Note: Contributions to the consolidated subnational fiscal gap are expressed relative to Canadian GDP.
Canada Pension Plan and Quebec Pension Plan
PBO has incorporated the 2016 additions to the Canada Pension Plan (CPP) that increased the replacement rate for retirement benefits and increased the annual maximum for pensionable earnings. As well, new contribution rates were legislated to fund these additions. We estimate that the CPP, including these additions and new contribution rates, is sustainable over the long term. Expressed as a percentage of Canadian GDP, the fiscal gap for the CPP is zero.
PBO estimates that the Quebec Pension Plan (QPP) is sustainable over the long term and that its fiscal gap, expressed as a percentage of Quebec’s GDP, is also zero.
Sensitivity of results
To help gauge the sensitivity of our baseline fiscal gaps, we consider alternative demographic, economic and fiscal policy scenarios. On balance, we find that our qualitative assessments of fiscal sustainability for the federal and subnational governments are unchanged across the range of scenarios considered. However, in some instances (for example, the alternative health spending scenarios) sustainability assessments for Nova Scotia, Ontario and British Columbia are reversed.
0.9 0.8
0.1 0.1 0.1 0.0 0.0 0.0 0.0 0.0
0.0
-0.3
-1.0
-0.5
0.0
0.5
1.0
1.5
Cons
olid
ated
sub
natio
nal
Albe
rta
Ont
ario
Man
itoba
Briti
sh C
olum
bia
New
foun
dlan
d an
dLa
brad
or
Sask
atch
ewan
Terr
itorie
s
New
Bru
nsw
ick
Prin
ce E
dwar
d Is
land
Nov
a Sc
otia
Que
bec
Summary Figure 3

Fiscal Sustainability Report 2017
5
Government debt PBO uses government net debt in its
fiscal sustainability reports. Net debt is defined as the sum of all financial
liabilities that governments owe creditors at a future date (including
both market debt and unfunded public service benefit obligations) less financial
assets.
In the case of the public pension plans, given the excess of financial assets over
liabilities, the relevant measure is net asset.
In the accounting framework we use, financial assets and liabilities are
measured at current market prices.
The senior dependency ratio
The senior dependency ratio is defined as the ratio of individuals 65 years of
age and older relative to the population between 15 to 64 years of age. This ratio, also referred to as the old age
dependency ratio, is a widely used indicator of the age structure of the
population. As Statistics Canada (2010) notes, this indicator is not intended to
diminish contributions made by individuals classified as “dependents”.
1. Introduction Fiscal sustainability means that government debt does not grow continuously as a share of the economy. Assessing whether—and the degree to which—fiscal policy is sustainable involves projecting government net debt relative to the size of the economy over the long term under the assumption that current fiscal policy is maintained.
These long-term fiscal projections are not forecasts or predictions of the most likely outcomes. Rather, they are illustrative scenarios that show the consequences of maintaining a government’s current fiscal policy over the long term, after accounting for the economic and fiscal implications of population ageing.
Scenarios in which there is excessive debt or asset accumulation would not likely be realised given future fiscal policy actions and given responses by households, firms and financial markets. Nonetheless, long-term debt-to-GDP projections serve as a useful signal and gauge of the sustainability of current fiscal policy.
To construct long-term debt-to-GDP projections, we overlay a government’s current fiscal structure onto long-term demographic and economic projections. Appendix A describes the financial data sources used in this report.
The demographic projection
The evolving demographic profile of the Canadian population is one of the key drivers of PBO’s long-term economic and fiscal projection. Across all provinces and territories, the ageing of the population will move an increasing share of Canadians out of their prime working-age years and into their retirement years, resulting in slower growth in the labour force and GDP.
Slower growth in economic activity will put downward pressure on government revenues as growth in the tax base slows. At the same time, population ageing will put upward pressure on government programs such as health care, Old Age Security and public pension benefits.
Our baseline demographic projection was produced by Statistics Canada’s Demography Division using assumptions consistent with Statistics Canada (2015a) until 2063. PBO provided assumptions thereafter. PBO’s demographic projection depends on assumptions for fertility, mortality (life expectancy) and immigration rates.
Fiscal Sustainability Report 2017
6
Labour input, labour productivity and GDP
Labour input measures the total number of hours worked and is determined by
the size of the working-age population, the employment rate and the average
number of hours worked by an employee.
Labour productivity measures the amount of output produced (real GDP)
per hour worked. It is influenced by capital accumulation and technological
improvements.
Real GDP is equal to labour input multiplied by labour productivity.
Potential GDP is the amount of output that the economy can produce when capital, labour and technology are at
their respective trends.
Growth in real GDP per capita (per person) is typically used to measure
increases in living standards.
The primary balance A government’s primary balance is
defined as revenues less non-interest spending. It represents the contribution
to debt accumulation that is directly influenced by fiscal policy. Subtracting public debt charges from the primary
balance yields the more familiar budgetary balance or “net lending”.
In the case of the public pension plans, we refer to the primary balance as the
net cash flow, which represents plan contributions less expenses.
The long-term economic projection
PBO’s April 2017 medium-term outlook (2017 to 2022) provides the starting point for the long-term economic projection. Beyond 2022, the Canadian economy is assumed to operate at its productive capacity, or potential GDP, which is determined by trends in labour input (that is, total hours worked) and labour productivity (that is, GDP per hour worked).1
To construct long-term GDP projections for the provinces and territories, we first project underlying labour inputs and labour productivity for each province and for the territories combined. We then make adjustments to each of these series to ensure consistency with our national projection (see Appendix B).
At the national level, our long-term assumption for GDP inflation and inflation as measured by the Consumer Price Index (CPI) is set at the Bank of Canada’s annual inflation target. Long-term assumptions for interest rates on Government of Canada securities are based on the Bank of Canada’s estimate of the neutral rate of interest and historical spreads between short- and long-term interest rates.2
Across provinces and territories we assume that annual GDP inflation converges to the annual inflation target and effective interest rates on provincial and territorial government debt converge to the federal rate plus a historical spread.3
The long-term fiscal projection
Assessing fiscal sustainability involves first projecting a government’s primary balance (that is, revenues less program spending). To construct the long-term revenue and program spending projections, we begin with our April 2017 medium-term outlook. Provincial government budgets are also used to inform our medium-term projections for subnational governments’ primary balances (see Appendix C).
For government revenues, we assume that the current tax burden will be maintained beyond the medium term. That is, revenues will grow at the same rate as nominal GDP. Federal transfers to subnational governments such as the Canada Health Transfer (CHT) and Equalization are, in aggregate, linked to growth in nominal GDP. Further, the formula for allocating federal transfers across provinces and territories must be also taken into account.
To project demographically-sensitive program spending categories (such as health care and education), we adopt an approach that decomposes growth in spending in a given category into growth in nominal GDP and growth due to changes in the age structure of the population.4 This approach implies that spending per “beneficiary”, on an inflation-adjusted basis, grows in line with real GDP per capita.5 Over the long term, other program spending is assumed to grow in line with nominal GDP.

Fiscal Sustainability Report 2017
7
Debt-to-GDP dynamics When the effective interest rate on debt
exceeds GDP growth, maintaining a stable debt-to-GDP ratio requires
running primary balance surpluses.
The size of the primary balance surplus necessary to maintain a stable debt-to-
GDP ratio depends on the difference between the interest rate and the growth rate of GDP, as well as the
current debt ratio.
A government’s debt-to-GDP ratio will increase if its primary balance as a share
of GDP is smaller than the difference between the effective interest rate and
GDP growth rate, multiplied by the current debt-to-GDP ratio.
For the public pension plans, the approach we use to project contributions and benefits is described in Annex E of our 2014 FSR. In essence, our approach adjusts the CPP and QPP actuarial projections for our economic and demographic assumptions.
The projected path of government debt and public pension plan assets is determined by stock-flow accounting assumptions. Budgetary deficits (net borrowing) are financed by issuing interest-bearing debt and budgetary surpluses (net lending) are used to pay down interest-bearing debt. Similarly, the CPP and QPP are assumed to finance asset purchases from their surpluses. Effective interest rates on debt are assumed to converge to market rates over the long term.
Arithmetically, a government’s debt-to-GDP ratio will increase over time if its debt grows faster than GDP. It is informative, however, to isolate the key drivers underlying this debt accumulation: the primary balance relative to GDP and the differential between the effective interest rate on debt and GDP growth. A government’s debt-to-GDP ratio will increase if its primary balance as a share of GDP is smaller than the interest-growth rate differential multiplied by the current debt-to-GDP ratio.6
To ensure a stable economic backdrop over the long term, we assume that there is no feedback from government debt-to-GDP accumulation to the economy (Box 1). Incorporating such feedback would simply accelerate any projected increases in debt-to-GDP ratios and our qualitative assessment of fiscal sustainability would be unchanged.
Box 1: Impacts of government debt-to-GDP accumulation
Permanent increases in government debt relative to the size of the economy can impact the economy through various channels (for example, see Macklem, Rose and Tetlow (1994)). First, a permanent increase in the debt ratio can lead to reduced domestic savings, resulting in lower private investment and ultimately lower GDP and/or increased borrowing from abroad that would ultimately have to be financed by higher trade surpluses and reduced domestic consumption.
Second, a permanent increase in the debt-to-GDP ratio requires that a government run a larger primary balance surplus, financed through increases higher taxes and/or reductions in program spending, resulting in lower consumption, investment and GDP as households and firms respond to the required fiscal measures.
Lastly, an increase in government debt relative to GDP to high levels could increase the uncertainty about future fiscal actions, resulting in an increase in the interest rate risk premium on government debt.
CBO (2012) and OBR (2012) also note that higher government debt levels can restrict the ability of policymakers to respond to unanticipated economic and financial developments. Further, debt-to-GDP accumulation can have important implications for intergenerational equity (for example, see Statistics Canada (1998)).

Fiscal Sustainability Report 2017
8
The fiscal gap
The degree to which current fiscal policy needs to be adjusted to achieve sustainability can be quantified by the fiscal gap. Specifically, PBO’s baseline fiscal gap is calculated as the immediate and permanent improvement in the primary balance required to stabilize the debt-to-GDP ratio at its current level after 75 years.7 An improvement in the primary balance can be achieved by increasing revenues, decreasing spending on programs, or a combination of both. Appendix D provides a detailed definition and derivation of the fiscal gap.
Similar to the federal and subnational government sectors, we calculate fiscal gaps for the CPP and QPP. These gaps represent the immediate and permanent changes in contributions and/or expenses required to stabilize their net asset-to-GDP ratios at current levels after 75 years.
Sensitivity analysis
To help gauge the sensitivity of our baseline fiscal gaps, we consider alternative demographic, economic and fiscal policy scenarios (see Appendix E).
PBO estimates the fiscal gap under three alternative demographic projections: an older population; a younger population; and a scenario based on more recent interprovincial migration rates. The older and younger population projections use a combination of high and low assumptions for fertility, mortality (life expectancy) and immigration rates beginning in 2023.
To assess the sensitivity of the economic assumptions, we construct alternative projections for real GDP growth (± 0.5 percentage points) and interest rates (± 50 basis points), beginning in 2023. Alternative real GDP growth projections are constructed using different assumptions for labour productivity growth.
While many alternative fiscal policy assumptions can be considered, we limit our focus to assessing the impacts on subnational governments of incorporating excess cost growth in health care spending (± 0.25 percentage points) beginning in 2023. In addition, we consider alternative endpoint assumptions for government debt ratios (zero and 100 per cent of GDP).
Structure of the report
The remainder of the report is structured by sector: federal government; subnational governments (by province and the territories combined); and public pension plans, CPP and QPP. Appendices provide additional methodological and technical detail.
Fiscal Sustainability Report 2017
9
2. Federal government • At the national level, population growth is projected to slow from 1.2 per
cent in 2016 to 0.7 per cent in 2040 and stabilize around that rate thereafter. The senior dependency ratio is projected to rise from 24.5 per cent in 2016 to 39.7 per cent in 2040 and then to 45.5 per cent by 2091.
• PBO projects that real GDP growth in Canada will moderate from 1.9 per cent annually, on average, over 2017 to 2022 to 1.7 per cent annually, on average, over the long term. Short- and long-term Government of Canada interest rates are assumed to remain at 3.0 per cent and 4.0 per cent, respectively, over the long term.
• Current federal fiscal policy is sustainable over the long term. PBO estimates that the federal government could implement permanent tax reductions or spending increases amounting to 1.2 per cent of GDP while maintaining fiscal sustainability.
• This is equivalent to a permanent 9 per cent decrease in the tax burden or a 10 per cent increase in program spending.
• The federal government’s fiscal room is underpinned by projected decreases (relative to the size of the economy) in major transfers to individuals, in particular elderly benefits and children’s benefits, which are projected to decrease by 1.2 percentage points of GDP over the projection horizon.
Demographic projection
At the national level, PBO’s long-term baseline demographic assumptions are essentially the same as our 2016 FSR (Table 2-1). The total fertility rate is projected to rise from 1.60 children for every woman of child-bearing age in 2016 to its ultimate level of 1.67 over the medium term. Male and female life expectancies at birth are projected to rise over the long term.
The (net) immigration rate is projected to decline from 6.4 immigrants per thousand persons in 2016, which reflects the Government’s higher immigration targets, to 5.8 immigrants per thousand persons through to 2091. Beyond 2063, we assume that immigration will remain constant relative to the size of the population. Consequently, the immigration rate is somewhat higher over this period compared to our 2016 FSR.8
Population growth is projected to slow to 0.7 per cent in 2040 and stabilize around that rate thereafter. The senior dependency ratio is projected to almost double over the next 75 years, reaching 45.5 per cent by 2091.

Fiscal Sustainability Report 2017
10
Demographic projection: Canada 2016 2040 2065 2091
Total fertility rate (children per woman of child-bearing age)
1.60 1.67 1.67 1.67
Male life expectancy at birth (years)
80.5 84.8 88.0 90.3
Female life expectancy at birth (years)
84.3 87.1 89.4 91.3
Net immigration rate (immigrants per 1,000 persons)
6.4 5.8 5.8 5.8
Population growth (per cent)
1.2 0.7 0.7 0.7
Senior dependency ratio (population 65+/population 15-64, per cent)
24.5 39.7 43.5 45.5
Sources: Statistics Canada and Parliamentary Budget Officer.
Economic projection
Projected growth in labour input is due entirely to growth in the working-age population, which is 0.7 per cent annually, on average, over 2017 to 2091 (Table 2-2). Shifts in the age composition of the population pull the aggregate employment rate lower, subtracting 0.2 percentage points a year, on average, from labour input growth over the same period.
Labour productivity growth is projected to converge to its steady-state rate of 1.1 per cent over the long term, which is also consistent with historical average annual growth observed between 1982 and 2016.
PBO projects that real GDP growth will slow from 1.9 per cent annually, on average, over 2017 to 2022 to 1.7 per cent annually, on average, over the long term. Real GDP growth is marginally higher, on average, than FSR 2016 due to a higher assumed immigration rate over 2063 to 2091 and higher projected employment rates.
Growth in real GDP per capita—typically used to measure increases in living standards—is projected to average 1.0 per cent annually, which is 0.3 percentage points lower than the average growth observed over 1982 to 2016. This projected slowdown reflects slower employment growth relative to population growth.
Economy-wide prices increases, measured by GDP inflation, are projected to converge to 2.0 per cent over the medium term and remain at that level. Nominal GDP is projected to grow by 3.7 per cent annually, on average, over the long term which is 1.3 percentage points below its 1982-2016 average.
Revisions to our interest rate assumptions represent the most significant change to our economic projection compared to FSR 2016. Over the long term, we assume that the 3-month treasury bill rate will remain at its
Table 2-1

Fiscal Sustainability Report 2017
11
estimated neutral rate of 3.0 per cent, which is 50 bps lower than FSR 2016. We assume that the 10-year government bond rate will be 4.0 per cent over the long term, which is 55 basis points lower than our 2016 FSR. The effective interest rate on federal government debt is projected to settle at 3.8 per cent over the long term.
Economic projection: Canada % 1982-2016 2017-2022 2023-2091
Real GDP growth 2.4 1.9 1.7 Labour input growth 1.2 0.6 0.6
Labour productivity growth 1.1 1.3 1.1 Real GDP per capita growth 1.3 0.9 1.0
GDP inflation 2.6 2.1 2.0 Nominal GDP growth 5.0 4.0 3.7 3-month treasury bill 5.2 2.1 3.0
10-year government bond rate 6.4 3.3 4.0 Effective interest rate on federal debt n/a 2.6 3.7
Sources: Statistics Canada and Parliamentary Budget Officer.
Fiscal projection
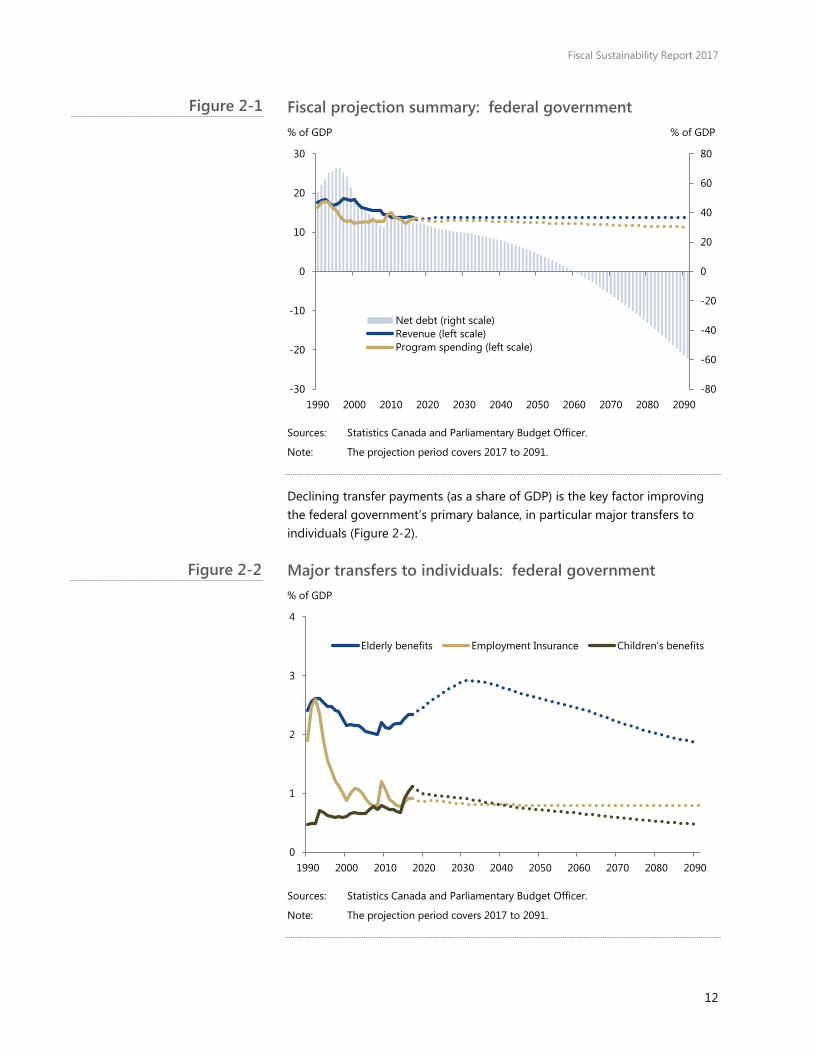
Federal revenues amounted to 13.7 per cent of national GDP in 2016. Based on our April 2017 medium-term outlook, we project federal revenues to decrease to 13.5 per cent of GDP by 2020 (Figure 2-1). Beyond the medium term, revenues are assumed to remain at 13.7 per cent of GDP.
Federal program spending was 13.4 per cent of GDP in 2016. Based on our April outlook, we project that program spending relative to GDP will decline to 12.8 per cent over the medium term. Thereafter, program spending is projected to rise to 13.0 per cent of GDP in 2030 due to spending on elderly benefits, before gradually declining to 11.3 per cent of GDP by the end of the projection.
We project that revenues will exceed program spending over the projection period, leaving continuously increasing primary balances. Based on our projection, federal government net debt, currently 33.2 per cent of GDP, would be eliminated by 2060.
Table 2-2
Fiscal Sustainability Report 2017
12
Fiscal projection summary: federal government % of GDP % of GDP
Sources: Statistics Canada and Parliamentary Budget Officer.
Note: The projection period covers 2017 to 2091.
Declining transfer payments (as a share of GDP) is the key factor improving the federal government’s primary balance, in particular major transfers to individuals (Figure 2-2).
Major transfers to individuals: federal government % of GDP
Sources: Statistics Canada and Parliamentary Budget Officer.
Note: The projection period covers 2017 to 2091.
-80
-60
-40
-20
0
20
40
60
80
-30
-20
-10
0
10
20
30
1990 2000 2010 2020 2030 2040 2050 2060 2070 2080 2090
Net debt (right scale)Revenue (left scale)Program spending (left scale)
0
1
2
3
4
1990 2000 2010 2020 2030 2040 2050 2060 2070 2080 2090
Elderly benefits Employment Insurance Children's benefits
Figure 2-1
Figure 2-2
Fiscal Sustainability Report 2017
13
Federal spending on elderly benefits amounted to 2.3 per cent of GDP in 2016. As baby-boom cohorts reach 65 years of age, we project that spending on elderly benefits will continue to increase, peaking at 2.9 per cent of GDP in 2032. However, given that benefit payments are indexed to inflation only, spending on elderly benefits is projected to decline ultimately as these cohorts die off.
Children’s benefits will peak at 1.1 per cent of GDP in 2017. However, given that the under-18 cohort will comprise a smaller share of the total population over the coming decades and that benefit payments are indexed only to inflation, the children’s benefits program will decline relative to the size of the economy. By the end of our projection, children’s benefits are projected to decline to 0.5 per cent of GDP.
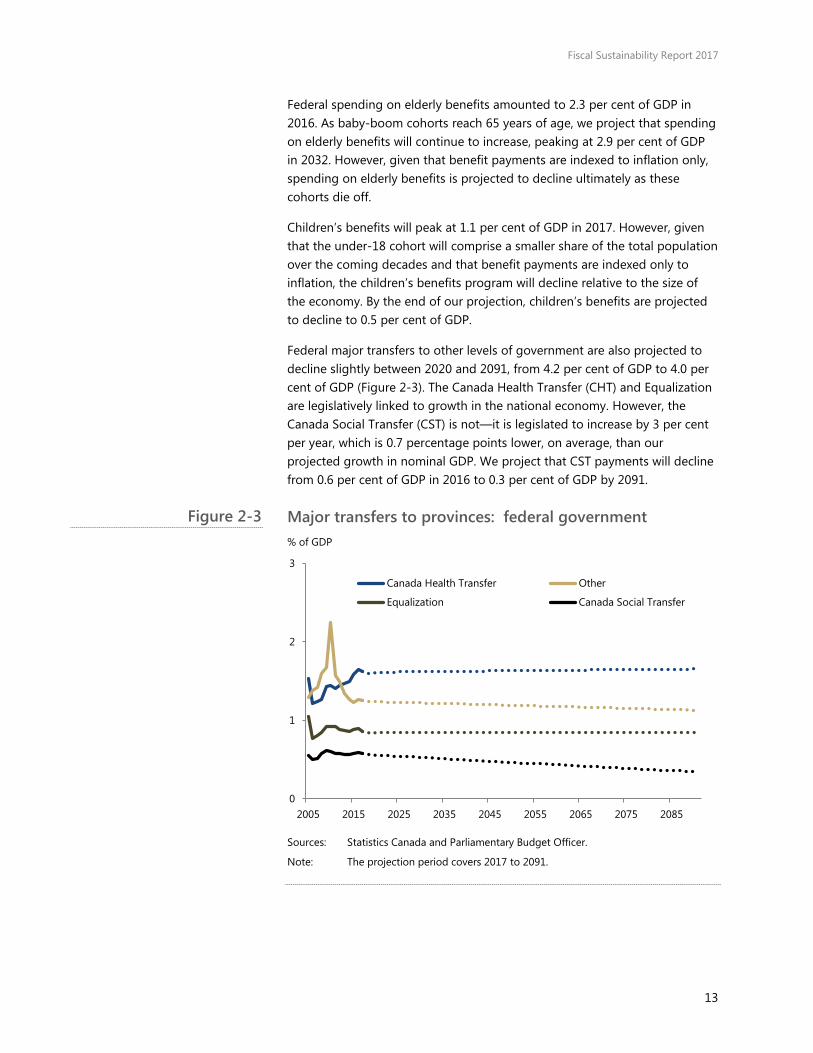
Federal major transfers to other levels of government are also projected to decline slightly between 2020 and 2091, from 4.2 per cent of GDP to 4.0 per cent of GDP (Figure 2-3). The Canada Health Transfer (CHT) and Equalization are legislatively linked to growth in the national economy. However, the Canada Social Transfer (CST) is not—it is legislated to increase by 3 per cent per year, which is 0.7 percentage points lower, on average, than our projected growth in nominal GDP. We project that CST payments will decline from 0.6 per cent of GDP in 2016 to 0.3 per cent of GDP by 2091.
Major transfers to provinces: federal government % of GDP
Sources: Statistics Canada and Parliamentary Budget Officer.
Note: The projection period covers 2017 to 2091.
0
1
2
3
2005 2015 2025 2035 2045 2055 2065 2075 2085
Canada Health Transfer Other
Equalization Canada Social Transfer
Figure 2-3

Fiscal Sustainability Report 2017
14
Fiscal sustainability assessment
Current federal fiscal policy is sustainable over the long term. PBO estimates that permanent tax reductions or spending increases amounting to 1.2 per cent of GDP ($24.5 billion in current dollars) could be implemented while maintaining fiscal sustainability. Such an adjustment would permit a 9 per cent decrease in the tax burden or a 10 per cent increase in program spending, on average, relative to our baseline projection.
Our qualitative assessment that current federal fiscal policy is sustainable over the long term is unchanged across the alternative demographic, economic and fiscal policy assumptions considered (Figure 2-4).
Fiscal gap sensitivity: federal government % of GDP
Source: Parliamentary Budget Officer.
-2.1
-0.8
-1.4
-1.0
-0.5
-1.9
-1.7
-0.7
-1.2
-3 -2 -1 0
100% debt-to-GDP endpoint
0% debt-to-GDP endpoint
Lower interest rates
Higher interest rates
Lower GDP growth
Higher GDP growth
Younger population
Older population
Baseline
Figure 2-4

Fiscal Sustainability Report 2017
15
3. Newfoundland and Labrador • Beyond 2016, the population of Newfoundland and Labrador is
projected to decrease by 0.9 per cent annually, on average, through to 2091. Its senior dependency ratio is projected to rise from 28.6 per cent in 2016 to 63.9 per cent in 2040 and then to 75.3 per cent by 2091.
• PBO projects that real GDP in Newfoundland and Labrador will decline by 0.1 per cent annually, on average, over 2017 to 2022. Over the long term, real GDP is projected to increase by 0.2 per cent annually, on average. The subnational government’s effective interest rate is projected to average 4.6 per cent over 2017 to 2091.
• Current fiscal policy in Newfoundland and Labrador is not sustainable over the long term. PBO estimates that permanent tax increases or spending reductions amounting to 6.5 per cent of provincial GDP ($2.0 billion in current dollars) would be required to achieve fiscal sustainability.
• This is equivalent to a permanent 26 per cent increase in the tax burden (including federal transfers) or a 21 per cent reduction in program spending. Health care spending is the key fiscal pressure, increasing by 6.9 percentage points of GDP over 2020 to 2091.
Demographic projection
We project that, among the provinces and territories, Newfoundland and Labrador will experience population ageing to the greatest extent. PBO projects Newfoundland and Labrador’s population to decline continuously over the next 75 years and its senior dependency ratio to rise to levels well above all other provinces and territories.
The total fertility rate is projected to rise from 1.40 children for every woman of child-bearing age in 2016 to its ultimate level of 1.51 over the medium term (Table 3-1). Male and female life expectancies at birth are projected to rise over the long term. That said, life expectancy at birth for both sexes in Newfoundland and Labrador is projected to be the lowest in Canada.
The net migration rate (which reflects net international and interprovincial migration) is projected to increase from -2.7 migrants per thousand persons in 2016 to -0.6 migrants per thousand persons over the long term. This is the lowest provincial net migration rate in Canada.

Fiscal Sustainability Report 2017
16
The population of Newfoundland and Labrador is projected to decrease by 0.9 per cent annually, on average, through to 2091. The senior dependency ratio is projected to reach 75.3 per cent by 2091.
Demographic projection: Newfoundland and Labrador 2016 2040 2065 2091
Total fertility rate (children per woman of child-bearing age)
1.40 1.51 1.51 1.51
Male life expectancy at birth (years)
78.8 83.6 87.1 89.6
Female life expectancy at birth (years)
82.9 85.9 88.3 90.3
Net migration rate (migrants per 1,000 persons)
-2.7 -0.8 -0.6 -0.6
Population growth (per cent)
0.3 -0.9 -1.1 -1.0
Senior dependency ratio (population 65+/population 15-64, per cent)
28.6 63.9 72.6 75.3
Sources: Statistics Canada and Parliamentary Budget Officer.
Note: The net migration rate includes both international and interprovincial migrants.
Economic projection
Decreases in Newfoundland and Labrador’s working-age population combine with a projected decline in its employment rate to reduce its labour input by 1.3 per cent annually, on average, over 2017 to 2091 (Table 3-2).
Labour productivity in Newfoundland and Labrador is projected to grow by 1.5 per cent annually, on average, over 2017 to 2091, which is 0.4 percentage points higher than the national rate but lower than its historical average of 1.8 per cent.
PBO projects that real GDP in Newfoundland and Labrador will decline by 0.1 per cent annually, on average, over 2017 to 2022. However, beyond 2022, real GDP is projected to increase by 0.2 per cent annually, on average, due to an increase in labour productivity growth. This is well below projected real GDP growth of 1.7 per cent at the national level and Newfoundland and Labrador’s historical average growth of 2.3 per cent from 1982 to 2016.
However, growth in real GDP per capita is projected to average 1.1 per cent annually over 2017 to 2091 in Newfoundland and Labrador, which is 0.2 percentage points higher than the national rate over the same period but substantially lower than its historical average growth of 2.6 per cent over 1982 to 2016.
Economy-wide price increases, measured by GDP inflation, are projected to average 2.6 per cent annually over 2017 to 2022 and 2.0 per cent over the long term. Newfoundland and Labrador’s nominal GDP is projected to grow
Table 3-1

Fiscal Sustainability Report 2017
17
by 2.3 per cent annually, on average, over 2017 to 2091, which is 3.2 percentage points below its 1982-2016 average growth.
We project that the effective interest rate on government debt in Newfoundland and Labrador will settle at 4.6 per cent, which is 6 basis points higher than the average effective rate across subnational governments and 79 basis points higher than the federal effective rate.
Economic projection: Newfoundland and Labrador % 1982-2016 2017-2022 2023-2091
Real GDP growth 2.3 -0.1 0.2 Labour input growth 0.6 -1.2 -1.3
Labour productivity growth 1.8 1.2 1.5 Real GDP per capita growth 2.6 0.3 1.2
GDP inflation 3.0 2.6 2.0 Nominal GDP growth 5.4 2.6 2.2
Effective interest rate on government debt n/a 4.9 4.6
Sources: Statistics Canada and Parliamentary Budget Officer.
Note: Real and nominal GDP growth in 2016 is a PBO estimate.
Fiscal projection
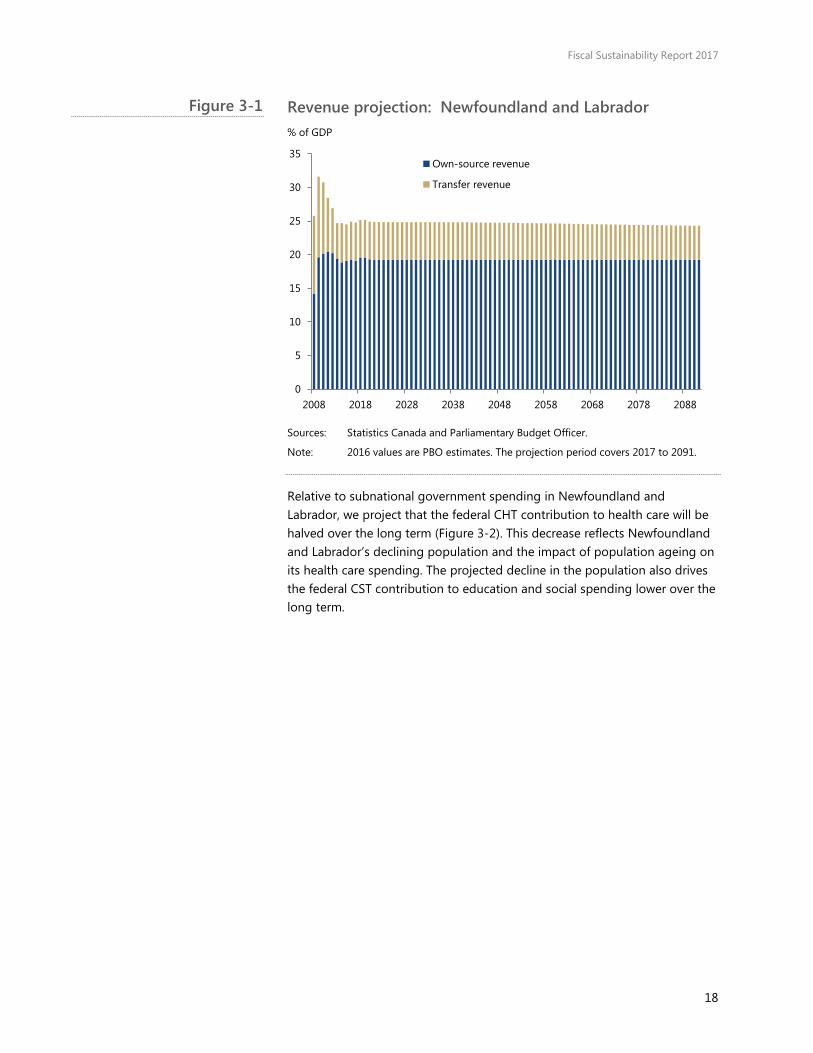
PBO estimates that subnational government revenues in Newfoundland and Labrador amounted to 24.9 per cent of provincial GDP in 2016. Based on the provincial government’s Budget 2017 revenue plan, we project Newfoundland and Labrador’s revenues to rise slightly to 25.0 per cent of GDP by 2020 as a result of higher own-source revenues (that is, revenues raised from subnational government taxes, fees and enterprises, Figure 3-1).
Beyond the medium term, Newfoundland and Labrador’s own-source revenues are projected to remain at 19.3 per cent of GDP.
Revenues generated from resource production are an important part of Newfoundland and Labrador’s own-source revenues. In our projections, we assume that own-source revenues grow in proportion with nominal GDP, but we do not take a view on the future composition of own source revenues. If resource revenues grow more (less) slowly than GDP, taxes, fees or other sources of government revenue would need to be increased (decrease) to preserve the long-term ratio of own-source revenues to GDP.
Transfers from the federal government, such as the Canada Health Transfer (CHT), Canada Social Transfer (CST) and Equalization, are projected to decrease to 5.6 per cent of GDP in 2020 before declining to 5.1 per cent of provincial GDP by 2091.
Table 3-2
Fiscal Sustainability Report 2017
18
Revenue projection: Newfoundland and Labrador % of GDP
Sources: Statistics Canada and Parliamentary Budget Officer.
Note: 2016 values are PBO estimates. The projection period covers 2017 to 2091.
Relative to subnational government spending in Newfoundland and Labrador, we project that the federal CHT contribution to health care will be halved over the long term (Figure 3-2). This decrease reflects Newfoundland and Labrador’s declining population and the impact of population ageing on its health care spending. The projected decline in the population also drives the federal CST contribution to education and social spending lower over the long term.
0
5
10
15
20
25
30
35
2008 2018 2028 2038 2048 2058 2068 2078 2088
Own-source revenue
Transfer revenue
Figure 3-1

Fiscal Sustainability Report 2017
19
Federal CHT and CST contributions to subnational government spending: Newfoundland and Labrador %
Source: Parliamentary Budget Officer.
Subnational government program spending in Newfoundland and Labrador amounted to 29.4 per cent of GDP in 2016. Based on the medium-term plan set out in the provincial government’s 2017 budget, we project that program spending relative to provincial GDP will decrease to 27.5 per cent in 2020 mainly due to spending reductions in other programs and health care (Figure 3-3).
Over the long term, however, we project that program spending relative to the size of the provincial economy will rise steadily, reaching 32.3 per cent of GDP by 2091. This projected increase is entirely due to demographic pressures that drive health care spending up by 6.9 percentage points of GDP over 2020 to 2091. The projected increase in health spending relative to GDP (in percentage terms) is the largest of any province in our projection.
That said, the ageing of the population does provide some spending offset (1.3 percentage points of GDP) in terms of reduced spending on education and social assistance over 2020 to 2091.
18.6
13.0
10.6 9.3 9.2 9.6
7.7 6.0
0
5
10
15
20
25
30
2016 2041 2066 2091
CHT share in health spending CST share in education and social spending
Figure 3-2

Fiscal Sustainability Report 2017
20
Program spending projection: Newfoundland and Labrador % of GDP
Sources: Statistics Canada and Parliamentary Budget Officer.
Note: 2016 values are PBO estimates. The projection period covers 2017 to 2091.
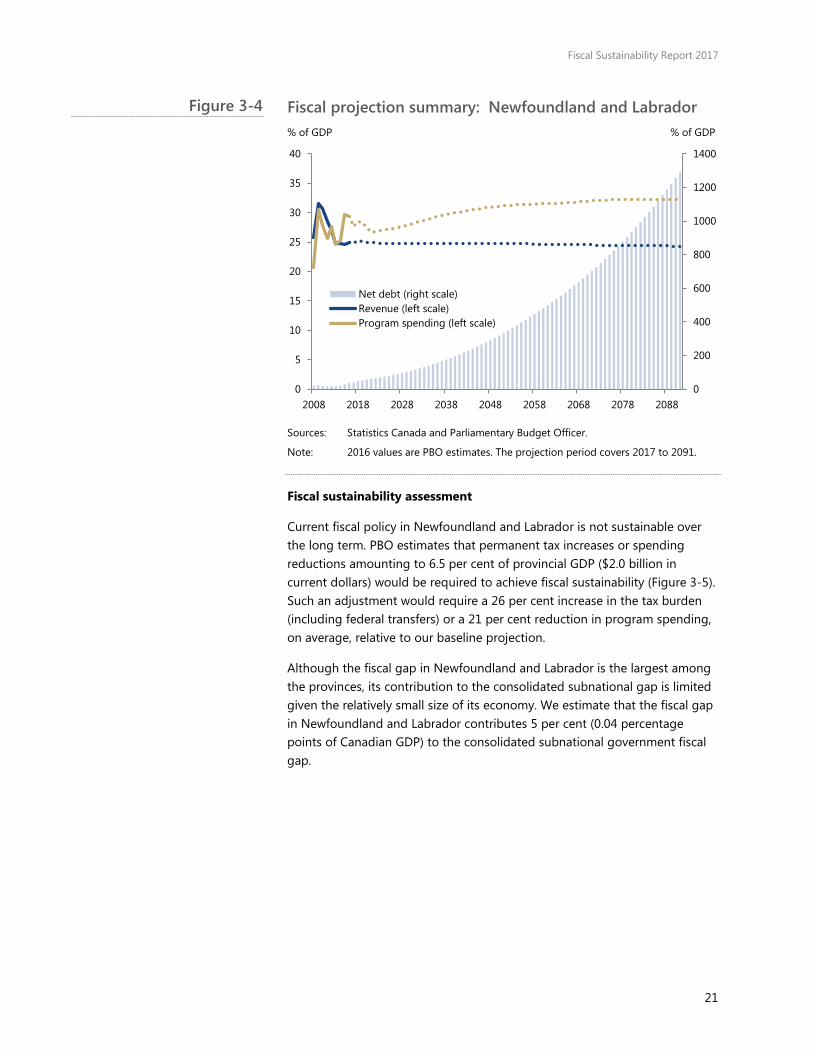
Over the medium term, we project that the subnational government primary balance (that is, revenues less program spending) will improve from a deficit of 4.5 per cent of GDP in 2016 to a deficit of 2.6 per cent of GDP in 2020 (Figure 3-4). Thereafter, increased program spending and lower federal transfers combine to expand the deficit to 7.9 per cent of GDP by the end of the projection horizon.
Ongoing projected primary deficits, combined with a sizeable gap between its borrowing rate and nominal GDP growth, drive subnational government debt-to-GDP accumulation over the long term. Under current fiscal policy, the subnational government net debt-to-GDP ratio is projected to rise rapidly from current levels, reaching 1300 per cent of GDP by 2091.
0
5
10
15
20
25
30
35
2008 2018 2028 2038 2048 2058 2068 2078 2088
Other Education Social Health
Figure 3-3
Fiscal Sustainability Report 2017
21
Fiscal projection summary: Newfoundland and Labrador % of GDP % of GDP
Sources: Statistics Canada and Parliamentary Budget Officer.
Note: 2016 values are PBO estimates. The projection period covers 2017 to 2091.
Fiscal sustainability assessment
Current fiscal policy in Newfoundland and Labrador is not sustainable over the long term. PBO estimates that permanent tax increases or spending reductions amounting to 6.5 per cent of provincial GDP ($2.0 billion in current dollars) would be required to achieve fiscal sustainability (Figure 3-5). Such an adjustment would require a 26 per cent increase in the tax burden (including federal transfers) or a 21 per cent reduction in program spending, on average, relative to our baseline projection.
Although the fiscal gap in Newfoundland and Labrador is the largest among the provinces, its contribution to the consolidated subnational gap is limited given the relatively small size of its economy. We estimate that the fiscal gap in Newfoundland and Labrador contributes 5 per cent (0.04 percentage points of Canadian GDP) to the consolidated subnational government fiscal gap.
0
200
400
600
800
1000
1200
1400
0
5
10
15
20
25
30
35
40
2008 2018 2028 2038 2048 2058 2068 2078 2088
Net debt (right scale)Revenue (left scale)Program spending (left scale)
Figure 3-4

Fiscal Sustainability Report 2017
22
Subnational fiscal gap estimates: Newfoundland and Labrador % of GDP
Source: Parliamentary Budget Officer.
Our qualitative assessment that current fiscal policy in Newfoundland and Labrador is not sustainable over the long term is unchanged across the alternative demographic, economic and fiscal policy assumptions considered (Figure 3-6).
Fiscal gap sensitivity: Newfoundland and Labrador % of GDP
Source: Parliamentary Budget Officer.
0.9
-3.0
-0.4
0.4 0.6 1.1 1.3 1.5
3.8 4.6
6.5 7.2
-4
-2
0
2
4
6
8
10
Cons
olid
ated
sub
natio
nal
Que
bec
Nov
a Sc
otia O
ntar
io
Briti
sh C
olum
bia
Sask
atch
ewan
Prin
ce E
dwar
d Is
land
New
Bru
nsw
ick
Man
itoba
Albe
rta
New
foun
dlan
d an
dLa
brad
or
Terr
itorie
s
6.2
6.7
5.7
7.4
6.4
6.6
6.5
6.5
6.0
6.2
7.0
6.5
0 2 4 6 8 10
100% debt-to-GDP endpoint
0% debt-to-GDP endpoint
Lower health spending growth
Higher health spending growth
Lower interest rates
Higher interest rates
Lower GDP growth
Higher GDP growth
Interprovincial immigration
Younger population
Older population
Baseline
Figure 3-5
Figure 3-6
Fiscal Sustainability Report 2017
23
4. Prince Edward Island • Population growth in Prince Edward Island is projected to slow from
1.3 per cent in 2016 to 0.6 per cent in 2040 and then stabilize around 0.5 per cent thereafter. Its senior dependency ratio is projected to reach 48.5 per cent in 2040 and then 56.9 per cent by 2091.
• PBO projects that real GDP growth in Prince Edward Island will average 1.6 per cent annually over 2017 to 2091. The subnational government’s effective interest rate is projected to average 4.5 per cent over the same period.
• Current fiscal policy in Prince Edward Island is not sustainable over the long term. PBO estimates that permanent tax increases or spending reductions amounting to 1.3 per cent of provincial GDP ($0.1 billion in current dollars) would be required to achieve fiscal sustainability.
• This is equivalent to a permanent 4 per cent increase in the tax burden (including federal transfers) or a 4 per cent reduction in program spending. Health care spending is the key fiscal pressure in our projection, increasing by 5.2 percentage points of GDP over 2020 to 2091.
Demographic projection
Based on PBO’s demographic assumptions, Prince Edward Island’s population is projected to grow more slowly than the national rate. Its senior dependency ratio is projected to remain above the national ratio beyond 2016.
Under the baseline demographic scenario, PBO projects that Prince Edward Island’s fertility rate will rise to 1.68 children per woman of child-bearing age, which is marginally higher than the national rate (Table 4-1). Male and female life expectancies at birth are projected to rise over the long term, in line with national levels.
The net migration rate is projected to decrease from 9.2 migrants per thousand persons in 2016 to 8.0 migrants per thousand persons over the long term.
Growth in Prince Edward Island’s population is projected to slow to 0.6 per cent in 2040 and 0.5 per cent by 2091. The senior dependency ratio is projected to reach 56.9 per cent by 2091.

Fiscal Sustainability Report 2017
24
Demographic projection: Prince Edward Island 2016 2040 2065 2091
Total fertility rate (children per woman of child-bearing age)
1.55 1.68 1.68 1.68
Male life expectancy at birth (years)
79.7 84.3 87.7 90.2
Female life expectancy at birth (years)
84.1 87.0 89.4 91.3
Net migration rate (immigrants per 1,000 persons)
9.2 8.3 8.0 8.0
Population growth (per cent)
1.3 0.6 0.5 0.5
Senior dependency ratio (population 65+/population 15-64, per cent)
28.9 48.5 52.9 56.9
Sources: Statistics Canada and Parliamentary Budget Officer.
Note: The net migration rate includes both international and interprovincial migrants.
Economic projection
Projected growth in Prince Edward Island’s labour input is due entirely to growth in its working-age population, which averages 0.6 per cent annually, over 2017 to 2091 (Table 4-2). Shifts in the age composition of its population pull the employment rate lower, subtracting 0.2 percentage points a year, on average, from its labour input growth over the same period.
Labour productivity in Prince Edward Island is projected to grow by 1.2 per cent annually, on average, over 2017 to 2091, which is 0.1 percentage points higher than the national rate but lower than its historical average of 1.4 per cent.
PBO projects that real GDP growth in Prince Edward Island will average 1.7 per cent annually over 2017 to 2022. Beyond 2022, real GDP growth is projected to decrease slightly to 1.6 per cent annually, on average, due to slower labour input growth. This is only slightly lower than projected real GDP growth of 1.7 per cent at the national level but significantly lower than Prince Edward Island’s historical average growth of 2.4 per cent from 1982 to 2016.
Growth in real GDP per capita is projected to average 1.0 per cent annually over 2017 to 2091 in Prince Edward Island, which is in line with the national rate over the same period but significantly lower than its historical average growth of 1.9 per cent over 1982 to 2016.
Economy-wide price increases, measured by GDP inflation, are projected to average 2.0 per cent annually over 2017 to 2091. Prince Edward Island’s nominal GDP is projected to grow by 3.7 per cent annually, on average, over 2017 to 2091, which is 1.6 percentage points below its 1982-2016 average.
Table 4-1

Fiscal Sustainability Report 2017
25
We project that the effective interest rate on subnational government debt in Prince Edward Island will settle at 4.6 per cent, which is 11 basis points higher than the average effective rate across subnational governments and 84 basis points higher than the federal effective rate.
Economic projection: Prince Edward Island % 1982-2016 2017-2022 2023-2091
Real GDP growth 2.4 1.7 1.6 Labour input growth 1.1 0.7 0.4
Labour productivity growth 1.4 1.1 1.2 Real GDP per capita growth 1.9 0.7 1.0
GDP inflation 2.8 2.0 2.0 Nominal GDP growth 5.3 3.7 3.7
Effective interest rate on government debt n/a 3.8 4.6
Sources: Statistics Canada and Parliamentary Budget Officer.
Note: Real and nominal GDP growth in 2016 is a PBO estimate.
Fiscal projection
PBO estimates that subnational government revenues in Prince Edward Island amounted to 32.1 per cent of provincial GDP in 2016. Based on the provincial government’s Budget 2017 revenue plan, we project Prince Edward Island’s revenues to increase to 33.5 per cent of GDP by 2020 (Figure 4-1).
Revenue projection: Prince Edward Island % of GDP
Sources: Statistics Canada and the Parliamentary Budget Officer.
Note: 2016 values are PBO estimates. The projection period covers 2017 to 2091.
0
5
10
15
20
25
30
35
40
2008 2018 2028 2038 2048 2058 2068 2078 2088
Own-source revenue Transfer revenue
Table 4-2
Figure 4-1

Fiscal Sustainability Report 2017
26
Beyond the medium term, own-source revenues, that is, revenues raised from subnational government taxes, fees and enterprises, are projected to remain at 22.9 per cent of GDP.
Federal transfers to Prince Edward Island are currently at a national high, 10.9 per cent of GDP. Transfers from the federal government, such as the Canada Health Transfer (CHT), Canada Social Transfer (CST) and Equalization, are projected to decrease to 10.7 per cent of GDP in 2020. Thereafter, we project revenues from federal transfers to decline gradually to 8.1 per cent of provincial GDP by 2091. This decrease is mostly attributable to lower federal Equalization payments.
Relative to subnational government spending in Prince Edward Island, we project that the federal CHT contribution to health care will decrease to 14.3 per cent over the long term (Figure 4-2). This decrease reflects the impact of population ageing on its health care spending and slower population growth (relative to population growth nationally). Education and social spending in Prince Edward Island is projected to outpace the annual 3 per cent increase in the CST envelope which, combined with slower population growth, drives the federal CST contribution lower to 6.0 per cent over the long term.
Federal CHT and CST contributions to subnational government spending: Prince Edward Island %
Source: Parliamentary Budget Officer.
Subnational government program spending in Prince Edward Island amounted to 30.8 per cent of GDP in 2016. Based on the medium-term plan set out in the provincial government’s 2017 budget, we project that program spending relative to provincial GDP will remain at this level (Figure 4-3). Over
22.4
17.0 15.4
14.3
9.0 8.4 7.1
6.0
0
5
10
15
20
25
30
2016 2041 2066 2091
CHT share in health spending CST share in education and social spending
Figure 4-2
Fiscal Sustainability Report 2017
27
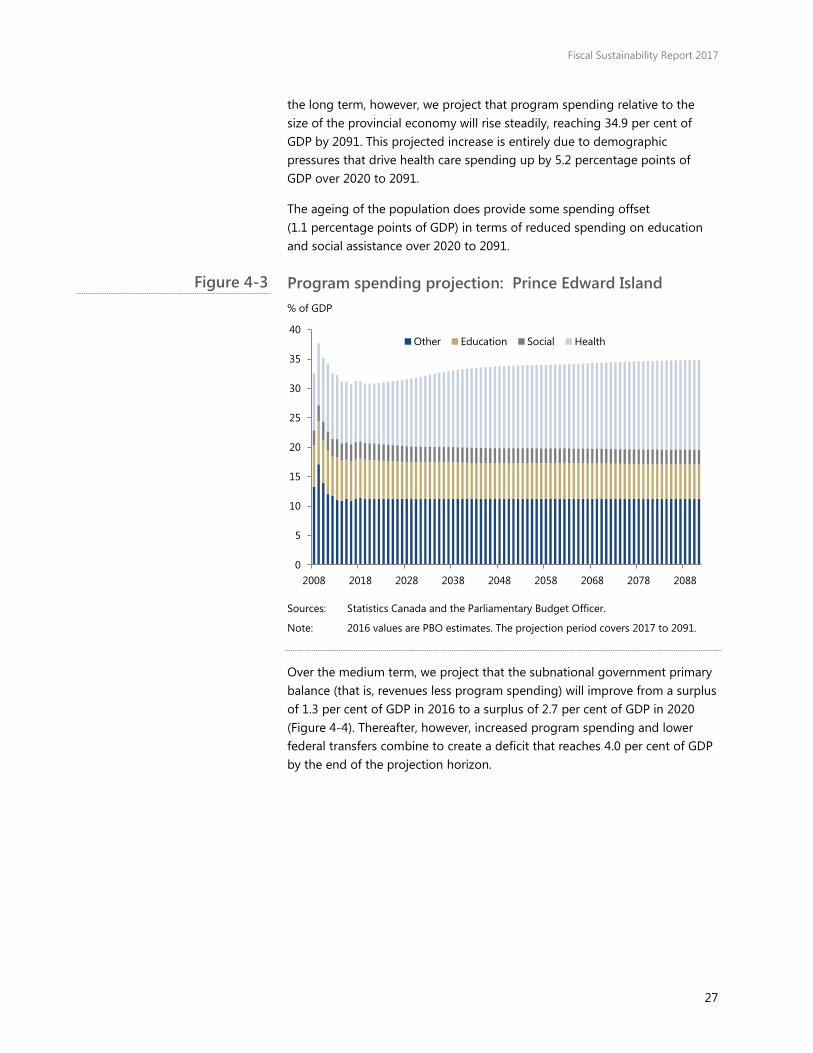
the long term, however, we project that program spending relative to the size of the provincial economy will rise steadily, reaching 34.9 per cent of GDP by 2091. This projected increase is entirely due to demographic pressures that drive health care spending up by 5.2 percentage points of GDP over 2020 to 2091.
The ageing of the population does provide some spending offset (1.1 percentage points of GDP) in terms of reduced spending on education and social assistance over 2020 to 2091.
Program spending projection: Prince Edward Island % of GDP
Sources: Statistics Canada and the Parliamentary Budget Officer.
Note: 2016 values are PBO estimates. The projection period covers 2017 to 2091.
Over the medium term, we project that the subnational government primary balance (that is, revenues less program spending) will improve from a surplus of 1.3 per cent of GDP in 2016 to a surplus of 2.7 per cent of GDP in 2020 (Figure 4-4). Thereafter, however, increased program spending and lower federal transfers combine to create a deficit that reaches 4.0 per cent of GDP by the end of the projection horizon.
0
5
10
15
20
25
30
35
40
2008 2018 2028 2038 2048 2058 2068 2078 2088
Other Education Social Health
Figure 4-3

Fiscal Sustainability Report 2017
28
Fiscal projection summary: Prince Edward Island % of GDP % of GDP
Source: Statistics Canada and the Parliamentary Budget Officer.
Note: 2016 values are PBO estimates. The projection period covers 2017 to 2091.
Large and expanding projected primary deficits combined with a sizeable gap between its borrowing rate and nominal GDP growth drive subnational government debt-to-GDP accumulation over the long term. Under current fiscal policy, the subnational government net debt-to-GDP ratio is projected to rise rapidly from current levels, reaching 170 per cent of GDP by 2091.
Fiscal sustainability assessment
Current fiscal policy in Prince Edward Island is not sustainable over the long term. PBO estimates that permanent tax increases or spending reductions amounting to 1.3 per cent of provincial GDP ($0.1 billion in current dollars) would be required to achieve fiscal sustainability (Figure 4-5). Such an adjustment would require a 4 per cent increase in the tax burden (including federal transfers) or a 4 per cent reduction in program spending, on average, relative to our baseline projection.
The contribution of Prince Edward Island’s fiscal gap to the consolidated subnational gap is limited given the relatively small size of its economy. We estimate that the fiscal gap in Prince Edward Island contributes less than 1 per cent (0.003 percentage points of Canadian GDP) to the consolidated subnational government fiscal gap.
0
20
40
60
80
100
120
140
160
180
0
5
10
15
20
25
30
35
40
45
2008 2018 2028 2038 2048 2058 2068 2078 2088
Net debt (right scale)Revenue (left scale)Program spending (left scale)
Figure 4-4

Fiscal Sustainability Report 2017
29
Subnational fiscal gap estimates: Prince Edward Island % of GDP
Source: Parliamentary Budget Officer.
Our qualitative assessment that current fiscal policy in Prince Edward Island is not sustainable over the long term is unchanged across the alternative demographic, economic and fiscal policy assumptions considered (Figure 4-6).
Fiscal gap sensitivity: Prince Edward Island % of GDP
Source: Parliamentary Budget Officer.
0.9
-3.0
-0.4
0.4 0.6 1.1 1.3 1.5
3.8 4.6
6.5 7.2
-4
-2
0
2
4
6
8
10
Cons
olid
ated
sub
natio
nal
Que
bec
Nov
a Sc
otia O
ntar
io
Briti
sh C
olum
bia
Sask
atch
ewan
Prin
ce E
dwar
d Is
land
New
Bru
nsw
ick
Man
itoba
Albe
rta
New
foun
dlan
d an
dLa
brad
or
Terr
itorie
s
0.7
1.6
0.2
2.4
1.3
1.3
1.1
1.4
1.5
1.2
2.0
1.3
0 1 2 3
100% debt-to-GDP endpoint
0% debt-to-GDP endpoint
Lower health spending growth
Higher health spending growth
Lower interest rates
Higher interest rates
Lower GDP growth
Higher GDP growth
Interprovincial immigration
Younger population
Older population
Baseline
Figure 4-5
Figure 4-6

Fiscal Sustainability Report 2017
30
5. Nova Scotia • Beyond 2028, the population of Nova Scotia is projected to decrease by
0.3 per cent annually, on average, through to 2091. Its senior dependency ratio is projected to rise from 29.2 per cent in 2016 to 54.1 per cent in 2040 and then to 63.5 per cent by 2091.
• PBO projects that real GDP growth in Nova Scotia will slow from 0.9 per cent annually, on average, over 2017 to 2022 to 0.5 per cent annually, on average, over the long term. The subnational government’s effective interest rate is projected to average 4.4 per cent over 2017 to 2091.
• Current fiscal policy in Nova Scotia is sustainable over the long term. PBO estimates that Nova Scotia has fiscal room to implement permanent tax reductions or spending increases amounting to 0.4 per cent of provincial GDP ($0.2 billion in current dollars) while maintaining fiscal sustainability.
• This is equivalent to a permanent 1 per cent decrease in the tax burden (including federal transfers) or a 1 per cent increase in program spending.
Demographic projection
Similar to Newfoundland and Labrador and New Brunswick, Nova Scotia’s population is, on balance, projected to decline over the long term. The projected increase in its senior dependency ratio is second only (in percentage terms), across provinces, to Newfoundland and Labrador.
Under the baseline demographic scenario, PBO assumes that Nova Scotia’s fertility rate will be 1.52 over the projection period, which is 0.15 children (per woman of child-bearing age) lower than the national rate (Table 5-1). Although male and female life expectancies at birth are projected to rise over the long term, they are projected to remain below national levels.
The net migration rate is projected to increase from 2.0 migrants per thousand persons in 2016 to 2.3 migrants per thousand persons through to 2091.
Nova Scotia’s population is projected to increase marginally through 2028 but then decline by 0.3 per cent annually, on average, thereafter. Its senior dependency ratio is projected to reach 63.5 per cent by 2091.

Fiscal Sustainability Report 2017
31
Demographic projection: Nova Scotia 2016 2040 2065 2091
Total fertility rate (children per woman of child-bearing age)
1.51 1.52 1.52 1.52
Male life expectancy at birth (years)
79.3 83.8 87.2 89.7
Female life expectancy at birth (years)
83.6 86.6 89.0 91.0
Net migration rate (migrants per 1,000 persons)
2.0 2.3 2.3 2.3
Population growth (per cent)
0.6 -0.3 -0.4 -0.3
Senior dependency ratio (population 65+/population 15-64, per cent)
29.2 54.1 59.9 63.5
Sources: Statistics Canada and Parliamentary Budget Officer.
Note: The net migration rate includes both international and interprovincial migrants.
Economic projection
Decreases in Nova Scotia’s working-age population combine with a projected decline in its employment rate to reduce its labour input by 0.5 per cent annually, on average, over 2017 to 2091 (Table 5-2).
Labour productivity in Nova Scotia is projected to grow by 1.0 per cent annually, on average, over 2017 to 2091, which is 0.1 percentage points lower than the national rate and its historical average of 1.1 per cent.
PBO projects that real GDP growth in Nova Scotia will average 0.9 per cent annually over 2017 to 2022. Beyond 2022, Nova Scotia’s real GDP growth is projected to decrease to 0.5 per cent annually, on average, due to slower labour productivity and labour input growth. This is significantly lower than projected real GDP growth of 1.7 per cent at the national level as well as Nova Scotia’s historical average real GDP growth of 1.9 per cent.
Growth in real GDP per capita is projected to average 0.8 per cent annually over 2017 to 2091 in Nova Scotia, which is half of its average annual historical growth from 1982 to 2016. Nova Scotia’s projected growth in real GDP per capita is 0.2 percentage points below national growth over 2017 to 2091.
Economy-wide price increases, measured by GDP inflation, are projected to average 2.0 per cent annually over 2017 to 2091. Nova Scotia’s nominal GDP is projected to grow by 2.5 per cent annually, on average, over 2017 to 2091, which is 2.3 percentage points below its 1982-2016 average.
We project that the effective interest rate on subnational government debt in Nova Scotia will settle at 4.5 per cent, which is 5 basis points lower than the
Table 5-1

Fiscal Sustainability Report 2017
32
average effective rate across subnational governments and 68 basis points higher than the federal effective rate.
Economic projection: Nova Scotia % 1982-2016 2017-2022 2023-2091
Real GDP growth 1.9 0.9 0.5 Labour input growth 0.8 -0.4 -0.5
Labour productivity growth 1.1 1.3 1.0 Real GDP per capita growth 1.6 0.7 0.8
GDP inflation 2.9 2.0 2.0 Nominal GDP growth 4.8 2.8 2.5
Effective interest rate on government debt n/a 3.6 4.4
Sources: Statistics Canada and Parliamentary Budget Officer.
Note: Real and nominal GDP growth in 2016 is a PBO estimate.
Fiscal projection
PBO estimates that subnational government revenues in Nova Scotia amounted to 36.7 per cent of provincial GDP in 2016. Based on the provincial government’s Budget 2017 revenue plan, we project Nova Scotia’s revenues to decrease to 35.3 per cent of GDP by 2020 (Figure 5-1). Apart from Quebec, this is the highest revenue share of GDP among the provinces.
Revenue projection: Nova Scotia % of GDP
Source: Statistics Canada and the Parliamentary Budget Officer.
Note: 2016 values are PBO estimates. The projection period covers 2017 to 2091.
0
5
10
15
20
25
30
35
40
2008 2018 2028 2038 2048 2058 2068 2078 2088
Own-source revenue Transfer revenue
Table 5-2
Figure 5-1
Fiscal Sustainability Report 2017
33
Beyond the medium term, own-source revenues, that is, revenues raised from subnational government taxes, fees and enterprises, are projected to remain at 25.6 per cent of GDP.
Transfers from the federal government, such as the Canada Health Transfer (CHT), Canada Social Transfer (CST) and Equalization, are projected to rise to 9.7 per cent of GDP in 2020 and reach 10.4 per cent of provincial GDP by 2091.
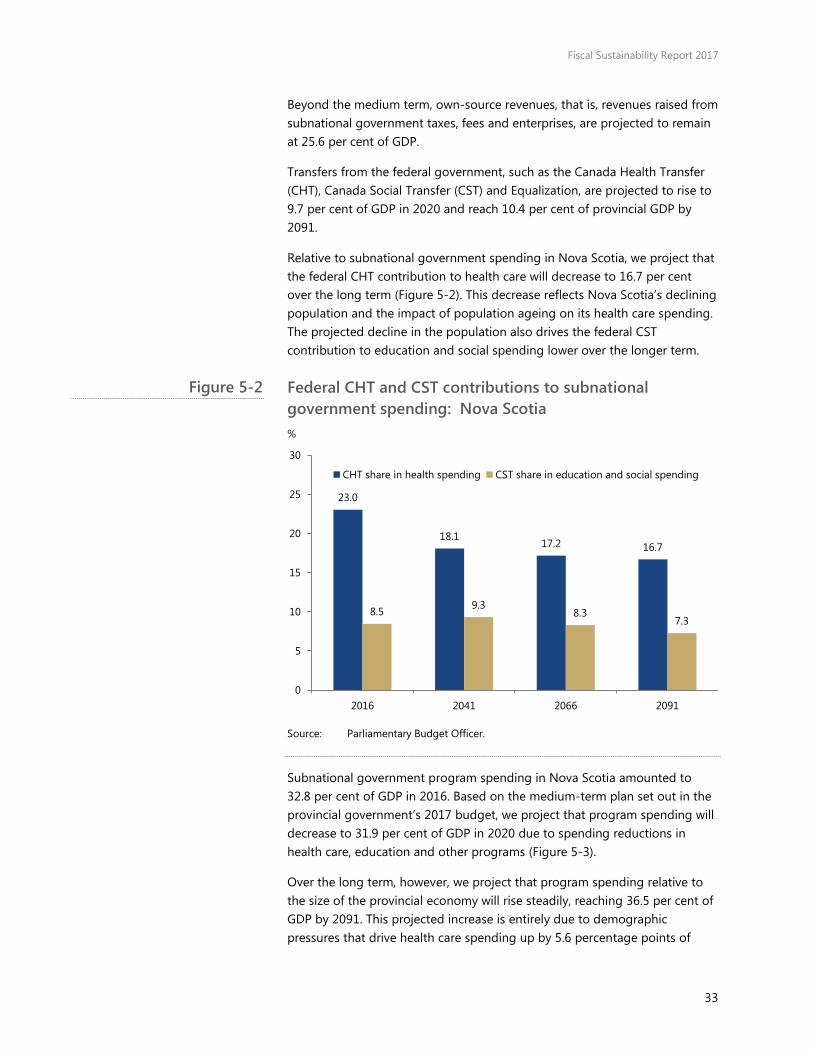
Relative to subnational government spending in Nova Scotia, we project that the federal CHT contribution to health care will decrease to 16.7 per cent over the long term (Figure 5-2). This decrease reflects Nova Scotia’s declining population and the impact of population ageing on its health care spending. The projected decline in the population also drives the federal CST contribution to education and social spending lower over the longer term.
Federal CHT and CST contributions to subnational government spending: Nova Scotia %
Source: Parliamentary Budget Officer.
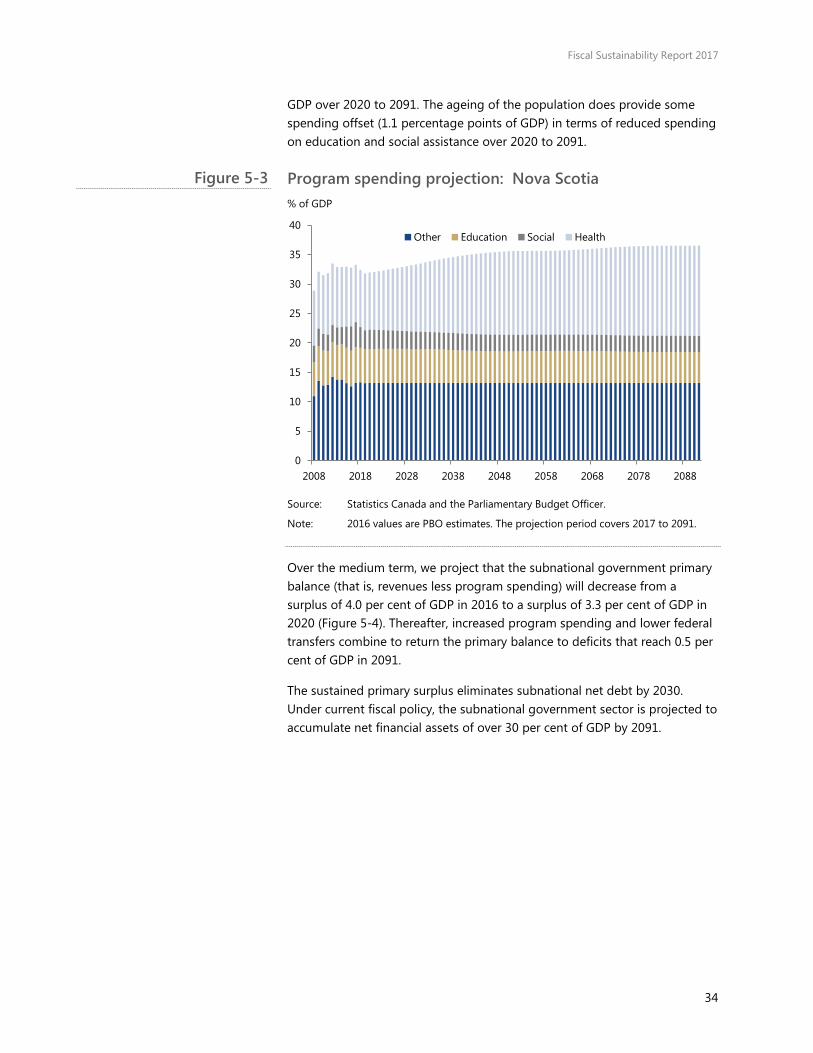
Subnational government program spending in Nova Scotia amounted to 32.8 per cent of GDP in 2016. Based on the medium-term plan set out in the provincial government’s 2017 budget, we project that program spending will decrease to 31.9 per cent of GDP in 2020 due to spending reductions in health care, education and other programs (Figure 5-3).
Over the long term, however, we project that program spending relative to the size of the provincial economy will rise steadily, reaching 36.5 per cent of GDP by 2091. This projected increase is entirely due to demographic pressures that drive health care spending up by 5.6 percentage points of
23.0
18.1 17.2 16.7
8.5 9.3 8.3
7.3
0
5
10
15
20
25
30
2016 2041 2066 2091
CHT share in health spending CST share in education and social spending
Figure 5-2
Fiscal Sustainability Report 2017
34
GDP over 2020 to 2091. The ageing of the population does provide some spending offset (1.1 percentage points of GDP) in terms of reduced spending on education and social assistance over 2020 to 2091.
Program spending projection: Nova Scotia % of GDP
Source: Statistics Canada and the Parliamentary Budget Officer.
Note: 2016 values are PBO estimates. The projection period covers 2017 to 2091.
Over the medium term, we project that the subnational government primary balance (that is, revenues less program spending) will decrease from a surplus of 4.0 per cent of GDP in 2016 to a surplus of 3.3 per cent of GDP in 2020 (Figure 5-4). Thereafter, increased program spending and lower federal transfers combine to return the primary balance to deficits that reach 0.5 per cent of GDP in 2091.
The sustained primary surplus eliminates subnational net debt by 2030. Under current fiscal policy, the subnational government sector is projected to accumulate net financial assets of over 30 per cent of GDP by 2091.
0
5
10
15
20
25
30
35
40
2008 2018 2028 2038 2048 2058 2068 2078 2088
Other Education Social Health
Figure 5-3

Fiscal Sustainability Report 2017
35
Fiscal projection summary: Nova Scotia % of GDP % of GDP
Sources: Statistics Canada and the Parliamentary Budget Officer.
Note: 2016 values are PBO estimates. The projection period covers 2017 to 2091.
Fiscal sustainability assessment
Current fiscal policy in Nova Scotia is sustainable over the long term. PBO estimates that Nova Scotia has fiscal room to implement permanent tax reductions or spending increases amounting to 0.4 per cent of provincial GDP ($0.2 billion in current dollars) while maintaining fiscal sustainability (Figure 5-5). Such an adjustment would permit a 1 per cent decrease in the tax burden (including federal transfers) or a 1 per cent increase in program spending, on average, relative to our baseline projection.
We estimate that the fiscal room in Nova Scotia offsets 0.3 per cent (0.004 percentage points of Canadian GDP) of the consolidated subnational government fiscal gap attributable to other provinces (1.27 percentage points).
-40
-30
-20
-10
0
10
20
30
40
0
5
10
15
20
25
30
35
40
45
2008 2018 2028 2038 2048 2058 2068 2078 2088
Net debt (right scale)Revenue (left scale)Program spending (left scale)
Figure 5-4
Fiscal Sustainability Report 2017
36
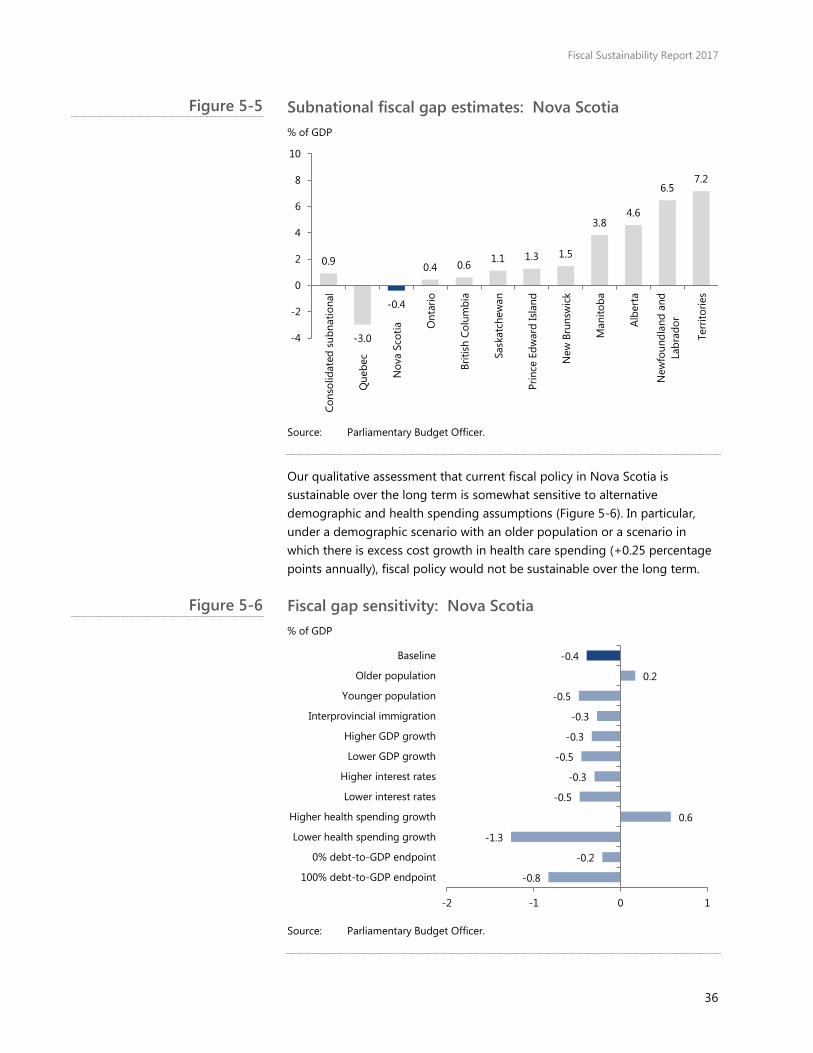
Subnational fiscal gap estimates: Nova Scotia % of GDP
Source: Parliamentary Budget Officer.
Our qualitative assessment that current fiscal policy in Nova Scotia is sustainable over the long term is somewhat sensitive to alternative demographic and health spending assumptions (Figure 5-6). In particular, under a demographic scenario with an older population or a scenario in which there is excess cost growth in health care spending (+0.25 percentage points annually), fiscal policy would not be sustainable over the long term.
Fiscal gap sensitivity: Nova Scotia % of GDP
Source: Parliamentary Budget Officer.
0.9
-3.0
-0.4
0.4 0.6 1.1 1.3 1.5
3.8 4.6
6.5 7.2
-4
-2
0
2
4
6
8
10
Cons
olid
ated
sub
natio
nal
Que
bec
Nov
a Sc
otia O
ntar
io
Briti
sh C
olum
bia
Sask
atch
ewan
Prin
ce E
dwar
d Is
land
New
Bru
nsw
ick
Man
itoba
Albe
rta
New
foun
dlan
d an
dLa
brad
or
Terr
itorie
s
-0.8
-0.2
-1.3
0.6
-0.5
-0.3
-0.5
-0.3
-0.3
-0.5
0.2
-0.4
-2 -1 0 1
100% debt-to-GDP endpoint
0% debt-to-GDP endpoint
Lower health spending growth
Higher health spending growth
Lower interest rates
Higher interest rates
Lower GDP growth
Higher GDP growth
Interprovincial immigration
Younger population
Older population
Baseline
Figure 5-5
Figure 5-6

Fiscal Sustainability Report 2017
37
6. New Brunswick• Beyond 2027, the population of New Brunswick is projected to decrease
by 0.3 per cent annually, on average, through to 2091. Its seniordependency ratio is projected to rise from 29.7 per cent in 2016 to56.8 per cent in 2040 and then to 63.9 per cent by 2091.
• PBO projects that real GDP growth in New Brunswick will slow from0.7 per cent annually, on average, over 2017 to 2022 to 0.4 per centannually, on average, over the long term. The subnational government’seffective interest rate is projected to average 4.3 per cent over 2017 to2091.
• Current fiscal policy in New Brunswick is not sustainable over the longterm. PBO estimates that permanent tax increases or spendingreductions amounting to 1.5 per cent of provincial GDP ($0.5 billion incurrent dollars) would be required to achieve fiscal sustainability.
• This is equivalent to a permanent 4 per cent increase in the tax burden(including federal transfers) or a 4 per cent reduction in programspending. Health care spending is the key fiscal pressure in ourprojection, increasing by 4.9 percentage points of GDP over 2020 to2091.
Demographic projection
Similar to Newfoundland and Labrador and Nova Scotia, New Brunswick‘s population is, on balance, projected to decline over the long term. The projected increase in its senior dependency ratio is the third largest (in percentage terms) among provinces.
Under the baseline demographic scenario, PBO assumes that New Brunswick’s fertility rate will rise to 1.60 over the projection period, which is 0.07 children (per woman of child-bearing age) lower than the national rate (Table 6-1). Life expectancy at birth for both sexes in New Brunswick is projected to be slightly lower than national levels over the projection period.
The net migration rate is projected to decrease from 2.1 migrants per thousand persons in 2016 to 2.0 migrants per thousand persons over the long term.
New Brunswick’s population is projected to increase marginally through 2027 but then decline by 0.3 per cent annually, on average, over 2028 to 2091. Its senior dependency ratio is projected to reach 63.9 per cent by 2091.

Fiscal Sustainability Report 2017
38
Demographic projection: New Brunswick 2016 2040 2065 2091
Total fertility rate (children per woman of child-bearing age)
1.57 1.60 1.60 1.60
Male life expectancy at birth (years)
79.8 84.2 87.6 90.0
Female life expectancy at birth (years)
84.0 86.9 89.2 91.1
Net migration rate (migrants per 1,000 persons)
2.1 2.2 2.0 2.0
Population growth (per cent)
0.3 -0.3 -0.4 -0.4
Senior dependency ratio (population 65+/population 15-64, per cent)
29.7 56.8 60.0 63.9
Sources: Statistics Canada and Parliamentary Budget Officer.
Note: The net migration rate includes both international and interprovincial migrants.
Economic projection
Decreases in New Brunswick’s working-age population combine with a projected decline in its employment rate to reduce its labour input by 0.5 per cent annually, on average, over 2017 to 2091 (Table 6-2).
Labour productivity in New Brunswick is projected to grow by 1.0 per cent annually, on average, over 2017 to 2091, which is 0.1 percentage points lower than the national rate and its historical average of 1.1 per cent.
PBO projects that real GDP growth in New Brunswick will average 0.7 per cent annually over 2017 to 2022. Beyond 2022, New Brunswick’s real GDP growth is projected to decrease to 0.4 per cent annually, on average, due to slower labour productivity and labour input growth. This is significantly lower than projected real GDP growth of 1.7 per cent at the national level as well as New Brunswick’s historical average real GDP growth of 1.9 per cent.
Growth in real GDP per capita is projected to average 0.7 per cent annually over 2017 to 2091 in New Brunswick, which is less than half of its average annual historical growth rate from 1982 to 2016. New Brunswick’s projected growth in real GDP per capita is 0.2 percentage points below the national rate over 2017 to 2091.
Economy-wide price increases, measured by GDP inflation, are projected to average 2.0 per cent annually over 2017 to 2091. New Brunswick’s nominal GDP is projected to grow by 2.5 per cent annually, on average, over 2017 to 2091, which is 2.4 percentage points below its 1982-2016 average.
We project that the effective interest rate on subnational government debt in New Brunswick will settle at 4.4 per cent, which is 9 basis points lower than
Table 6-1
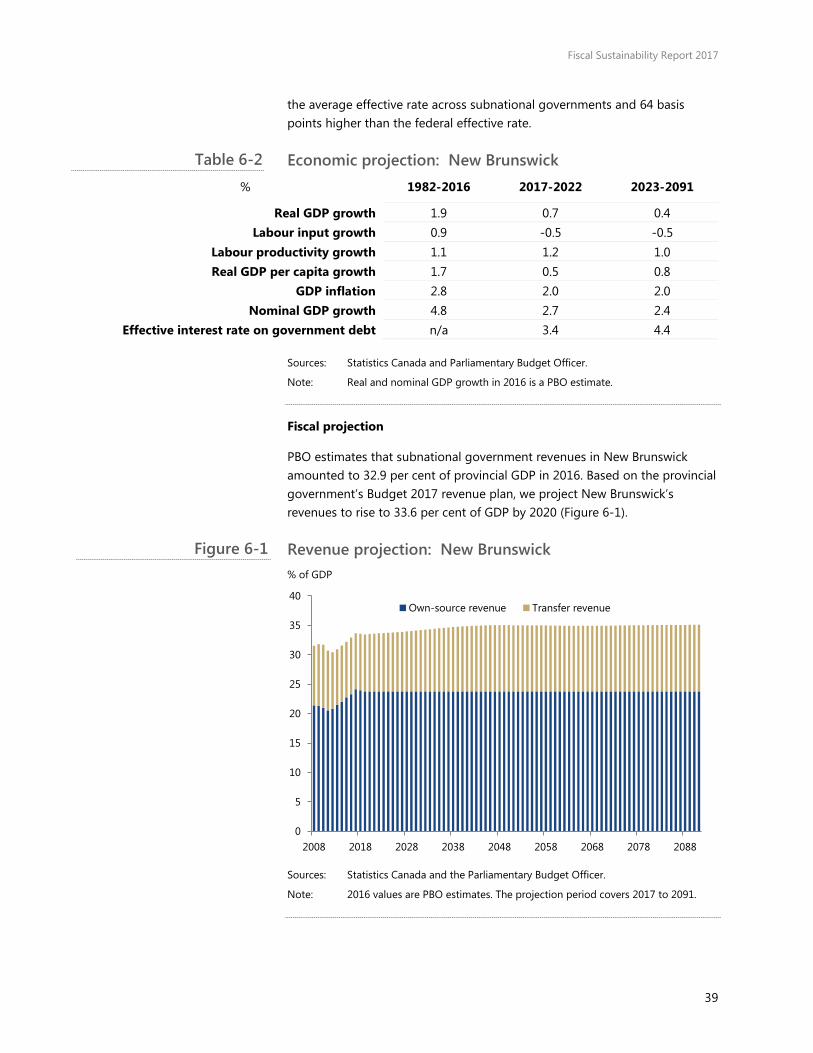
Fiscal Sustainability Report 2017
39
the average effective rate across subnational governments and 64 basis points higher than the federal effective rate.
Economic projection: New Brunswick % 1982-2016 2017-2022 2023-2091
Real GDP growth 1.9 0.7 0.4 Labour input growth 0.9 -0.5 -0.5
Labour productivity growth 1.1 1.2 1.0 Real GDP per capita growth 1.7 0.5 0.8
GDP inflation 2.8 2.0 2.0 Nominal GDP growth 4.8 2.7 2.4
Effective interest rate on government debt n/a 3.4 4.4
Sources: Statistics Canada and Parliamentary Budget Officer.
Note: Real and nominal GDP growth in 2016 is a PBO estimate.
Fiscal projection
PBO estimates that subnational government revenues in New Brunswick amounted to 32.9 per cent of provincial GDP in 2016. Based on the provincial government’s Budget 2017 revenue plan, we project New Brunswick’s revenues to rise to 33.6 per cent of GDP by 2020 (Figure 6-1).
Revenue projection: New Brunswick % of GDP
Sources: Statistics Canada and the Parliamentary Budget Officer.
Note: 2016 values are PBO estimates. The projection period covers 2017 to 2091.
0
5
10
15
20
25
30
35
40
2008 2018 2028 2038 2048 2058 2068 2078 2088
Own-source revenue Transfer revenue
Table 6-2
Figure 6-1

Fiscal Sustainability Report 2017
40
Beyond the medium term, own-source revenues, that is, revenues raised from subnational government taxes, fees and enterprises, are projected to remain at 23.8 per cent of GDP.
Transfers from the federal government, such as the Canada Health Transfer (CHT), Canada Social Transfer (CST) and Equalization, are projected to decrease to 9.8 per cent of GDP in 2020. Thereafter, we project revenue from federal transfers to rise to 11.3 per cent of provincial GDP by 2091. This is primarily due to increases in Equalization payments.
Relative to subnational government spending in New Brunswick, we project that the federal CHT contribution to health care will decrease to 18.2 per cent over the long term (Figure 6-2). This decrease reflects New Brunswick’s declining population and the impact of population ageing on its health care spending. The projected decline in the population also drives the federal CST contribution to education and social spending lower over the long term.
Federal CHT and CST contributions to subnational government spending: New Brunswick %
Source: Parliamentary Budget Officer.
New Brunswick currently has the second highest program spending as a share of GDP of any province in the country, roughly 33.7 per cent in 2016. Based on the medium-term plan set out in the provincial government’s 2017 budget, we project that subnational program spending relative to provincial GDP will fall to 32.3 percent of GDP by 2020 (Figure 6-3).
Over the long term, we project that program spending relative to the size of the provincial economy will rise steadily, reaching 36.1 per cent of GDP by 2091. This projected increase is entirely due to demographic pressures that
23.9
19.0 18.3 18.2
9.3 9.9 8.7
7.7
0
5
10
15
20
25
30
2016 2041 2066 2091
CHT share in health spending CST share in education and social spending
Figure 6-2
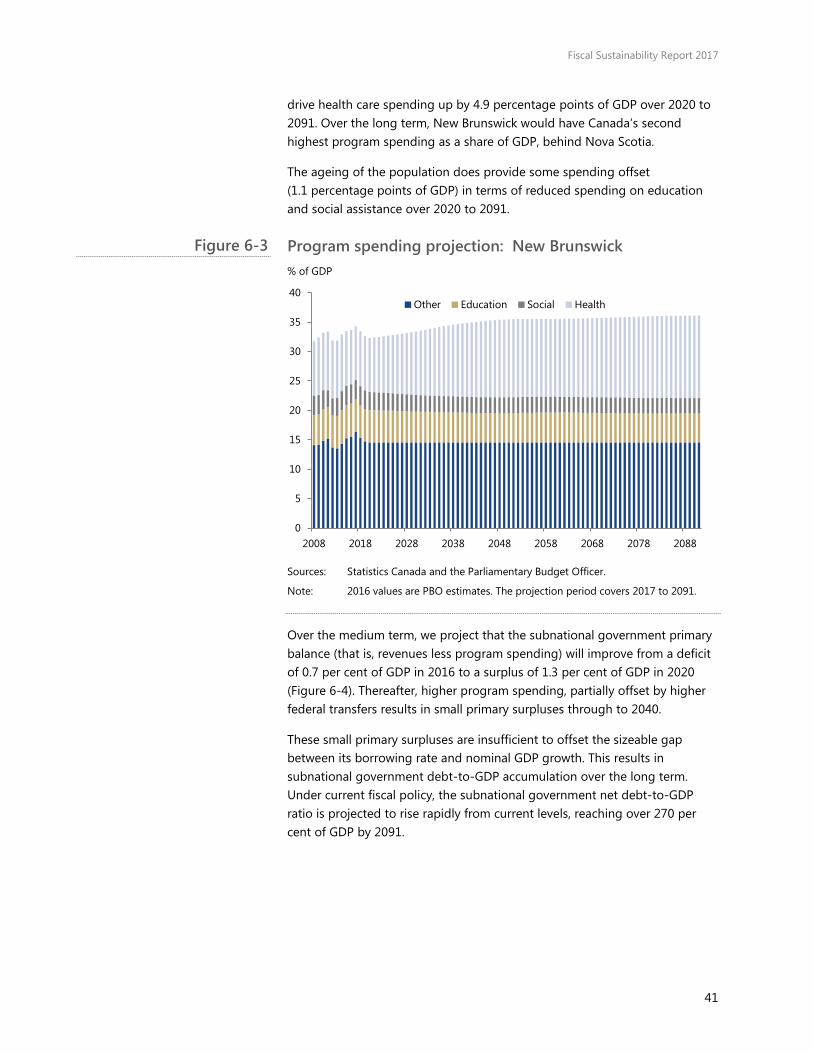
Fiscal Sustainability Report 2017
41
drive health care spending up by 4.9 percentage points of GDP over 2020 to 2091. Over the long term, New Brunswick would have Canada’s second highest program spending as a share of GDP, behind Nova Scotia.
The ageing of the population does provide some spending offset (1.1 percentage points of GDP) in terms of reduced spending on education and social assistance over 2020 to 2091.
Program spending projection: New Brunswick % of GDP
Sources: Statistics Canada and the Parliamentary Budget Officer.
Note: 2016 values are PBO estimates. The projection period covers 2017 to 2091.
Over the medium term, we project that the subnational government primary balance (that is, revenues less program spending) will improve from a deficit of 0.7 per cent of GDP in 2016 to a surplus of 1.3 per cent of GDP in 2020 (Figure 6-4). Thereafter, higher program spending, partially offset by higher federal transfers results in small primary surpluses through to 2040.
These small primary surpluses are insufficient to offset the sizeable gap between its borrowing rate and nominal GDP growth. This results in subnational government debt-to-GDP accumulation over the long term. Under current fiscal policy, the subnational government net debt-to-GDP ratio is projected to rise rapidly from current levels, reaching over 270 per cent of GDP by 2091.
0
5
10
15
20
25
30
35
40
2008 2018 2028 2038 2048 2058 2068 2078 2088
Other Education Social Health
Figure 6-3

Fiscal Sustainability Report 2017
42
Fiscal projection summary: New Brunswick % of GDP % of GDP
Source: Statistics Canada and the Parliamentary Budget Officer.
Note: 2016 values are PBO estimates. The projection period covers 2017 to 2091.
Fiscal sustainability assessment
Current fiscal policy in New Brunswick is not sustainable over the long term. PBO estimates that permanent tax increases or spending reductions amounting to 1.5 per cent of provincial GDP ($0.5 billion in current dollars) would be required to achieve fiscal sustainability (Figure 6-5). Such an adjustment would require a 4 per cent increase in the tax burden (including federal transfers) or a 4 per cent reduction in program spending, on average, relative to our baseline projection.
The contribution of New Brunswick’s fiscal gap to the consolidated subnational gap is limited given the relatively small size of its economy. We estimate that the fiscal gap in New Brunswick contributes 1 per cent (0.01 percentage points of Canadian GDP) to the consolidated subnational government fiscal gap.
0
50
100
150
200
250
300
0
5
10
15
20
25
30
35
40
45
2008 2018 2028 2038 2048 2058 2068 2078 2088
Net debt (right scale)Revenue (left scale)Program spending (left scale)
Figure 6-4
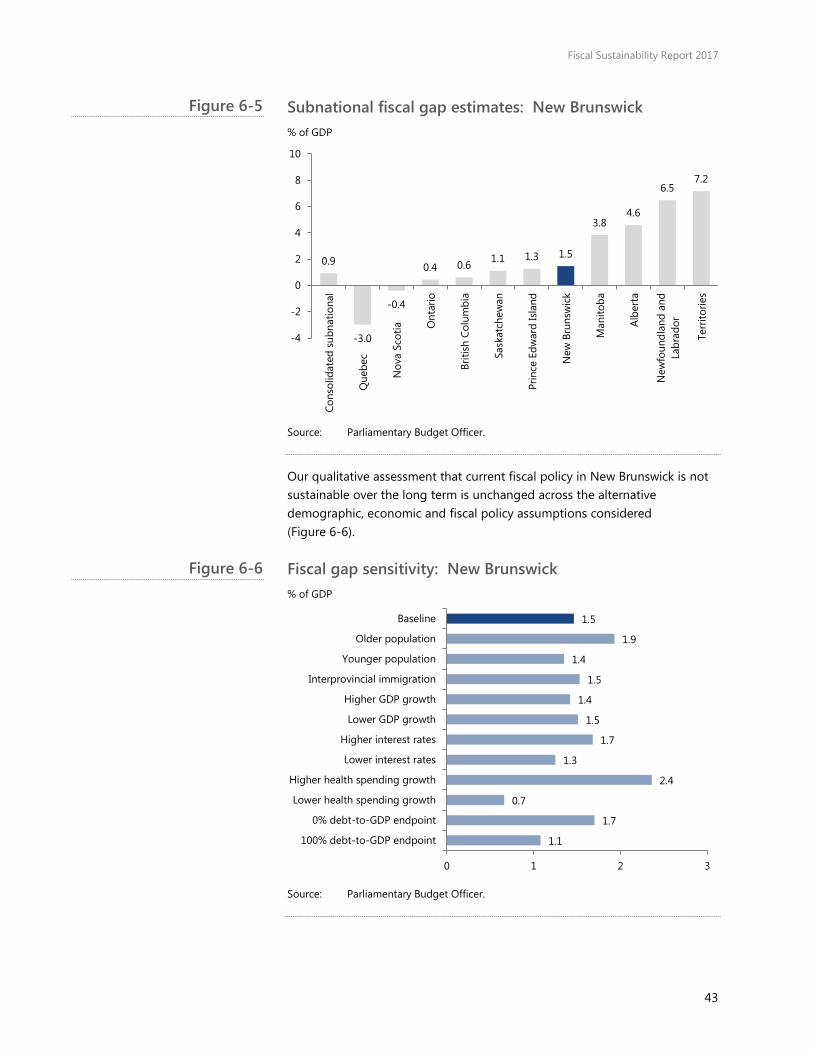
Fiscal Sustainability Report 2017
43
Subnational fiscal gap estimates: New Brunswick % of GDP
Source: Parliamentary Budget Officer.
Our qualitative assessment that current fiscal policy in New Brunswick is not sustainable over the long term is unchanged across the alternative demographic, economic and fiscal policy assumptions considered (Figure 6-6).
Fiscal gap sensitivity: New Brunswick % of GDP
Source: Parliamentary Budget Officer.
0.9
-3.0
-0.4
0.4 0.6 1.1 1.3 1.5
3.8 4.6
6.5 7.2
-4
-2
0
2
4
6
8
10
Cons
olid
ated
sub
natio
nal
Que
bec
Nov
a Sc
otia O
ntar
io
Briti
sh C
olum
bia
Sask
atch
ewan
Prin
ce E
dwar
d Is
land
New
Bru
nsw
ick
Man
itoba
Albe
rta
New
foun
dlan
d an
dLa
brad
or
Terr
itorie
s
1.1
1.7
0.7
2.4
1.3
1.7
1.5
1.4
1.5
1.4
1.9
1.5
0 1 2 3
100% debt-to-GDP endpoint
0% debt-to-GDP endpoint
Lower health spending growth
Higher health spending growth
Lower interest rates
Higher interest rates
Lower GDP growth
Higher GDP growth
Interprovincial immigration
Younger population
Older population
Baseline
Figure 6-5
Figure 6-6

Fiscal Sustainability Report 2017
44
7. Quebec • Population growth in Quebec is projected to slow from 0.8 per cent in
2016 to 0.4 per cent in 2040 and then stabilize around that rate thereafter. Its senior dependency ratio is projected to rise from 27.2 per cent in 2016 to 42.0 per cent in 2040 and then to 48.3 per cent by 2091.
• PBO projects that real GDP growth in Quebec will slow from 1.3 per cent annually, on average, over 2017 to 2022 to 1.1 per cent annually, on average, over the long term. The subnational government’s effective interest rate is projected to average 4.6 per cent over 2017 to 2091.
• Current fiscal policy in Quebec is sustainable over the long term. PBO estimates that permanent tax decreases or spending increases amounting to 3.0 per cent of provincial GDP ($11.7 billion in current dollars) could be implemented while maintaining fiscal sustainability.
• This is equivalent to a permanent 8 per cent decrease in the tax burden (including federal transfers) or a 9 per cent increase in program spending.
Demographic projection
Although growth in Quebec’s population is projected to slow from its current pace, the projected increase in its senior dependency ratio is, in percentage terms, the smallest across all provinces and territories. That said, Quebec’s senior dependency ratio is projected to increase by almost 80 per cent (21.1 percentage points) after 75 years.
Under the baseline demographic scenario, PBO assumes that Quebec’s fertility rate will be 1.70 children (per woman of child-bearing age) over the projection period, which is slightly higher than the national rate of 1.67 (Table 7-1). Male and female life expectancies at birth are projected to rise over the long term, in line with national levels.
Quebec’s net migration rate is projected to decrease from 4.7 migrants per thousand persons in 2016 to 4.1 migrants per thousand persons through to 2091.
Population growth in Quebec is projected to slow to 0.4 per cent in 2040 and then stabilize around that rate thereafter. The senior dependency ratio in Quebec is projected to reach 48.3 per cent by 2091.
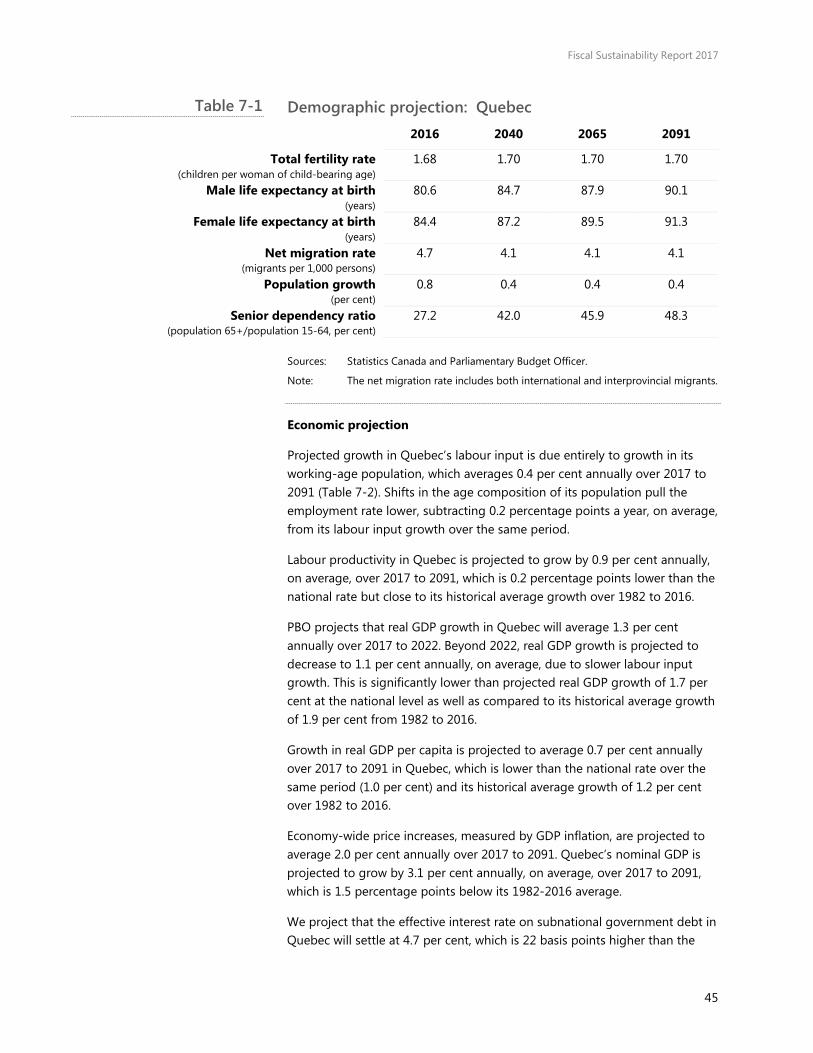
Fiscal Sustainability Report 2017
45
Demographic projection: Quebec 2016 2040 2065 2091
Total fertility rate (children per woman of child-bearing age)
1.68 1.70 1.70 1.70
Male life expectancy at birth (years)
80.6 84.7 87.9 90.1
Female life expectancy at birth (years)
84.4 87.2 89.5 91.3
Net migration rate (migrants per 1,000 persons)
4.7 4.1 4.1 4.1
Population growth (per cent)
0.8 0.4 0.4 0.4
Senior dependency ratio (population 65+/population 15-64, per cent)
27.2 42.0 45.9 48.3
Sources: Statistics Canada and Parliamentary Budget Officer.
Note: The net migration rate includes both international and interprovincial migrants.
Economic projection
Projected growth in Quebec’s labour input is due entirely to growth in its working-age population, which averages 0.4 per cent annually over 2017 to 2091 (Table 7-2). Shifts in the age composition of its population pull the employment rate lower, subtracting 0.2 percentage points a year, on average, from its labour input growth over the same period.
Labour productivity in Quebec is projected to grow by 0.9 per cent annually, on average, over 2017 to 2091, which is 0.2 percentage points lower than the national rate but close to its historical average growth over 1982 to 2016.
PBO projects that real GDP growth in Quebec will average 1.3 per cent annually over 2017 to 2022. Beyond 2022, real GDP growth is projected to decrease to 1.1 per cent annually, on average, due to slower labour input growth. This is significantly lower than projected real GDP growth of 1.7 per cent at the national level as well as compared to its historical average growth of 1.9 per cent from 1982 to 2016.
Growth in real GDP per capita is projected to average 0.7 per cent annually over 2017 to 2091 in Quebec, which is lower than the national rate over the same period (1.0 per cent) and its historical average growth of 1.2 per cent over 1982 to 2016.
Economy-wide price increases, measured by GDP inflation, are projected to average 2.0 per cent annually over 2017 to 2091. Quebec’s nominal GDP is projected to grow by 3.1 per cent annually, on average, over 2017 to 2091, which is 1.5 percentage points below its 1982-2016 average.
We project that the effective interest rate on subnational government debt in Quebec will settle at 4.7 per cent, which is 22 basis points higher than the
Table 7-1

Fiscal Sustainability Report 2017
46
average effective rate across subnational governments and 95 basis points higher than the federal effective rate.
Economic projection: Quebec % 1982-2016 2017-2022 2023-2091
Real GDP growth 1.9 1.3 1.1 Labour input growth 1.0 0.2 0.3
Labour productivity growth 0.9 1.1 0.8 Real GDP per capita growth 1.2 0.5 0.7
GDP inflation 2.7 1.9 2.0 Nominal GDP growth 4.6 3.3 3.1
Effective interest rate on government debt n/a 3.8 4.7
Sources: Statistics Canada and Parliamentary Budget Officer.
Note: Real and nominal GDP growth in 2016 is a PBO estimate.
Fiscal projection
PBO estimates that subnational government revenues in Quebec amounted to 34.9 per cent of provincial GDP in 2016, the highest of any province. Based on the provincial government’s Budget 2017 revenue plan, we project Quebec’s revenues to rise to 35.3 per cent of GDP by 2020 (Figure 7-1).
Revenue projection: Quebec % of GDP
Sources: Statistics Canada and the Parliamentary Budget Officer.
Note: 2016 values are PBO estimates. The projection period covers 2017 to 2091.
0
5
10
15
20
25
30
35
40
2008 2018 2028 2038 2048 2058 2068 2078 2088
Own-source revenue Transfer revenue
Table 7-2
Figure 7-1

Fiscal Sustainability Report 2017
47
Beyond the medium term, own-source revenues, that is, revenues raised from subnational government taxes, fees and enterprises, are projected to remain at 29.2 per cent of GDP.
Transfers from the federal government, such as the Canada Health Transfer (CHT), Canada Social Transfer (CST) and Equalization, are projected to rise to 6.0 per cent of GDP in 2020 and reach 8.3 per cent of provincial GDP by 2091.
In our projections, Quebec’s share of the total federal Equalization envelope increases from 60 per cent in 2017 to 75 per cent in 2091. On a per capita basis, we project that both New Brunswick and Nova Scotia will receive larger Equalization payments than Quebec over the long term.
Relative to subnational government spending in Quebec, we project that the federal CHT contribution to health care will decrease from 25.6 per cent in 2016 to 23.0 per by 2091 (Figure 7-2). This decrease reflects slower growth in Quebec’s population (relative to population growth nationally) and the impact of population ageing on its health care spending. Slower population growth also drives the federal CST contribution to education and social spending lower over the long term.
Federal CHT and CST contributions to subnational government spending: Quebec %
Source: Parliamentary Budget Officer.
Note: Federal CHT and CST contributions are presented on a gross basis (that is, before adjusting for the Quebec abatement).
Quebec’s program spending was 31.1 per cent of GDP in 2016. Based on the medium-term plan set out in the provincial government’s 2017 budget, we
25.6
22.0 22.3 23.0
8.6 8.3 7.6 6.9
0
5
10
15
20
25
30
2016 2041 2066 2091
CHT share in health spending
CST share in education and social spending
Figure 7-2

Fiscal Sustainability Report 2017
48
project that program spending relative to provincial GDP will fall to 30.6 percent of GDP in 2020 (Figure 7-3).
Over the long term, we project that program spending relative to the size of the provincial economy will rise steadily, reaching 32.7 per cent of GDP by 2091. This projected increase is entirely due to demographic pressures that drive health care spending up by 3.0 percentage points of GDP over 2020 to 2091.
The ageing of the population does provide some spending offset (0.7 percentage points of GDP) in terms of reduced spending on education and social assistance over 2020 to 2091.
Program spending projection: Quebec % of GDP
Sources: Statistics Canada and the Parliamentary Budget Officer.
Note: 2016 values are PBO estimates. The projection period covers 2017 to 2091.
Over the medium term, we project that the subnational government primary balance (that is, revenues less program spending) will improve from a surplus of 3.8 per cent of GDP in 2016 to a surplus of 4.7 per cent of GDP in 2020 (Figure 7-4). Thereafter, increased federal transfers raise the primary surplus to 4.9 per cent of GDP by the end of the projection horizon.
A sustained primary surplus eliminates subnational net debt by 2031. Under current fiscal policy, the subnational government sector is projected to accumulate net financial assets of 370 per cent of GDP by 2091.
0
5
10
15
20
25
30
35
40
2008 2018 2028 2038 2048 2058 2068 2078 2088
Other Education Social Health
Figure 7-3

Fiscal Sustainability Report 2017
49
Fiscal projection summary: Quebec % of GDP % of GDP
Sources: Statistics Canada and the Parliamentary Budget Officer.
Note: 2016 values are PBO estimates. The projection period covers 2017 to 2091.
Fiscal sustainability assessment
Current fiscal policy in Quebec is sustainable over the long term. PBO estimates that permanent tax reductions or spending increases amounting to 3.0 per cent of provincial GDP ($11.7 billion in current dollars) could be implemented while maintaining fiscal sustainability (Figure 7-5). Such an adjustment would permit an 8 per cent reduction in the tax burden (including federal transfers) or a 9 per cent increase in program spending, on average, relative to our baseline projection.
We estimate that the fiscal room in Quebec offsets 27 per cent (0.34 percentage points of Canadian GDP) of the consolidated subnational government fiscal gap attributable to other provinces (1.27 percentage points).
-400
-350
-300
-250
-200
-150
-100
-50
0
50
100
0
5
10
15
20
25
30
35
40
45
50
2008 2018 2028 2038 2048 2058 2068 2078 2088
Net debt (right scale)Revenue (left scale)Program spending (left scale)
Figure 7-4
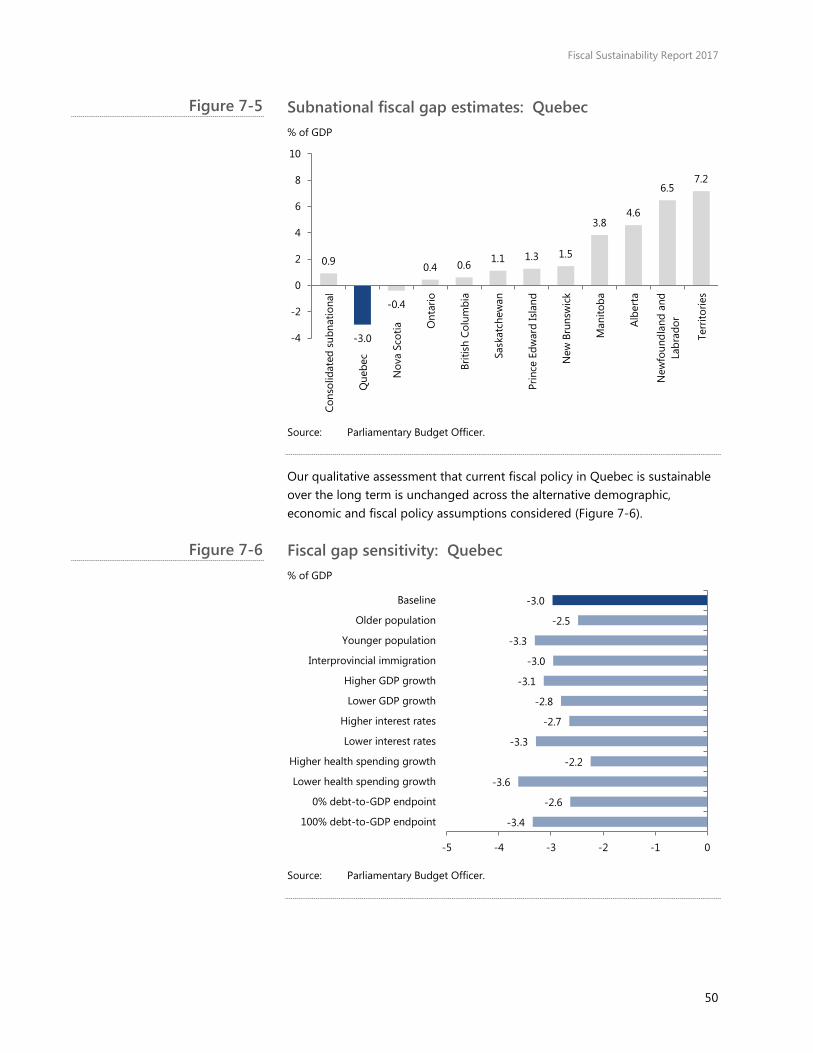
Fiscal Sustainability Report 2017
50
Subnational fiscal gap estimates: Quebec % of GDP
Source: Parliamentary Budget Officer.
Our qualitative assessment that current fiscal policy in Quebec is sustainable over the long term is unchanged across the alternative demographic, economic and fiscal policy assumptions considered (Figure 7-6).
Fiscal gap sensitivity: Quebec % of GDP
Source: Parliamentary Budget Officer.
0.9
-3.0
-0.4
0.4 0.6 1.1 1.3 1.5
3.8 4.6
6.5 7.2
-4
-2
0
2
4
6
8
10
Cons
olid
ated
sub
natio
nal
Que
bec
Nov
a Sc
otia O
ntar
io
Briti
sh C
olum
bia
Sask
atch
ewan
Prin
ce E
dwar
d Is
land
New
Bru
nsw
ick
Man
itoba
Albe
rta
New
foun
dlan
d an
dLa
brad
or
Terr
itorie
s
-3.4
-2.6
-3.6
-2.2
-3.3
-2.7
-2.8
-3.1
-3.0
-3.3
-2.5
-3.0
-5 -4 -3 -2 -1 0
100% debt-to-GDP endpoint
0% debt-to-GDP endpoint
Lower health spending growth
Higher health spending growth
Lower interest rates
Higher interest rates
Lower GDP growth
Higher GDP growth
Interprovincial immigration
Younger population
Older population
Baseline
Figure 7-5
Figure 7-6

Fiscal Sustainability Report 2017
51
8. Ontario• Population growth in Ontario is projected to slow from 1.3 per cent in
2016 to 0.6 per cent in 2040 and then stabilize around that ratethereafter. Its senior dependency ratio is projected to rise from 24.2 percent in 2016 to 40.9 per cent in 2040 and then to 48.1 per cent by 2091.
• PBO projects that real GDP growth in Ontario will slow from 2.0 per centannually, on average, over 2017 to 2022 to 1.6 per cent annually, onaverage, over the long term. The subnational government’s effectiveinterest rate is projected to average 4.4 per cent over 2017 to 2091.
• Current fiscal policy in Ontario is not sustainable over the long term. PBOestimates that permanent tax increases or spending reductionsamounting to 0.4 per cent of provincial GDP ($3.5 billion in currentdollars) would be required to achieve fiscal sustainability.
• This is equivalent to a permanent 2 per cent increase in the tax burden(including federal transfers) or a 2 per cent reduction in programspending. Health care spending is the key fiscal pressure in ourprojection, increasing by 2.6 percentage points of GDP over 2020 to2091.
Demographic projection
Population growth in Ontario is projected to fall below the national rate over the projection horizon while its senior dependency ratio is projected to rise above the national level after 2028.
Under the baseline demographic scenario, PBO assumes that Ontario’s fertility rate will be 1.58 over the projection period, which is 0.09 children (per woman of child-bearing age) lower than the national rate (Table 8-1). Life expectancy at birth for both sexes in Ontario is projected to be higher than national levels over the projection period.
The net migration rate is projected to decrease from 6.4 migrants per thousand persons in 2016 to 5.6 migrants per thousand persons over the long term.
Population growth in Ontario is projected to slow to 0.6 per cent in 2040 and then stabilize around that rate thereafter. The senior dependency ratio in Ontario is projected to reach 48.1 per cent by 2091.
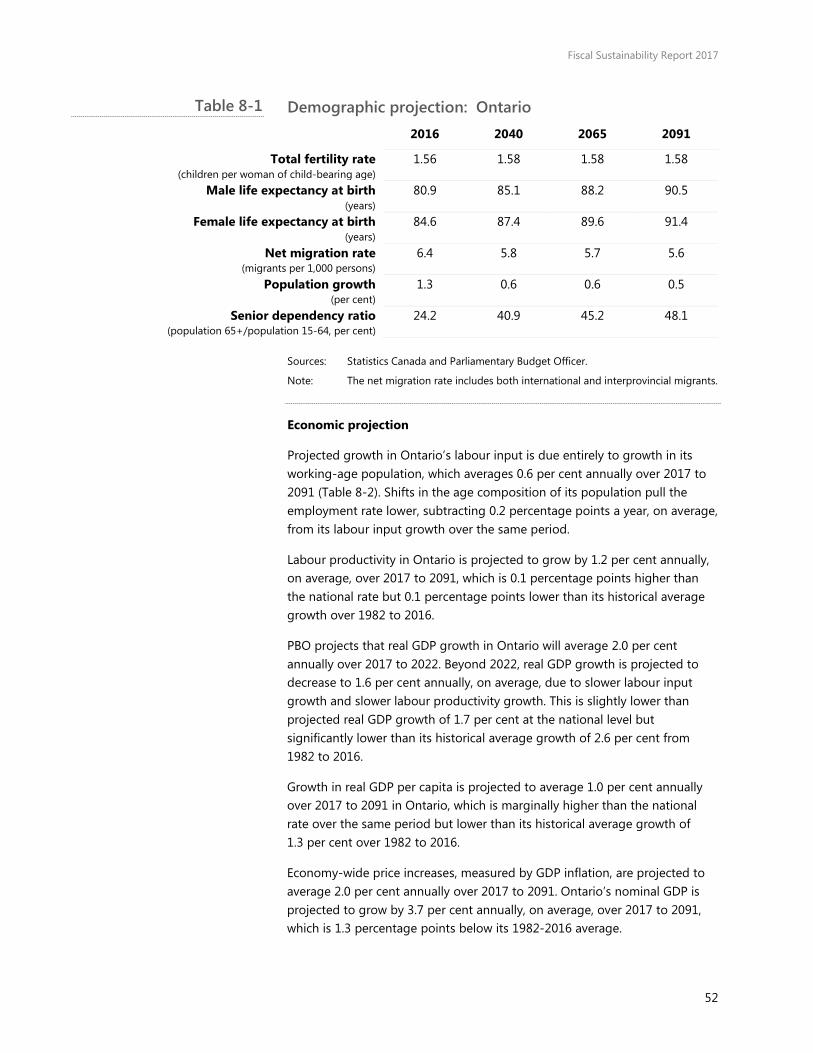
Fiscal Sustainability Report 2017
52
Demographic projection: Ontario 2016 2040 2065 2091
Total fertility rate (children per woman of child-bearing age)
1.56 1.58 1.58 1.58
Male life expectancy at birth (years)
80.9 85.1 88.2 90.5
Female life expectancy at birth (years)
84.6 87.4 89.6 91.4
Net migration rate (migrants per 1,000 persons)
6.4 5.8 5.7 5.6
Population growth (per cent)
1.3 0.6 0.6 0.5
Senior dependency ratio (population 65+/population 15-64, per cent)
24.2 40.9 45.2 48.1
Sources: Statistics Canada and Parliamentary Budget Officer.
Note: The net migration rate includes both international and interprovincial migrants.
Economic projection
Projected growth in Ontario’s labour input is due entirely to growth in its working-age population, which averages 0.6 per cent annually over 2017 to 2091 (Table 8-2). Shifts in the age composition of its population pull the employment rate lower, subtracting 0.2 percentage points a year, on average, from its labour input growth over the same period.
Labour productivity in Ontario is projected to grow by 1.2 per cent annually, on average, over 2017 to 2091, which is 0.1 percentage points higher than the national rate but 0.1 percentage points lower than its historical average growth over 1982 to 2016.
PBO projects that real GDP growth in Ontario will average 2.0 per cent annually over 2017 to 2022. Beyond 2022, real GDP growth is projected to decrease to 1.6 per cent annually, on average, due to slower labour input growth and slower labour productivity growth. This is slightly lower than projected real GDP growth of 1.7 per cent at the national level but significantly lower than its historical average growth of 2.6 per cent from 1982 to 2016.
Growth in real GDP per capita is projected to average 1.0 per cent annually over 2017 to 2091 in Ontario, which is marginally higher than the national rate over the same period but lower than its historical average growth of 1.3 per cent over 1982 to 2016.
Economy-wide price increases, measured by GDP inflation, are projected to average 2.0 per cent annually over 2017 to 2091. Ontario’s nominal GDP is projected to grow by 3.7 per cent annually, on average, over 2017 to 2091, which is 1.3 percentage points below its 1982-2016 average.
Table 8-1

Fiscal Sustainability Report 2017
53
We project that the effective interest rate on subnational government debt in Ontario will settle at 4.6 per cent, which is 7 basis points higher than the average effective rate across subnational governments and 80 basis points higher than the federal effective rate.
Economic projection: Ontario % 1982-2016 2017-2022 2023-2091
Real GDP growth 2.6 2.0 1.6 Labour input growth 1.3 0.7 0.4
Labour productivity growth 1.3 1.4 1.2 Real GDP per capita growth 1.3 1.1 1.0
GDP inflation 2.7 2.0 2.0 Nominal GDP growth 5.3 4.1 3.6
Effective interest rate on government debt n/a 3.2 4.5
Sources: Statistics Canada and Parliamentary Budget Officer.
Note: Real and nominal GDP growth in 2016 is a PBO estimate.
Fiscal projection
PBO estimates that subnational government revenues in Ontario amounted to 24.1 per cent of provincial GDP in 2016. Based on the provincial government’s Budget 2017 revenue plan, we project Ontario’s revenues to decrease to 23.9 per cent of GDP by 2020 (Figure 8-1).
Revenue projection: Ontario % of GDP
Sources: Statistics Canada and the Parliamentary Budget Officer.
Note: 2016 values are PBO estimates. The projection period covers 2017 to 2091.
0
5
10
15
20
25
30
2008 2018 2028 2038 2048 2058 2068 2078 2088
Own-source revenue Transfer revenue
Table 8-2
Figure 8-1
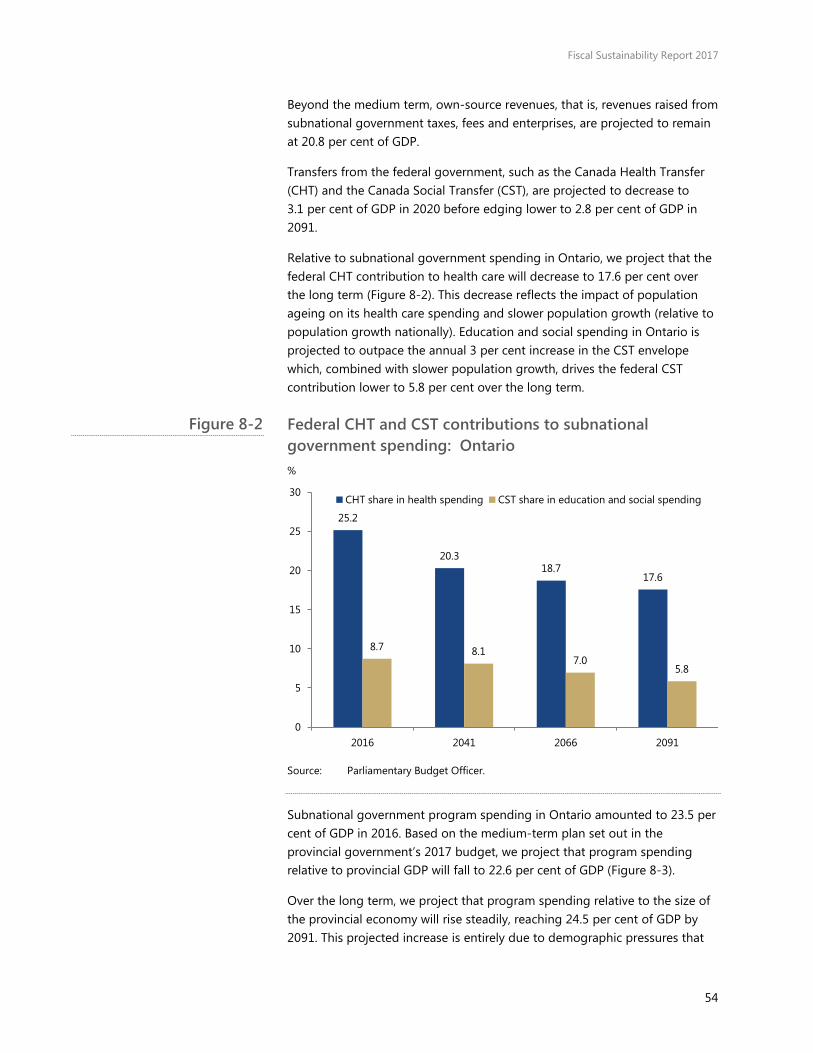
Fiscal Sustainability Report 2017
54
Beyond the medium term, own-source revenues, that is, revenues raised from subnational government taxes, fees and enterprises, are projected to remain at 20.8 per cent of GDP.
Transfers from the federal government, such as the Canada Health Transfer (CHT) and the Canada Social Transfer (CST), are projected to decrease to 3.1 per cent of GDP in 2020 before edging lower to 2.8 per cent of GDP in 2091.
Relative to subnational government spending in Ontario, we project that the federal CHT contribution to health care will decrease to 17.6 per cent over the long term (Figure 8-2). This decrease reflects the impact of population ageing on its health care spending and slower population growth (relative to population growth nationally). Education and social spending in Ontario is projected to outpace the annual 3 per cent increase in the CST envelope which, combined with slower population growth, drives the federal CST contribution lower to 5.8 per cent over the long term.
Federal CHT and CST contributions to subnational government spending: Ontario %
Source: Parliamentary Budget Officer.
Subnational government program spending in Ontario amounted to 23.5 per cent of GDP in 2016. Based on the medium-term plan set out in the provincial government’s 2017 budget, we project that program spending relative to provincial GDP will fall to 22.6 per cent of GDP (Figure 8-3).
Over the long term, we project that program spending relative to the size of the provincial economy will rise steadily, reaching 24.5 per cent of GDP by 2091. This projected increase is entirely due to demographic pressures that
25.2
20.3 18.7
17.6
8.7 8.1 7.0
5.8
0
5
10
15
20
25
30
2016 2041 2066 2091
CHT share in health spending CST share in education and social spending
Figure 8-2

Fiscal Sustainability Report 2017
55
drive health care spending up by 2.6 percentage points of GDP over 2020 to 2091.
The ageing of the population does provide some spending offset (0.7 percentage points of GDP) in terms of reduced spending on education and social assistance over 2020 to 2091.
Program spending projection: Ontario % of GDP
Sources: Statistics Canada and the Parliamentary Budget Officer.
Note: 2016 values are PBO estimates. The projection period covers 2017 to 2091.
Over the medium term, we project that the subnational government primary balance (that is, revenues less program spending) will improve from a surplus of 0.7 per cent of GDP in 2016 to a surplus of 1.4 per cent of GDP in 2020 (Figure 8-4). Thereafter, however, increased program spending and lower federal transfers combine to erode the primary balance from a surplus to a deficit in 2042, which reaches 0.9 per cent of GDP by the end of the projection horizon.
Persistent projected primary deficits drive subnational government debt-to-GDP accumulation over the long term. Under current fiscal policy, the subnational government net debt-to-GDP ratio is projected to reach over 80 per cent of GDP by 2091.
0
5
10
15
20
25
30
2008 2018 2028 2038 2048 2058 2068 2078 2088
Other Education Social Health
Figure 8-3

Fiscal Sustainability Report 2017
56
Fiscal projection summary: Ontario % of GDP % of GDP
Sources: Statistics Canada and the Parliamentary Budget Officer.
Note: 2016 values are PBO estimates. The projection period covers 2017 to 2091.
Fiscal sustainability assessment
Current fiscal policy in Ontario is not sustainable over the long term. PBO estimates that permanent tax increases or spending reductions amounting to 0.4 per cent of provincial GDP ($3.5 billion in current dollars) would be required to achieve fiscal sustainability (Figure 8-5). Such an adjustment would require a 2 per cent increase in the tax burden (including federal transfers) or a 2 per cent reduction in program spending, on average, relative to our baseline projection.
We estimate that Ontario’s fiscal gap contributes 14 per cent (0.13 percentage points of Canadian GDP) to the consolidated subnational government fiscal gap.
0
10
20
30
40
50
60
70
80
90
0
5
10
15
20
25
30
2008 2018 2028 2038 2048 2058 2068 2078 2088
Net debt (right scale)Revenue (left scale)Program spending (left scale)
Figure 8-4
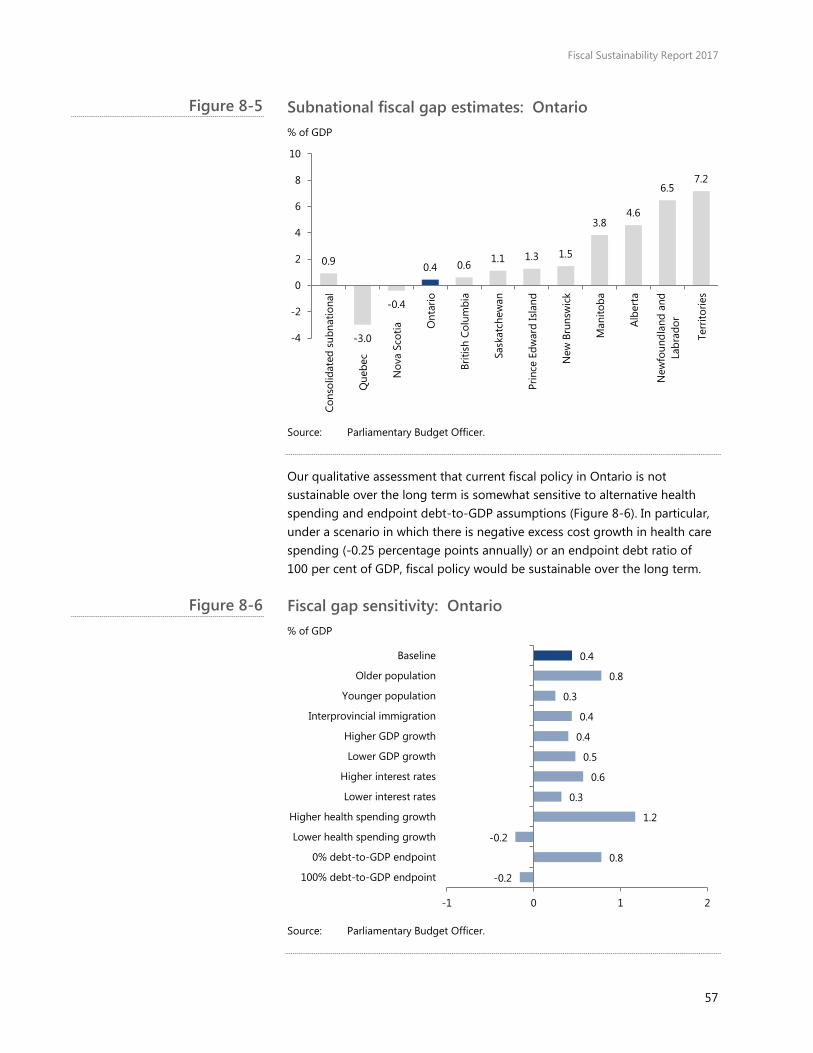
Fiscal Sustainability Report 2017
57
Subnational fiscal gap estimates: Ontario % of GDP
Source: Parliamentary Budget Officer.
Our qualitative assessment that current fiscal policy in Ontario is not sustainable over the long term is somewhat sensitive to alternative health spending and endpoint debt-to-GDP assumptions (Figure 8-6). In particular, under a scenario in which there is negative excess cost growth in health care spending (-0.25 percentage points annually) or an endpoint debt ratio of 100 per cent of GDP, fiscal policy would be sustainable over the long term.
Fiscal gap sensitivity: Ontario % of GDP
Source: Parliamentary Budget Officer.
0.9
-3.0
-0.4
0.4 0.6 1.1 1.3 1.5
3.8 4.6
6.5 7.2
-4
-2
0
2
4
6
8
10
Cons
olid
ated
sub
natio
nal
Que
bec
Nov
a Sc
otia O
ntar
io
Briti
sh C
olum
bia
Sask
atch
ewan
Prin
ce E
dwar
d Is
land
New
Bru
nsw
ick
Man
itoba
Albe
rta
New
foun
dlan
d an
dLa
brad
or
Terr
itorie
s
-0.2
0.8
-0.2
1.2
0.3
0.6
0.5
0.4
0.4
0.3
0.8
0.4
-1 0 1 2
100% debt-to-GDP endpoint
0% debt-to-GDP endpoint
Lower health spending growth
Higher health spending growth
Lower interest rates
Higher interest rates
Lower GDP growth
Higher GDP growth
Interprovincial immigration
Younger population
Older population
Baseline
Figure 8-5
Figure 8-6

Fiscal Sustainability Report 2017
58
9. Manitoba • Population growth in Manitoba is projected to slow from 1.7 per cent in
2016 to 0.9 per cent in 2040 and then stabilize around that rate thereafter. Its senior dependency ratio is projected to rise from 22.7 per cent in 2016 to 32.9 per cent in 2040 and then to 40.6 per cent by 2091.
• PBO projects that real GDP growth in Manitoba will slow from 2.2 per cent annually, on average, over 2017 to 2022 to 2.0 per cent annually, on average, over the long term. The subnational government’s effective interest rate is projected to average 4.5 per cent over 2017 to 2091.
• Current fiscal policy in Manitoba is not sustainable over the long term. PBO estimates that permanent tax increases or spending reductions amounting to 3.8 per cent of provincial GDP ($2.6 billion in current dollars) would be required to achieve fiscal sustainability.
• This is equivalent to a permanent 14 per cent increase in the tax burden (including federal transfers) or a 13 per cent reduction in program spending. Health care spending is the key fiscal pressure in our projection, increasing by 3.0 percentage points of GDP over 2020 to 2091.
Demographic projection
Although growth in its population is projected to slow over the long term, Manitoba’s population growth is projected to remain above the national rate. The projected increase in Manitoba’s senior dependency ratio is the second smallest, in percentage terms, among provinces and territories.
Under the baseline demographic scenario, PBO assumes that Manitoba’s fertility rate will remain around 1.94 over the projection, which is 0.27 children (per woman of child-bearing age) higher than the national rate (Table 9-1). Life expectancy at birth for both sexes in Manitoba is projected to be lower than national levels over the projection period.
Manitoba’s net migration rate is projected to decline from 6.5 migrants per thousand persons in 2016 to 4.6 migrants per thousand persons over the long term.
Population growth in Manitoba is projected to slow to 0.9 per cent in 2040 and then stabilize around that rate thereafter. The senior dependency ratio in Manitoba is projected to rise to 40.6 per cent by 2091.

Fiscal Sustainability Report 2017
59
Demographic projection: Manitoba 2016 2040 2065 2091
Total fertility rate (children per woman of child-bearing age)
1.93 1.94 1.94 1.94
Male life expectancy at birth (years)
79.2 84.0 87.5 89.9
Female life expectancy at birth (years)
83.1 86.5 89.1 91.0
Net migration rate (migrants per 1,000 persons)
6.5 5.2 4.9 4.6
Population growth (per cent)
1.7 0.9 0.9 0.8
Senior dependency ratio (population 65+/population 15-64, per cent)
22.7 32.9 37.7 40.6
Sources: Statistics Canada and Parliamentary Budget Officer.
Note: The net migration rate includes both international and interprovincial migrants.
Economic projection
Projected growth in Manitoba’s labour input is due entirely to growth in its working-age population, which averages 0.9 per cent annually over 2017 to 2091 (Table 9-2). Shifts in the age composition of its population pull the employment rate lower, subtracting 0.2 percentage points a year, on average, from its labour input growth over the same period.
Labour productivity in Manitoba is projected to grow by 1.2 per cent annually, on average, over 2017 to 2091, which is 0.1 percentage points higher than the national rate but 0.2 percentage points lower than its historical average growth over 1982 to 2016.
PBO projects that real GDP growth in Manitoba will average 2.2 per cent annually over 2017 to 2022. Beyond 2022, real GDP growth is projected to decrease to 2.0 per cent annually, on average, due to slower labour input growth. This is higher than projected real GDP growth of 1.7 per cent at the national level but slightly lower than its historical average growth of 2.1 per cent from 1982 to 2016.
Growth in real GDP per capita is projected to average 1.1 per cent annually over 2017 to 2091 in Manitoba, which is 0.2 percentage points higher than the national rate over the same period but lower its historical average growth of 1.4 per cent over 1982 to 2016.
Economy-wide price increases, measured by GDP inflation, are projected to average 2.0 per cent annually over 2017 to 2091. Manitoba’s nominal GDP is projected to grow by 4.1 per cent annually, on average, over 2017 to 2091, which is 0.6 percentage points below its 1982-2016 average annual growth.
Table 9-1

Fiscal Sustainability Report 2017
60
We project that the effective interest rate on subnational government debt in Manitoba will settle at 4.6 per cent, which is 6 basis points higher than the average effective rate across subnational governments and 79 basis points higher than the federal effective rate.
Economic projection: Manitoba % 1982-2016 2017-2022 2023-2091
Real GDP growth 2.1 2.2 2.0 Labour input growth 0.7 0.9 0.7
Labour productivity growth 1.4 1.2 1.3 Real GDP per capita growth 1.4 1.0 1.1
GDP inflation 2.5 2.0 2.0 Nominal GDP growth 4.7 4.2 4.0
Effective interest rate on government debt n/a 3.5 4.5
Sources: Statistics Canada and Parliamentary Budget Officer.
Note: Real and nominal GDP growth in 2016 is a PBO estimate.
Fiscal projection
PBO estimates that subnational government revenues in Manitoba amounted to 29.6 per cent of provincial GDP in 2016. Based on the provincial government’s Budget 2017 revenue plan, we project Manitoba’s revenues to decrease to 28.8 per cent of GDP by 2020 (Figure 9-1).
Revenue projection: Manitoba % of GDP
Sources: Statistics Canada and the Parliamentary Budget Officer.
Note: 2016 values are PBO estimates. The projection period covers 2017 to 2091.
0
5
10
15
20
25
30
35
2008 2018 2028 2038 2048 2058 2068 2078 2088
Own-source revenue Transfer revenue
Table 9-2
Figure 9-1

Fiscal Sustainability Report 2017
61
Beyond the medium term, own-source revenues, that is, revenues raised from subnational government taxes, fees and enterprises, are projected to remain at 21.1 per cent of GDP.
Transfers from the federal government, such as the Canada Health Transfer (CHT), Canada Social Transfer (CST) and Equalization, are projected to rise to 7.7 per cent of GDP in 2020 before declining gradually to 4.4 per cent of provincial GDP by 2091. Falling Equalization payments are primarily responsible for the decrease in federal transfers.
Relative to subnational government spending in Manitoba, we project that the federal CHT contribution to health care will decrease to 14.4 per cent over the long term (Figure 9-2). This decrease reflects the impact of population ageing on Manitoba’s health care spending and faster growth in nominal GDP (relative to nominal GDP growth nationally). Education and social spending in Manitoba is projected to outpace the annual 3 per cent increase in the CST envelope, which drives the federal CST contribution lower to 5.4 per cent over the long term.
Federal CHT and CST contributions to subnational government spending: Manitoba %
Source: Parliamentary Budget Officer.
Subnational government program spending in Manitoba amounted to 30.3 per cent of GDP in 2016. Based on the medium-term plan set out in the provincial government’s 2017 budget, we project that program spending relative to provincial GDP will fall to 28.8 per cent of GDP by 2020 (Figure 9-3).
20.7
17.4 15.7
14.4
8.7 7.9 6.6
5.4
0
5
10
15
20
25
30
2016 2041 2066 2091
CHT share in health spending CST share in education and social spending
Figure 9-2

Fiscal Sustainability Report 2017
62
Over the long term, we project that program spending relative to the size of the provincial economy will rise steadily, reaching 31.3 per cent of GDP by 2091. This projected increase is entirely due to demographic pressures that drive health care spending up by 3.0 percentage points of GDP over 2020 to 2091.
The ageing of the population does provide some spending offset (0.5 percentage points of GDP) in terms of reduced spending on education and social assistance over 2020 to 2091.
Program spending projection: Manitoba % of GDP
Sources: Statistics Canada and the Parliamentary Budget Officer.
Note: 2016 values are PBO estimates. The projection period covers 2017 to 2091.
Over the medium term, we project that the subnational government primary balance (that is, revenues less program spending) will improve from a deficit of 0.7 per cent of GDP in 2016 to a deficit of 0.1 per cent of GDP in 2020 (Figure 9-4). Thereafter, however, increased program spending and lower federal transfers combine to expand the deficit to 5.8 per cent of GDP by the end of the projection horizon.
Large and expanding projected primary deficits drive subnational government debt-to-GDP accumulation over the long term. Under current fiscal policy, the subnational government net debt-to-GDP ratio is projected to rise rapidly from current levels, reaching over 380 per cent of GDP by 2091.
0
5
10
15
20
25
30
35
2008 2018 2028 2038 2048 2058 2068 2078 2088
Other Education Social Health
Figure 9-3

Fiscal Sustainability Report 2017
63
Fiscal projection summary: Manitoba % of GDP % of GDP
Sources: Statistics Canada and the Parliamentary Budget Officer.
Note: 2016 values are PBO estimates. The projection period covers 2017 to 2091.
Fiscal sustainability assessment
Current fiscal policy in Manitoba is not sustainable over the long term. PBO estimates that permanent tax increases or spending reductions amounting to 3.8 per cent of provincial GDP ($2.6 billion in current dollars) would be required to achieve fiscal sustainability (Figure 9-5). Such an adjustment would require a 14 per cent increase in the tax burden (including federal transfers) or a 13 per cent reduction in program spending, on average, relative to the baseline projection.
We estimate that the Manitoba’s fiscal gap contributes 12 per cent (0.11 percentage points of Canadian GDP) to the consolidated subnational government fiscal gap.
0
50
100
150
200
250
300
350
400
450
0
5
10
15
20
25
30
35
40
2008 2018 2028 2038 2048 2058 2068 2078 2088
Net debt (right scale)Revenue (left scale)Program spending (left scale)
Figure 9-4
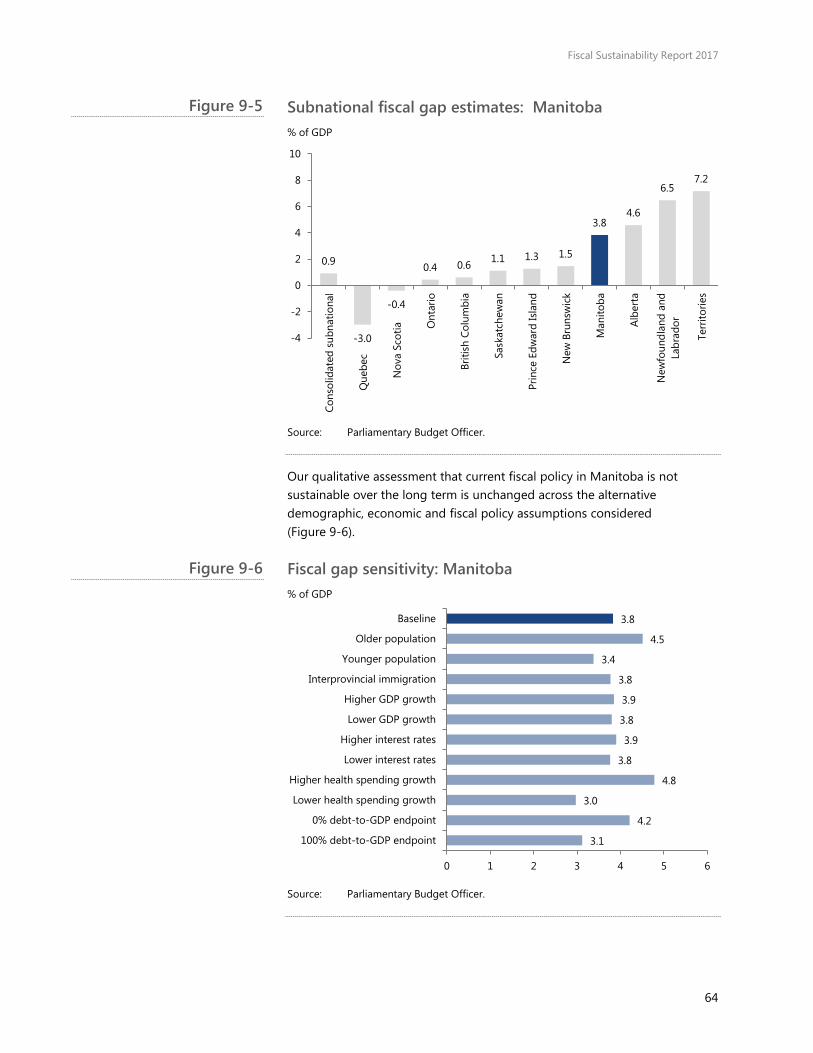
Fiscal Sustainability Report 2017
64
Subnational fiscal gap estimates: Manitoba % of GDP
Source: Parliamentary Budget Officer.
Our qualitative assessment that current fiscal policy in Manitoba is not sustainable over the long term is unchanged across the alternative demographic, economic and fiscal policy assumptions considered (Figure 9-6).
Fiscal gap sensitivity: Manitoba % of GDP
Source: Parliamentary Budget Officer.
0.9
-3.0
-0.4
0.4 0.6 1.1 1.3 1.5
3.8 4.6
6.5 7.2
-4
-2
0
2
4
6
8
10
Cons
olid
ated
sub
natio
nal
Que
bec
Nov
a Sc
otia O
ntar
io
Briti
sh C
olum
bia
Sask
atch
ewan
Prin
ce E
dwar
d Is
land
New
Bru
nsw
ick
Man
itoba
Albe
rta
New
foun
dlan
d an
dLa
brad
or
Terr
itorie
s
3.1
4.2
3.0
4.8
3.8
3.9
3.8
3.9
3.8
3.4
4.5
3.8
0 1 2 3 4 5 6
100% debt-to-GDP endpoint
0% debt-to-GDP endpoint
Lower health spending growth
Higher health spending growth
Lower interest rates
Higher interest rates
Lower GDP growth
Higher GDP growth
Interprovincial immigration
Younger population
Older population
Baseline
Figure 9-5
Figure 9-6

Fiscal Sustainability Report 2017
65
10. Saskatchewan• Population growth in Saskatchewan is projected to slow from 1.6 per
cent in 2016 to 0.6 per cent in 2040 and then to 0.4 by 2091. Its seniordependency ratio is projected to rise from 22.5 per cent in 2016 to35.1 per cent in 2040 and then to 44.8 per cent by 2091.
• PBO projects that real GDP growth in Saskatchewan will slow from1.9 per cent annually, on average, over 2017 to 2022 to 1.7 per centannually, on average, over the long term. The subnational government’seffective interest rate is projected to average 4.2 per cent over 2017 to2091.
• Current fiscal policy in Saskatchewan is not sustainable over the longterm. PBO estimates that permanent tax increases or spendingreductions amounting to 1.1 per cent of provincial GDP ($0.9 billion incurrent dollars) would be required to achieve fiscal sustainability.
• This is equivalent to a permanent 5 per cent increase in the tax burden(including federal transfers) or a 5 per cent reduction in programspending. Health care spending is the key fiscal pressure in ourprojection, increasing by 2.1 percentage points of GDP over 2020 to2091.
Demographic projection
Population growth in Saskatchewan is projected to fall below the national rate over the projection horizon and its senior dependency ratio is projected to remain below the national level over the long term.
Under the baseline demographic scenario, PBO projects that Saskatchewan’s fertility rate will increase slightly from 2.01 to 2.06 over the long term, which is 0.39 children (per woman of child-bearing age) higher than the national rate (Table 10-1). Life expectancy at birth for both sexes in Saskatchewan is projected to rise to national levels by 2091.
Saskatchewan’s net migration rate is projected to decline from 2.7 migrants per thousand persons in 2016 to 0.8 migrants per thousand persons over the long term.
Saskatchewan’s population growth is projected to slow to 0.6 per cent in 2040 and gradually decline to 0.4 per cent by 2091. The senior dependency ratio in Saskatchewan is projected to double from its current level, rising to 44.8 per cent by 2091.

Fiscal Sustainability Report 2017
66
Demographic projection: Saskatchewan 2016 2040 2065 2091
Total fertility rate (children per woman of child-bearing age)
2.01 2.06 2.06 2.06
Male life expectancy at birth (years)
78.8 84.0 87.7 90.2
Female life expectancy at birth (years)
83.2 86.6 89.2 91.2
Net migration rate (migrants per 1,000 persons)
2.7 1.9 1.5 0.8
Population growth (per cent)
1.6 0.6 0.5 0.4
Senior dependency ratio (population 65+/population 15-64, per cent)
22.5 35.1 42.2 44.8
Sources: Statistics Canada and Parliamentary Budget Officer.
Note: The net migration rate includes both international and interprovincial migrants.
Economic projection
Projected growth in Saskatchewan’s labour input is due entirely to growth in its working-age population, which averages 0.5 per cent annually over 2017 to 2091 (Table 10-2). Shifts in the age composition of its population pull the employment rate lower, subtracting 0.2 percentage points a year, on average, from its labour input growth over the same period.
Labour productivity in Saskatchewan is projected to grow by 1.3 per cent annually, on average, over 2017 to 2091, which is 0.2 percentage points higher than the national rate but 0.1 percentage points lower than its historical average growth over 1982 to 2016.
PBO projects that real GDP growth in Saskatchewan will average 1.9 per cent annually over 2017 to 2022. Beyond 2022, real GDP growth is projected to decrease to 1.7 per cent annually, on average, due to slower labour input growth and slower labour productivity growth. This is in line with real GDP growth of 1.7 per cent at the national level but lower than its historical average growth of 2.0 per cent from 1982 to 2016.
Growth in real GDP per capita is projected to average 1.2 per cent annually over 2017 to 2091 in Saskatchewan, which is 0.2 percentage points higher than the national rate over the same period but lower its historical average growth of 1.5 per cent over 1982 to 2016.
Economy-wide price increases, measured by GDP inflation, are projected to average 2.4 per cent annually over 2017 to 2022 and then settle at 2.0 over the remainder of the projection. Saskatchewan’s nominal GDP is projected to grow by 3.8 per cent annually, on average, over 2017 to 2091, which is 1.2 percentage points below its 1982-2016 average.
Table 10-1

Fiscal Sustainability Report 2017
67
We project that the effective interest rate on subnational government debt in Saskatchewan will settle at 4.4 per cent, which is 12 basis points lower than the average effective rate across subnational governments and 61 basis points higher than the federal effective rate.
Economic projection: Saskatchewan % 1982-2016 2017-2022 2023-2091
Real GDP growth 2.0 1.9 1.7 Labour input growth 0.6 0.5 0.3
Labour productivity growth 1.4 1.4 1.3 Real GDP per capita growth 1.5 1.0 1.2
GDP inflation 2.9 2.4 2.0 Nominal GDP growth 5.0 4.3 3.7
Effective interest rate on government debt n/a 3.0 4.4
Sources: Statistics Canada and Parliamentary Budget Officer.
Note: Real and nominal GDP growth in 2016 is a PBO estimate.
Fiscal projection
PBO estimates that subnational government revenues in Saskatchewan amounted to 22.8 per cent of provincial GDP in 2016. Based on the provincial government’s Budget 2017 revenue plan, we project Saskatchewan’s revenues to decrease to 22.3 per cent of GDP by 2020 (Figure 10-1).
Revenue projection: Saskatchewan % of GDP
Sources: Statistics Canada and the Parliamentary Budget Officer.
Note: 2016 values are PBO estimates. The projection period covers 2017 to 2091.
0
5
10
15
20
25
30
2008 2018 2028 2038 2048 2058 2068 2078 2088
Own-source revenue Transfer revenue
Table 10-2
Figure 10-1

Fiscal Sustainability Report 2017
68
Beyond the medium term, own-source revenues, that is, revenues raised from subnational government taxes, fees and enterprises, are projected to remain at 18.2 per cent of GDP.
Revenues generated from resource production are an important part of Saskatchewan’s own-source revenues. In our projections, we assume that own-source revenues grow in proportion with nominal GDP, but we do not take a view on the future composition of own source revenues. If resource revenues grow more (less) slowly than GDP, taxes, fees or other sources of government revenue would need to be increased (decrease) to preserve the long-term ratio of own-source revenues to GDP.
Transfers from the federal government, such as the Canada Health Transfer (CHT), Canada Social Transfer (CST) and Equalization, are projected to decrease to 4.1 per cent of GDP in 2020 before edging lower to 3.6 per cent of provincial GDP by 2091.
Relative to subnational government spending in Saskatchewan, we project that the federal CHT contribution to health care will decrease to 15.0 per cent over the long term (Figure 10-2). This decrease reflects the impact of population ageing on its health care spending and slower population growth (relative to population growth nationally). Education and social spending in Saskatchewan is projected to outpace the annual 3 per cent increase in the CST envelope which, combined with slower population growth, drives the federal CST contribution lower to 3.9 per cent over the long term.
Federal CHT and CST contributions to subnational government spending: Saskatchewan %
Source: Parliamentary Budget Officer.
20.7
18.5 16.4
15.0
6.3 5.9 4.9
3.9
0
5
10
15
20
25
30
2016 2041 2066 2091
CHT share in health spending CST share in education and social spending
Figure 10-2

Fiscal Sustainability Report 2017
69
Subnational government program spending in Saskatchewan amounted to 25.5 per cent of GDP in 2016. Based on the medium-term plan set out in the provincial government’s 2017 budget, we project that program spending relative to provincial GDP will decline to 21.8 per cent of GDP in 2020 (Figure 10-3).
Over the long term, we project that program spending relative to the size of the provincial economy will rise steadily, reaching 23.4 per cent of GDP by 2091. This projected increase is entirely due to demographic pressures that drive health care spending up by 2.1 percentage points of GDP over 2020 to 2091.
The ageing of the population does provide some spending offset (0.5 percentage points of GDP) in terms of reduced spending on education and social assistance over 2020 to 2091.
Program spending projection: Saskatchewan % of GDP
Sources: Statistics Canada and the Parliamentary Budget Officer.
Note: 2016 values are PBO estimates. The projection period covers 2017 to 2091.
Over the medium term, we project that the subnational government primary balance (that is, revenues less program spending) will improve from a deficit of 2.7 per cent of GDP in 2016 to a surplus of 0.5 per cent of GDP in 2020 (Figure 10-4). Thereafter, however, increased program spending and lower federal transfers combine to return the primary balance to deficits that reach 1.5 per cent of GDP by the end of the projection horizon.
Persistent primary deficits drive subnational government debt-to-GDP accumulation over the long term. Under current fiscal policy, the subnational
0
5
10
15
20
25
30
2008 2018 2028 2038 2048 2058 2068 2078 2088
Other Education Social Health
Figure 10-3

Fiscal Sustainability Report 2017
70
government net debt-to-GDP ratio is projected to rise rapidly from current levels, reaching 120 per cent of GDP by 2091.
Fiscal projection summary: Saskatchewan % of GDP % of GDP
Sources: Statistics Canada and the Parliamentary Budget Officer.
Note: 2016 values are PBO estimates. The projection period covers 2017 to 2091.
Fiscal sustainability assessment
Current fiscal policy in Saskatchewan is not sustainable over the long term. PBO estimates that permanent tax increases or spending reductions amounting to 1.1 per cent of provincial GDP ($0.9 billion in current dollars) would be required to achieve fiscal sustainability (Figure 10-5). Such an adjustment would require a 5 per cent increase in the tax burden (including federal transfers) or a 5 per cent reduction in program spending, on average, relative to our baseline projection.
We estimate that Saskatchewan’s fiscal gap contributes 4 per cent (0.04 percentage points of Canadian GDP) to the consolidated subnational government fiscal gap.
0
20
40
60
80
100
120
140
0
5
10
15
20
25
30
2008 2018 2028 2038 2048 2058 2068 2078 2088
Net debt (right scale)
Revenue (left scale)
Program spending (left scale)
Figure 10-4

Fiscal Sustainability Report 2017
71
Subnational fiscal gap estimates: Saskatchewan % of GDP
Source: Parliamentary Budget Officer.
Our qualitative assessment that current fiscal policy in Saskatchewan is not sustainable over the long term is unchanged across the alternative demographic, economic and fiscal policy assumptions considered (Figure 10-6).
Fiscal gap sensitivity: Saskatchewan % of GDP
Source: Parliamentary Budget Officer.
0.9
-3.0
-0.4
0.4 0.6 1.1 1.3 1.5
3.8 4.6
6.5 7.2
-4
-2
0
2
4
6
8
10
Cons
olid
ated
sub
natio
nal
Que
bec
Nov
a Sc
otia O
ntar
io
Briti
sh C
olum
bia
Sask
atch
ewan
Prin
ce E
dwar
d Is
land
New
Bru
nsw
ick
Man
itoba
Albe
rta
New
foun
dlan
d an
dLa
brad
or
Terr
itorie
s
0.2
1.2
0.5
1.8
1.1
1.2
1.1
1.1
0.9
1.0
1.3
1.1
0 1 2 3
100% debt-to-GDP endpoint
0% debt-to-GDP endpoint
Lower health spending growth
Higher health spending growth
Lower interest rates
Higher interest rates
Lower GDP growth
Higher GDP growth
Interprovincial immigration
Younger population
Older population
Baseline
Figure 10-5
Figure 10-6

Fiscal Sustainability Report 2017
72
11. Alberta • Population growth in Alberta is projected to slow from 1.8 per cent in
2016 to 1.5 per cent in 2040 and then to 1.4 per cent by 2091. Its senior dependency ratio is projected to rise from 17.1 per cent in 2016 to 29.5 per cent in 2040 and then to 36.4 per cent by 2091.
• PBO projects that real GDP growth in Alberta will slow from 2.6 per cent annually, on average, over 2017 to 2022 to 2.4 per cent annually, on average, over the long term. The subnational government’s effective interest rate is projected to average 4.1 per cent over 2017 to 2091.
• Current fiscal policy in Alberta is not sustainable over the long term. PBO estimates that permanent tax increases or spending reductions amounting to 4.6 per cent of provincial GDP ($14.1 billion in current dollars) would be required to achieve fiscal sustainability.
• This is equivalent to a permanent 25 per cent increase in the tax burden (including federal transfers) or a 20 per cent reduction in program spending. Health care spending is the key fiscal pressure in our projection, increasing by 2.5 percentage points of GDP over 2020 to 2091.
Demographic projection
Although growth in its population is projected to slow over the long term, Alberta’s population growth is projected to remain the fastest in Canada. Despite remaining well below the national level over the long term, the projected increase in Alberta’s senior dependency ratio is among the highest, in percentage terms, across provinces and territories.
Under the baseline demographic scenario, PBO projects that Alberta’s fertility rate will increase from 1.79 to 1.88 over the long term, which is 0.21 children (per woman of child-bearing age) higher than the national rate (Table 11-1). Male and female life expectancies at birth are projected to rise over the long term, in line with national levels.
Alberta’s net migration rate is projected to decline from 10.7 migrants per thousand persons in 2016 to 9.1 migrants per thousand persons over the long term.
Alberta’s population growth is projected to gradually decline to 1.4 per cent by 2091. The senior dependency ratio in Alberta is projected to reach 36.4 per cent by 2091.

Fiscal Sustainability Report 2017
73
Demographic projection: Alberta 2016 2040 2065 2091
Total fertility rate (children per woman of child-bearing age)
1.79 1.88 1.88 1.88
Male life expectancy at birth (years)
80.3 84.8 88.0 90.3
Female life expectancy at birth (years)
84.4 87.2 89.4 91.3
Net migration rate (migrants per 1,000 persons)
10.7 9.6 9.4 9.1
Population growth (per cent)
1.8 1.5 1.4 1.4
Senior dependency ratio (population 65+/population 15-64, per cent)
17.1 29.5 34.6 36.4
Sources: Statistics Canada and Parliamentary Budget Officer.
Note: The net migration rate includes both international and interprovincial migrants.
Economic projection
Projected growth in Alberta’s labour input is due entirely to growth in its working-age population, which averages 1.5 per cent annually over 2017 to 2091 (Table 11-2). Shifts in the age composition of its population pull its employment rate lower, subtracting 0.2 percentage points a year, on average, from its labour input growth over the same period.
Labour productivity in Alberta is projected to grow by 1.1 per cent annually, on average, over 2017 to 2091, which is in line with the national rate but 0.1 percentage points lower than its historical average growth over 1982 to 2016.
PBO projects that real GDP growth in Alberta will average 2.6 per cent annually over 2017 to 2022. Beyond 2022, real GDP growth is projected to moderate to 2.4 per cent annually, on average, due to slower labour input growth. This is above projected real GDP growth of 1.7 per cent at the national level but lower than its historical average growth of 2.8 per cent from 1982 to 2016.
Growth in real GDP per capita is projected to average 0.9 per cent annually over 2017 to 2091 in Alberta, which is slightly lower than the national rate over the same period and lower than its historical average growth of 1.0 per cent over 1982 to 2016.
Economy-wide price increases, measured by GDP inflation, are projected to average 2.8 per cent annually over 2017 to 2022 and then settle at 2.0 over the remainder of the projection. Alberta’s nominal GDP is projected to grow by 4.5 per cent annually, on average, over 2017 to 2091, which is 0.8 percentage points below its 1982-2016 average annual growth.
Table 11-1

Fiscal Sustainability Report 2017
74
We project that the effective interest rate on subnational government debt in Alberta will settle at 4.3 per cent, which is 25 basis points lower than the average effective rate across subnational governments and 49 basis points higher than the federal effective rate.
Economic projection: Alberta % 1982-2016 2017-2022 2023-2091
Real GDP growth 2.8 2.6 2.4 Labour input growth 1.7 1.6 1.3
Labour productivity growth 1.1 1.0 1.1 Real GDP per capita growth 1.0 0.7 0.9
GDP inflation 2.4 2.8 2.0 Nominal GDP growth 5.4 5.4 4.5
Effective interest rate on government debt n/a 2.5 4.2
Sources: Statistics Canada and Parliamentary Budget Officer.
Note: Real and nominal GDP growth in 2016 is a PBO estimate.
Fiscal projection
PBO estimates that subnational government revenues in Alberta amounted to 18.1 per cent of provincial GDP in 2016. This is the lowest among all provinces and territories. Based on the provincial government’s Budget 2017 revenue plan, we project Alberta’s revenues to rise slightly to 18.5 per cent of GDP by 2020 (Figure 11-1).
Revenue projection: Alberta % of GDP
Sources: Statistics Canada and the Parliamentary Budget Officer.
Note: 2016 values are PBO estimates. The projection period covers 2017 to 2091.
0
5
10
15
20
25
2008 2018 2028 2038 2048 2058 2068 2078 2088
Own-source revenue
Transfer revenue
Table 11-2
Figure 11-1

Fiscal Sustainability Report 2017
75
Beyond the medium term, own-source revenues, that is, revenues raised from subnational government taxes, fees and enterprises, are projected to remain at 16.1 per cent of GDP.
Revenues generated from resource production are an important part of Alberta’s own-source revenues. In our projections, we assume that own-source revenues grow in proportion with nominal GDP, but we do not take a view on the future composition of own-source revenues. If resource revenues grow more (less) slowly than GDP, taxes, fees or other sources of government revenue would need to be increased (decrease) to preserve the long-term ratio of own source revenues to GDP.
Transfers from the federal government, such as the Canada Health Transfer (CHT) and the Canada Social Transfer (CST), are projected to decrease to 2.4 per cent of GDP in 2020 and decline over the long term, reaching 2.3 per cent of provincial GDP by 2091.
Relative to subnational government spending in Alberta, we project that the federal CHT contribution to health care will decrease to 15.4 per cent over the long term (Figure 11-2). This decrease reflects the impact of population ageing on Alberta’s health care spending and faster growth in nominal GDP (relative to nominal GDP growth nationally). Education and social spending in Alberta is projected to outpace the annual 3 per cent increase in the CST envelope, which drives the federal CST contribution lower to 5.9 per cent over the long term.
Federal CHT and CST contributions to subnational government spending: Alberta %
Source: Parliamentary Budget Officer.
20.1
16.9 15.8 15.4
8.4 7.9 6.9
5.9
0
5
10
15
20
25
30
2016 2041 2066 2091
CHT share in health spending CST share in education and social spending
Figure 11-2

Fiscal Sustainability Report 2017
76
Subnational government program spending in Alberta amounted to 23.7 per cent of GDP in 2016. Based on the medium-term plan set out in the provincial government’s 2017 budget, we project that program spending relative to provincial GDP will decline to around 21.2 per cent of GDP by 2020 (Figure 11-3).
Over the long term, we project that program spending relative to the size of the provincial economy will rise steadily, reaching 23.4 per cent of GDP by 2091. This projected increase is entirely due to demographic pressures that drive health care spending up by 2.5 percentage points of GDP over 2020 to 2091.
The ageing of the population does provide a minor spending offset (0.4 percentage points of GDP) in terms of reduced spending on education and social assistance over 2020 to 2091.
Program spending projection: Alberta % of GDP
Sources: Statistics Canada and the Parliamentary Budget Officer.
Note: 2016 values are PBO estimates. The projection period covers 2017 to 2091.
Over the medium term, we project that the subnational government primary balance (that is, revenues less program spending) will improve from a deficit of 5.6 per cent of GDP in 2016 to a deficit of 2.8 per cent of GDP in 2020 (Figure 11-4). Thereafter, however, increased program spending and lower federal transfers combine to expand the deficit to 5.1 per cent of GDP by the end of the projection horizon.
0
5
10
15
20
25
30
2008 2018 2028 2038 2048 2058 2068 2078 2088
Other Education Social Health
Figure 11-3

Fiscal Sustainability Report 2017
77
Large and expanding projected primary deficits drive subnational government debt-to-GDP accumulation over the long term. Under current fiscal policy, the subnational government net debt-to-GDP ratio is projected to rise rapidly from current levels, reaching over 320 per cent of GDP by 2091.
Fiscal projection summary: Alberta % of GDP % of GDP
Sources: Statistics Canada and the Parliamentary Budget Officer.
Note: 2016 values are PBO estimates. The projection period covers 2017 to 2091.
Fiscal sustainability assessment
Current fiscal policy in Alberta is not sustainable over the long term. PBO estimates that permanent tax increases or spending reductions amounting to 4.6 per cent of provincial GDP ($14.1 billion in current dollars) would be required to achieve fiscal sustainability (Figure 11-5). Such an adjustment would require a 25 per cent increase in the tax burden (including federal transfers) or a 20 per cent reduction in program spending, on average, relative to the baseline projection.
We estimate that Alberta’s fiscal gap is responsible for most of the consolidated subnational government fiscal gap: 92 per cent, or 0.84 percentage points of Canadian GDP.
-50
0
50
100
150
200
250
300
350
0
5
10
15
20
25
30
2008 2018 2028 2038 2048 2058 2068 2078 2088
Net debt (right scale)Revenue (left scale)Program spending (left scale)
Figure 11-4

Fiscal Sustainability Report 2017
78
Subnational fiscal gap estimates: Alberta % of GDP
Source: Parliamentary Budget Officer.
Our qualitative assessment that current fiscal policy in Alberta is not sustainable over the long term is unchanged across the alternative demographic, economic and fiscal policy assumptions considered (Figure 11-6).
Fiscal gap sensitivity: Alberta % of GDP
Source: Parliamentary Budget Officer.
0.9
-3.0
-0.4
0.4 0.6 1.1 1.3 1.5
3.8 4.6
6.5 7.2
-4
-2
0
2
4
6
8
10
Cons
olid
ated
sub
natio
nal
Que
bec
Nov
a Sc
otia O
ntar
io
Briti
sh C
olum
bia
Sask
atch
ewan
Prin
ce E
dwar
d Is
land
New
Bru
nsw
ick
Man
itoba
Albe
rta
New
foun
dlan
d an
dLa
brad
or
Terr
itorie
s
3.2
4.6
3.9
5.4
4.6
4.6
4.5
4.7
4.6
4.4
4.9
4.6
0 1 2 3 4 5 6 7 8
100% debt-to-GDP endpoint
0% debt-to-GDP endpoint
Lower health spending growth
Higher health spending growth
Lower interest rates
Higher interest rates
Lower GDP growth
Higher GDP growth
Interprovincial immigration
Younger population
Older population
Baseline
Figure 11-5
Figure 11-6

Fiscal Sustainability Report 2017
79
12. British Columbia• Population growth in British Columbia is projected to slow from 1.2 per
cent in 2016 to 0.8 per cent in 2040 and then stabilize around that ratethereafter. Its senior dependency ratio is projected to rise from 26.5 percent in 2016 to 41.1 per cent in 2040 and then to 47.8 per cent by 2091.
• PBO projects that real GDP growth in British Columbia will slow from1.9 per cent annually, on average, over 2017 to 2022 to 1.5 per centannually, on average, over the long term. The subnational government’seffective interest rate is projected to average 4.4 per cent over 2017 to2091.
• Current fiscal policy in British Columbia is not sustainable over the longterm. PBO estimates that permanent tax increases or spendingreductions amounting to 0.6 per cent of provincial GDP ($1.6 billion incurrent dollars) would be required to achieve fiscal sustainability.
• This is equivalent to a permanent 3 per cent increase in the tax burden(including federal transfers) or a 3 per cent reduction in programspending. Health care spending is the key fiscal pressure in ourprojection, increasing by 1.9 percentage points of GDP over 2020 to2091.
Demographic projection
Growth in British Columbia’s population is projected to slow over the long term; however, its population growth is projected to remain above the national rate. Although the senior dependency in British Columbia is projected to remain above the national level, its increase is among the smallest, in percentage terms, across provinces and territories.
Under the baseline demographic scenario, PBO projects that British Columbia’s fertility rate will increase slightly from 1.44 to 1.48 over the long term, which is 0.19 children (per woman of child-bearing age) lower than the national rate (Table 12-1). Life expectancy at birth for both sexes in British Colombia is projected to be higher than national levels.
British Columbia’s net migration rate is projected to decline from 9.7 migrants per thousand persons in 2016 to 8.9 migrants per thousand persons over the long term.
British Columbia’s population growth is projected to slow to 0.8 per cent in 2040 and stabilize around 0.9 per cent thereafter. The senior dependency ratio in British Columbia is projected to rise to 47.8 per cent by 2091.

Fiscal Sustainability Report 2017
80
Demographic projection: British Columbia 2016 2040 2065 2091
Total fertility rate (children per woman of child-bearing age)
1.44 1.48 1.48 1.48
Male life expectancy at birth (years)
81.3 85.4 88.5 90.7
Female life expectancy at birth (years)
84.9 87.6 89.8 91.5
Net migration rate (migrants per 1,000 persons)
9.7 8.9 8.8 8.9
Population growth (per cent)
1.2 0.8 0.8 0.9
Senior dependency ratio (population 65+/population 15-64, per cent)
26.5 41.1 45.0 47.8
Sources: Statistics Canada and Parliamentary Budget Officer.
Note: The net migration rate includes both international and interprovincial migrants.
Economic projection
Projected growth in British Columbia’s labour input is due entirely to growth in its working-age population, which averages 0.9 per cent annually over 2017 to 2091 (Table 12-2). Shifts in the age composition of its population pull its employment rate lower, subtracting 0.2 percentage points a year, on average, from its labour input growth over the same period.
Labour productivity in British Columbia is projected to grow by 0.8 per cent annually, on average, over 2017 to 2091, which is lower than the national rate and lower than its historical average growth over 1982 to 2016.
PBO projects that real GDP growth in British Columbia will average 1.9 per cent annually over 2017 to 2022. Beyond 2022, real GDP growth is projected to decrease to 1.5 per cent annually, on average, due to slower labour productivity growth and slower labour input growth. This is below projected real GDP growth of 1.7 per cent at the national level and well below its historical average growth of 2.6 per cent from 1982 to 2016.
Growth in real GDP per capita is projected to average 0.6 per cent annually over 2017 to 2091 in British Columbia, which is 0.3 percentage points lower than the national rate over the same period and lower than its historical average growth of 1.1 per cent over 1982 to 2016.
Economy-wide price increases, measured by GDP inflation, are projected to average 2.0 per cent annually over 2017 to 2091. British Columbia’s nominal GDP is projected to grow by 3.6 per cent annually, on average, over 2017 to 2091, which is 1.6 percentage points below its 1982-2016 average growth.
We project that the effective interest rate on subnational government debt in British Columbia will settle at 4.5 per cent, which is in line with the average
Table 12-1

Fiscal Sustainability Report 2017
81
effective rate across subnational governments and 74 basis points higher than the federal effective rate.
Economic projection: British Columbia % 1982-2016 2017-2022 2023-2091
Real GDP growth 2.6 1.9 1.5 Labour input growth 1.7 0.8 0.7
Labour productivity growth 0.9 1.0 0.8 Real GDP per capita growth 1.1 0.6 0.7
GDP inflation 2.5 2.0 2.0 Nominal GDP growth 5.2 3.9 3.5
Effective interest rate on government debt n/a 3.4 4.5
Sources: Statistics Canada and Parliamentary Budget Officer.
Note: Real and nominal GDP growth in 2016 is a PBO estimate.
Fiscal projection
PBO estimates that subnational government revenues in British Columbia amounted to 24.8 per cent of provincial GDP in 2016. Based on the provincial government’s Budget 2017 revenue plan, we project British Columbia’s revenues to decrease to 22.9 per cent of GDP by 2020 (Figure 12-1).
Revenue projection: British Columbia % of GDP
Sources: Statistics Canada and the Parliamentary Budget Officer.
Note: 2016 values are PBO estimates. The projection period covers 2017 to 2091.
0
5
10
15
20
25
30
2008 2018 2028 2038 2048 2058 2068 2078 2088
Own-source revenue Transfer revenue
Table 12-2
Figure 12-1

Fiscal Sustainability Report 2017
82
Beyond the medium term, own-source revenues, that is, revenues raised from subnational government taxes, fees and enterprises, are projected to remain at 19.6 per cent of GDP.
Transfers from the federal government, such as the Canada Health Transfer (CHT), Canada Social Transfer (CST) and Equalization, are projected to decrease slightly to 3.3 per cent of GDP in 2020 before steadily growing to 4.5 per cent of provincial GDP by 2091. This is primarily attributable to our projection that British Columbia will begin receiving Equalization payments in 2059.
Relative to subnational government spending in British Columbia, we project that the federal CHT contribution to health care will fluctuate between 22 per cent and 25 per cent over the long term (Figure 12-2). The relative stability in the federal CHT contribution reflects offsetting factors: faster growth in British Columbia’s population and slower growth in its nominal GDP (relative to nominal GDP growth nationally) offset the impact of population ageing on its health care spending. Education and social spending in British Columbia is projected to outpace the annual 3 per cent increase in the CST envelope, which drives the federal CST contribution lower to 9.3 per cent over the long term.
Federal CHT and CST contributions to subnational government spending: British Columbia %
Source: Parliamentary Budget Officer.
Subnational government program spending in British Columbia amounted to 24.1 per cent of GDP in 2016. Based on the medium-term plan set out in the provincial government’s 2017 budget, we project that program spending
24.2 22.5 23.3
24.3
11.0 10.9 10.1 9.3
0
5
10
15
20
25
30
2016 2041 2066 2091
CHT share in health spending CST share in education and social spending
Figure 12-2

Fiscal Sustainability Report 2017
83
relative to provincial GDP will fall to 22.4 percent of GDP in 2020 (Figure 12-3).
Over the long term, we project that program spending relative to the size of the provincial economy will rise steadily, reaching 23.9 per cent of GDP by 2091. This projected increase is entirely due to demographic pressures that drive health care spending up by 1.9 percentage points of GDP over 2020 to 2091.
The ageing of the population does provide a small offset (0.4 percentage points of GDP) in terms of reduced spending on education and social assistance over 2020 to 2091.
Program spending projection: British Columbia % of GDP
Sources: Statistics Canada and the Parliamentary Budget Officer.
Note: 2016 values are PBO estimates. The projection period covers 2017 to 2091.
Over the medium term, we project that the subnational government primary balance (that is, revenues less program spending) will slightly deteriorate from a surplus of 0.7 per cent of GDP in 2016 to a surplus of 0.5 per cent of GDP in 2020 (Figure 12-4). Thereafter, however, increased program spending pushes British Columbia’s subnational government into a primary deficit in 2030. Rising federal transfers, in particular Equalization, return the province to a primary surplus in 2084 onward.
Under current fiscal policy, the subnational government net debt-to-GDP ratio is projected to rise gradually from current levels, reaching close to 75 per cent of GDP by 2091.
0
5
10
15
20
25
30
2008 2018 2028 2038 2048 2058 2068 2078 2088
Other Education Social Health
Figure 12-3

Fiscal Sustainability Report 2017
84
Fiscal projection summary: British Columbia % of GDP % of GDP
Sources: Statistics Canada and the Parliamentary Budget Officer.
Note: 2016 values are PBO estimates. The projection period covers 2017 to 2091.
Fiscal sustainability assessment
Current fiscal policy in British Columbia is not sustainable over the long term. PBO estimates that permanent tax increases or spending reductions amounting to 0.6 per cent of provincial GDP ($1.6 billion in current dollars) would be required to achieve fiscal sustainability (Figure 12-5). Such an adjustment would require a 3 per cent increase in the tax burden (including federal transfers) or a 3 per cent reduction in program spending, on average, relative to our baseline projection.
We estimate that British Columbia’s fiscal gap contributes 6 per cent (0.06 percentage points of Canadian GDP) to the consolidated subnational government fiscal gap.
0
10
20
30
40
50
60
70
80
0
5
10
15
20
25
30
2008 2018 2028 2038 2048 2058 2068 2078 2088
Net debt (right scale)Revenue (left scale)Program spending (left scale)
Figure 12-4

Fiscal Sustainability Report 2017
85
Subnational fiscal gap estimates: British Columbia % of GDP
Source: Parliamentary Budget Officer.
Our qualitative assessment that current fiscal policy in British Columbia is not sustainable over the long term is somewhat sensitive to alternative health spending and endpoint debt-to-GDP assumptions (Figure 12-6). In particular, under a scenario in which there is negative excess cost growth in health care spending (-0.25 percentage points annually) or an endpoint debt ratio of 100 per cent of GDP, fiscal policy would be sustainable over the long term.
Fiscal gap sensitivity: British Columbia % of GDP
Source: Parliamentary Budget Officer.
0.9
-3.0
-0.4
0.4 0.6 1.1 1.3 1.5
3.8 4.6
6.5 7.2
-4
-2
0
2
4
6
8
10
Cons
olid
ated
sub
natio
nal
Que
bec
Nov
a Sc
otia O
ntar
io
Briti
sh C
olum
bia
Sask
atch
ewan
Prin
ce E
dwar
d Is
land
New
Bru
nsw
ick
Man
itoba
Albe
rta
New
foun
dlan
d an
dLa
brad
or
Terr
itorie
s
-0.3
0.7
0.0
1.3
0.5
0.7
0.6
0.6
0.7
0.5
0.9
0.6
-1 0 1 2
100% debt-to-GDP endpoint
0% debt-to-GDP endpoint
Lower health spending growth
Higher health spending growth
Lower interest rates
Higher interest rates
Lower GDP growth
Higher GDP growth
Interprovincial immigration
Younger population
Older population
Baseline
Figure 12-5
Figure 12-6

Fiscal Sustainability Report 2017
86
13. The Territories • Population growth in the Territories is projected to slow from 0.7 per
cent in 2016 to 0.4 per cent in 2040 and then stabilize around that rate thereafter. The senior dependency ratio in the Territories is projected to rise from 10.8 per cent in 2016 to 21.5 per cent in 2040 and then to 23.7 per cent by 2091.
• PBO projects that real GDP growth in the Territories will slow from 1.6 per cent annually, on average, over 2017 to 2022 to 1.4 per cent annually, on average, over the long term. The subnational government’s effective interest rate is projected to average 4.4 per cent over 2017 to 2091.
• Current fiscal policy in the Territories is not sustainable over the long term. PBO estimates that permanent tax increases or spending reductions amounting to 7.2 per cent of territorial GDP ($0.7 billion in current dollars) would be required to achieve fiscal sustainability.
• This is equivalent to a permanent 13 per cent increase in the tax burden (including federal transfers) or a 12 per cent reduction in program spending, on average. Health care spending is the key fiscal pressure in our projection, increasing by 4.0 percentage points of GDP over 2020 to 2091.
Demographic projection
Population growth in the Territories is projected to slow over the long term and remain below the national rate. Although the Territories’ senior dependency ratio is projected to more than double over the long term, their age structure remains the youngest in Canada.
Under the baseline demographic scenario, PBO projects that the Territories’ fertility rate (on average) will increase from 2.19 to 2.31 over the long term, which is 0.64 children (per woman of child-bearing age) higher than the national rate (Table 13-1). Male and female life expectancies at birth are projected to remain well below national levels.
The Territories’ (average) net migration rate is projected to decrease from -4.0 migrants per thousand persons in 2016 to -9.1 migrants per thousand persons over the long term.
Population growth in the Territories is projected to slow to 0.4 per cent in 2040 and stabilize around that rate thereafter. The senior dependency ratio in the Territories is projected to rise to 23.7 per cent by 2091.

Fiscal Sustainability Report 2017
87
Demographic projection: the Territories 2016 2040 2065 2091
Total fertility rate (children per woman of child-bearing age)
2.19 2.31 2.31 2.31
Male life expectancy at birth (years)
75.4 80.5 84.1 86.8
Female life expectancy at birth (years)
79.0 82.6 85.5 87.9
Net migration rate (migrants per 1,000 persons)
-4.0 -6.7 -7.9 -9.1
Population growth (per cent)
0.7 0.4 0.4 0.4
Senior dependency ratio (population 65+/population 15-64, per cent)
10.8 21.5 23.1 23.7
Sources: Statistics Canada and Parliamentary Budget Officer.
Note: The demographic component assumptions (that is, fertility, life expectancy and migration) shown in this table, represent the simple average across Territories. The net migration rate includes both international and interprovincial migrants.
Economic projection
Projected growth in the Territories’ labour input is due entirely to growth in its working-age population, which averages 0.4 per cent annually over 2017 to 2091 (Table 13-2). We assume that the employment rate in the Territories tracks the decline (in percentage terms) projected at the national level, which subtracts 0.2 percentage points a year, on average, from labour input growth over the same period.
Labour productivity in the Territories is assumed to grow at the national rate, which averages 1.1 per cent annually over 2017 to 2091.
PBO projects that real GDP growth in the Territories will average 1.6 per cent annually over 2017 to 2022. Beyond 2022, real GDP growth is projected to moderate to 1.4 per cent annually, on average, due to slower labour productivity growth. This is below projected real GDP growth of 1.7 per cent at the national level and well below their historical average growth of 3.2 per cent from 1982 to 2016.
Growth in real GDP per capita is projected to average 0.9 per cent annually over 2017 to 2091 in the Territories, which is marginally lower than the national rate over the same period but well below their historical average growth of 1.7 per cent over 1982 to 2016.
Economy-wide price increases, measured by GDP inflation, are projected to average 2.0 per cent annually over 2017 to 2091. Nominal GDP in the Territories is projected to grow by 3.4 per cent annually, on average, over 2017 to 2091, which is 2.3 percentage points below their 1982-2016 average.
Table 13-1

Fiscal Sustainability Report 2017
88
We assume that the effective interest rate on subnational government debt in the Territories will settle at 4.5 per cent, which is 73 basis points higher than the federal effective rate.
Economic projection: the Territories % 1982-2016 2017-2022 2023-2091
Real GDP growth 3.2 1.6 1.4 Labour input growth n/a 0.3 0.3
Labour productivity growth n/a 1.3 1.1 Real GDP per capita growth 1.7 0.8 0.9
GDP inflation 2.4 2.1 2.0 Nominal GDP growth 5.7 3.7 3.4
Effective interest rate on government debt n/a 3.2 4.5
Sources: Statistics Canada and Parliamentary Budget Officer.
Note: Real and nominal GDP growth in 2016 is a PBO estimate.
Fiscal projection
PBO estimates that subnational government revenues in the Territories amounted to 56.7 per cent of territorial GDP in 2016. Based on the territorial governments’ Budget 2017 revenue plans, we project the Territories’ revenues to decrease to 54.6 per cent of GDP by 2020 (Figure 13-1).
Revenue projection: the Territories % of GDP
Sources: Statistics Canada and the Parliamentary Budget Officer.
Note: 2016 values are PBO estimates. The projection period covers 2017 to 2091.
0
10
20
30
40
50
60
70
2008 2018 2028 2038 2048 2058 2068 2078 2088
Own-source revenue Transfer revenue
Table 13-2
Figure 13-1

Fiscal Sustainability Report 2017
89
Beyond the medium term, own-source revenues, that is, revenues raised from subnational government taxes, fees and enterprises, are projected to remain at 12.8 per cent of GDP.
The Territories’ revenues are unlike their provincial counterparts. Three quarters of territorial revenues are generated through transfers from the federal government. As such, the Territories’ projection is sensitive to growth in the Territorial Financing Envelope, the Canada Health Transfer (CHT) and the Canada Social Transfer (CST). Overall transfer revenue is projected to increase from 41.8 per cent of GDP in 2020 to 43.1 per cent of GDP in 2091.
Under its current structure, the Territorial Financing Formula grows with program spending in the provinces, adjusted for differences in population growth. We project that provincial program spending will grow at about the same rate as the territories’ nominal GDP over the long term, leading to a marginal relative decrease in the Territorial Financing Formula envelope, from 35.6 per cent of GDP in 2016 to 35.2 per cent in 2091.
Relative to subnational government spending in the Territories, we project that the federal CHT contribution to health care will decrease to 7.4 per cent over the long term (Figure 13-2). This decrease reflects the impact of population ageing on their health care spending and slower population growth (relative to population growth nationally). Education and social spending in the Territories is projected to outpace the annual 3 per cent increase in the CST envelope which, combined with slower population growth, drives the federal CST contribution lower to 2.0 per cent.
Federal CHT and CST contributions to subnational government spending: the Territories %
Source: Parliamentary Budget Officer.
9.2
7.6 7.5 7.4
3.0 2.8 2.4 2.0
0
5
10
15
2016 2041 2066 2091
CHT share in health spending CST share in education and social spending
Figure 13-2

Fiscal Sustainability Report 2017
90
Subnational government program spending in the Territories amounted to 62.9 per cent of GDP in 2016. Based on the medium-term plan set out in the 2017 territorial budgets, we project that program spending relative to territorial GDP will fall to 59.5 per cent of GDP by 2020 (Figure 13-3).
Over the long term, we project that program spending relative to the size of the economy will rise steadily, reaching 63.2 per cent of GDP by 2091. This projected increase is entirely due to demographic pressures that drive health care spending up by 4.0 percentage points of GDP over 2020 to 2091.
The ageing population does provide some spending offset (0.6 percentage points of GDP) in terms of reduced spending on social assistance over 2020 to 2091.
Program spending projection: the Territories % of GDP
Sources: Statistics Canada and the Parliamentary Budget Officer.
Note: 2016 values are PBO estimates. The projection period covers 2017 to 2091.
Over the medium term, we project that the subnational government primary balance (that is, revenues less program spending) will improve from a deficit of 6.2 per cent of GDP in 2016 to a deficit of 4.9 per cent of GDP in 2020 (Figure 13-4). Thereafter, however, increased program spending and lower transfer revenues (relative to GDP) expand the primary deficit to 7.3 per cent of GDP by the end of the projection horizon.
Large and expanding projected primary deficits drive subnational government debt-to-GDP accumulation over the long term. Under current fiscal policy, the subnational government net debt-to-GDP ratio is projected to rise rapidly from current levels, reaching over 800 per cent of GDP by 2091.
0
10
20
30
40
50
60
70
2008 2018 2028 2038 2048 2058 2068 2078 2088
Other Education Social Health
Figure 13-3
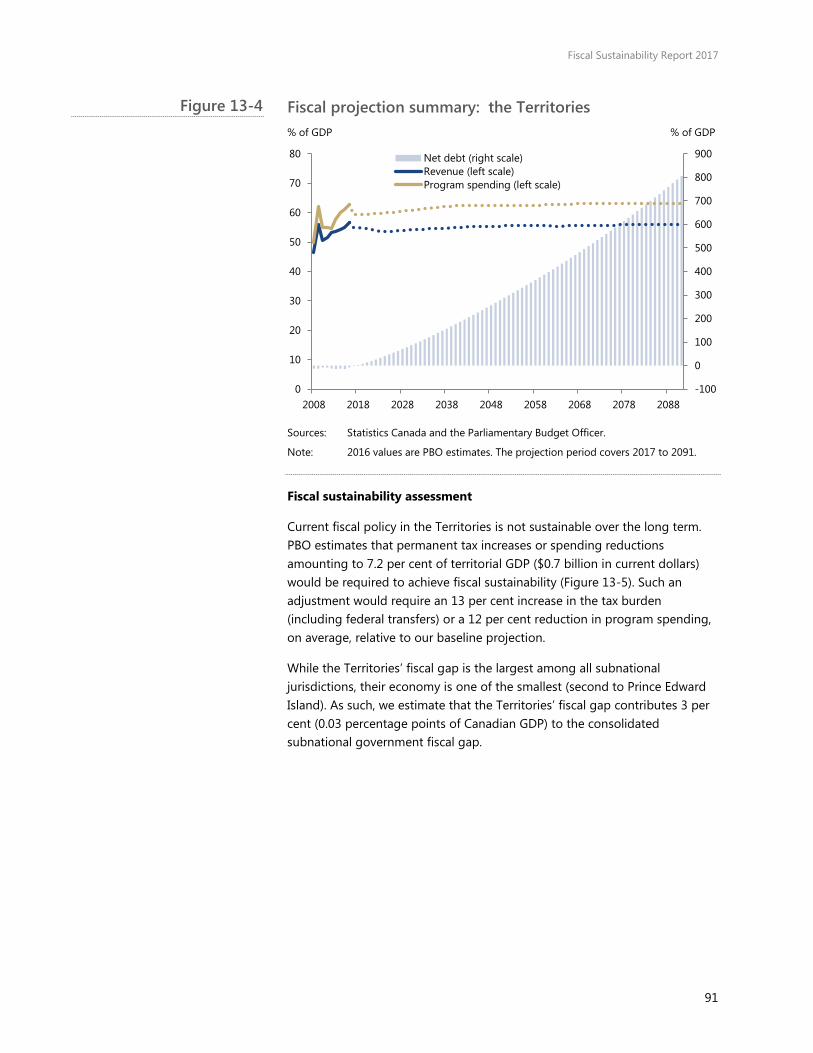
Fiscal Sustainability Report 2017
91
Fiscal projection summary: the Territories % of GDP % of GDP
Sources: Statistics Canada and the Parliamentary Budget Officer.
Note: 2016 values are PBO estimates. The projection period covers 2017 to 2091.
Fiscal sustainability assessment
Current fiscal policy in the Territories is not sustainable over the long term. PBO estimates that permanent tax increases or spending reductions amounting to 7.2 per cent of territorial GDP ($0.7 billion in current dollars) would be required to achieve fiscal sustainability (Figure 13-5). Such an adjustment would require an 13 per cent increase in the tax burden (including federal transfers) or a 12 per cent reduction in program spending, on average, relative to our baseline projection.
While the Territories’ fiscal gap is the largest among all subnational jurisdictions, their economy is one of the smallest (second to Prince Edward Island). As such, we estimate that the Territories’ fiscal gap contributes 3 per cent (0.03 percentage points of Canadian GDP) to the consolidated subnational government fiscal gap.
-100
0
100
200
300
400
500
600
700
800
900
0
10
20
30
40
50
60
70
80
2008 2018 2028 2038 2048 2058 2068 2078 2088
Net debt (right scale)Revenue (left scale)Program spending (left scale)
Figure 13-4

Fiscal Sustainability Report 2017
92
Subnational fiscal gap estimates: the Territories % of GDP
Source: Parliamentary Budget Officer.
Our qualitative assessment that current fiscal policy in the Territories is not sustainable over the long term is unchanged across the alternative demographic, economic and fiscal policy assumptions considered (Figure 13-6).
Fiscal gap sensitivity: the Territories % of GDP
Source: Parliamentary Budget Officer.
0.9
-3.0
-0.4
0.4 0.6 1.1 1.3 1.5
3.8 4.6
6.5 7.2
-4
-2
0
2
4
6
8
10
Cons
olid
ated
sub
natio
nal
Que
bec
Nov
a Sc
otia O
ntar
io
Briti
sh C
olum
bia
Sask
atch
ewan
Prin
ce E
dwar
d Is
land
New
Bru
nsw
ick
Man
itoba
Albe
rta
New
foun
dlan
d an
dLa
brad
or
Terr
itorie
s
6.2
7.1
6.8
7.6
7.2
7.1
6.7
7.7
9.2
7.9
7.0
7.2
0 1 2 3 4 5 6 7 8 9 10
100% debt-to-GDP endpoint
0% debt-to-GDP endpoint
Lower health spending growth
Higher health spending growth
Lower interest rates
Higher interest rates
Lower GDP growth
Higher GDP growth
Interprovincial immigration
Younger population
Older population
Baseline
Figure 13-5
Figure 13-6

Fiscal Sustainability Report 2017
93
14. Canada Pension Plan• Based on PBO’s assessment, the Canada Pension Plan (CPP) is
sustainable over the long term. Expressed as a percentage of CanadianGDP, PBO estimates that the fiscal gap for the CPP is zero.
PBO’s financial projections for the CPP are based on demographic projections (by age and sex groups) at the national level excluding Quebec. Economic projections (for example, for wage growth) are based on the national projection (see Table 2-2), with the exception of employment growth, which excludes Quebec. Table 14-1 provides a summary of key demographic and economic projections for the CPP.
Key demographic and economic projections: CPP 2016 2040 2065 2091
Population growth (per cent)
1.3 0.7 0.8 0.8
Senior dependency ratio (population 65+/population 15-64, per cent)
23.7 39.0 42.9 44.9
Employment growth (per cent)
0.7 0.7 0.7 0.7
Real wage growth (per cent)
1.4 1.1 1.1 1.1
Inflation (per cent)
1.4 2.0 2.0 2.0
Effective rate of return (per cent)
1.4 6.5 6.5 6.4
Sources: Statistics Canada and Parliamentary Budget Officer.
Note: The effective rate of return is shown before investment expenses.
PBO has incorporated the 2016 additions to the Canada Pension Plan, which increased the replacement rate for retirement benefits and increased the annual maximum for pensionable earnings, as well as the new contribution rates (beginning in 2019) that were legislated to fund these additions.
Contributions to the CPP are projected to grow in line with earnings and contribution rates. The base CPP contribution rate is fixed at 9.9 per cent of contributory earnings. The additional contribution rates are phased in over 2019 to 2023.9 Contributions to the CPP are projected to rise from 2.3 per cent of GDP in 2016 to around 3.1 per cent of GDP over the long term.
CPP expenditures are projected to grow in line with the retirement-age population, inflation and a portion of real wage growth, and will increase
Table 14-1

Fiscal Sustainability Report 2017
94
steadily as population ageing drives retirement benefits. CPP benefit payments are projected to increase from 2.1 per cent of GDP in 2016 to 2.9 per cent in 2040 and to 4.2 per cent by the end of the projection period.
Administrative expenses, including investment expenses, are assumed to equal 1.0 per cent of financial assets over the projection horizon. CPP administrative expenses are projected to increase from 0.15 per cent of GDP in 2016 to 0.33 per cent of GDP in 2060 and then decrease to 0.23 per cent of GDP by 2091.
The additional CPP benefits and contributions are combined with the base CPP to project the financial position of the CPP as a whole over the long term. The net cash flow (that is, contributions less expenses) of the CPP is projected to rise from 0.03 per cent of GDP in 2016 to 0.23 per cent of GDP in 2025, as the additional contributions exceed the additional expenditures, and decline thereafter to an annual deficit of 1.31 per cent of GDP by the end of the projection horizon (Figure 14-1).
CPP net cash flow % of GDP
Sources: Statistics Canada and Parliamentary Budget Officer.
Note: The projection period covers 2017 to 2091.
Although CPP contributions are projected to fall short of plan expenses over the long term, the net asset position of the CPP (relative to Canadian GDP) is projected to increase and remain above its current level. Asset accumulation occurs because the rate of return on plan assets is more than sufficient to generate enough investment income to cover the annual cash flow deficits. The net asset position of the CPP is projected to increase from 14.8 per cent of GDP in 2016 to 34.6 per cent of GDP in 2061 but then decline to 23.6 per cent of GDP by the end of the projection horizon (Figure 14-2).
-1.4
-1.2
-1.0
-0.8
-0.6
-0.4
-0.2
0.0
0.2
0.4
0.6
2008 2018 2028 2038 2048 2058 2068 2078 2088
Figure 14-1
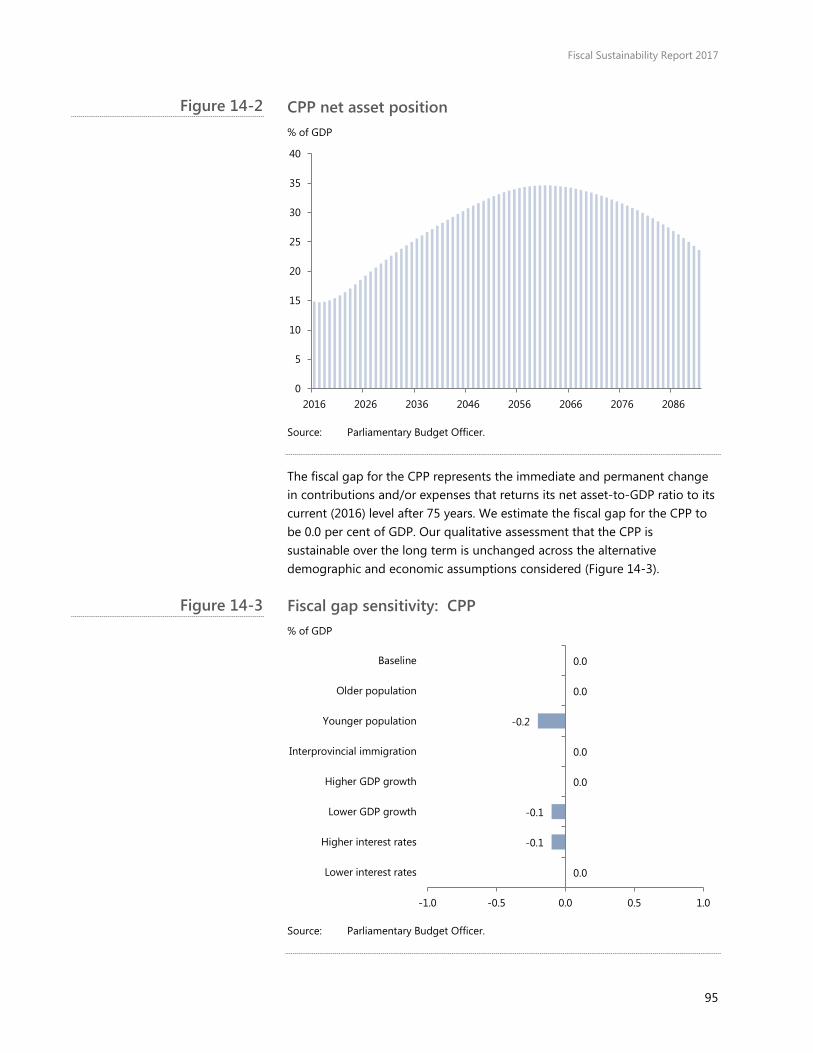
Fiscal Sustainability Report 2017
95
CPP net asset position % of GDP
Source: Parliamentary Budget Officer.
The fiscal gap for the CPP represents the immediate and permanent change in contributions and/or expenses that returns its net asset-to-GDP ratio to its current (2016) level after 75 years. We estimate the fiscal gap for the CPP to be 0.0 per cent of GDP. Our qualitative assessment that the CPP is sustainable over the long term is unchanged across the alternative demographic and economic assumptions considered (Figure 14-3).
Fiscal gap sensitivity: CPP % of GDP
Source: Parliamentary Budget Officer.
0
5
10
15
20
25
30
35
40
2016 2026 2036 2046 2056 2066 2076 2086
0.0
-0.1
-0.1
0.0
0.0
-0.2
0.0
0.0
-1.0 -0.5 0.0 0.5 1.0
Lower interest rates
Higher interest rates
Lower GDP growth
Higher GDP growth
Interprovincial immigration
Younger population
Older population
Baseline
Figure 14-2
Figure 14-3

Fiscal Sustainability Report 2017
96
15. Quebec Pension Plan • Based on PBO’s assessment, the Quebec Pension Plan (QPP) is
sustainable over the long term. Expressed as a percentage of Quebec’s GDP, PBO estimates that the fiscal gap for the QPP is zero.
PBO’s financial projections for the QPP are based on the demographic and economic projections for Quebec summarized in Table 7-1 and Table 7-2, respectively. The effective rate of return on plan assets (before investment expenses) is assumed to equal PBO’s rate of return on the base CPP, which is projected to settle at 6.7 per cent.10
Contributions to the QPP are projected to grow with Quebec’s pensionable earnings and contribution rates. The contribution rate for the QPP in 2016 is 10.65 per cent of contributory earnings and is set to increase to 10.80 per cent in 2017 and remain at that rate thereafter. QPP contributions are projected to rise from 3.5 per cent of Quebec’s GDP in 2016 to 3.9 per cent of GDP over the long term.
QPP expenditures are projected to grow in line with the retirement-age population, inflation and a portion of real wage growth, and will increase steadily as population ageing drives retirement benefits. QPP benefit payments are projected to increase from 3.4 per cent of GDP in 2016 to 4.2 per cent in 2040 and to 5.0 per cent by the end of the projection period.
Administrative expenses, including investment expenses, are assumed to equal 0.2 per cent of financial assets over the projection horizon. QPP administrative expenses are projected to increase from 0.03 per cent of GDP in 2016 to 0.04 per cent of GDP in 2056 before gradually declining back to 0.03 per cent of GDP by 2091.
The net cash flow (that is, contributions less expenses) of the QPP is projected to decrease over the long term from 0.03 per cent of GDP in 2016 to an annual deficit of 1.09 per cent of GDP by the end of the projection horizon (Figure 15-1).
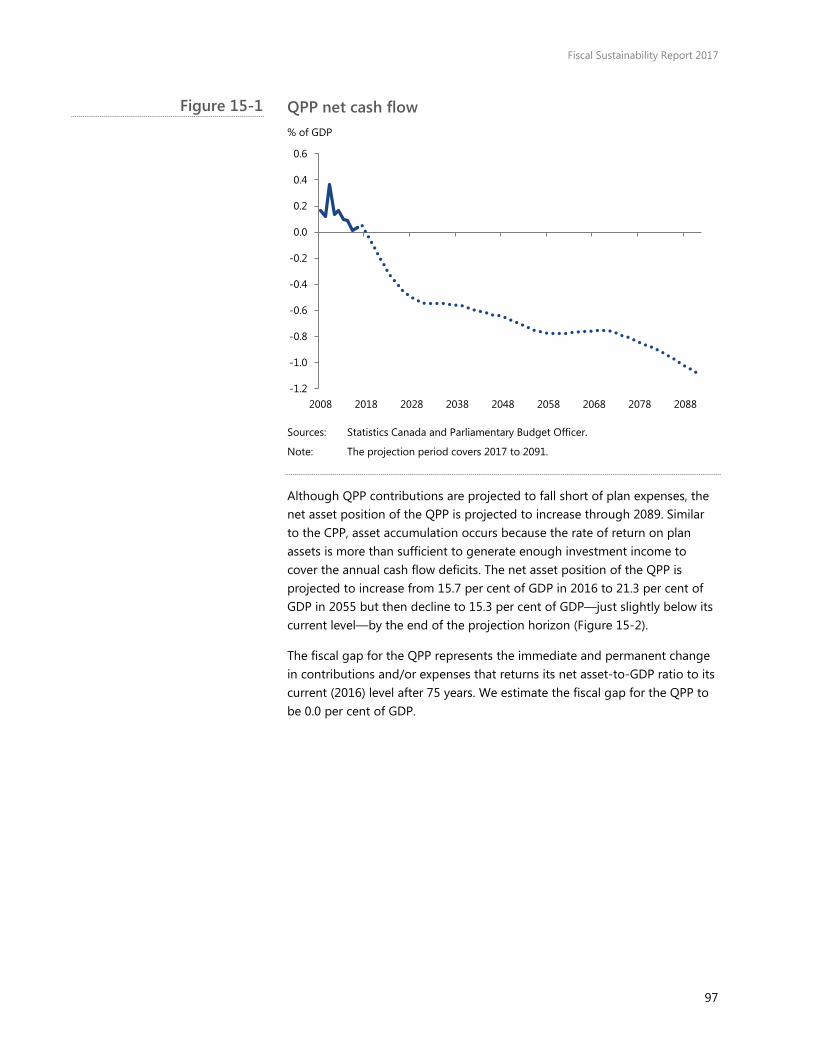
Fiscal Sustainability Report 2017
97
QPP net cash flow % of GDP
Sources: Statistics Canada and Parliamentary Budget Officer.
Note: The projection period covers 2017 to 2091.
Although QPP contributions are projected to fall short of plan expenses, the net asset position of the QPP is projected to increase through 2089. Similar to the CPP, asset accumulation occurs because the rate of return on plan assets is more than sufficient to generate enough investment income to cover the annual cash flow deficits. The net asset position of the QPP is projected to increase from 15.7 per cent of GDP in 2016 to 21.3 per cent of GDP in 2055 but then decline to 15.3 per cent of GDP—just slightly below its current level—by the end of the projection horizon (Figure 15-2).
The fiscal gap for the QPP represents the immediate and permanent change in contributions and/or expenses that returns its net asset-to-GDP ratio to its current (2016) level after 75 years. We estimate the fiscal gap for the QPP to be 0.0 per cent of GDP.
-1.2
-1.0
-0.8
-0.6
-0.4
-0.2
0.0
0.2
0.4
0.6
2008 2018 2028 2038 2048 2058 2068 2078 2088
Figure 15-1

Fiscal Sustainability Report 2017
98
QPP net asset position % of GDP
Source: Parliamentary Budget Officer.
Our qualitative assessment that the QPP is sustainable over the long term is somewhat sensitive to the alternative demographic and economic assumptions considered (Figure 15-3). In particular, under a demographic scenario with an older population or a scenario with lower interest rates (50 basis points lower), the QPP would not be sustainable over the long term. That said, the size of these impacts on the baseline QPP fiscal gap is modest.
Fiscal gap sensitivity: QPP % of GDP
Source: Parliamentary Budget Officer.
0
5
10
15
20
25
2016 2026 2036 2046 2056 2066 2076 2086
0.1
-0.1
0.0
0.0
0.0
-0.2
0.2
0.0
-1.0 -0.5 0.0 0.5 1.0
Lower interest rates
Higher interest rates
Lower GDP growth
Higher GDP growth
Interprovincial immigration
Younger population
Older population
Baseline
Figure 15-2
Figure 15-3

Fiscal Sustainability Report 2017
99
References Congressional Budget Office. (2012). The 2012 Long-Term Budget Outlook. Washington D.C. Retrieved from: http://cbo.gov/sites/default/files/cbofiles/attachments/06-05-Long-Term_Budget_Outlook.pdf.
Macklem, R.T., Rose, D. and Tetlow, R. (1994). Government Debt and Deficits in Canada. In W.B.P. Robson and W.M Scarth (eds.) Deficit Reduction What Pain, What Gain? C.D. Howe Institute, Toronto.
Mendes, R.R. (2014). The Neutral Rate of Interest in Canada. Bank of Canada Staff Discussion Paper 2014-5. Ottawa: Retrieved from: http://www.bankofcanada.ca/wp-content/uploads/2014/09/dp2014-5.pdf.
Office for Budget Responsibility. (2012). Fiscal Sustainability Report. United Kingdom. Retrieved from: http://budgetresponsibility.org.uk/docs/dlm_uploads/FSR2012WEB.pdf.
Parliamentary Budget Officer. (2012). Fiscal Sustainability Report 2012. Ottawa. Retrieved from: http://www.pbo-dpb.gc.ca/web/default/files/files/files/FSR_2012.pdf.
Parliamentary Budget Officer. (2014). Fiscal Sustainability Report 2014. Ottawa. Retrieved from: http://www.pbo-dpb.gc.ca/web/default/files/files/files/FSR_2014.pdf.
Parliamentary Budget Officer. (2017). Economic and Fiscal Outlook April 2017. Ottawa. Retrieved from: http://www.pbo-dpb.gc.ca/web/default/files/Documents/Reports/2017/EFO%20April%202017/EFO_MAY2017_EN.pdf.
Statistics Canada. (1998). Government Finances and Generational Equity. Catalogue no. 68-513-XPB. Ottawa: Retrieved from: http://dsp-psd.pwgsc.gc.ca/Collection/Statcan/68-513-XIB/0009768-513-XIB.pdf.
Statistics Canada. (2010). Health People, Health Places. Catalogue no. 82-229-X2009001. Ottawa: Retrieved from: http://www.statcan.gc.ca/pub/82-229-x/2009001/demo/dep-eng.htm.
Statistics Canada. (2015a). Population Projections for Canada (2013 to 2063), Provinces and Territories (2013 to 2038). Catalogue no. 91-520-X. Ottawa: Retrieved from: http://www.statcan.gc.ca/pub/91-520-x/91-520-x2014001-eng.htm.
Statistics Canada. (2015b). Population Projections for Canada (2013 to 2063), Provinces and Territories (2013 to 2038): Technical Report on Methodology and Assumptions (91-620-X). Catalogue no. 91-620-X. Ottawa: Retrieved from: http://www.statcan.gc.ca/pub/91-620-x/91-620-x2014001-eng.htm.
Fiscal Sustainability Report 2017
100
Financial data sources Appendix A:We use Statistics Canada’s Government Finance Statistics (GFS) as the basis for our fiscal projections.11 The GFS measure and analyze the economic dimensions of the public sector of Canada, consistent with Canada’s System of National Accounts and the International Monetary Fund’s global guidelines Government Finance Statistics Manual 2014.12
Internationally consistent GFS support comparative fiscal analysis, such as PBO’s Fiscal Sustainability Report, by overcoming definitional and accounting differences between public entities. In Canada and elsewhere, governments’ financial statements and reports (for example, Public Accounts, budgets) are based on unique organizational structures and on the accounting and reporting practices of individual governments, so there is a lack of consistency across jurisdictions and over time.13 The GFS provides the data consistency necessary for a coherent view of the current and future financial prospects of all levels of government in Canada.
Our projections rely upon two GFS financial statements:14
• Statement of Government Operations - summarizes all revenue and expense transactions, as well as the net operating balance.15
• Balance Sheet - presents the stocks of assets, liabilities, net worth and net financial worth at the end of the accounting period.16
We present the data in this report on a calendar year basis. The GFS are available by province and territory for the years 2007 to 2015.17
For the subnational government projections, we supplement GFS data with detailed health spending data from the Canadian Institute for Health Information (CIHI) National Health Expenditure Trends database, 1975 to 2016.18 Because CIHI disaggregates health spending data by province and age, in ways GFS does not, more detailed demographic-based health spending projections are possible.
Detailed information for the key data series presented in this report is available here FSR metadata_FSR.xlsx
We segment our projections of provincial and territorial fiscal sustainability by geographic regions, rather than administrative entities. This means that provincial data is presented in aggregate for most public sector entities (Figure A-1).

Fiscal Sustainability Report 2017
101
Public sectors included in this report
Sources: Statistics Canada and Parliamentary Budget Officer.
Note 1: Subsector division not based on government control.
Note 2: Except institutions that are embedded in the federal or provincial and territorial public accounts or local government audited financial statements.
Note 3: Primary and secondary education for New Brunswick, Nunavut and Yukon are included in provincial and territorial government.
Public sectors included in this report
Federal general government
Government
Ministries and departments, non-autonomous funds and organizations
Autonomous funds and organizations
Federal non-autonomous pension plans
Social Security Funds (Note 1)
Canada Pension Plan
Quebec Pension Plan
Provincial, territorial, local and aboriginal general government
Provincial and territorial general government
Government
Ministries and departments, non-autonomous funds and organizations
Autonomous funds and organizations
Provincial non-autonomous pension plans
Universities and colleges
Universities (Note 2)
Colleges, vocational and trade institutions (Note 2)
Health and social service institutions
Health boards (Note 2)
Social service organizations and community boards (Note 2)
Other health and social service organizations (Note 2)
Local general government
Government
Municipalities and quasi-municipalities, non-autonomous funds and organizations
Autonomous funds and organizations
School boards (Note 2, Note 3)
Aboriginal general government
Government
Aboriginal governments
Public sectors not included in this report
Government business enterprises
Federal government business enterprises
Provincial and territorial government business enterprises
Local government business enterprises
Figure A-1
Fiscal Sustainability Report 2017
102
Projecting provincial and Appendix B:territorial GDP
PBO uses a macroeconomic model of the Canadian economy at the national level to prepare its medium-term economic and fiscal outlook. Potential GDP, which provides a measure of the economy’s productive capacity, underpins the outlook. Following other organizations (for example, Finance Canada and the Congressional Budget Office), potential GDP is determined using a production function approach, which combines technological, capital and labour inputs, transforming them into output.
Over the long-term projection horizon, we assume—consistent with this production structure—that real GDP remains at its potential as determined by national trend labour inputs (constructed from age/sex-group specific employment rates and average weekly hours worked) and trend labour productivity (based on assumed steady-state growth) at the national level. GDP inflation is assumed to be constant at 2 per cent over the long term. Unlike the medium-term outlook, external economic variables such as oil prices are not explicitly taken into account in our long-term projections.
To ensure consistency between our national GDP projection and provincial/ territorial GDP projections, we first construct projections for “underlying” provincial labour inputs and labour productivity growth.
Over the long-term projection horizon, underlying provincial employment rates are constructed based on the assumption that age/sex-group specific employment rates remain constant at 2016 levels. The series for underlying average hours is assumed to remain constant at the level of average weekly hours worked observed in 2016. These underlying projections are then adjusted proportionately to ensure that they add up to the national employment rate and national average weekly hours worked.
Underlying labour productivity growth for each province is constructed based on the assumption that current labour productivity growth converges to its 1982-2015 historical average.
Territorial real GDP is assumed to grow in line with the territorial working-age population, the national employment rate and average hours worked, as well as labour productivity at the national level.
Since real GDP is measured on a chain Fisher basis, an approximation is required to aggregate provincial and territorial real GDP to the national level. Using this approximation, and given the projections for real GDP at the national and territorial level, as well as provincial labour inputs, underlying
Fiscal Sustainability Report 2017
103
provincial labour productivity is then adjusted to ensure that provincial and territorial real GDP growth add up to real GDP growth at the national level.
Similarly, underlying GDP inflation for each province and the territories is constructed based on the assumption that current GDP inflation converges to 2 per cent over the long term. To ensure consistency with the projection at the national level and the chain Fisher aggregation, underlying GDP inflation is then adjusted proportionately for the provinces and territories.

Fiscal Sustainability Report 2017
104
Fiscal projection Appendix C:methodology
Conceptually, our fiscal projection methodology is largely unchanged from previous iterations of the Fiscal Sustainability Report. However, incorporating discrete subnational entities presented two new technical challenges:
1. How to reflect the budgetary outlooks presented by each province and territory into the subnational projection.
2. How to model the allocation of major federal transfers, particularly Equalization and Territorial Formula Financing, among the provinces and territories.
This appendix highlights the key aspects of our pre-existing projection methods and provides comprehensive detail regarding our new technical additions.
PBO’s federal fiscal projection methodology
PBO’s federal fiscal projection methodology is largely unchanged from the approach used in previous FSR reports.19
Medium-term fiscal projection: 2016-2021
The medium-term fiscal projection is drawn from our April 2017 Economic and Fiscal Outlook. Our April 2017 forecast is then updated to reflect major new policy announcements by the federal Government, up to June 2017.
Long-term fiscal projection: 2022-2091
Revenues
We assume that federal revenues remain at a constant level of 14.3 per cent of GDP to the end of the projection period (2091). Without this assumption, more and more people would be pushed into higher personal income tax brackets, revenue would rise over the outlook, and the tax system would lose its progressivity.
Program Expenses
Spending on elderly and children’s benefits is driven by the long-term demographic profiles of beneficiaries and legislated program parameters.20

Fiscal Sustainability Report 2017
105
We project Employment Insurance (EI) benefits such that, over the long term, EI benefit payments grow in line with the average wage and the number of beneficiaries, which is assumed to grow with the number of unemployed.
We forecast transfers to subnational governments using legislated growth escalators. Most transfers are indexed to nominal GDP growth and spending remains constant as a share of GDP. The exception is the Canada Social Transfer (CST), which is legislated to grow at 3 per cent annually.
We assume all other federal spending grows with nominal GDP.
PBO’s subnational fiscal projection methodology
Medium-term fiscal projection: 2016-2020
The PBO medium-term fiscal projection for each subnational government is based primarily on revenue and spending forecasts published in provincial budgets, standardized to PBO’s provincial/territorial economic projection.
We use annual growth rates from own-source revenues and (transfer revenues to project GFS-based historic revenues data into the future. We use the same approach for program spending: health, social, education and other program spending.
Not all provincial governments publish a forecast to 2020. Therefore, when fiscal information is missing between 2016 and 2020, we estimate the data using the forecasting equations from our long-run model. We estimate public debt charges using our long-term equations. We assume that interest bearing debt and net financial liabilities increase by the primary balance plus interest expenses.
The specific steps in constructing each subnational projection are as follows.
• Starting point: Obtain Provincial/territorial governments’ financial data.
We begin with historical fiscal data from the Public Accounts and planned fiscal data from the 2017 budget.
Provincial governments’ past and planned financial data is generally presented on a fiscal year and financial accounting basis (Public Accounts). For the purposes of our long-term projection, we must convert this data to a calendar year and economic accounting basis (Government Finance Statistics).
• Step 1: Adjust the revenue forecasts in provincial/territorial budgets forobservable differences in nominal GDP forecasts.
PBO’s economic projection for a particular province may be stronger(weaker) than the economic forecast underpinning the respectiveprovincial government’s budget. We estimate effective rates on own

Fiscal Sustainability Report 2017
106
source revenues as a share of nominal GDP, and apply these rates to PBO’s economic forecast.
We do not adjust program spending forecasts for differing views on economic inputs.
• Step 2: Convert provincial budget data from a fiscal year to a calendar year.
For example, the 2015 calendar year value is equal to the sum of the 2014-15 fiscal year value weighted by 0.25 and the 2015-16 fiscal year value weighted by 0.75.
• Step 3: Calculate annual growth rates from calendar year provincial dollar amounts.
Aside from the calendar/fiscal year accounting basis, the amounts reported in provincial/territorial governments’ financial statements are not consistent with the amounts in the GFS for two key reasons:
i. Accounting differences. Provincial budgets are generally estimated on a financial rather than economic accounting basis. Therefore, Public Accounts data provided in each budget is not necessarily comparable across jurisdictions.
ii. Scope. The subnational government sector used as the reporting entity in this report includes local and aboriginal levels of government, in addition to provincial governments. 21 We use provincial governments’ fiscal plans as a proxy for the fiscal plans of each subnational government sector.
To address inconsistencies between accounting domains and scope, instead of using the dollar amounts set out in provincial-territorial budgets, we use the annual growth rates for each category of program spending.
Long-term fiscal projection: 2021-2091
The PBO long run fiscal projection draws on data from our long run demographic and economic outlooks. As a rule of thumb, each revenue and spending component grows with the annual growth rate of nominal GDP. However, we adjust several revenue and spending components for demographics and program-specific rules.
Revenue PBO projects two revenue components: own-source revenues and transfers from other levels of government. 𝑇𝑇𝑇𝑇𝑇𝑇𝑇𝑇𝑇𝑇 𝑟𝑟𝑟𝑟𝑟𝑟𝑟𝑟𝑟𝑟𝑟𝑟𝑟𝑟𝑟𝑟𝑖𝑖,𝑡𝑡 = 𝑂𝑂𝑂𝑂𝑟𝑟 𝑟𝑟𝑇𝑇𝑟𝑟𝑟𝑟𝑠𝑠𝑟𝑟 𝑟𝑟𝑟𝑟𝑟𝑟𝑟𝑟𝑟𝑟𝑟𝑟𝑟𝑟𝑟𝑟𝑖𝑖,𝑡𝑡 + 𝐹𝐹𝑟𝑟𝐹𝐹𝑟𝑟𝑟𝑟𝑇𝑇𝑇𝑇 𝑇𝑇𝑟𝑟𝑇𝑇𝑟𝑟𝑟𝑟𝑡𝑡𝑟𝑟𝑟𝑟 𝑟𝑟𝑟𝑟𝑟𝑟𝑟𝑟𝑟𝑟𝑟𝑟𝑟𝑟𝑟𝑟𝑖𝑖,𝑡𝑡

Fiscal Sustainability Report 2017
107
We assume that own-source revenues (federal and subnational) will remain constant as a share of GDP (the broadest measure of the tax base). This assumption implies certain government tax policies will adjust such that the tax burden on Canadians remains the same over the long-term projection horizon.22
𝑂𝑂𝑂𝑂𝑟𝑟 𝑟𝑟𝑇𝑇𝑟𝑟𝑟𝑟𝑠𝑠𝑟𝑟 𝑟𝑟𝑟𝑟𝑟𝑟𝑟𝑟𝑟𝑟𝑟𝑟𝑟𝑟𝑟𝑟𝑖𝑖,𝑡𝑡 = 𝑂𝑂𝑂𝑂𝑟𝑟 𝑟𝑟𝑇𝑇𝑟𝑟𝑟𝑟𝑠𝑠𝑟𝑟 𝑟𝑟𝑟𝑟𝑟𝑟𝑟𝑟𝑟𝑟𝑟𝑟𝑟𝑟𝑟𝑟𝑖𝑖,𝑡𝑡−1 ∗ 𝑁𝑁𝑁𝑁𝑁𝑁𝑁𝑁𝑡𝑡𝑁𝑁𝑁𝑁𝑁𝑁𝑁𝑁𝑡𝑡−1
We forecast transfer revenues by assuming existing program rules remain unchanged into the future. PBO assumes that the CHT and CST will continue to increase annually at the legislated escalators (that is, average growth in nominal GDP and 3 per cent, respectively).
We assume that the envelopes for Equalization, Territorial Formula Financing and other federal transfers, as well as transfers from provincial-territorial governments to the federal government, grow in line with national nominal GDP.
𝐹𝐹𝑟𝑟𝐹𝐹𝑟𝑟𝑟𝑟𝑇𝑇𝑇𝑇 𝑇𝑇𝑟𝑟𝑇𝑇𝑟𝑟𝑟𝑟𝑡𝑡𝑟𝑟𝑟𝑟 𝑟𝑟𝑟𝑟𝑟𝑟𝑟𝑟𝑟𝑟𝑟𝑟𝑟𝑟𝑟𝑟𝑖𝑖,𝑡𝑡= 𝐸𝐸𝐸𝐸𝑟𝑟𝑇𝑇𝑇𝑇𝐸𝐸𝐸𝐸𝑇𝑇𝑇𝑇𝐸𝐸𝑇𝑇𝑟𝑟𝑖𝑖,𝑡𝑡 + 𝐶𝐶𝐶𝐶𝑇𝑇𝑖𝑖,𝑡𝑡 + 𝐶𝐶𝐶𝐶𝑇𝑇𝑖𝑖,𝑡𝑡 + 𝑂𝑂𝑇𝑇ℎ𝑟𝑟𝑟𝑟 𝑇𝑇𝑟𝑟𝑇𝑇𝑟𝑟𝑟𝑟𝑡𝑡𝑟𝑟𝑟𝑟𝑟𝑟𝑖𝑖,𝑡𝑡
Where: i = province; t = calendar year; j = age cohort
Equalization
To forecast Equalization transfers to each province, we begin with each province’s current fiscal capacity and Equalization amounts.
Next, we forecast future non-resource fiscal capacity by assuming that each province’s ratio of non-resource revenues-to-GDP under the Reference Tax System (RTS) remains constant. We estimate this ratio as the average of non-resource revenues-to-GDP under the RTS from 2010 to 2015.23 Similarly, we assume that each province’s ratio of resource revenue-to-GDP remains constant as the average from 2010 to 2015.
The specific steps in this calculation are outlined below.
• Step 1: Calculation of 3-Year Weighted Average of Non-Resource FiscalCapacity
𝑁𝑁𝑇𝑇𝑟𝑟 𝑅𝑅𝑟𝑟𝑟𝑟 𝐹𝐹𝐸𝐸𝑟𝑟𝑠𝑠𝑇𝑇𝑇𝑇 𝑠𝑠𝑇𝑇𝑐𝑐𝑇𝑇𝑠𝑠𝐸𝐸𝑇𝑇𝑐𝑐𝑖𝑖,𝑡𝑡
= 𝑟𝑟𝑛𝑛𝐹𝐹𝑐𝑐𝑖𝑖,𝑡𝑡 ∗ � � �𝑇𝑇𝑇𝑇𝑇𝑇_𝑟𝑟𝑟𝑟𝑟𝑟𝑖𝑖𝑟𝑟𝑛𝑛𝐹𝐹𝑐𝑐𝑖𝑖
�𝑛𝑛
2015
𝑛𝑛=2010
� (2015 − 2010 + 1)�
Where: i = province; t = calendar year.
Non Res Fiscal capacity yieldi,t = 0.5 * Non Res Fiscal capacityi,t-2 + 0.25 * Non Res Fiscal capacityi,t-3 + 0.25 * Non Res Fiscal capacityi,t-4

Fiscal Sustainability Report 2017
108
Note that Tax_revi equals the sum of the yields of tax bases at national average tax rates by province of the following four revenue sources: Personal Income Taxes, Business Income Taxes, Consumption Taxes, and Property Taxes and Miscellaneous, as defined by the 2014 Equalization Formula.
Reductions to Equalization payments governed under the GDP Growth Ceiling and the Fiscal Capacity Cap. We estimate these amounts in accordance with current Equalization rules.
• Step 2: Calculation of 3-Year Weighted Average of Resource Fiscal Capacity
𝑅𝑅𝑟𝑟𝑟𝑟 𝐹𝐹𝐸𝐸𝑟𝑟𝑠𝑠𝑇𝑇𝑇𝑇 𝑠𝑠𝑇𝑇𝑐𝑐𝑇𝑇𝑠𝑠𝐸𝐸𝑇𝑇𝑐𝑐𝑖𝑖,𝑡𝑡= 𝑟𝑟𝑛𝑛𝐹𝐹𝑐𝑐𝑖𝑖,𝑡𝑡
∗ � � �𝑅𝑅𝑟𝑟𝑟𝑟𝑇𝑇𝑟𝑟𝑟𝑟𝑠𝑠𝑟𝑟_𝑟𝑟𝑟𝑟𝑟𝑟𝑖𝑖
𝑟𝑟𝑛𝑛𝐹𝐹𝑐𝑐𝑖𝑖�𝑛𝑛
2015
𝑛𝑛=2010
� (2015− 2010 + 1)�
Res Fiscal capacity yieldi,t = 0.5 * Res Fiscal capacityi,t-2 + 0.25 * Res Fiscal capacityi,t-3 + 0.25 * Res Fiscal capacityi,t-4
• Step 3: Calculate Equalization based on 50% and 0% resource inclusion, prior to determination of fiscal capacity cap (FCC)
o Step 3a: Non-resource fiscal capacity + 50% of resource fiscal capacity in step 2
Wgt_popi,t = 0.5 * pop_totali,t-2 + 0.25 * pop_totali,t-3 +0.25 * pop_totali,t-4
Per_capita Fiscal capacityi,t = ( Non Res Fiscal capacity yieldi,t + 0.5 * Res Fiscal capacity yieldi,t ) / Wgt_popi,t
𝑁𝑁𝑟𝑟𝑟𝑟_𝑠𝑠𝑇𝑇𝑐𝑐𝐸𝐸𝑇𝑇𝑇𝑇 𝐹𝐹𝐸𝐸𝑟𝑟𝑠𝑠𝑇𝑇𝑇𝑇 𝑠𝑠𝑇𝑇𝑐𝑐𝑇𝑇𝑠𝑠𝐸𝐸𝑇𝑇𝑐𝑐 𝐹𝐹𝑟𝑟𝑡𝑡𝐸𝐸𝑠𝑠𝐸𝐸𝑇𝑇𝑖𝑖,𝑡𝑡= 𝑁𝑁𝑟𝑟𝑟𝑟_𝑠𝑠𝑇𝑇𝑐𝑐𝐸𝐸𝑇𝑇𝑇𝑇 𝐹𝐹𝐸𝐸𝑟𝑟𝑠𝑠𝑇𝑇𝑇𝑇 𝑠𝑠𝑇𝑇𝑐𝑐𝑇𝑇𝑠𝑠𝐸𝐸𝑇𝑇𝑐𝑐𝑖𝑖,𝑡𝑡
− ��𝑁𝑁𝑟𝑟𝑟𝑟_𝑠𝑠𝑇𝑇𝑐𝑐𝐸𝐸𝑇𝑇𝑇𝑇 𝐹𝐹𝐸𝐸𝑟𝑟𝑠𝑠𝑇𝑇𝑇𝑇 𝑠𝑠𝑇𝑇𝑐𝑐𝑇𝑇𝑠𝑠𝐸𝐸𝑇𝑇𝑐𝑐𝑖𝑖,𝑡𝑡
10
𝑖𝑖=1
� 10�
Pre-Cap EQ including 50% resi,t = MAX [ – Per_capita Fiscal capacity deficiti,t * Wgt_popi,t , 0 ]
o Step 3b: Non-resource fiscal capacity
Per_capita NoR Fiscal capacityi,t = Non_Res Fiscal capacity yieldi,t / Wgt_popi,t
𝑁𝑁𝑟𝑟𝑟𝑟_𝑠𝑠𝑇𝑇𝑐𝑐𝐸𝐸𝑇𝑇𝑇𝑇 𝑁𝑁𝑇𝑇𝑅𝑅 𝐹𝐹𝐸𝐸𝑟𝑟𝑠𝑠𝑇𝑇𝑇𝑇 𝑠𝑠𝑇𝑇𝑐𝑐𝑇𝑇𝑠𝑠𝐸𝐸𝑇𝑇𝑐𝑐 𝐹𝐹𝑟𝑟𝑡𝑡𝐸𝐸𝑠𝑠𝐸𝐸𝑇𝑇𝑖𝑖,𝑡𝑡= 𝑁𝑁𝑟𝑟𝑟𝑟_𝑠𝑠𝑇𝑇𝑐𝑐𝐸𝐸𝑇𝑇𝑇𝑇 𝑁𝑁𝑇𝑇𝑅𝑅 𝐹𝐹𝐸𝐸𝑟𝑟𝑠𝑠𝑇𝑇𝑇𝑇 𝑠𝑠𝑇𝑇𝑐𝑐𝑇𝑇𝑠𝑠𝐸𝐸𝑇𝑇𝑐𝑐𝑖𝑖,𝑡𝑡
− ��𝑁𝑁𝑟𝑟𝑟𝑟_𝑠𝑠𝑇𝑇𝑐𝑐𝐸𝐸𝑇𝑇𝑇𝑇 𝑁𝑁𝑇𝑇𝑅𝑅 𝐹𝐹𝐸𝐸𝑟𝑟𝑠𝑠𝑇𝑇𝑇𝑇 𝑠𝑠𝑇𝑇𝑐𝑐𝑇𝑇𝑠𝑠𝐸𝐸𝑇𝑇𝑐𝑐𝑖𝑖,𝑡𝑡
10
𝑖𝑖=1
� 10�

Fiscal Sustainability Report 2017
109
Pre-Cap EQ excluding resi,t = MAX [ – Per_capita NoR Fiscal capacity deficiti,t * Wgt_popi,t , 0 ]
max Pre-Cap EQi,t = MAX [ Pre-Cap EQ including 50% resi,t , Pre-Cap EQ excluding resi,t ]
• Step 4: Determination of Fiscal Capacity Cap (FCC)
Total Fiscal capacity_FCCi,t = Non Res Fiscal capacity yieldi,t + Res Fiscal capacity yieldi,t + Pre-Cap EQ including 50% resi,t
Per_capita Fiscal capacity_FCCi,t = Total Fiscal capacity_FCCi,t / Wgt_popi,t
𝑅𝑅𝑟𝑟𝑠𝑠𝑟𝑟𝐸𝐸𝑟𝑟𝐸𝐸𝑟𝑟𝑛𝑛 𝑐𝑐𝑟𝑟𝑇𝑇𝑟𝑟𝐸𝐸𝑟𝑟𝑠𝑠𝑟𝑟𝑟𝑟 𝐹𝐹𝐸𝐸𝑟𝑟𝑠𝑠𝑇𝑇𝑇𝑇 𝑠𝑠𝑇𝑇𝑐𝑐𝑇𝑇𝑠𝑠𝐸𝐸𝑇𝑇𝑐𝑐𝑡𝑡
= �𝑇𝑇𝑇𝑇𝑇𝑇𝑇𝑇𝑇𝑇 𝐹𝐹𝐸𝐸𝑟𝑟𝑠𝑠𝑇𝑇𝑇𝑇 𝑠𝑠𝑇𝑇𝑐𝑐𝑇𝑇𝑠𝑠𝐸𝐸𝑇𝑇𝑐𝑐_𝐹𝐹𝐶𝐶𝐶𝐶𝑖𝑖,𝑡𝑡
𝑊𝑊𝑛𝑛𝑇𝑇_𝑐𝑐𝑇𝑇𝑐𝑐𝑖𝑖,𝑡𝑡
10
𝑖𝑖=1
if 𝑁𝑁𝑟𝑟𝑟𝑟-𝐶𝐶𝑇𝑇𝑐𝑐 𝐸𝐸𝐸𝐸 𝐸𝐸𝑟𝑟𝑠𝑠𝑇𝑇𝑟𝑟𝐹𝐹𝐸𝐸𝑟𝑟𝑛𝑛 50% 𝑟𝑟𝑟𝑟𝑟𝑟𝑖𝑖,𝑡𝑡 > 0
Per_capita impact_FCCi,t = MIN [ Per_capita Fiscal capacity_FCCi,t – Receiving provinces Fiscal capacityt , 0 ]
EQ post FCCi,t = MAX [ max Pre-Cap EQi,t – ( Per_capita impact_FCCi,t * Wgt_popi,t ) , 0 ]
𝑇𝑇𝑇𝑇𝑇𝑇𝑇𝑇𝑇𝑇 𝐸𝐸𝐸𝐸 𝑐𝑐𝑇𝑇𝑟𝑟𝑇𝑇 𝐹𝐹𝐶𝐶𝐶𝐶𝑡𝑡 = �𝐸𝐸𝐸𝐸 𝑐𝑐𝑇𝑇𝑟𝑟𝑇𝑇 𝐹𝐹𝐶𝐶𝐶𝐶𝑖𝑖,𝑡𝑡
10
𝑖𝑖=1
• Step 5: Equalization adjustment to provide growth in line with GDP
Total EQt = Total EQt-1 * ( ngdpCA,t / ngdpCA,t-1 + ngdpCA,t-1 / ngdpCA,t-2 +ngdpCA,t-2 / ngdpCA,t-3 ) / 3
Total Adjt = Total EQt – Total EQ post FCCt
𝐴𝐴𝐹𝐹𝐴𝐴 𝑁𝑁𝑟𝑟𝑟𝑟_𝑠𝑠𝑇𝑇𝑐𝑐𝐸𝐸𝑇𝑇𝑇𝑇𝑡𝑡 = 𝑇𝑇𝑇𝑇𝑇𝑇𝑇𝑇𝑇𝑇 𝐴𝐴𝐹𝐹𝐴𝐴𝑡𝑡 �𝑊𝑊𝑛𝑛𝑇𝑇_𝑐𝑐𝑇𝑇𝑐𝑐𝑖𝑖,𝑡𝑡
10
𝑖𝑖=1
if 𝐸𝐸𝐸𝐸 𝑐𝑐𝑇𝑇𝑟𝑟𝑇𝑇 𝐹𝐹𝐶𝐶𝐶𝐶𝑖𝑖,𝑡𝑡 > 0�
Adjusti,t = Adj Per_capitat * Wgt_popi,t
EQ post Adji,t = MAX [EQ post FCCi,t – Adjusti,t , 0 ] This represents the actual equalization payment that province “i” will receive.
If Total EQt > Total EQ post FCCt , then the adjustment would be positive. The treatment of the adjustment is symmetrical. As such, if such a situation arose, receiving provinces would get a positive adjustment to their Equalization entitlement in order to use the entire equalization envelope.
Furthermore, note that in some years, the adjustment could bring the Equalization entitlement of a province below zero. Since there are no negative payments, a second adjustment is needed to reduce the Equalization payments of the remaining provinces to stay within the total
Fiscal Sustainability Report 2017
110
Equalization envelope capped by GDP growth. In such a case, the second adjustment would be:
𝑇𝑇𝑇𝑇𝑇𝑇𝑇𝑇𝑇𝑇 𝐴𝐴𝐹𝐹𝐴𝐴_2𝑡𝑡 = 𝑇𝑇𝑇𝑇𝑇𝑇𝑇𝑇𝑇𝑇 𝐸𝐸𝐸𝐸𝑡𝑡 −�𝐸𝐸𝐸𝐸 𝑐𝑐𝑇𝑇𝑟𝑟𝑇𝑇 𝐴𝐴𝐹𝐹𝐴𝐴𝑖𝑖,𝑡𝑡
10
𝑖𝑖=1
𝐴𝐴𝐹𝐹𝐴𝐴_2 𝑁𝑁𝑟𝑟𝑟𝑟_𝑠𝑠𝑇𝑇𝑐𝑐𝐸𝐸𝑇𝑇𝑇𝑇𝑡𝑡 = 𝑇𝑇𝑇𝑇𝑇𝑇𝑇𝑇𝑇𝑇 𝐴𝐴𝐹𝐹𝐴𝐴_2𝑡𝑡 �𝑊𝑊𝑛𝑛𝑇𝑇_𝑐𝑐𝑇𝑇𝑐𝑐𝑖𝑖,𝑡𝑡
10
𝑖𝑖=1
if 𝐸𝐸𝐸𝐸 𝑐𝑐𝑇𝑇𝑟𝑟𝑇𝑇 𝐴𝐴𝐹𝐹𝐴𝐴𝑖𝑖,𝑡𝑡 > 0�
Canada Health Transfer & Canada Social Transfer
The federal CHT envelope grows annually by a three-year moving average of nominal GDP, with funding guaranteed to increase by at least 3 per cent per year. The CST envelope grows by 3 per cent annually. Provincial and territorial revenues from the Canada Health Transfer (CHT) and Canada Social Transfer (CST) are projected on an equal per capita cash basis.
These amounts are calculated gross of the Quebec Abatement.24 Quebec’s transfer revenues in our projections are shown net of the Abatement, as is the aggregate federal transfer expense to provinces and territories. The specification for the Quebec Abatement calculation is as follows:
Quebec_Abatementt = Quebec_Abatementt * (ngdpQC,t /ngdpQC,t-1)
CHT_QAt = Quebec_Abatementt * (0.085/ 0.135)
CST_QAt = Quebec_Abatementt * (0.05/ 0.135)
Territorial Formula Financing
The federal Territorial Financing Formula is intended to ensure that territorial governments have adequate funding to provide public services to their citizens, comparable to those of the provinces. Each territory’s allocation is based on the gap between the estimate of how much it would need to spend to provide comparable services (that is, the Gross Expenditure Base) and its capacity to raise revenues. Our model for Territorial Formula Financing is presented as follows.
• Step 1: Calculating the population adjusted gross expenditure escalator
o Step 1a: Computing the annual population adjustment factor
3 year moving average of the territories’ population change, with a 2 year lag: ∆𝑀𝑀𝐴𝐴_𝑐𝑐𝑇𝑇𝑐𝑐𝑇𝑇𝑇𝑇,𝑡𝑡= �𝑐𝑐𝑇𝑇𝑐𝑐𝑇𝑇𝑇𝑇,𝑡𝑡−4 𝑐𝑐𝑇𝑇𝑐𝑐𝑇𝑇𝑇𝑇,𝑡𝑡−5⁄ + 𝑐𝑐𝑇𝑇𝑐𝑐𝑇𝑇𝑇𝑇 ,𝑡𝑡−3 𝑐𝑐𝑇𝑇𝑐𝑐𝑇𝑇𝑇𝑇,𝑡𝑡−4⁄ + 𝑐𝑐𝑇𝑇𝑐𝑐𝑇𝑇𝑇𝑇,𝑡𝑡−2 𝑐𝑐𝑇𝑇𝑐𝑐𝑇𝑇𝑇𝑇,𝑡𝑡−3⁄ � 3⁄

Fiscal Sustainability Report 2017
111
3 year moving average of the Canadian population change, with a 2 year lag:
∆𝑀𝑀𝐴𝐴_𝑐𝑐𝑇𝑇𝑐𝑐𝐶𝐶𝐶𝐶,𝑡𝑡= �𝑐𝑐𝑇𝑇𝑐𝑐𝐶𝐶𝐶𝐶,𝑡𝑡−4 𝑐𝑐𝑇𝑇𝑐𝑐𝐶𝐶𝐶𝐶,𝑡𝑡−5⁄ + 𝑐𝑐𝑇𝑇𝑐𝑐𝐶𝐶𝐶𝐶,𝑡𝑡−3 𝑐𝑐𝑇𝑇𝑐𝑐𝐶𝐶𝐶𝐶,𝑡𝑡−4⁄ + 𝑐𝑐𝑇𝑇𝑐𝑐𝐶𝐶𝐶𝐶,𝑡𝑡−2 𝑐𝑐𝑇𝑇𝑐𝑐𝐶𝐶𝐶𝐶,𝑡𝑡−3⁄ � 3⁄
Annual population adjustment factor:
𝑁𝑁𝑂𝑂𝑁𝑁_𝑡𝑡𝑡𝑡 =∆𝑀𝑀𝐴𝐴_𝑐𝑐𝑇𝑇𝑐𝑐𝑇𝑇𝑇𝑇,𝑡𝑡
∆𝑀𝑀𝐴𝐴_𝑐𝑐𝑇𝑇𝑐𝑐𝐶𝐶𝐶𝐶,𝑡𝑡
o Step 1b: Computing the annual provincial-territorial-local expenditureescalator
∆𝑀𝑀𝐴𝐴_𝑐𝑐𝑇𝑇𝑇𝑇_𝑟𝑟𝑇𝑇𝑐𝑐𝑡𝑡= (𝑐𝑐𝑇𝑇𝑇𝑇_𝑟𝑟𝑇𝑇𝑐𝑐𝑡𝑡−4 𝑐𝑐𝑇𝑇𝑇𝑇_𝑟𝑟𝑇𝑇𝑐𝑐𝑡𝑡−5⁄ + 𝑐𝑐𝑇𝑇𝑇𝑇_𝑟𝑟𝑇𝑇𝑐𝑐𝑡𝑡−3 𝑐𝑐𝑇𝑇𝑇𝑇_𝑟𝑟𝑇𝑇𝑐𝑐𝑡𝑡−4⁄ + 𝑐𝑐𝑇𝑇𝑇𝑇_𝑟𝑟𝑇𝑇𝑐𝑐𝑡𝑡−2 𝑐𝑐𝑇𝑇𝑇𝑇_𝑟𝑟𝑇𝑇𝑐𝑐𝑡𝑡−3⁄ ) 3⁄
Where ptl_expt represents the total program spending of all provincial, territorial and local levels of government across the country.
Population adjusted gross expenditure escalator (PAGE)
𝑁𝑁𝐴𝐴𝑁𝑁𝐸𝐸𝑡𝑡 = ∆𝑀𝑀𝐴𝐴_𝑐𝑐𝑇𝑇𝑇𝑇_𝑟𝑟𝑇𝑇𝑐𝑐𝑡𝑡 ∗ 𝑁𝑁𝑂𝑂𝑁𝑁_𝑡𝑡𝑡𝑡
• Step 2: Computing the gross expenditure base (GEB)
𝑁𝑁𝐸𝐸𝐺𝐺𝑇𝑇𝑇𝑇,2017 = 𝑁𝑁𝐸𝐸𝐺𝐺𝑦𝑦𝑡𝑡,2017 + 𝑁𝑁𝐸𝐸𝐺𝐺𝑛𝑛𝑡𝑡,2017 + 𝑁𝑁𝐸𝐸𝐺𝐺𝑛𝑛𝑛𝑛,2017
𝑁𝑁𝐸𝐸𝐺𝐺𝑇𝑇𝑇𝑇,𝑡𝑡 = 𝑁𝑁𝐸𝐸𝐺𝐺𝑇𝑇𝑇𝑇,𝑡𝑡−1 ∗ 𝑁𝑁𝐴𝐴𝑁𝑁𝐸𝐸𝑡𝑡
• Step 3: Computing a 3 year moving average of the territories revenueswith a 2 year lag
𝑀𝑀𝐴𝐴_𝑟𝑟𝑟𝑟𝑟𝑟𝑡𝑡 = (𝑟𝑟𝑟𝑟𝑟𝑟𝑡𝑡−4 + 𝑟𝑟𝑟𝑟𝑟𝑟𝑡𝑡−3 + 𝑟𝑟𝑟𝑟𝑟𝑟𝑡𝑡−2) 3⁄
Where revt is the sum of the three territories’ own-source revenues as projected by our long term model. 25
• Step 4: Final Grant Entitlement
𝑇𝑇𝐹𝐹𝐹𝐹𝑡𝑡 = 𝑁𝑁𝐸𝐸𝐺𝐺𝑇𝑇𝑇𝑇,𝑡𝑡 − 0.7 ∗ 𝑀𝑀𝐴𝐴_𝑟𝑟𝑟𝑟𝑟𝑟𝑡𝑡

Fiscal Sustainability Report 2017
112
Other federal transfers Other federal transfers are comprised of other current transfers and capital transfers. The former are assumed to grow in line with each jurisdiction’s nominal GDP; the latter are assumed to grow with national nominal GDP: Spending PBO projects four program spending components: health, education, social and other. Program spending plus public debt charges equals total spending.
𝑇𝑇𝑇𝑇𝑇𝑇𝑇𝑇𝑇𝑇 𝑟𝑟𝑐𝑐𝑟𝑟𝑟𝑟𝐹𝐹𝐸𝐸𝑟𝑟𝑛𝑛𝑖𝑖,𝑡𝑡 = 𝑁𝑁𝑟𝑟𝑇𝑇𝑛𝑛𝑟𝑟𝑇𝑇𝑃𝑃 𝑟𝑟𝑐𝑐𝑟𝑟𝑟𝑟𝐹𝐹𝐸𝐸𝑟𝑟𝑛𝑛𝑖𝑖,𝑡𝑡 + 𝑁𝑁𝑟𝑟𝑃𝑃𝑇𝑇𝐸𝐸𝑠𝑠 𝐹𝐹𝑟𝑟𝑃𝑃𝑇𝑇 𝑠𝑠ℎ𝑇𝑇𝑟𝑟𝑛𝑛𝑟𝑟𝑟𝑟𝑖𝑖,𝑡𝑡
𝑁𝑁𝑟𝑟𝑇𝑇𝑛𝑛𝑟𝑟𝑇𝑇𝑃𝑃 𝑟𝑟𝑐𝑐𝑟𝑟𝑟𝑟𝐹𝐹𝐸𝐸𝑟𝑟𝑛𝑛𝑖𝑖,𝑡𝑡
= 𝐶𝐶𝑟𝑟𝑇𝑇𝑇𝑇𝑇𝑇ℎ𝑖𝑖,𝑡𝑡 + 𝐸𝐸𝐹𝐹𝑟𝑟𝑠𝑠𝑇𝑇𝑇𝑇𝐸𝐸𝑇𝑇𝑟𝑟𝑖𝑖,𝑡𝑡 + 𝐶𝐶𝑇𝑇𝑠𝑠𝐸𝐸𝑇𝑇𝑇𝑇𝑖𝑖,𝑡𝑡 + 𝑂𝑂𝑇𝑇ℎ𝑟𝑟𝑟𝑟 𝑐𝑐𝑟𝑟𝑇𝑇𝑛𝑛𝑟𝑟𝑇𝑇𝑃𝑃𝑟𝑟𝑖𝑖,𝑡𝑡
The general approach for projecting long-term federal and subnational government spending on programs decomposes growth in nominal spending on a given category into its two key drivers: population composition (POP) and nominal income (GDP) The population composition factor for each category attempts to capture the impact of changes in the population’s age structure over time. Individual spending programs are then projected according to shifts in their target demographics and particular legislation.
𝐸𝐸𝐹𝐹𝑟𝑟𝑠𝑠𝑇𝑇𝑇𝑇𝐸𝐸𝑇𝑇𝑟𝑟𝑖𝑖,𝑡𝑡 = 𝐸𝐸𝐹𝐹𝑟𝑟𝑠𝑠𝑇𝑇𝑇𝑇𝐸𝐸𝑇𝑇𝑟𝑟𝑖𝑖,𝑡𝑡−1 ∗𝑁𝑁𝑁𝑁𝑁𝑁𝑁𝑁𝑖𝑖,𝑡𝑡
𝑁𝑁𝑁𝑁𝑁𝑁𝑁𝑁𝑖𝑖,𝑡𝑡−1 ∗
𝑁𝑁𝑃𝑃𝑃𝑃5_17𝑖𝑖,𝑗𝑗,𝑡𝑡
𝑁𝑁𝑃𝑃𝑃𝑃5_17𝑖𝑖,𝑗𝑗,𝑡𝑡−1 ∗ 𝑇𝑇𝑃𝑃𝑡𝑡𝑇𝑇𝑇𝑇 𝑁𝑁𝑃𝑃𝑃𝑃𝑖𝑖,𝑡𝑡−1
𝑇𝑇𝑃𝑃𝑡𝑡𝑇𝑇𝑇𝑇 𝑁𝑁𝑃𝑃𝑃𝑃𝑖𝑖,𝑡𝑡
𝐶𝐶𝑟𝑟𝑇𝑇𝑇𝑇𝑇𝑇ℎ𝑖𝑖,𝑡𝑡 = �𝐶𝐶𝑟𝑟𝑇𝑇𝑇𝑇𝑇𝑇ℎ𝑗𝑗
𝑖𝑖,𝑗𝑗,𝑡𝑡−1 ∗ 𝑁𝑁𝑁𝑁𝑁𝑁𝑁𝑁𝑖𝑖,𝑡𝑡
𝑁𝑁𝑁𝑁𝑁𝑁𝑁𝑁𝑖𝑖,𝑡𝑡−1 ∗𝑁𝑁𝑇𝑇𝑐𝑐𝑖𝑖,𝑗𝑗,𝑡𝑡
𝑁𝑁𝑇𝑇𝑐𝑐𝑖𝑖,𝑗𝑗,𝑡𝑡−1 ∗𝑇𝑇𝑇𝑇𝑇𝑇𝑇𝑇𝑇𝑇 𝑁𝑁𝑇𝑇𝑐𝑐𝑖𝑖,𝑡𝑡−1
𝑇𝑇𝑇𝑇𝑇𝑇𝑇𝑇𝑇𝑇 𝑁𝑁𝑇𝑇𝑐𝑐𝑖𝑖,𝑡𝑡
𝐶𝐶𝑇𝑇𝑠𝑠𝐸𝐸𝑇𝑇𝑇𝑇𝑖𝑖,𝑡𝑡 = 𝐶𝐶𝑇𝑇𝑠𝑠𝐸𝐸𝑇𝑇𝑇𝑇𝑖𝑖,𝑡𝑡−1 ∗𝑁𝑁𝑁𝑁𝑁𝑁𝑁𝑁𝑖𝑖,𝑡𝑡
𝑁𝑁𝑁𝑁𝑁𝑁𝑁𝑁𝑖𝑖,𝑡𝑡−1 ∗𝑁𝑁𝑇𝑇𝑐𝑐15_64𝑖𝑖,𝑗𝑗,𝑡𝑡
𝑁𝑁𝑇𝑇𝑐𝑐15_64𝑖𝑖,𝑗𝑗,𝑡𝑡−1 ∗𝑇𝑇𝑇𝑇𝑇𝑇𝑇𝑇𝑇𝑇 𝑁𝑁𝑇𝑇𝑐𝑐𝑖𝑖,𝑡𝑡−1
𝑇𝑇𝑇𝑇𝑇𝑇𝑇𝑇𝑇𝑇 𝑁𝑁𝑇𝑇𝑐𝑐𝑖𝑖,𝑡𝑡
𝑂𝑂𝑇𝑇ℎ𝑟𝑟𝑟𝑟 𝑐𝑐𝑟𝑟𝑇𝑇𝑛𝑛𝑟𝑟𝑇𝑇𝑃𝑃𝑟𝑟𝑖𝑖,𝑡𝑡 = 𝑂𝑂𝑇𝑇ℎ𝑟𝑟𝑟𝑟 𝑐𝑐𝑟𝑟𝑇𝑇𝑛𝑛𝑟𝑟𝑇𝑇𝑃𝑃𝑟𝑟𝑖𝑖,𝑡𝑡−1 ∗𝑁𝑁𝑁𝑁𝑁𝑁𝑁𝑁𝑖𝑖,𝑡𝑡
𝑁𝑁𝑁𝑁𝑁𝑁𝑁𝑁𝑖𝑖,𝑡𝑡−1
We estimate interest charges on public debt as the effective interest rate multiplied by the amount of interest bearing debt at the start of the year. 𝑁𝑁𝑟𝑟𝑃𝑃𝑇𝑇𝐸𝐸𝑠𝑠 𝐹𝐹𝑟𝑟𝑃𝑃𝑇𝑇 𝑠𝑠ℎ𝑇𝑇𝑟𝑟𝑛𝑛𝑟𝑟𝑟𝑟𝑖𝑖,𝑡𝑡 = 𝐼𝐼𝑟𝑟𝑇𝑇𝑟𝑟𝑟𝑟𝑟𝑟𝑟𝑟𝑇𝑇 𝑃𝑃𝑟𝑟𝑇𝑇𝑟𝑟𝐸𝐸𝑟𝑟𝑛𝑛 𝐹𝐹𝑟𝑟𝑃𝑃𝑇𝑇𝑖𝑖,𝑡𝑡−1 ∗ 𝐸𝐸𝑡𝑡𝑡𝑡𝑟𝑟𝑠𝑠𝑇𝑇𝐸𝐸𝑟𝑟𝑟𝑟 𝐸𝐸𝑟𝑟𝑇𝑇𝑟𝑟𝑟𝑟𝑟𝑟𝑟𝑟𝑇𝑇 𝑟𝑟𝑇𝑇𝑇𝑇𝑟𝑟𝑖𝑖,𝑡𝑡 We assume that the future borrowing spread in each province is constant. We have calculated spreads for each province as equal to the average spread at month end (January 1995 to April 2017) between the Government of Canada 10-year benchmark bond and the equivalent 10-year bond for each jurisdiction. Finally, the Territories’ borrowing spread is assumed equal to the

Fiscal Sustainability Report 2017
113
population-weighted average spread of the six least-populous Canadian provinces.
The effective interest rate on interest bearing debt is a lagged variable in our model because the stock of debt is not typically fully turned over each year. That is, some interest bearing debt will have been issued in prior years, subject to market rates at the time of issuance.
𝐸𝐸𝑡𝑡𝑡𝑡𝑟𝑟𝑠𝑠𝑇𝑇𝐸𝐸𝑟𝑟𝑟𝑟 𝐸𝐸𝑟𝑟𝑇𝑇𝑟𝑟𝑟𝑟𝑟𝑟𝑟𝑟𝑇𝑇 𝑟𝑟𝑇𝑇𝑇𝑇𝑟𝑟𝑖𝑖,𝑡𝑡 = 0.8 ∗ 𝐸𝐸𝑡𝑡𝑡𝑡𝑟𝑟𝑠𝑠𝑇𝑇𝐸𝐸𝑟𝑟𝑟𝑟 𝐸𝐸𝑟𝑟𝑇𝑇𝑟𝑟𝑟𝑟𝑟𝑟𝑟𝑟𝑇𝑇 𝑟𝑟𝑇𝑇𝑇𝑇𝑟𝑟𝑖𝑖,𝑡𝑡−1 + 0.2 ∗ (0.8 ∗ 𝑁𝑁𝐶𝐶10𝑌𝑌𝑡𝑡 + 0.2∗ 𝑁𝑁𝐶𝐶90𝑁𝑁𝑡𝑡 + 𝑅𝑅𝑇𝑇𝑇𝑇𝑟𝑟 𝑟𝑟𝑐𝑐𝑟𝑟𝑟𝑟𝑇𝑇𝐹𝐹𝑖𝑖 )
Primary balance and debt stock
In this report, the stock of debt that is used to assess fiscal sustainability is based on the GFS concept of net financial worth, which is defined as financial assets less total liabilities. Rearranging these terms (that is, total liabilities less financial assets) results in net debt that is the concept used to assess fiscal sustainability.
Changes to net debt depend on the accumulation of deficits and surpluses over time.
𝑁𝑁𝑟𝑟𝑇𝑇 𝑡𝑡𝐸𝐸𝑟𝑟𝑇𝑇𝑟𝑟𝑠𝑠𝐸𝐸𝑇𝑇𝑇𝑇 𝑇𝑇𝐸𝐸𝑇𝑇𝑃𝑃𝐸𝐸𝑇𝑇𝐸𝐸𝑇𝑇𝐸𝐸𝑟𝑟𝑟𝑟𝑖𝑖,𝑡𝑡
= 𝐼𝐼𝑟𝑟𝑇𝑇𝑟𝑟𝑟𝑟𝑟𝑟𝑟𝑟𝑇𝑇 𝑃𝑃𝑟𝑟𝑇𝑇𝑟𝑟𝐸𝐸𝑟𝑟𝑛𝑛 𝐹𝐹𝑟𝑟𝑃𝑃𝑇𝑇𝑖𝑖,𝑡𝑡 + 𝑁𝑁𝑇𝑇𝑟𝑟 𝐸𝐸𝑟𝑟𝑇𝑇𝑟𝑟𝑟𝑟𝑟𝑟𝑟𝑟𝑇𝑇 𝑃𝑃𝑟𝑟𝑇𝑇𝑟𝑟𝐸𝐸𝑟𝑟𝑛𝑛 𝐹𝐹𝑟𝑟𝑃𝑃𝑇𝑇𝑖𝑖,𝑡𝑡− 𝐹𝐹𝐸𝐸𝑟𝑟𝑇𝑇𝑟𝑟𝑠𝑠𝐸𝐸𝑇𝑇𝑇𝑇 𝑇𝑇𝑟𝑟𝑟𝑟𝑟𝑟𝑇𝑇𝑟𝑟𝑖𝑖,𝑡𝑡
𝐼𝐼𝑟𝑟𝑇𝑇𝑟𝑟𝑟𝑟𝑟𝑟𝑟𝑟𝑇𝑇 𝑃𝑃𝑟𝑟𝑇𝑇𝑟𝑟𝐸𝐸𝑟𝑟𝑛𝑛 𝐹𝐹𝑟𝑟𝑃𝑃𝑇𝑇𝑖𝑖,𝑡𝑡 = 𝐼𝐼𝑟𝑟𝑇𝑇𝑟𝑟𝑟𝑟𝑟𝑟𝑟𝑟𝑇𝑇 𝑃𝑃𝑟𝑟𝑇𝑇𝑟𝑟𝐸𝐸𝑟𝑟𝑛𝑛 𝐹𝐹𝑟𝑟𝑃𝑃𝑇𝑇𝑖𝑖,𝑡𝑡−1 + 𝑁𝑁𝑟𝑟𝐸𝐸𝑃𝑃𝑇𝑇𝑟𝑟𝑐𝑐 𝑃𝑃𝑇𝑇𝑇𝑇𝑇𝑇𝑟𝑟𝑠𝑠𝑟𝑟𝑖𝑖,𝑡𝑡 +𝑁𝑁𝑟𝑟𝑃𝑃𝑇𝑇𝐸𝐸𝑠𝑠 𝐹𝐹𝑟𝑟𝑃𝑃𝑇𝑇 𝑠𝑠ℎ𝑇𝑇𝑟𝑟𝑛𝑛𝑟𝑟𝑟𝑟𝑖𝑖,𝑡𝑡
𝑁𝑁𝑟𝑟𝐸𝐸𝑃𝑃𝑇𝑇𝑟𝑟𝑐𝑐 𝑃𝑃𝑇𝑇𝑇𝑇𝑇𝑇𝑟𝑟𝑠𝑠𝑟𝑟𝑖𝑖,𝑡𝑡 = 𝑇𝑇𝑇𝑇𝑇𝑇𝑇𝑇𝑇𝑇 𝑟𝑟𝑟𝑟𝑟𝑟𝑟𝑟𝑟𝑟𝑟𝑟𝑟𝑟𝑟𝑟𝑖𝑖,𝑡𝑡 − 𝑁𝑁𝑟𝑟𝑇𝑇𝑛𝑛𝑟𝑟𝑇𝑇𝑃𝑃 𝑟𝑟𝑐𝑐𝑟𝑟𝑟𝑟𝐹𝐹𝐸𝐸𝑟𝑟𝑛𝑛𝑖𝑖,𝑡𝑡
𝑂𝑂𝑐𝑐𝑟𝑟𝑟𝑟𝑇𝑇𝑇𝑇𝐸𝐸𝑟𝑟𝑛𝑛 𝑃𝑃𝑇𝑇𝑇𝑇𝑇𝑇𝑟𝑟𝑠𝑠𝑟𝑟𝑖𝑖,𝑡𝑡 = 𝑁𝑁𝑟𝑟𝐸𝐸𝑃𝑃𝑇𝑇𝑟𝑟𝑐𝑐 𝑃𝑃𝑇𝑇𝑇𝑇𝑇𝑇𝑟𝑟𝑠𝑠𝑟𝑟𝑖𝑖,𝑡𝑡 + 𝑁𝑁𝑟𝑟𝑃𝑃𝑇𝑇𝐸𝐸𝑠𝑠 𝐹𝐹𝑟𝑟𝑃𝑃𝑇𝑇 𝑠𝑠ℎ𝑇𝑇𝑟𝑟𝑛𝑛𝑟𝑟𝑟𝑟𝑖𝑖,𝑡𝑡
Federal and subnational governments are assumed to finance any budgetary deficits (that is, net borrowing from other sectors in the economy) by issuing interest-bearing debt. Similarly, any budgetary surpluses (that is, net lending to other sectors in the economy) are used to pay down interest-bearing debt. In addition, it is assumed that there are no changes to the initial stock of financial assets and non-interest-bearing debt.
To ensure a stable economic backdrop, and consistent with baseline projections in CBO (2012) and OBR (2013), PBO’s long-term fiscal projections are constructed under the assumption that there is no feedback to the economy. However, rising debt ratios beyond the medium term could reduce GDP and/or put upward pressure on interest rates. Incorporating these effects would simply accelerate any projected increases in debt-to-GDP ratios.

Fiscal Sustainability Report 2017
114
Fiscal gap definition Appendix D:A government’s budget balance BB is defined as 1−⋅−= tttt DiPBBB , where
PB is the primary balance (revenues minus program spending) and i is the effective rate on government debt D. Government debt accumulates according to ( ) tttt PBDiD −⋅+= −11 . Solving the debt accumulation
equation forward and substituting yields:
it
k
i
i
j jtkt
k
i itt PB
iD
iD +
= = ++
= +
⋅
++⋅
+
= ∑∏∏1 11 1
11
1
Fiscal sustainability is conventionally defined as satisfying the condition that debt cannot ultimately grow faster than the interest rate. Denoting growth in debt as x and evaluating over the infinite horizon implies that if debt does not grow faster than the interest rate over the long term, then
011lim
11lim
11=⋅
++
=⋅
+ ∏∏
= +
+
∞→+= +∞→ t
k
i it
it
kkt
k
i itkD
ixD
i;
and the relationship holds that the current debt level must equal the present value of future primary balances, which is the starting point for fiscal gap calculations.
iti
i
j jtt PB
iD +
∞
= = +
⋅
+=∑∏
1 1 11
Given projected primary balances PB , the current level of debt is unlikely to equal the present value of primary balances; thus the fiscal gap is the difference between the current debt level and the present value of projected primary balances. The fiscal gap ∆ is usually expressed as the immediate and permanent change to the projected primary balance, calculated as a
constant proportion of projected GDP (Y ).
( )ititi
i
j jtt YPB
iD ++
∞
= = +
⋅∆+⋅
+=∑∏
1 1 11
iti
i
j jt
iti
i
j jtt
Yi
PBi
D
+
∞
= = +
+
∞
= = +
⋅
+
⋅
+−
=∆
∑∏
∑∏
1 1
1 1
11
11

Fiscal Sustainability Report 2017
115
The fiscal gap can also be computed over finite horizons under alternative assumptions about the endpoint debt-to-GDP ratio d* at some point k periods in the future. Typically, the current debt-to-GDP ratio is used as the endpoint.
( )itit
k
i
i
j jt
kt
k
i itt YPB
iYd
iD ++
= = +
+
= +
⋅∆+⋅
++⋅⋅
+
= ∑∏∏1 1
*
1 11
11
it
k
i
i
j jt
it
k
i
i
j jt
kt
k
i itt
Yi
PBi
Ydi
D
+
= = +
+= = +
+
= +
⋅
+
⋅
+−⋅⋅
+
−
=∆
∑∏
∑∏∏
1 1
1 1
*
1
11
11
11
In the case where interest rates and GDP growth (g) are constant, the fiscal gap reduces to the following:
⋅
++
−⋅
++
−⋅
+−
=∆+
+
=∑
it
itik
i
k
t
t
YPB
igd
ig
YD
ggi
1
*
11
11
1

Fiscal Sustainability Report 2017
116
Sensitivity analysis Appendix E:To help gauge the sensitivity of our baseline fiscal gaps, we consider alternative demographic, economic and fiscal policy scenarios. The following provides additional detail for the alternative scenarios considered.
Alternative demographic projections
PBO projects the fiscal gap under three alternative demographic scenarios: (1) an older population scenario with lower fertility, higher life expectancy and lower immigration rates; (2) a younger population scenario with higher fertility, lower life expectancy, and higher immigration rates; and (3) an interprovincial migration scenario based on more recent historical trends.
Table E-1 shows the demographic assumptions underpinning the high and low cost scenarios at the national level.
Long-run demographic assumptions under older and younger population scenarios
Baseline Older
scenario Younger scenario
Total fertility rate (children per woman of child-bearing age)
1.67 1.53 1.88
Male life expectancy at birth (years)
87.6 89.9 86.0
Female life expectancy at birth (years)
89.2 91.9 87.3
Immigration rate (immigrants per 1,000 persons)
7.5 5.0 9.0
Sources: Statistics Canada and Parliamentary Budget Officer.
Note: In each alternative scenario, the medium-term projection is unchanged and the alternative demographic assumptions are imposed in years 2023 and beyond. Male and female life expectancies at birth represent 2062 levels.
PBO’s baseline interprovincial migration assumptions are based on rates observed over the 1991 to 2011 reference period. In the alternative scenario, interprovincial migration rates for each province and territory are based on a more recent reference period, specifically, 2009 to 2011 (Table E-2).
Different assumptions for migration between provinces and territories have no impact on population growth or ageing at the national level. However, the demographic impact for individual provinces and territories under this alternative scenario depends on the change in interprovincial migration relative to the baseline assumption.
Table E-1

Fiscal Sustainability Report 2017
117
Alternative interprovincial migration scenario
Net migrants per 1,000 persons Baseline
(1991-2011) Alternative (2009-2011)
Newfoundland and Labrador -1.6 2.9 Prince Edward Island 0.4 0.7
Nova Scotia 0.5 1.2 New Brunswick 0.1 0.9
Quebec -1.2 -0.6 Ontario -0.4 -0.3
Manitoba -4.7 -2.8 Saskatchewan -4.8 0.5
Alberta 2.3 0.1 British Columbia 2.9 1.9
Yukon -8.0 7.0 Northwest Territories -11.7 -9.6
Nunavut -10.2 -2.4
Sources: Statistics Canada and Parliamentary Budget Officer.
Note: The net interprovincial migration rates represent averages over the period 2017 to 2091.
Alternative economic projections
To assess the sensitivity of the economic assumptions, we construct alternative projections for real GDP growth (± 0.5 percentage points) and interest rates (± 50 basis points), beginning in 2023. Alternative real GDP growth projections are constructed using different assumptions for labour productivity growth.
Alternative fiscal policy assumptions
In terms of alternative fiscal policy assumptions, we limit our focus to alternative health spending projections and alternative endpoint assumptions for government debt ratios.
In the baseline subnational government projections, we assume that growth in health care spending is determined by income growth (nominal GDP) and growth due to changes in the age structure of the population. This reflects zero excess cost growth (that is, growth in excess of nominal GDP and growth due to population ageing).
In previous reports, however, we incorporated excess cost growth into our subnational health spending projection, assuming growth would be maintained at its long-term historical average. In the 2016 FSR, we assumed excess cost growth of 0.29 percentage points, which was based on its 1982-2015 average.
Table E-2

Fiscal Sustainability Report 2017
118
In this year’s report, we construct alternative health spending projections that incorporate excess cost growth in health care spending of ± 0.25 percentage points, beginning in 2023. The federal government, the CPP and QPP are all unaffected under the alternative health spending scenarios.
Rather than returning to the current ratio of net debt-to-GDP in 75 years, fiscal gaps may also be calculated for alternative debt-to-GDP endpoint ratios. We consider two alternative endpoint scenarios for the federal government and subnational governments: 0 and 100 per cent of GDP.

Fiscal Sustainability Report 2017
119
Notes
1. Trend labour input is determined by the working-age population, trends inage-and gender-specific employment rates, and average weekly hoursworked. Annex B in PBO’s 2014 FSR details the methodology used toconstruct our trend labour inputs.
Trend labour productivity growth is assumed to converge to its steady-statelevel over the long term. To maintain consistency with our approach toestimating potential GDP (for the Canadian economy as a whole) over themedium term, we apply the steady-state (constant) labour productivitygrowth derived within our production function framework.
2. Mendes (2014) defines the neutral rate as the policy interest rate “consistentwith output at its potential level and inflation equal to target after the effectsof all cyclical shocks have dissipated”. In its April 2017 Monetary PolicyReport, the Bank of Canada estimated the neutral nominal interest rate to be3.0 per cent (in a range of 2.5 to 3.5 per cent).
3. For each province, subnational effective interest rates are assumed toconverge to the federal rate plus the average spread (that is, the differencebetween the provincial government 10-year bond rate and the Governmentof Canada 10-year benchmark rate) observed over 1995-2017.
4. In the case of health care spending by subnational governments, we haverevised our projection approach to exclude excess cost growth (that is,growth in health spending exceeding growth in nominal GDP and growthdue to population ageing). This revision follows a more detailed review ofthe historical excess cost series at the national level and across provinces.
5. However, an important exception to this is federal spending on elderlybenefits. Consistent with current legislation, spending per beneficiary isassumed to remain constant on an inflation-adjusted basis.
6. In the case of the CPP and QPP, when the rate of return exceeds GDPgrowth, maintaining a stable asset-to-GDP ratio requires negative net cashflows as investment income is used to cover this shortfall. As a share of GDP,the size of the net cash flow necessary to maintain a stable asset ratiodepends on the difference between the rate of return and the GDP growthrate as well as the current asset ratio.
7. We use a 75-year time horizon for our baseline fiscal gap estimate in orderto fully capture the demographic transition in Canada. Moreover, long-termprojection horizons are typically used to assess the adequacy of fundingsocial security systems such as public pension plans.
8. In FSR 2016, we assumed that the number of immigrants would remainconstant beyond 2061. As a result, the immigration rate declined after 2061.
Fiscal Sustainability Report 2017
120
9. The first additional contribution rate is equal to 2.0 per cent for 2023 (and
thereafter) and applies to earnings between the Year’s Basic Exemption and the Year’s Maximum Pensionable Earnings. The second additional contribution is equal to 8.0 per cent for 2024 (and thereafter) and applies to earnings between the Year’s Maximum Pensionable Earnings and the Year’s Additional Maximum Pensionable Earnings.
10. The ultimate real rates of return (before investment expenses) used in the 27th Actuarial Report of the CPP and the 2016 Actuarial Valuation of the QPP are similar: 5.0 per cent and 4.9 per cent respectively.
11. See http://www.statcan.gc.ca/pub/13-605-x/2014005/article/14088-eng.htm for an overview of the Canadian Government Finance Statistics.
12. Available at: https://www.imf.org/external/Pubs/FT/GFS/Manual/2014/gfsfinal.pdf.
13. http://www23.statcan.gc.ca/imdb/p2SV.pl?Function=getSurvey&SDDS=5174.
14. http://www23.statcan.gc.ca/imdb-bmdi/document/5174_D1_T9_V1-eng.htm.
15. For the federal government sector, this data can be found in CANSIM table 385-0080. For the subnational government sector, this data can be found by jurisdiction in CANSIM tables 384-0047 and 385-0041. More information on the data used is available here: FSR medatada_FSR.xlsx
16. For the federal government sector, this data can be found in CANSIM table 385-0032. For the subnational government sector, this data can be found by jurisdiction in CANSIM table 385-0042. More information on the data used is available here: FSR medatada_FSR.xlsx
17. CANSIM Table 385-0041 Canadian Classification of Functions of Government has data available for only 2008 to 2014.
18. The CIHI report National Health Expenditure Trends, 1975 to 2016 is the 20th edition of this annual publication. The report provides an overview of how much is spent on health care annually, in what areas money is spent and on whom, and where the money comes from. It features comparative expenditure data at the provincial/territorial and international levels, as well as Canadian health spending trends from 1975 to the present.
19. Available at: http://www.pbo-dpb.gc.ca/web/default/files/files/files/FSR_2014.pdf.
20. OAS and children’s benefits grow according to the formula:
𝐸𝐸𝑇𝑇𝑐𝑐𝑡𝑡 = 𝐸𝐸𝑇𝑇𝑐𝑐𝑡𝑡−1 ∙ �𝑁𝑁𝑃𝑃𝑃𝑃𝑡𝑡
𝑖𝑖
𝑁𝑁𝑃𝑃𝑃𝑃𝑡𝑡−1𝑖𝑖 � ∙ � 𝐶𝐶𝑁𝑁𝐶𝐶𝑡𝑡
𝐶𝐶𝑁𝑁𝐶𝐶𝑡𝑡−1�
Where 𝑁𝑁𝑇𝑇𝑐𝑐𝑡𝑡𝑖𝑖 is the targeted demographics cohort: the population over 65 for elderly benefits and children under 18 for children’s benefits. CPIt captures indexation of benefits to the consumer price index.
21. Government business enterprises are not included in the (general) government sector, and therefore do not contribute to the fiscal gap.
22. Many of the largest revenue streams (for example, taxes on goods and services and corporate income) have flat rate structures and would not need adjustment; however, future policy action must occur to maintain policies

Fiscal Sustainability Report 2017
121
with progressive structures such as personal income tax. This approach is common to other independent fiscal institutions such as the Congressional Budget Office (CBO) in the United States. The Office for Budget Responsibility (OBR), the United Kingdom has incorporated demographics into their revenue projections, but the effect is small.
23. We use the 2010 to 2015 period because of changes in the EqualizationFormula that make the data before 2010 not comparable, as new elementswere included in the computation of some of the tax bases.
24. For more information on the Quebec Abatement is provided by FinanceCanada at: https://www.fin.gc.ca/fedprov/altpay-eng.asp.
25. Finance Canada actually uses the revenue a territory would generate under areference tax system, similar to what is done in the equalization formula.However, for simplicity we assumed that these would be similar to ourprojection of own-source revenues.