fiscal year 2017 results conference call - cubic fy17 earnings call slides - final.pdf · fiscal...
TRANSCRIPT

Fiscal Year 2017 Results
Conference Call
November 20, 2017
Bradley H. Feldmann President and Chief Executive Officer
Anshooman Aga Executive Vice President and Chief Financial Officer
2
NYSE: CUB
Safe Harbor
This presentation contains forward-looking statements within the meaning of Section 21E of the Securities Exchange Act of 1934, as amended, that are subject to the “safe harbor” created by those sections. Any statements about our expectations, beliefs, plans, objectives, assumptions or future events or our future financial and/or operating performance are not historical and may be forward-looking. These statements are often, but not always, made through the use of words or phrases such as “may,” “will,” “anticipate,” “estimate,” “plan,” “project,” “continuing,” “ongoing,” “expect,” “believe,” “intend,” “predict,” “potential,” “opportunity” and similar words or phrases or the negatives of these words or phrases. These statements involve estimates, assumptions and uncertainties, including those discussed in “Risk Factors” in the Company’s annual report on Form 10-K for the year ended September 30, 2017, and throughout this presentation that could cause actual results to differ materially from those expressed in these statements.
Because the risk factors referred to above could cause actual results or outcomes to differ materially from those expressed in any forward-looking statements made by us or on our behalf, you should not place undue reliance on any forward-looking statements. In addition, past financial and/or operating performance is not necessarily a reliable indicator of future performance and you should not use our historical performance to anticipate results or future period trends. Further, any forward-looking statement speaks only as of the date on which it is made, and we undertake no obligation to update any forward-looking statement to reflect events or circumstances after the date on which the statement is made or to reflect the occurrence of unanticipated events. New factors emerge from time to time, and it is not possible for us to predict which factors will arise. In addition, we cannot assess the impact of each factor on our business or the extent to which any factor, or combination of factors, may cause actual results to differ materially from those contained in any forward-looking statements.

3
NYSE: CUB
FY17 Results
Book to Bill – 1.07 (1.27 with New York win).
Sales growth of 3.0% over prior year on a constant currency basis.
Met adjusted EBITDA financial guidance.
Incremental R&D investment of $20.7m.
New York New Fare Payment System ($554m) win in October 2017 yielding the
highest total backlog ($3.7b) in the company’s history.
Sales
($m)
Adjusted EBITDA
($m)
R&D ($m)
$1,461.7
$1,485.9
FY16 FY17
$118.0 $105.6
FY16 FY17
$32.0
$52.7
FY16 FY17
(2) Incl. $1.9m FX headwinds
(1)
(2)
Strong Q4 execution delivering record quarterly and annual sales
(1) Incl. $19.9m FX headwinds

4
NYSE: CUB
Our Common Mission and Technologies
Cloud Computing Secure
Communications
Data
Visualization Instrumentation
Cubic is a market-leading, technology provider of integrated solutions
that increase situational understanding for transportation, defense
C4ISR and training customers worldwide to decrease urban congestion
and improve the militaries’ effectiveness and operational readiness.
Algorithms /
Simulation

5
NYSE: CUB
Award to replace iconic
MetroCard.
Improves customer experience.
Reduces costs for Metropolitan
Transportation Authority (MTA).
Teamed with our customer,
Transport for London.
Cements position as market
leader.
Confirms One Account strategy.
Investments Pay Off with NY Next-Gen Fare Collection Win

6
NYSE: CUB
Our Innovations and Investments
• High Fidelity Distributed Training Solutions
• Live, Virtual, Constructive and Gaming
(LVC-G) training
• Product-centric transformation
• Advanced mobile
• Open payment
• Cloud-based solutions
NextBus 2.0 real-
time passenger
information systems
Expeditionary
Communications ISR as a
service
Aerial Layer Network
Next-Generation
Communications
• Implementing common Enterprise Resource
Planning system with data in one place
• Includes contracts, financial, manufacturing,
supply chain and engineering
Transportation
C4ISR
Defense
One Cubic

7
NYSE: CUB
Our Values: Do The Right Thing
Puerto Rico St. John

8
NYSE: CUB
Strategy Update

9
NYSE: CUB
Transportation competitive edge
sharpening with One Account and
Mobile capabilities.
Contributing to Joint Aerial Layer
Network.
Revolutionary game-based
courseware leading to training
efficiency and new orders.
Strategy Update

10
NYSE: CUB
New York New Fare Payment System award ($554m).
Transport for London Revenue Collection contract
extension ($255m).
Strategy Update
Transportable Tactical Command Communications
(T2C2) full-rate production decision in FY18.
Investing in ISR-as-a-Service offerings.
Asia-Pacific Combat Training Center award ($26m).
Littoral Combat Ship Immersive Virtual Shipboard
Environment orders ($29m).
Delivered 297 units on Joint Strike Fighter F35 program,
211 in backlog to be delivered by 2019 with potentially
2000+ to follow.
11
NYSE: CUB
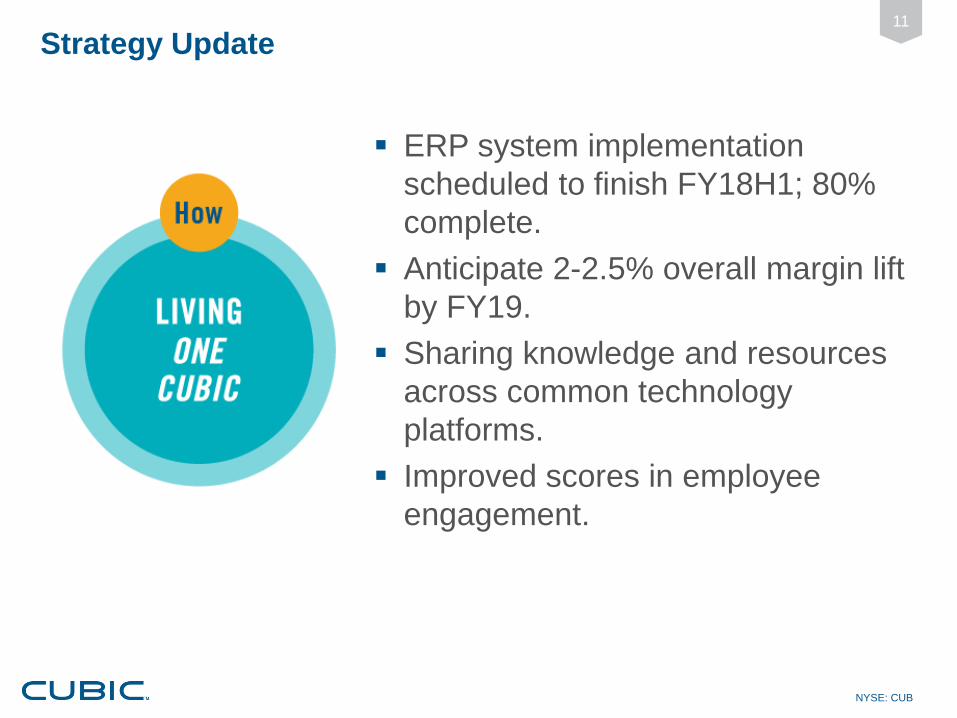
ERP system implementation
scheduled to finish FY18H1; 80%
complete.
Anticipate 2-2.5% overall margin lift
by FY19.
Sharing knowledge and resources
across common technology
platforms.
Improved scores in employee
engagement.
Strategy Update

12
NYSE: CUB
Strong execution in Q4
Record sales, near record adjusted EBITDA.
NY Fare Collection contract won (10/2017).
Adjusted EBITDA guidance achieved.
Additional $50m pay down of debt in Q4 alone; $186m for FY17.
Stringent capital allocation decisions being made:
Discretionary resources allocated to the best sub-businesses.
Steps to streamline owned real estate portfolio initiated.
ERP implementation progressing well.

13
Q4 Comparison
Cubic Consolidated Financial Highlights
Full Year Comparison
• Q4 YoY growth in Bookings, Revenue and Adj EBITDA.
• Adjusted EBITDA driven by product shipments (CMS),
strong program execution and favorable project
resolutions in line with expectations.
• YoY constant currency sales up 3% ($20m FX headwind).
• YoY Adjusted EBITDA impacted by incremental R&D
investment of $20.7m to drive future growth.
• FCF includes $51m of ERP / Strategic IT expenditures.
1) Constant currency basis
35.7
50.2
Q4 FY16 Q4 FY17
Adj EBITDA
33.028.7
Q4 FY16 Q4 FY17
Free Cash Flow
1,461.7 1,485.9
FY 16 FY 17
Sales
118.0
105.6
FY 16 FY 17
Adj EBITDA
11.5
(13.3)
FY 16 FY 17
Free Cash Flow
406.6445.6
Q4 FY16 Q4 FY17
Sales
$m
+3%1)+10%1)
1)+38%1)
-9%1)
$m
-0.29
0.49
Q4 FY16 Q4 FY17
EPS ($)
0.06-0.41
FY 16 FY 17
EPS ($)
1) Constant currency basis: reflects FX tailwinds of $.4M sales & $.6M Adj EBITDA 1) Constant currency basis: reflects FX headwinds $19.9M sales and $1.9M Adj EBITDA
14
Q4 Comparison
Cubic Transportation Systems Financial Highlights
Full Year Comparison
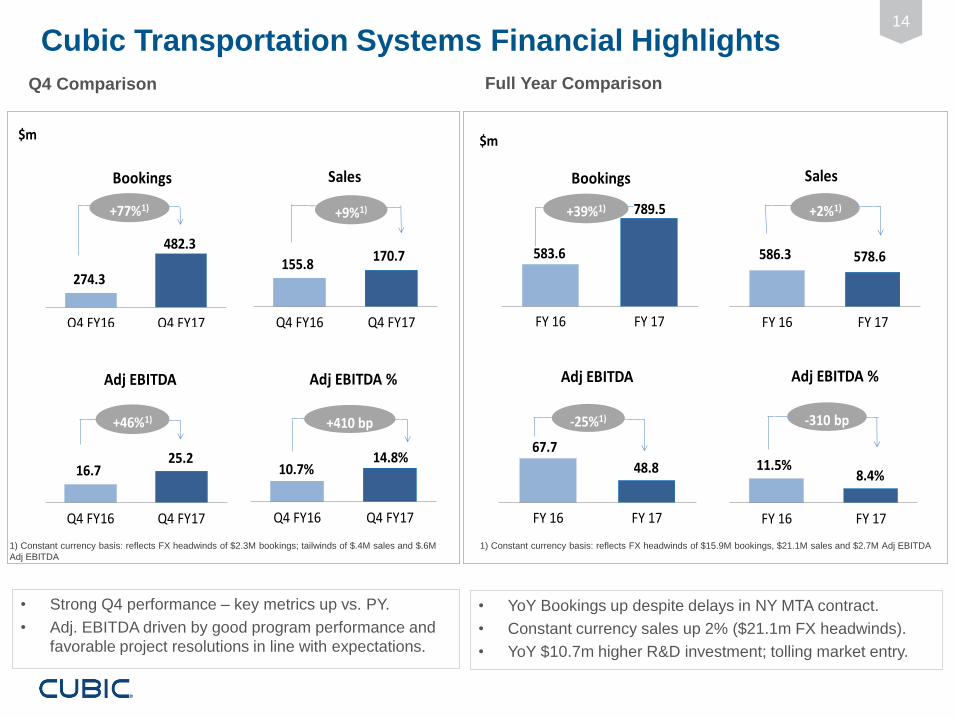
• Strong Q4 performance – key metrics up vs. PY.
• Adj. EBITDA driven by good program performance and
favorable project resolutions in line with expectations.
• YoY Bookings up despite delays in NY MTA contract.
• Constant currency sales up 2% ($21.1m FX headwinds).
• YoY $10.7m higher R&D investment; tolling market entry.
274.3
482.3
Q4 FY16 Q4 FY17
Bookings
155.8170.7
Q4 FY16 Q4 FY17
Sales
16.725.2
Q4 FY16 Q4 FY17
Adj EBITDA
10.7%14.8%
Q4 FY16 Q4 FY17
Adj EBITDA %
583.6
789.5
FY 16 FY 17
Bookings
$m
+39%1)
586.3 578.6
FY 16 FY 17
Sales
67.7
48.8
FY 16 FY 17
Adj EBITDA
11.5%8.4%
FY 16 FY 17
Adj EBITDA %
$m
+2%1)+77%1)
+410 bp+46%1) -25%1) -310 bp bp
+9%1)
1) Constant currency basis: reflects FX headwinds of $2.3M bookings; tailwinds of $.4M sales and $.6M
Adj EBITDA
1) Constant currency basis: reflects FX headwinds of $15.9M bookings, $21.1M sales and $2.7M Adj EBITDA

15
Q4 Comparison
Cubic Global Defense Systems Financial Highlights
Full Year Comparison
• Key Metrics improved vs. PY with strong increase in
Sales and Adj. EBITDA.
• Adj. EBITDA growth driven by C4ISR product shipments.
• YoY growth driven by C4ISR business.
• Adj. EBITIDA increased in both Training & C4ISR sub-
segments – double digit Adj. EBITDA % achieved.
187.1 191.7
Q4 FY16 Q4 FY17
Bookings
153.1178.5
Q4 FY16 Q4 FY17
Sales
16.6
24.0
Q4 FY16 Q4 FY17
Adj EBITDA
10.8% 13.5%
Q4 FY16 Q4 FY17
Adj EBITDA %
439.9 444.5
FY 16 FY 17
Bookings
+1%
484.3 529.1
FY 16 FY 17
Sales
39.753.8
FY 16 FY 17
Adj EBITDA
8.2% 10.2%
FY 16 FY 17
Adj EBITDA %
$m
+9%1)
+33%1)
+2%
+270 bp+45%1)+200 bp
+17%1)
$m
1) Constant currency basis – no material impact 1) Constant currency basis – reflects FX tailwinds of $1.2M sales and $.8M Adj EBITDA

16
Q4 Comparison
Cubic Global Defense Services Financial Highlights
Full Year Comparison
• Positive book to bill achieved in Q4.
• Slight increase in Q4 YoY profit despite a small decrease
in sales.
• YoY decline in Bookings and Sales driven by budget delays
and competitive market pressures.
• Adj EBITDA down vs FY16 due to lower revenue, program
mix and competitive price pressures.
94.3103.6
Q4 FY16 Q4 FY17
Bookings
+10%
$m
97.8 96.5
Q4 FY16 Q4 FY17
Sales
-1%
2.3 2.4
Q4 FY16 Q4 FY17
Adj EBITDA
+2%
2.4% 2.5%
Q4 FY16 Q4 FY17
Adj EBITDA %
+10 bp
379.6 358.6
FY 16 FY 17
Bookings
$m
-6%
391.1 378.2
FY 16 FY 17
Sales
4.3%
2.6%
FY 16 FY 17
Adj EBITDA %
-3%
-170 bp
16.9
9.9
FY 16 FY 17
Adj EBITDA
- 41%

17
NYSE: CUB
FY18 Guidance
FY 18 Guidance
Sales $1.51B - $1.56B(1)
Adjusted EBITDA $110M - $135m(1)
Strong Increase in Adjusted EBITDA (16% at mid point) driven by growth in
transportation and C4ISR business.
Profit seasonality to be somewhat in line with FY17.
CR’s / timing of discretionary govt. spend impacts C4ISR business.
NY contract ramp up.
FY18 to include C4ISR business as a separate reporting segment.
ERP implementation materially complete in FY18 ($25m in FY18).
Capital Expenditure to be 2% of revenue.
(1) Constant currency basis

18
NYSE: CUB
Summary
Strong finish to FY17 as expected.
Investments yielding catalysts for good organic growth
starting in FY18.
Capital allocation will focus on technologies that supports
our strategy and meet financial hurdles.
ERP to be completed by FY18H1 resulting in efficiency /
savings in supply chain and SG&A spend.
Strong start to FY18 with New York win.
Strategy is very sound; on track on our Goal 2020 strategic objectives

Appendix

20
NYSE: CUB
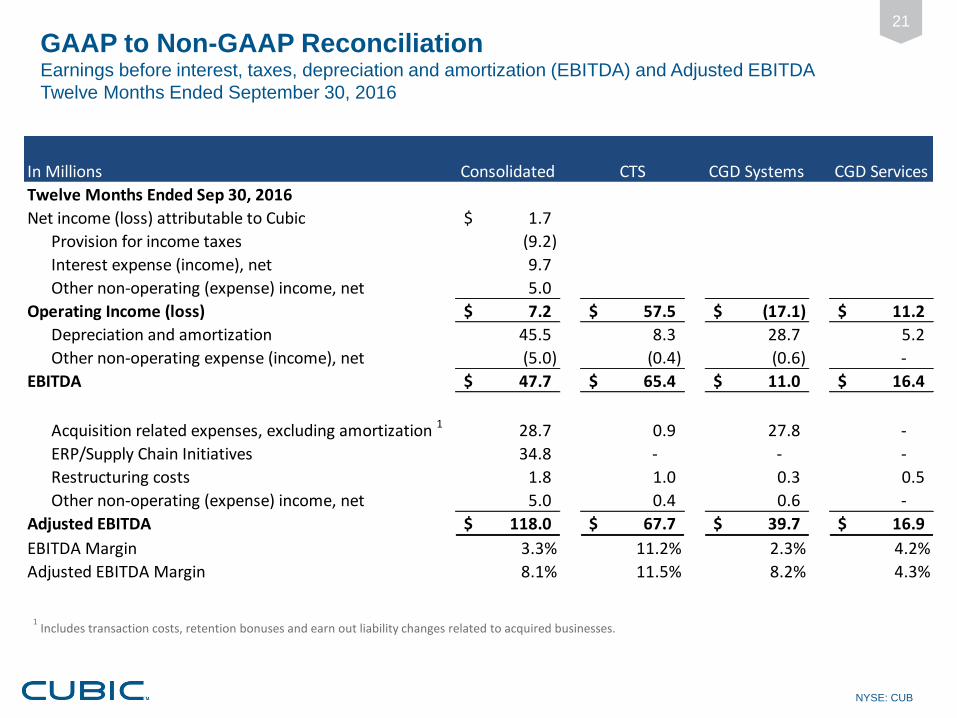
1 Includes transaction costs, retention bonuses and earn out liability changes related to acquired businesses.
GAAP to Non-GAAP Reconciliation Earnings before interest, taxes, depreciation and amortization (EBITDA) and Adjusted EBITDA
Twelve Months Ended September 30, 2017
In Millions Consolidated CTS CGD Systems CGD Services
Twelve Months Ended Sep 30, 2017
Net income (loss) attributable to Cubic (11.2)$
Provision for income taxes 15.1
Interest expense (income), net 14.0 (1.4) 0.2$ -$
Other non-operating (expense) income, net (0.4) 1.0 0.7$ -$
Operating Income (loss) 17.5$ 39.8$ 18.8$ 6.7$
Depreciation and amortization 51.1 8.8 34.2 3.0
Other non-operating expense (income), net 0.4 (1.0) (0.7) -
EBITDA 69.0$ 47.6$ 52.3$ 9.7$
Acquisition related expenses, excluding amortization 1 (0.3) (0.2) (0.1) -
ERP/Supply Chain Initiatives 34.4 - - -
Restructuring costs 2.5 0.4 0.9 0.2
Gain/Loss on sale of fixed assets 0.4
Other non-operating (expense) income, net (0.4) 1.0 0.7 -
Adjusted EBITDA 105.6$ 48.8$ 53.8$ 9.9$
EBITDA Margin 4.6% 8.2% 9.9% 2.6%
Adjusted EBITDA Margin 7.1% 8.4% 10.2% 2.6%
21
NYSE: CUB
GAAP to Non-GAAP Reconciliation Earnings before interest, taxes, depreciation and amortization (EBITDA) and Adjusted EBITDA
Twelve Months Ended September 30, 2016
1 Includes transaction costs, retention bonuses and earn out liability changes related to acquired businesses.
In Millions Consolidated CTS CGD Systems CGD Services
Twelve Months Ended Sep 30, 2016
Net income (loss) attributable to Cubic 1.7$
Provision for income taxes (9.2)
Interest expense (income), net 9.7 (1.2) - (0.1)
Other non-operating (expense) income, net 5.0 0.4 0.6 -
Operating Income (loss) 7.2$ 57.5$ (17.1)$ 11.2$
Depreciation and amortization 45.5 8.3 28.7 5.2
Other non-operating expense (income), net (5.0) (0.4) (0.6) -
EBITDA 47.7$ 65.4$ 11.0$ 16.4$
Acquisition related expenses, excluding amortization 1 28.7 0.9 27.8 -
ERP/Supply Chain Initiatives 34.8 - - -
Restructuring costs 1.8 1.0 0.3 0.5
Other non-operating (expense) income, net 5.0 0.4 0.6 -
Adjusted EBITDA 118.0$ 67.7$ 39.7$ 16.9$
EBITDA Margin 3.3% 11.2% 2.3% 4.2%
Adjusted EBITDA Margin 8.1% 11.5% 8.2% 4.3%

22
NYSE: CUB
GAAP to Non-GAAP Reconciliation Earnings before interest, taxes, depreciation and amortization (EBITDA) and Adjusted EBITDA
Quarter Ended September 30, 2017
1 Includes transaction costs, retention bonuses and earn out liability changes related to acquired businesses.
In Millions Consolidated CTS CGD Systems CGD Services
Three Months Ended Sep 30, 2017
Net income (loss) attributable to Cubic 13.2$
Provision for income taxes 9.3
Interest expense (income), net 2.6 (0.3) 0.1 -
Other non-operating (expense) income, net 0.3 4.2 (0.5) -
Operating Income (loss) 25.4$ 23.2$ 15.0$ 1.9$
Depreciation and amortization 12.9 2.0 8.7 0.6
Other non-operating expense (income), net (0.3) (5.3) 0.5 -
EBITDA 38.0$ 19.9$ 24.2$ 2.5$
Acquisition related expenses, excluding amortization 1 0.6 - 0.6 -
ERP/Supply Chain Initiatives 10.8 - - -
Restructuring costs 0.5 - (0.3) (0.1)
Other non-operating (expense) income, net 0.3 5.3 (0.5) -
Adjusted EBITDA 50.2$ 25.2$ 24.0$ 2.4$
EBITDA Margin 8.5% 11.7% 13.6% 2.6%
Adjusted EBITDA Margin 11.3% 14.8% 13.5% 2.5%

23
NYSE: CUB
GAAP to Non-GAAP Reconciliation Earnings before interest, taxes, depreciation and amortization (EBITDA) and Adjusted EBITDA
Quarter Ended September 30, 2016
1 Includes transaction costs, retention bonuses and earn out liability changes related to acquired businesses.
In Millions Consolidated CTS CGD-Systems CGD-Services
Three Months Ended Sep 30, 2016
Net income (loss) attributable to Cubic (7.5)$
Provision for income taxes 11.1
Interest expense (income), net 3.4 (0.3) - (0.1)
Other non-operating (expense) income, net 3.5 (0.1) 0.6 -
Operating Income (loss) 10.5$ 13.6$ 6.6$ 1.9$
Depreciation and amortization 13.6 2.8 9.0 0.4
Other non-operating expense (income), net (3.5) 0.1 (0.6) -
EBITDA 20.6$ 16.5$ 15.0$ 2.3$
Acquisition related expenses, excluding amortization 1 1.0 0.3 0.8 -
ERP/Supply Chain Initiatives 10.4 - - -
Restructuring costs 0.2 - 0.2 -
Other non-operating (expense) income, net 3.5 (0.1) 0.6 -
Adjusted EBITDA 35.7$ 16.7$ 16.6$ 2.3$
EBITDA Margin 5.1% 10.6% 9.8% 2.4%
Adjusted EBITDA Margin 8.8% 10.7% 10.8% 2.4%