fiscal year 2021 gasb 74/75 report
TRANSCRIPT

Fiscal Year 2021
GASB 74/75 Report for the
City of New York and the
New York City Health Benefits Program
PREPARED AS OF JUNE 30, 2021
by the
New York City Office of the Actuary

OFFICE OF THE ACTUARY
255 GREENWICH STREET • 9TH FLOOR NEW YORK, NY 10007
(212) 442-5775 • FAX: (212) 442-5777
SHERRY S. CHAN CHIEF ACTUARY
September 10, 2021 Honorable Scott M. Stringer Comptroller The City of New York Municipal Building, Room 530 One Centre Street New York, NY 10007
Re: Other Postemployment Benefits Valuation Report in Accordance with GASB 74 and 75 (Report)
Dear Comptroller Stringer:
This Report presents the results of the Fiscal Year Ended June 30, 2021 Annual Valuation of the Other Postemployment Benefits (OPEB) provided under the New York City Health Benefits Program (Program). These results, with a valuation date of June 30, 2020 are projected forward to a measurement date of June 30, 2021 to form the basis for accounting and financial reporting under Governmental Accounting Standards Board (GASB) Statement No. 75 Accounting and Financial Reporting for Postemployment Benefits Other than Pensions (GASB75), as amended by GASB Statement No. 85 (GASB85), for Fiscal Year 2021 (i.e. July 1, 2020 to June 30, 2021) for the City of New York (City) and certain non-City entities (Component Units).
These results also form the basis for financial reporting under GASB Statement No. 74 Financial Reporting for Postemployment Benefit Plans Other than Pension Plans (GASB74), as amended by GASB85, for the New York City Other Postemployment Benefits Plan (OPEB Plan or Plan). Where these results are applicable under both GASB74 and GASB75, the term GASB74/75 is used.
This Report provides the fiduciary net position of the Programs for the City and Component Units, the accounting amounts of the costs to maintain the Programs, and the financial statement reporting and disclosure information for the Plan, the City, Component Units, governmental agencies, and other interested parties.
The results shown herein are based upon:
• The Office of the Actuary’s (OA) interpretation of GASB74 and GASB75.
• The OA’s understanding of the benefits provided to eligible retirees and beneficiaries.

• The OA’s understanding of Health Care Reform (HCR) (i.e. the Patient Protection and Affordable Care Act (ACA)) signed into law on March 23, 2010 and the Health Care and Education Reconciliation Act (HCERA) signed into law on March 30, 2010), as well as the Tax Cuts and Jobs Act signed into law on December 22, 2017 and the Further Consolidated Appropriations Act, 2020 signed into law on December 20, 2019.
• Census data used in the June 30, 2020 pension actuarial valuations of the New York City Retirement Systems (NYCRS)1 to produce the Preliminary Fiscal Year 2022 Employer Contributions and supplemental data provided by the New York City Office of Labor Relations (OLR), the Educational Construction Fund (ECF), and the City University of New York (CUNY) for participants in the Teachers Insurance Annuity Association (TIAA or CUNY TIAA).
• Health insurance premium rates and related financial information for Fiscal Year 2021 provided by OLR.
• Welfare Fund contribution rates as of June 30, 2020, and negotiated increases, lump-sum, and retroactive payments made on behalf of retirees to Welfare Funds for Fiscal Years 2018 to 2021, provided by OLR.
• Certain actuarial assumptions used in the pension actuarial valuations of the NYCRS that were proposed to the Boards of the NYCRS during Calendar Year 2021. For details, see SECTION VI – ACTUARIAL ASSUMPTIONS AND METHODS.
• Additional OPEB-specific actuarial assumptions, as described in SECTION VI – ACTUARIAL ASSUMPTIONS AND METHODS.
• Entry Age Normal Cost Method, as described in SECTION VI – ACTUARIAL ASSUMPTIONS AND METHODS.
• Financial information provided by the Office of Management and Budget (OMB) and by the administrative offices of the Component Units.
• Information on the Stabilization Fund provided by OLR and OMB.
• In-house and third-party software in the performance of annual actuarial valuations and projections. The models are intended to calculate the liabilities associated with the provisions of the plan using data and assumptions as of the measurement date under the accounting standards specified in the report and apply those accounting standards to the liabilities derived and other inputs to generate the exhibits in the report. These
1 New York City Employees’ Retirement System (NYCERS) New York City Teachers’ Retirement System (TRS) N ew York City Board of Education Retirement System (BERS) New York City Police Pension Fund (POLICE) New York City Fire Pension Fund (FIRE)

results are reviewed in detail and at a high level for accuracy, reasonability and consistency with prior results. The model is also reviewed extensively when significant changes are made to the software by experts who are familiar with applicable accounting rules as well as the manner in which the models generate its output.
• The OA considered the potential impact of the ongoing COVID-19 pandemic on costs and liabilities but made no explicit adjustments to the calculations at this time due to the lack of credible experience data and uncertainty around the long-term ramifications for the plan.
This Report does not include results for the New York City Off-Track Betting Corporation (OTB). It is the understanding of the Actuary that, effective May 26, 2011, neither the City nor the Plan has any OPEB obligation for current or future OTB retirees. This Report also excludes results for both the Queens and Brooklyn Public Libraries.
The results contained in this Report are not meant for other purposes. In particular, the analysis in this Report is not to be relied upon by employers, retirees, or their representatives for any decisions regarding benefit design. Use of this Report for any other purpose or by anyone other than the City, the Component Units, or their auditors may not be appropriate and may result in mistaken conclusions due to failure to understand applicable assumptions, methodologies, or inapplicability of the Report for that purpose. This Report should not be provided except in its entirety. No one other than the City, Component Units, or their auditors may make any representations or warranties based on any statements or conclusions contained in this Report without the written consent of the OA.
An Actuarial Certification is included in SECTION IV – CERTIFICATION.
Best Regards,
Sherry S. Chan, FSA, EA, MAAA, FCA Chief Actuary
SSC/eh

cc: New York City Office of the Actuary Ms. Melissa Chacko Mr. Frankie Chen Mr. Craig Chu Mr. Thomas O’Hara Mr. Michael Samet Keith Snow, Esq. Mr. Gregory Zelikovsky Auditors Ms. Hope Goldstein – Marks Paneth, LLP Ms. Marla Hummel – Grant Thornton, LLP Mr. Ben Kohnle – Grant Thornton, LLP Mr. Chris Mancusi – Grant Thornton, LLP Mr. Daniel McElwee – Marks Paneth, LLP Mr. Warren Ruppel – Marks Paneth, LLP Ms. Jill Strohmeyer – Deloitte & Touche, LLP Buck Mr. Stephen Oates Ms. Rebecca O’Loughlin Component Units Mr. Robert Balducci – New York City Municipal Water Finance Authority Mr. Jozef Dubroja – New York City Health and Hospitals Corporation Ms. Nicole Fleming – New York City Health and Hospitals Corporation Mr. Jeffrey Lesnoy – New York City Housing Authority Ms. Sara Papas Montero – City University of New York Mr. James Linhart – New York City Health and Hospitals Corporation Ms. Yi-Wen Wang – School Construction Authority Mr. Jay Weinman – New York City Health and Hospitals Corporation Ms. Cynthia Wong – New York City Educational Construction Fund New York City Office of the Comptroller Ms. Rosa Charles Mr. Preston Niblack Ms. Jacqueline Thompson New York City Office of the Labor Relations Mr. Michael Babette Ms. Renee Campion New York City Office of Management and Budget Mr. Andrew Dowling Mr. Ken Godiner Mr. Omair Hassan Mr. William Kennelly Mr. Raymond Lee

i
Table of Contents
SECTION I – GASB 74/75 INFORMATION .........................................................................................................1 Plan Description.....................................................................................................................................................1 Key Changes Included in This Valuation ......................................................................................................2 Investments .............................................................................................................................................................3 Net OPEB Liability of the City ...........................................................................................................................3 Projection of Fiduciary Net Position ..............................................................................................................3
SECTION II – FIDUCIARY NET POSITION ..........................................................................................................5 Table II-a: Statement of Fiduciary Net Position ...............................................................................5 Table II-b: Statement of Changes in Fiduciary Net Position........................................................5
SECTION III – SCHEDULES OF REQUIRED SUPPLEMENTARY INFORMATION ..............................7 Notes to Schedules ................................................................................................................................................7 New York City Educational Construction Fund (ECF) ............................................................................8 New York City Health and Hospitals Corporation (HHC) ................................................................... 28 New York City Housing Authority (NYCHA) ............................................................................................ 48 New York City School Construction Authority (SCA)........................................................................... 52 New York City Municipal Water Finance Authority (WFA)............................................................... 72 City of New York (Excluding Component Units) .................................................................................... 92
SECTION IV – CERTIFICATION ......................................................................................................................... 112 SECTION V – SUMMARY OF PLAN PROVISIONS ...................................................................................... 113
Eligibility ............................................................................................................................................................. 113 Covered Benefits .............................................................................................................................................. 115 Health Insurance.............................................................................................................................................. 116 Medicare Part B Premium Reimbursement .......................................................................................... 117 Welfare Funds ................................................................................................................................................... 117 Stabilization Fund ........................................................................................................................................... 118 ECF Coverage..................................................................................................................................................... 119
SECTION VI – ACTUARIAL ASSUMPTIONS AND METHODS............................................................... 120 General................................................................................................................................................................. 120 Educational Construction Fund ................................................................................................................. 135 CUNY ..................................................................................................................................................................... 138
SECTION VII – DEMOGRAPHIC INFORMATION ....................................................................................... 139 Plan Participation ............................................................................................................................................ 140
Table VII-a ................................................................................................................................................. 140 Annual Welfare Fund Contributions........................................................................................................ 141
Table VII-b: NYCERS .............................................................................................................................. 141 Table VII-c: TRS ....................................................................................................................................... 145 Table VII-d: BERS.................................................................................................................................... 146 Table VII-e: POLICE ............................................................................................................................... 148 Table VII-f: FIRE ...................................................................................................................................... 149
SECTION VIII – SUMMARY OF KEY TERMS ................................................................................................ 150

1
SECTION I – GASB 74/75 INFORMATION
None of the Component Units (CU) which have obligations included in this Report have separately identified OPEB assets as of June 30, 2021 nor June 30, 2020. Since GASB74 applies in cases where there are separate trust or trust equivalents, GASB74 does not apply to OPEB that are the obligations of the CU. Results in this section of the Report reflect only the obligations where the City is directly obligated.
Each of the Component Units are considered single employers for the purpose of recording their OPEB liabilities.
Plan Description
The New York City Other Postemployment Benefits Plan is a fiduciary component unit of the City and is composed of: (1) the New York City Retiree Health Benefits Trust (NYCRHBT) which is used to receive, hold, and disburse assets accumulated to pay for some of the OPEB provided by the City to its retired employees, and (2) OPEB paid for directly by the City out of its general resources rather than through the NYCRHBT. The NYCRHBT was established for the exclusive benefit of the City’s retired employees and their eligible spouses and dependents, to fund some of the OPEB provided in accordance with the City’s various collective bargaining agreements and the Administrative Code of the City of New York (ACCNY).
Please note that the OPEB valuation results presented in this Report show the value of OPEB in effect during each fiscal year and do not represent an obligation of the City or the Component Units to continue, modify, or eliminate OPEB in the future.
Plan Administration: The New York City Office of Labor Relations (OLR) administers the New York City Health Benefits Program which includes the New York City Postretirement Benefits Program (Program), a defined benefit postretirement benefits plan. ACCNY Section 12-126 defines OPEB payable to include Health Insurance and Medicare Part B Premium Reimbursement.
Welfare Fund benefits are provided through Welfare Fund arrangements agreed upon, in most cases, through collective bargaining.
Plan Membership: For the Fiscal Year 2021 OPEB valuation, membership consisted of the following. Comparative values for the Fiscal Year 2020 valuation are also shown.

2
Membership Status as of Beginning of Fiscal Year (excluding Component Units) FY 2021 FY 2020
Active plan members 303,918 300,500
Active members off payroll who may become eligible to receive benefits1 0 35,048 Inactive plan members entitled to but not yet receiving benefits 21,976 20,611
Inactive plan members or beneficiaries currently receiving benefits 243,978 240,522
Total 569,872 596,681
Eligibility and Benefits: See SECTION V – SUMMARY OF PLAN PROVISIONS.
Contributions: The City contributions to fund the OPEB benefits are currently reimbursing the NYCRHBT on a pay-as-you-go basis with the possibility of additional contributions that are intended to build the fund for purposes of paying future benefits. The City is not required to provide funding for the OPEB Plan beyond the pay-as-you-go amounts for benefits to current retirees and their dependents. During Fiscal Year 2021, the City contributed approximately $3.6 billion to the OPEB Plan.
Assets: Assets are valued at market value.
SECTION II – FIDUCIARY NET POSITION includes two tables showing the detailed financial position of the Plan as of June 30, 2021 and June 30, 2020. The Statement of Fiduciary Net Position represents assets of the Plan and not the NYCRHBT.
• Table II-a sets forth the assets of the Plan.
• Table II-b sets forth the changes in net assets and includes non-trust activity for Fiscal Years 2021 and 2020.
Asset and other financial information reflected in this valuation for the City and the Plan were provided by OMB on August 11, 2021 and checked for reasonability by the OA.
Key Changes Included in This Valuation
The following key changes were included in the Fiscal Year 2021 OPEB valuation:
1 Active members off payroll is no longer treated as a separate status as of June 30, 2020. Those on a known short-term leave of absence are treated as actives, and the remaining members are included as inactive members entitled to but not yet receiving benefits if they have met the OPEB vesting requirements. Otherwise, they are not included in the valuation.

3
• The mortality improvement scale was updated to MP-2020 to reflect more recent information published by the Society of Actuaries in October 2020. This scale was applied to all mortality decrements except active accidental death benefits, which are not assumed to be impacted by mortality improvement.
• Active members off payroll is no longer treated as a separate status as of June 30, 2020. Those on a known short-term leave of absence are treated as actives, and the remaining members are included as inactive members entitled to but not yet receiving benefits if they have met the OPEB vesting requirements. Otherwise, they are not included in the valuation.
• The valuation discount rate as of June 30, 2021 was updated to 2.19% for benefits provided by the City, and 2.18% for benefits provided by Component Units. The valuation discount rate as of June 30, 2020 had been 2.68% for benefits provided by the City, and 2.66% for Component Units. See SECTION VI – ACTUARIAL ASSUMPTIONS AND METHODS for more information.
Investments
Rate of Return: The return was 0.12% for the fiscal year ended June 30, 2021. The money-weighted rate of return expresses investment performance, net of investment expense, adjusted for the changing amounts actually invested.
Net OPEB Liability of the City
The components of the net OPEB liability at June 30, 2021, and June 30, 2020 are as follows:
($’s in millions) June 30, 2021 June 30, 2020
Total OPEB liability $ 122,170 $ 113,229
Plan fiduciary net position $ 4,221 $ 3,800
Net OPEB liability $ 117,949 $ 109,429
Plan fiduciary net position as a percentage of the total OPEB liability 3.5% 3.4%
Projection of Fiduciary Net Position
In projecting the fiduciary net position of the plan, the projection of cash flows assumed that the City will contribute at a rate equal to the actual cost of benefits plus the average of contributions above the actual cost of benefits in the last five years. The contributions were assumed to apply first to the service cost for future employees and the remaining contributions

4
to the current and past service costs for current employees. A further portion was assumed to be associated with non-trust benefit payments.
Based on those assumptions the plan’s fiduciary net position is projected to be greater than the benefits to be made in all years until 2028. After that time, the plan fiduciary net position will be insufficient to make all benefit payments for plan participants and benefit payments will be funded on a pay-as-you-go basis thereafter.

5
SECTION II – FIDUCIARY NET POSITION
Table II-a: Statement of Fiduciary Net Position
June 30, 2021 1 June 30, 2020 2
ASSETSCash
Settled Cash $ 926,472,185 $ 1,499,404,612Receivables
Trust 270 877,382Medicare Part D 45,057 45,057Total Cash $ 926,517,512 $ 1,500,327,051
Cash EquivalentsUS Treasury Bills $ 2,658,381,750 $ 2,139,146,200Commercial Paper 867,797,521 150,295,698Short Term Funds 206,335,486 199,630,552
Total Cash Equivalents $ 3,732,514,757 $ 2,489,072,450
Fixed IncomeGovernment and Agencies 0 210,634,950
Total Fixed Income $ 0 $ 210,634,950
Prepaid Benefits / Expenses $ 34,265 $ 0Total Prepaid $ 34,265 $ 0
Total Assets $ 4,659,066,534 $ 4,200,034,451
LIABILITIESMedicare Part B $ 220,785,488 $ 191,247,733Benefits Payable 217,675,825 208,253,807Trustee Fees Payable 43,750 43,750Audit Fees Payable 54,000 0
Total Liabilities $ 438,559,063 $ 399,545,290
FIDUCIARY NET POSITIONHeld in Trust for Benefit Payments $ 4,220,507,471 $ 3,800,489,161
1 Based on Information Provided by OMB on August 11, 2021.2 Based on Information Provided by OMB on August 14, 2020.

6
Table II-b: Statement of Changes in Fiduciary Net Position
June 30, 2021 1 June 30, 2020 2
ADDITIONSEmployer Contributions
Pay-As-You-GoTrust $ 3,200,026,870 $ 1,679,592,426Non-Trust 399,530,535 379,458,375
Other 0 1,751Total Contributions $ 3,599,557,405 $ 2,059,052,552
Earned IncomeInterest Income $ 11,635,353 $ 76,411,842Net Realized Gain / (Loss) 590,106 7,234,843
Total Investment Income $ 12,225,459 $ 83,646,685
Net Unrealized Gain / (Loss) (8,424,186) (7,526,950)
TOTAL ADDITIONS $ 3,603,358,678 $ 2,135,172,287
DEDUCTIONSBenefit Payments
Trust $ 2,783,580,834 $ 2,634,600,925Non-Trust 399,530,535 379,458,375
Sub-Total $ 3,183,111,369 $ 3,014,059,300Expenses
Administrative Expenses $ 54,000 $ 0Legal Fees 0 0Trustee Fees 175,000 175,000
Sub-Total $ 229,000 $ 175,000
TOTAL DEDUCTIONS $ 3,183,340,369 $ 3,014,234,300
CHANGE IN FIDUCIARY NET POSITION $ 420,018,309 $ (879,062,013)
FIDUCIARY NET POSITION HELD IN TRUST FOR BENEFIT PAYMENTS
Beginning of Year $ 3,800,489,161 $ 4,679,551,174
End of Year $ 4,220,507,470 $ 3,800,489,161
1 Based on Information Provided by OMB on August 11, 2021.2 Based on Information Provided by OMB on August 14, 2020.

7
SECTION III – SCHEDULES OF REQUIRED SUPPLEMENTARY INFORMATION
Notes to Schedules
• Benefit changes: None
• Assumption changes:
o The discount rate used to measure liabilities was updated to reflect the S&P Municipal Bond 20-Year High Grade Index yield as of June 30, 2021 as per GASB74/75 guidance.
o Certain per capita claims costs as well as the IRMAA trend assumption were updated based on recent experience.
o The mortality improvement scale was updated to reflect more recent data published by the Society of Actuaries.
o Active members off payroll is no longer treated as a separate status as of June 30, 2020. Those on a known short-term leave of absence are treated as actives, and the remaining members are included as inactive members entitled to but not yet receiving benefits if they have met the OPEB vesting requirements. Otherwise, they are not included in the valuation.

8
New York City Educational Construction Fund (ECF)

9
1. Activesa. Number 3b. Salary $406,098c. Average Age 54.71d. Average Service 7.83e. Average Salary $135,366
2. Deferreds (Includes Deferred Retirees, if any)a. Number 1b. Average Age 48.34
3. Retireesa. Total1
i. Number 5ii. Average Age 73.21
b. By Benefit Participant / Spousei. Pre-Medicare2 1 / 0
ii. Medicare Eligible2 3 / 2iii. Welfare Fund2 NR / NRiv. Medicare Part B3 4 / 3
1 Retirees eligible for at least one benefit from ECF.2 Retirees currently eligible for benefit from ECF.3 Retirees eligible for benefit from ECF currently or in the future.
NR Not responsible (benefit not the responsibility of ECF).
NEW YORK CITY HEALTH BENEFITS PROGRAM
Governmental Accounting Standards Board Statements No. 74 and No. 75 (GASB 74/75)
New York City Educational Construction Fund (ECF)
Summary of June 30, 2020 Data

10
1. Total Present Value of Projected BenefitsPre-Medicare Medicare Welfare Funds Part B Premium Cadillac Tax Total
a. Active 1 140,373$ 812,175$ 0$ 226,704$ 65,373$ 1,244,625$
b. Deferred 2 215,923 252,986 0 72,376 42,182 583,467
c. Retired 98,773 704,284 0 205,858 8,799 1,017,714
d. TOTAL 455,069$ 1,769,445$ 0$ 504,938$ 116,354$ 2,845,806$
2. Entry Age Accrued Liability
a. Active 1 41,898$ 336,511$ 0$ 92,452$ 25,961$ 496,822$
b. Deferred 2 215,923 252,986 0 72,376 42,182 583,467
c. Retired 98,773 704,284 0 205,858 8,799 1,017,714
d. TOTAL 356,594$ 1,293,781$ 0$ 370,686$ 76,942$ 2,098,003$
3. Market Value of Assets 0$
4. Unfunded Accrued Liability (UAL) 2,098,003$
5. Entry Age Normal Cost 69,235$
6. Salary of Active Participants 389,416$
7. Normal Cost Percentage 17.779%[5. / 6.]
1 Includes Total Present Value of Projected Benefits for AOP, if any. 2 Includes Deferred Retirees, if any.
NEW YORK CITY HEALTH BENEFITS PROGRAM
Governmental Accounting Standards Board Statements No. 74 and No. 75 (GASB 74/75)
New York City Educational Construction Fund (ECF)
June 30, 2019 Results of the Actuarial ValuationBased on a 2.79% Discount Rate

11
1. Total Present Value of Projected BenefitsPre-Medicare Medicare Welfare Funds Part B Premium Cadillac Tax Total
a. Active1 152,180$ 846,917$ 0$ 237,543$ 0$ 1,236,640$
b. Deferred 2 225,365 256,949 0 73,905 0 556,219
c. Retired 84,426 677,727 0 139,779 0 901,932
d. TOTAL 461,971$ 1,781,593$ 0$ 451,227$ 0$ 2,694,791$
2. Entry Age Accrued Liability
a. Active1 53,027$ 394,577$ 0$ 109,086$ 0$ 556,690$
b. Deferred 2 225,365 256,949 0 73,905 0 556,219
c. Retired 84,426 677,727 0 139,779 0 901,932
d. TOTAL 362,818$ 1,329,253$ 0$ 322,770$ 0$ 2,014,841$
3. Market Value of Assets 0$
4. Unfunded Accrued Liability (UAL) 2,014,841$
5. Entry Age Normal Cost 67,125$
6. Salary of Active Participants 406,098$
7. Normal Cost Percentage 16.529%[5. / 6.]
1 Includes Total Present Value of Projected Benefits for AOP, if any. 2 Includes Deferred Retirees, if any.
NEW YORK CITY HEALTH BENEFITS PROGRAM
Governmental Accounting Standards Board Statements No. 74 and No. 75 (GASB 74/75)
New York City Educational Construction Fund (ECF)
June 30, 2020 Results of the Actuarial ValuationBased on a 2.66% Discount Rate

12
Total1. Plan Net Position @ 6/30/2019 0$
2. Changes for the year:a. ER Contributions 51,900b. EE Contributions 0c. Net Investment Income 0d. Benefit Payments (51,900)e. Administrative Expenses 0f. Other 0g. Net Changes 0$
3. Plan Net Position @ 6/30/2020 0$
4. Changes for the year:a. ER Contributions 41,763b. EE Contributions 0c. Net Investment Income 0d. Benefit Payments (41,763)e. Administrative Expenses 0f. Other 0g. Net Changes 0$
5. Plan Net Position @ 6/30/2021 0$
Market Values of Assets
NEW YORK CITY HEALTH BENEFITS PROGRAM
Governmental Accounting Standards Board Statements No. 74 and No. 75 (GASB 74/75)
New York City Educational Construction Fund (ECF)

13
Total
1. Market Value 6/30/2019 0$
2. Market Value 6/30/2020 0
3. Net Investment Income 0
4. Cash Flow 0(2. - 1. - 3.)
5. Projected Earnings 0(4% * 1. + 1.980% * 4.)
6. (Gain) / Loss 0(5. - 3.)
7. Recognition Period 5 Years
8. Amount Recognized in OPEB Expense 0(6. / 7.)
9. Deferred (Inflow) / Outflow of Resources 0$ (6. - 8.)
NEW YORK CITY HEALTH BENEFITS PROGRAM
Governmental Accounting Standards Board Statements No. 74 and No. 75 (GASB 74/75)
Development of Asset (Gain) / LossJune 30, 2020
New York City Educational Construction Fund (ECF)

14
Total
1. Market Value 6/30/2020 0$
2. Market Value 6/30/2021 0
3. Net Investment Income 0
4. Cash Flow 0(2. - 1. - 3.)
5. Projected Earnings 0(4% * 1. + 1.980% * 4.)
6. (Gain) / Loss 0(5. - 3.)
7. Recognition Period 5 Years
8. Amount Recognized in OPEB Expense 0(6. / 7.)
9. Deferred (Inflow) / Outflow of Resources 0$ (6. - 8.)
NEW YORK CITY HEALTH BENEFITS PROGRAM
Governmental Accounting Standards Board Statements No. 74 and No. 75 (GASB 74/75)
New York City Educational Construction Fund (ECF)
Development of Asset (Gain) / LossJune 30, 2021

15
Total
1. Disclosed Entry Age Accrued Liability (EAAL) at 6/30/20191 2,150,915$ 2. Entry Age Normal Cost at 6/30/20191 69,2353. Actual Benefit Payments-FY20 (51,900)4. Interest1 61,2235. (Gain)/Loss due to Experience Change1 (54,387)6. (Gain)/Loss due to Updated Mortality Scale1 (90,369)7. (Gain)/Loss due to Discount Rate Change 45,9328. (Gain)/Loss due to Cadillac Tax Repeal2 (80,727)
9. Roll-Forward EAAL at 6/30/20202 2,049,922$
1Assumes a 2.79% interest rate2Assumes a 2.66% interest rate
NEW YORK CITY HEALTH BENEFITS PROGRAM
Governmental Accounting Standards Board Statements No. 74 and No. 75 (GASB 74/75)
New York City Educational Construction Fund (ECF)
Roll-Forward of Entry Age Accrued Liabilities to June 30, 2020

16
Total
1. Disclosed Entry Age Accrued Liability (EAAL) at 6/30/20201 2,049,922$ 2. Entry Age Normal Cost at 6/30/20201 67,1253. Actual Benefit Payments-FY21 (41,763)4. Interest1 55,7625. (Gain)/Loss due to Experience Change1 (36,015)8. (Gain)/Loss due to Rx Plan Changes1 (461,063)6. (Gain)/Loss due to Trend and Demographic Assumption Changes1 37,3047. (Gain)/Loss due to Discount Rate Change 131,333
9. Roll-Forward EAAL at 6/30/20212 1,802,605$
1Assumes a 2.66% interest rate2Assumes a 2.18% interest rate
NEW YORK CITY HEALTH BENEFITS PROGRAM
Governmental Accounting Standards Board Statements No. 74 and No. 75 (GASB 74/75)
New York City Educational Construction Fund (ECF)
Roll-Forward of Entry Age Accrued Liabilities to June 30, 2021

17
Total OPEB Plan Fiduciary Net OPEBLiability Net Position Liability
(a) (b) (a) - (b)1. Balances at June 30, 2019 2,150,915$ 0$ 2,150,915$
2. Changes for the Year:a. Service Cost 69,235 0 69,235b. Interest 61,223 0 61,223c. Differences b/t Expected and Actual Experience (54,387) 0 (54,387)d. Changes in Assumptions (44,437) 0 (44,437)e. Contributions - Employer 0 51,900 (51,900)f. Contributions - Employee 0 0 0g. Net Investment Income 0 0 0h. Actual Benefit Payments (51,900) (51,900) 0i. Administrative Expenses 0 0 0j. Other Changes1 (80,727) 0 (80,727)k. Net Changes (100,993) 0$ (100,993)$
3. Balances at June 30, 2020 2,049,922$ 0$ 2,049,922$
4. Sensitivity of the Net OPEB Liability to Changes in the Discount Ratea. 1% Decrease 2,435,000$ b. 1% Increase 1,750,681$
5. Sensitivity of the Net OPEB Liability to Changes in the Healthcare Cost Trend Ratea. 1% Decrease 1,726,527$ b. 1% Increase 2,464,359$
1Repeal of the Cadillac Tax
NEW YORK CITY HEALTH BENEFITS PROGRAM
Governmental Accounting Standards Board Statements No. 74 and No. 75 (GASB 74/75)
New York City Educational Construction Fund (ECF)
Changes in Net OPEB Liability (NOL) by SourceBalances at June 30, 2020

18
Total OPEB Plan Fiduciary Net OPEBLiability Net Position Liability
(a) (b) (a) - (b)1. Balances at June 30, 2020 2,049,922$ 0$ 2,049,922$
2. Changes for the Year:a. Service Cost 67,125 0 67,125b. Interest 55,762 0 55,762c. Differences b/t Expected and Actual Experience (36,015) 0 (36,015)d. Changes in Assumptions (292,426) 0 (292,426)e. Contributions - Employer 0 41,763 (41,763)f. Contributions - Employee 0 0 0g. Net Investment Income 0 0 0h. Actual Benefit Payments (41,763) (41,763) 0i. Administrative Expenses 0 0 0j. Other Changes 0 0 0k. Net Changes (247,317) 0$ (247,317)$
3. Balances at June 30, 2021 1,802,605$ 0$ 1,802,605$
4. Sensitivity of the Net OPEB Liability to Changes in the Discount Ratea. 1% Decrease 2,131,936$ b. 1% Increase 1,544,960$
5. Sensitivity of the Net OPEB Liability to Changes in the Healthcare Cost Trend Ratea. 1% Decrease 1,522,908$ b. 1% Increase 2,158,991$
NEW YORK CITY HEALTH BENEFITS PROGRAM
Governmental Accounting Standards Board Statements No. 74 and No. 75 (GASB 74/75)
New York City Educational Construction Fund (ECF)
Changes in Net OPEB Liability (NOL) by SourceBalances at June 30, 2021

19
2021 2020 2019 2018 2017 20161. Total OPEB Liability
a. Service Cost 67,125$ 69,235$ 77,208$ 78,627$ 76,223$ 92,498$ b. Interest 55,762 61,223 117,136 113,500 108,370 54,890c. Differences b/t Expected and Actual Experience (36,015) (54,387) (1,824,770) 37,345 2,178,629 20,054d. Changes of Assumptions (292,426) (44,437) (46,326) 166,200 (820,838) 0e. Benefit Payments (41,763) (51,900) (51,363) (58,457) (59,650) (62,303)f. Other Changes1 0 (80,727) 0 0 0 0g. Net Changes in Total OPEB Liability (247,317)$ (100,993)$ (1,728,115)$ 337,215$ 1,482,734$ 105,139$
2. Total OPEB Liability - Beginning 2,049,922$ 2,150,915$ 3,879,030$ 3,541,815$ 2,059,081$ 1,953,942$ 3. Total OPEB Liability - Ending 1,802,605$ 2,049,922$ 2,150,915$ 3,879,030$ 3,541,815$ 2,059,081$
4. Plan Fiduciary Net Positiona. Contributions - Employer 41,763$ 51,900$ 51,363$ 58,457$ 59,650$ 62,303$ b. Contributions - Employee 0 0 0 0 0 0c. Net Investment Income 0 0 0 0 0 0d. Benefit Payments (41,763) (51,900) (51,363) (58,457) (59,650) (62,303)e. Administrative Expenses 0 0 0 0 0 0f. Other Changes 0 0 0 0 0 0g. Net Changes in Plan Fiduciary Net Position 0$ 0$ 0$ 0$ 0$ 0$
5. Plan Fiduciary Net Position - Beginning 0$ 0$ 0$ 0$ 0$ 0$ 6. Plan Fiduciary Net Position - Ending 0$ 0$ 0$ 0$ 0$ 0$
7. Net OPEB Liability 1,802,605$ 2,049,922$ 2,150,915$ 3,879,030$ 3,541,815$ 2,059,081$
8. Plan Fiduciary Net Position as a Percentageof Total OPEB Liability 0.0% 0.0% 0.0% 0.0% 0.0% 0.0%
9. Covered Employee Payroll $406,098 $389,416 $377,420 $370,652 $359,856 $483,451
10. Net OPEB Liability as a Percentageof Covered Employee Payroll 443.9% 526.4% 569.9% 1046.5% 984.2% 425.9%
1Repeal of the Cadillac Tax
NEW YORK CITY HEALTH BENEFITS PROGRAM
Governmental Accounting Standards Board Statements No. 74 and No. 75 (GASB 74/75)
New York City Educational Construction Fund (ECF)
Schedule of Changes in Net OPEB Liability and Related Ratios

20
Total Future Average ExpectedWorkLife Remaining Service Life
Group # Count @ 6/30/2020 @ 6/30/2020Active 3 8.76 2.92Deferred Vested 1 0 0Retired 5 0 0 Total 9 8.76 1.00
NEW YORK CITY HEALTH BENEFITS PROGRAM
Governmental Accounting Standards Board Statements No. 74 and No. 75 (GASB 74/75)
New York City Educational Construction Fund (ECF)
Average Expected Remaining Service Lives

21
Differencesbetween Expected Recognition
and Actual PeriodYear Experience (Years) 2018 2019 2020 20212018 37,345$ 1.15 32,474 4,871 0 02019 (1,824,770)$ 1.11 0 (1,643,937) (180,833) 02020 (54,387)$ 1.04 0 0 (52,295) (2,092)2021 (36,015)$ 1.00 0 0 0 (36,015)
Net increase (decrease) in OPEB Expense 32,474$ (1,639,066)$ (233,128)$ (38,107)$
NEW YORK CITY HEALTH BENEFITS PROGRAM
Governmental Accounting Standards Board Statements No. 74 and No. 75 (GASB 74/75)
New York City Educational Construction Fund (ECF)
Increase (Decrease) in OPEB Expense Arising from the Recognition ofDifferences between Expected and Actual Experience

22
Differences Recognitiondue to Changes Period
Year in Assumptions (Years) 2018 2019 2020 20212018 166,200$ 1.15 144,522 21,678 0 02019 (46,326)$ 1.11 0 (41,735) (4,591) 02020 (44,437)$ 1.04 0 0 (42,728) (1,709)2021 (292,426)$ 1.00 0 0 0 (292,426)
Net increase (decrease) in OPEB Expense 144,522$ (20,057)$ (47,319)$ (294,135)$
NEW YORK CITY HEALTH BENEFITS PROGRAM
Governmental Accounting Standards Board Statements No. 74 and No. 75 (GASB 74/75)
New York City Educational Construction Fund (ECF)
Increase (Decrease) in OPEB Expense Arising from the Recognition ofChanges in Assumptions

23
Differencesbetween Projected
and ActualEarnings on RecognitionOPEB Plan Period
Year Investments (Years) 2018 2019 2020 2021 20222018 0$ 5 0 0 0 0 02019 0$ 5 0 0 0 0 02020 0$ 5 0 0 0 0 02021 0$ 5 0 0 0 0 0
Net increase (decrease) in OPEB Expense 0$ 0$ 0$ 0$ 0$
NEW YORK CITY HEALTH BENEFITS PROGRAM
Governmental Accounting Standards Board Statements No. 74 and No. 75 (GASB 74/75)
New York City Educational Construction Fund (ECF)
Increase (Decrease) in OPEB Expense Arising from the Recognition of Differences between Projected and Actual Earnings on OPEB Plan Investments

24
NEW YORK CITY HEALTH BENEFITS PROGRAM
Components of OPEB Expense for the Fiscal Year Ended June 30, 2020
Component Amount
a. Service Cost 69,235$ b. Interest on the Total OPEB Liability 61,223c. Differences between Expected and Actual Experience (233,128)d. Changes of Assumptions (47,319)e. Employee Contributions 0f. Projected Earnings on OPEB Plan Investments 0g. Differences between Projected and Actual Earnings on Plan Investments 0h. OPEB Plan Administrative Expenses 0i. Other Changes in Fiduciary Net Position 0j. Other Changes in Total OPEB Liability1 (80,727)
Total OPEB Expense (230,716)$
1Repeal of Cadillac Tax
Governmental Accounting Standards Board Statements No. 74 and No. 75 (GASB 74/75)
New York City Educational Construction Fund (ECF)

25
NEW YORK CITY HEALTH BENEFITS PROGRAM
Components of OPEB Expense for the Fiscal Year Ended June 30, 2021
Component Amount
a. Service Cost 67,125$ b. Interest on the Total OPEB Liability 55,762c. Differences between Expected and Actual Experience (38,107)d. Changes of Assumptions (294,135)e. Employee Contributions 0f. Projected Earnings on OPEB Plan Investments 0g. Differences between Projected and Actual Earnings on Plan Investments 0h. OPEB Plan Administrative Expenses 0i. Other Changes in Fiduciary Net Position 0j. Other Changes in Total OPEB Liability 0
Total OPEB Expense (209,355)$
Governmental Accounting Standards Board Statements No. 74 and No. 75 (GASB 74/75)
New York City Educational Construction Fund (ECF)

26
Recognized OPEB Expense
Deferred Resources Outflows Inflows Outflows Inflows Outflows Inflows Outflows Inflows
Differences between Expected and Actual Experience 4,871$ 0$ 0$ 180,833$ 0$ 2,092$ 0$ 0$
Changes of Assumptions 21,678 0 0 4,591 0 1,709 0 0
Net Difference between Projected and Actual Earnings on OPEB Plan Investments 0 0 0 0 0 0 0 0
Total 26,549$ 0$ 0$ 185,424$ 0$ 3,801$ 0$ 0$
Amounts reported as Deferred Outflows of Resources and Deferred Inflows of Resources related to OPEB will be recognized in OPEB Expense as follows:
Fiscal YearEnded June 302018201920202021
$26,549($95,023)($3,801)
($1,685,672)($185,424)
(328,441)
$176,996
Fiscal Year Ending June 30, 2020Fiscal Year Ending June 30, 2019
NEW YORK CITY HEALTH BENEFITS PROGRAM
Governmental Accounting Standards Board Statements No. 74 and No. 75 (GASB 74/75)
New York City Educational Construction Fund (ECF)
OPEB Expense, Deferred Outflows of Resources, Deferred Inflows of Resources
Fiscal Year Ending June 30, 2021($209,355)($1,464,779) ($230,716)
Fiscal Year Ending June 30, 2018$369,123

27
For the Fiscal Year ended June 30, 2021, the City recognized OPEB Expense of ($209,355).
At June 30, 2021, the City reported total Deferred Outflows of Resources and Deferred Inflows of Resources related to OPEB from the following sources:
Deferred DeferredOutflows Inflows
of Resources of Resources
Differences between Expected and Actual Experience 0$ 0$
Changes of Assumptions 0 0
Net Difference between Projected and Actual Earnings on OPEB Plan Investments 0 0
Total 0$ 0$
Amounts reported as Deferred Outflows of Resources and Deferred Inflows of Resources related to OPEB will be recognized in OPEB Expense as follows:
Fiscal YearEnded June 30 Amount2021 (332,242)$ 2022 02023 02024 02025 0
NEW YORK CITY HEALTH BENEFITS PROGRAM
Governmental Accounting Standards Board Statements No. 74 and No. 75 (GASB 74/75)
New York City Educational Construction Fund (ECF)
OPEB Expense, Deferred Outflows of Resources, Deferred Inflows of Resources

28
New York City Health and Hospitals Corporation (HHC)

29
NYCERS TRS BERS TOTAL1. Actives
a. Number 31,141 0 17 31,158b. Salary 2,462,506,678$ NA 1,575,511$ 2,464,082,189$ c. Average Age 49.45 NA 53.00 49.46d. Average Service 10.33 NA 14.98 10.33e. Average Salary 79,076$ NA 92,677$ 79,083$
2. Deferreds (Includes Deferred Retirees, if any)a. Number 3,216 1 1 3,218b. Average Age 54.96 38.00 58.00 54.96
3. Retireesa. Total1
i. Number 22,964 5 3 22,972ii. Average Age 73.71 73.89 74.67 73.71
b. By Benefit Participant / Spousei. Pre-Medicare2 3,392 / 1,841
ii. Medicare Eligible2 19,580 / 5,074iii. Welfare Fund2 21,230 / NEiv. Medicare Part B3 NR / NR
1 Retirees eligible for at least one benefit from HHC.2 Retirees currently eligible for benefit from HHC.3 Retirees eligible for benefit from HHC currently or in the future.
NR Not responsible (benefit not the responsibility of HHC).NE Not eligible.
NEW YORK CITY HEALTH BENEFITS PROGRAM
Governmental Accounting Standards Board Statements No. 74 and No. 75 (GASB 74/75)
New York City Health and Hospitals Corporation (HHC)
Summary of June 30, 2020 OPEB Data

30
1. Total Present Value of Projected BenefitsPre-Medicare Medicare Welfare Funds Part B Premium Cadillac Tax Total
a. Active 1 1,811,494,913$ 2,466,016,312$ 1,469,644,582$ 0$ 103,153,470$ 5,850,309,277$
b. Deferred 2 408,024,574 272,825,381 160,126,300 0 7,532,563 848,508,818
c. Retired 399,339,547 1,117,520,416 658,298,677 0 1,875,564 2,177,034,204
d. TOTAL 2,618,859,034$ 3,856,362,109$ 2,288,069,559$ 0$ 112,561,597$ 8,875,852,299$
2. Entry Age Accrued Liability
a. Active 1 538,735,767$ 989,578,253$ 540,910,366$ 0$ 25,703,350$ 2,094,927,736$
b. Deferred 2 408,024,574 272,825,381 160,126,300 0 7,532,563 848,508,818
c. Retired 399,339,547 1,117,520,416 658,298,677 0 1,875,564 2,177,034,204
d. TOTAL 1,346,099,888$ 2,379,924,050$ 1,359,335,343$ 0$ 35,111,477$ 5,120,470,758$
3. Market Value of Assets 0$
4. Unfunded Accrued Liability (UAL) 5,120,470,758$
5. Entry Age Normal Cost 264,511,977$
6. Salary of Active Participants 2,320,004,778$
7. Normal Cost Percentage 11.401%[5. / 6.]
1 Includes Total Present Value of Projected Benefits for AOP, if any. 2 Includes Deferred Retirees, if any.
NEW YORK CITY HEALTH BENEFITS PROGRAM
Governmental Accounting Standards Board Statements No. 74 and No. 75 (GASB 74/75)
New York City Health and Hospitals Corporation (HHC)
June 30, 2019 Results of the Actuarial ValuationBased on a 2.79% Discount Rate

31
1. Total Present Value of Projected BenefitsPre-Medicare Medicare Welfare Funds Part B Premium Cadillac Tax Total
a. Active 1 2,172,718,311$ 2,765,022,622$ 1,327,905,757$ 0$ 0$ 6,265,646,690$
b. Deferred 2 420,079,301 279,847,908 159,724,121 0 0 859,651,330
c. Retired 370,808,904 1,164,413,509 657,574,259 0 0 2,192,796,672
d. TOTAL 2,963,606,516$ 4,209,284,039$ 2,145,204,137$ 0$ 0$ 9,318,094,692$
2. Entry Age Accrued Liability
a. Active 1 584,586,339$ 1,035,772,554$ 502,349,446$ 0$ 0$ 2,122,708,339$
b. Deferred 2 420,079,301 279,847,908 159,724,121 0 0 859,651,330
c. Retired 370,808,904 1,164,413,509 657,574,259 0 0 2,192,796,672
d. TOTAL 1,375,474,544$ 2,480,033,971$ 1,319,647,826$ 0$ 0$ 5,175,156,341$
3. Market Value of Assets 0$
4. Unfunded Accrued Liability (UAL) 5,175,156,341$
5. Entry Age Normal Cost 279,634,887$
6. Salary of Active Participants 2,464,082,189$
7. Normal Cost Percentage 11.348%[5. / 6.]
1 Includes Total Present Value of Projected Benefits for AOP, if any. 2 Includes Deferred Retirees, if any.
NEW YORK CITY HEALTH BENEFITS PROGRAM
Governmental Accounting Standards Board Statements No. 74 and No. 75 (GASB 74/75)
New York City Health and Hospitals Corporation (HHC)
June 30, 2020 Results of the Actuarial ValuationBased on a 2.66% Discount Rate

32
Total1. Plan Net Position @ 6/30/2019 0$
2. Changes for the year:a. ER Contributions 230,815,371b. EE Contributions 0c. Net Investment Income 0d. Benefit Payments (230,815,371)e. Administrative Expenses 0f. Other 0g. Net Changes 0$
3. Plan Net Position @ 6/30/2020 0$
4. Changes for the year:a. ER Contributions 116,816,521b. EE Contributions 0c. Net Investment Income 0d. Benefit Payments (116,816,521)e. Administrative Expenses 0f. Other 0g. Net Changes 0$
5. Plan Net Position @ 6/30/2021 0$
Market Values of Assets
NEW YORK CITY HEALTH BENEFITS PROGRAM
Governmental Accounting Standards Board Statements No. 74 and No. 75 (GASB 74/75)
New York City Health and Hospitals Corporation (HHC)

33
Total
1. Market Value 6/30/2019 0$
2. Market Value 6/30/2020 0
3. Net Investment Income 0
4. Cash Flow 0(2. - 1. - 3.)
5. Projected Earnings 0(4% * 1. + 1.980% * 4.)
6. (Gain) / Loss 0(5. - 3.)
7. Recognition Period 5 Years
8. Amount Recognized in OPEB Expense 0(6. / 7.)
9. Deferred (Inflow) / Outflow of Resources 0$ (6. - 8.)
NEW YORK CITY HEALTH BENEFITS PROGRAM
Governmental Accounting Standards Board Statements No. 74 and No. 75 (GASB 74/75)
Development of Asset (Gain) / LossJune 30, 2020
New York City Health and Hospitals Corporation (HHC)
34
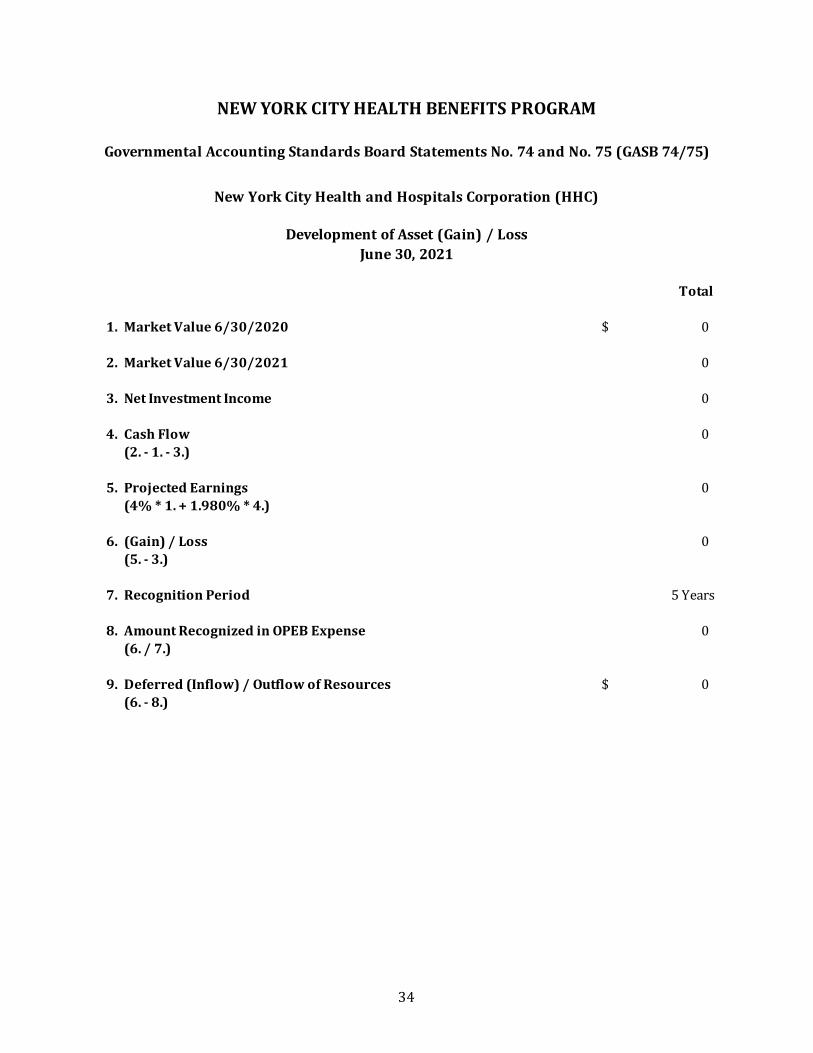
Total
1. Market Value 6/30/2020 0$
2. Market Value 6/30/2021 0
3. Net Investment Income 0
4. Cash Flow 0(2. - 1. - 3.)
5. Projected Earnings 0(4% * 1. + 1.980% * 4.)
6. (Gain) / Loss 0(5. - 3.)
7. Recognition Period 5 Years
8. Amount Recognized in OPEB Expense 0(6. / 7.)
9. Deferred (Inflow) / Outflow of Resources 0$ (6. - 8.)
NEW YORK CITY HEALTH BENEFITS PROGRAM
Governmental Accounting Standards Board Statements No. 74 and No. 75 (GASB 74/75)
New York City Health and Hospitals Corporation (HHC)
Development of Asset (Gain) / LossJune 30, 2021

35
Total
1. Disclosed Entry Age Accrued Liability (EAAL) at 6/30/2019¹ 5,559,103,434$ 2. Entry Age Normal Cost at 6/30/2019¹ 264,511,9773. Actual Benefit Payments-FY20 (230,815,371)4. Interest¹ 159,281,1465. (Gain)/Loss due to Experience Change¹ (450,870,527)6. (Gain)/Loss due to Discount Rate Change 99,391,0487. (Gain)/Loss due to Cadillac Tax Repeal² (41,077,814)
8. Roll-Forward EAAL at 6/30/2020² 5,359,523,893$
1Assumes a 2.79% interest rate2Assumes a 2.66% interest rate
NEW YORK CITY HEALTH BENEFITS PROGRAM
Governmental Accounting Standards Board Statements No. 74 and No. 75 (GASB 74/75)
New York City Health and Hospitals Corporation (HHC)
Roll-Forward of Entry Age Accrued Liabilities to June 30, 2020
36
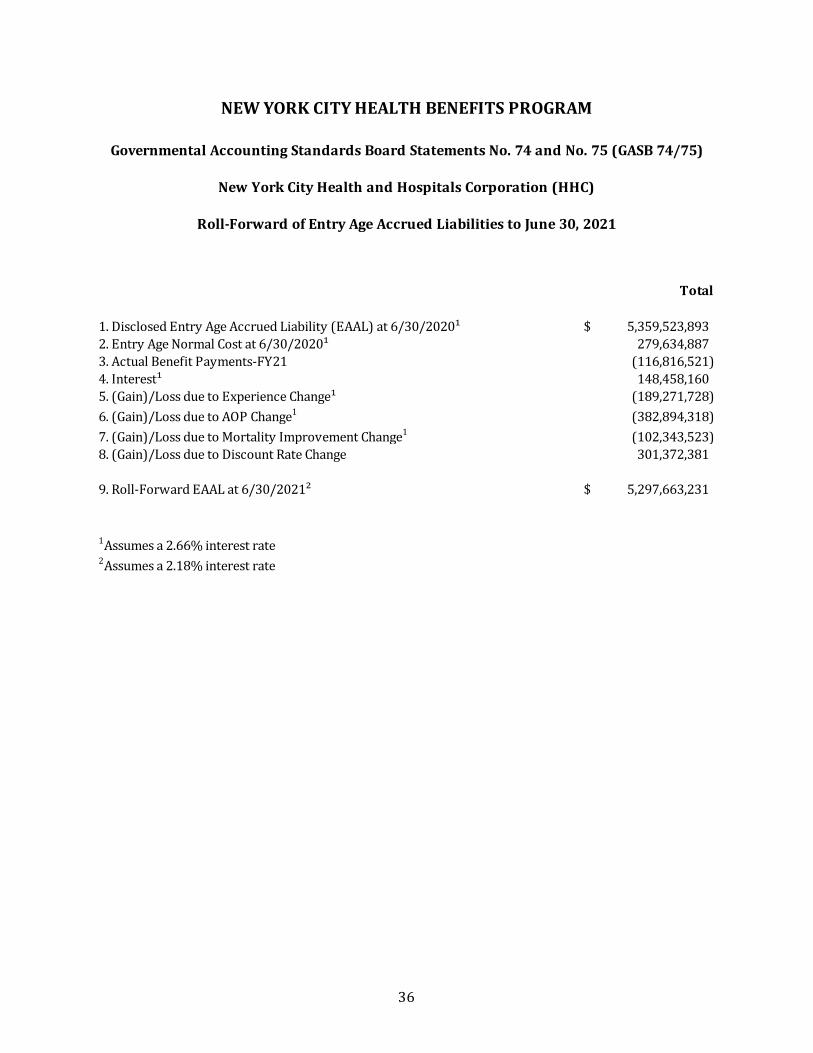
Total
1. Disclosed Entry Age Accrued Liability (EAAL) at 6/30/2020¹ 5,359,523,893$ 2. Entry Age Normal Cost at 6/30/2020¹ 279,634,8873. Actual Benefit Payments-FY21 (116,816,521)4. Interest¹ 148,458,1605. (Gain)/Loss due to Experience Change¹ (189,271,728)6. (Gain)/Loss due to AOP Change1 (382,894,318)7. (Gain)/Loss due to Mortality Improvement Change1 (102,343,523)8. (Gain)/Loss due to Discount Rate Change 301,372,381
9. Roll-Forward EAAL at 6/30/2021² 5,297,663,231$
1Assumes a 2.66% interest rate2Assumes a 2.18% interest rate
NEW YORK CITY HEALTH BENEFITS PROGRAM
Governmental Accounting Standards Board Statements No. 74 and No. 75 (GASB 74/75)
New York City Health and Hospitals Corporation (HHC)
Roll-Forward of Entry Age Accrued Liabilities to June 30, 2021

37
Total OPEB Plan Fiduciary Net OPEBLiability Net Position Liability
(a) (b) (a) - (b)1. Balances at June 30, 2019 5,559,103,434$ 0$ 5,559,103,434$
2. Changes for the Year:a. Service Cost 264,511,977 0 264,511,977b. Interest 159,281,146 0 159,281,146c. Differences b/t Expected and Actual Experience (450,870,527) 0 (450,870,527)d. Change in Assumptions 99,391,048 0 99,391,048e. Contributions - Employer 0 230,815,371 (230,815,371)f. Contributions - Employee 0 0 0g. Net Investment Income 0 0 0h. Actual Benefit Payments (230,815,371) (230,815,371) 0i. Administrative Expenses 0 0 0j. Other Changes1 (41,077,814) 0 (41,077,814)k. Net Changes (199,579,541)$ 0$ (199,579,541)$
3. Balances at June 30, 2020 5,359,523,893$ 0$ 5,359,523,893$
4. Sensitivity of the Net OPEB Liability to Changes in the Discount Ratea. 1% Decrease 6,222,376,176$ b. 1% Increase 4,674,670,181$
5. Sensitivity of the Net OPEB Liability to Changes in the Healthcare Cost Trend Ratea. 1% Decrease 4,511,328,675$ b. 1% Increase 6,463,067,957$
1Repeal of Cadillac Tax
NEW YORK CITY HEALTH BENEFITS PROGRAM
Governmental Accounting Standards Board Statements No. 74 and No. 75 (GASB 74/75)
New York City Health and Hospitals Corporation (HHC)
Changes in Net OPEB Liability (NOL) by SourceBalances at June 30, 2020

38
Total OPEB Plan Fiduciary Net OPEBLiability Net Position Liability
(a) (b) (a) - (b)1. Balances at June 30, 2020 5,359,523,893$ 0$ 5,359,523,893$
2. Changes for the Year:a. Service Cost 279,634,887 0 279,634,887b. Interest 148,458,160 0 148,458,160c. Differences b/t Expected and Actual Experience (189,271,728) 0 (189,271,728)d. Change in Assumptions (183,865,460) 0 (183,865,460)e. Contributions - Employer 0 116,816,521 (116,816,521)f. Contributions - Employee 0 0 0g. Net Investment Income 0 0 0h. Actual Benefit Payments (116,816,521) (116,816,521) 0i. Administrative Expenses 0 0 0j. Other Changes 0 0 0k. Net Changes (61,860,662)$ 0$ (61,860,662)$
3. Balances at June 30, 2021 5,297,663,231$ 0$ 5,297,663,231$
4. Sensitivity of the Net OPEB Liability to Changes in the Discount Ratea. 1% Decrease 6,023,463,327$ b. 1% Increase 4,699,034,110$
5. Sensitivity of the Net OPEB Liability to Changes in the Healthcare Cost Trend Ratea. 1% Decrease 4,514,347,744$ b. 1% Increase 6,299,679,747$
NEW YORK CITY HEALTH BENEFITS PROGRAM
Governmental Accounting Standards Board Statements No. 74 and No. 75 (GASB 74/75)
New York City Health and Hospitals Corporation (HHC)
Changes in Net OPEB Liability (NOL) by SourceBalances at June 30, 2021

39
2021 2020 2019 2018 2017 20161. Total OPEB Liability
a. Service Cost 279,634,887$ 264,511,977$ 307,104,165$ 279,873,620$ 274,749,014$ 326,174,054$ b. Interest 148,458,160 159,281,146 161,839,949 158,153,822 147,666,641 139,259,723c. Differences b/t Expected and Actual Experience (189,271,728) (450,870,527) 858,810,861 104,933,324 (122,396,196) (43,447,941)d. Changes of Assumptions (183,865,460) 99,391,048 (806,009,047) 110,707,118 (661,093,887) 0e. Benefit Payments (116,816,521) (230,815,371) (171,558,795) (235,395,190) (56,086,853) (95,999,857)f. Other Changes1 0 (41,077,814) 0 0 0 0g. Net Changes in Total OPEB Liability (61,860,662)$ (199,579,541)$ 350,187,133$ 418,272,694$ (417,161,281)$ 325,985,979$
2. Total OPEB Liability - Beginning 5,359,523,893$ 5,559,103,434$ 5,208,916,301$ 4,790,643,607$ 5,207,804,888$ 4,881,818,909$ 3. Total OPEB Liability - Ending 5,297,663,231$ 5,359,523,893$ 5,559,103,434$ 5,208,916,301$ 4,790,643,607$ 5,207,804,888$
4. Plan Fiduciary Net Positiona. Contributions - Employer 116,816,521$ 230,815,371$ 171,558,795 235,395,190 56,086,853 95,999,857b. Contributions - Employee 0 0 0 0 0 0c. Net Investment Income 0 0 0 0 0 0d. Benefit Payments (116,816,521) (230,815,371) (171,558,795) (235,395,190) (56,086,853) (95,999,857)e. Administrative Expenses 0 0 0 0 0 0f. Other Changes 0 0 0 0 0 0g. Net Changes in Plan Fiduciary Net Position 0$ 0$ 0$ 0$ 0$ 0$
5. Plan Fiduciary Net Position - Beginning 0$ 0$ 0$ 0$ 0$ 0$ 6. Plan Fiduciary Net Position - Ending 0$ 0$ 0$ 0$ 0$ 0$
7. Net OPEB Liability 5,297,663,231$ 5,359,523,893$ 5,559,103,434$ 5,208,916,301$ 4,790,643,607$ 5,207,804,888$
8. Plan Fiduciary Net Position as a Percentageof Total OPEB Liability 0.0% 0.0% 0.0% 0.0% 0.0% 0.0%
9. Covered Employee Payroll $2,464,082,189 $2,320,004,778 $2,222,408,772 $2,211,014,210 $2,283,056,125 $2,171,335,699
10. Net OPEB Liability as a Percentageof Covered Employee Payroll 215.0% 231.0% 250.1% 235.6% 209.8% 239.8%
1Repeal of Cadillac Tax
NEW YORK CITY HEALTH BENEFITS PROGRAM
Governmental Accounting Standards Board Statements No. 74 and No. 75 (GASB 74/75)
New York City Health and Hospitals Corporation (HHC)
Schedule of Changes in Net OPEB Liability and Related Ratios

40
Total Future Average ExpectedWorkLife Remaining Service Life
Group # Count @ 6/30/2020 @ 6/30/2020Active 31,158 358,142 11.49Deferred Vested 3,218 0 0Retired 22,972 0 0 Total 57,348 358,142 6.25
NEW YORK CITY HEALTH BENEFITS PROGRAM
Governmental Accounting Standards Board Statements No. 74 and No. 75 (GASB 74/75)
New York City Health and Hospitals Corporation (HHC)
Average Expected Remaining Service Lives @ 6/30/2020

41
Differencesbetween ExpectedRecognition
and Actual PeriodYear Experience (Years) 2016 2017 2018 2019 2020 2021 2022 2023 2024 2025 2026 20272016 1 (43,447,941)$ 6.57 (6,613,081) (6,613,081) (6,613,081) (6,613,081) (6,613,081) (6,613,081) (3,769,455) 0 0 0 0 02017 (122,396,196)$ 6.57 0 (18,629,558) (18,629,558) (18,629,558) (18,629,558) (18,629,558) (18,629,558) (10,618,848) 0 0 0 02018 104,933,324$ 6.35 0 0 16,524,933 16,524,933 16,524,933 16,524,933 16,524,933 16,524,933 5,783,726 0 0 02019 858,810,861$ 6.30 0 0 0 136,319,184 136,319,184 136,319,184 136,319,184 136,319,184 136,319,184 40,895,757 0 02020 (450,870,527)$ 6.18 0 0 0 0 (72,956,396) (72,956,396) (72,956,396) (72,956,396) (72,956,396) (72,956,396) (13,132,151) 02021 (189,271,728)$ 6.25 0 0 0 0 0 (30,283,476) (30,283,476) (30,283,476) (30,283,476) (30,283,476) (30,283,476) (7,570,872)$
Net increase (decrease) in OPEB Expense (6,613,081)$ (25,242,639)$ (8,717,706)$ 127,601,478$ 54,645,082$ 24,361,606$ 27,205,232$ 38,985,397$ 38,863,038$ (62,344,115)$ (43,415,627)$ (7,570,872)$
1Represents the Future Working Lifetime as of 6/30/2016
NEW YORK CITY HEALTH BENEFITS PROGRAM
Governmental Accounting Standards Board Statements No. 74 and No. 75 (GASB 74/75)
New York City Health and Hospitals Corporation (HHC)
Increase (Decrease) in OPEB Expense Arising from the Recognition ofDifferences between Expected and Actual Experience

42
DifferencesDue to Recognition
Changes in PeriodYear Assumptions (Years) 2017 2018 2019 2020 2021 2022 2023 2024 2025 2026 20272017 (661,093,887)$ 6.57 (100,623,118) (100,623,118) (100,623,118) (100,623,118) (100,623,118) (100,623,118) (57,355,179) 0 0 0 02018 110,707,118$ 6.35 0 17,434,192 17,434,192 17,434,192 17,434,192 17,434,192 17,434,192 6,101,966 0 0 02019 (806,009,047)$ 6.30 0 0 (127,937,944) (127,937,944) (127,937,944) (127,937,944) (127,937,944) (127,937,944) (38,381,383) 0 02020 99,391,048$ 6.18 0 0 0 16,082,694 16,082,694 16,082,694 16,082,694 16,082,694 16,082,694 2,894,884 02021 (183,865,460)$ 6.25 0 0 0 0 (29,418,474) (29,418,474) (29,418,474) (29,418,474) (29,418,474) (29,418,474) (7,354,616)
Net increase (decrease) in OPEB Expense (100,623,118)$ (83,188,926)$ (211,126,870)$ (195,044,176)$ (224,462,650)$ (224,462,650)$ (181,194,711)$ (135,171,758)$ (51,717,163)$ (26,523,590)$ (7,354,616)$
NEW YORK CITY HEALTH BENEFITS PROGRAM
Governmental Accounting Standards Board Statements No. 74 and No. 75 (GASB 74/75)
New York City Health and Hospitals Corporation (HHC)
Increase (Decrease) in OPEB Expense Arising from the Recognition ofChanges in Assumptions

43
Differencesbetween Projected
and ActualEarnings on RecognitionOPEB Plan Period
Year Investments (Years) 2018 2019 2020 2021 2022 2023 20242018 0$ 5 0 0 0 0 0 0 02019 0$ 5 0 0 0 0 0 0 02020 0$ 5 0 0 0 0 0 0 02021 0$ 5 0 0 0 0 0 0 0
Net increase (decrease) in OPEB Expense 0$ 0$ 0$ 0$ 0$ 0$ 0$
NEW YORK CITY HEALTH BENEFITS PROGRAM
Governmental Accounting Standards Board Statements No. 74 and No. 75 (GASB 74/75)
New York City Health and Hospitals Corporation (HHC)
Increase (Decrease) in OPEB Expense Arising from the Recognition ofDifferences between Projected and Actual Earnings on OPEB Plan Investments

44
Component Amount
a. Service Cost 264,511,977$ b. Interest on the Total OPEB Liability 159,281,146c. Differences between Expected and Actual Experience 54,645,082d. Changes of Assumptions (195,044,176)e. Employee Contributions 0f. Projected Earnings on OPEB Plan Investments 0g. Differences between Projected and Actual Earnings on Plan Investments 0h. OPEB Plan Administrative Expenses 0i. Other Changes in Fiduciary Net Position 0j. Other Changes in Total OPEB Liability1 (41,077,814)
Total OPEB Expense 242,316,215$
1Repeal of Cadillac Tax
NEW YORK CITY HEALTH BENEFITS PROGRAM
Governmental Accounting Standards Board Statements No. 74 and No. 75 (GASB 74/75)
New York City Health and Hospitals Corporation (HHC)
Components of OPEB Expense for the Fiscal Year Ended June 30, 2020

45
Component Amount
a. Service Cost 279,634,887$ b. Interest on the Total OPEB Liability 148,458,160c. Differences between Expected and Actual Experience 24,361,606d. Changes of Assumptions (224,462,650)e. Employee Contributions 0f. Projected Earnings on OPEB Plan Investments 0g. Differences between Projected and Actual Earnings on Plan Investments 0h. OPEB Plan Administrative Expenses 0i. Other Changes in Fiduciary Net Position 0j. Other Changes in Total OPEB Liability 0
Total OPEB Expense 227,992,003$
NEW YORK CITY HEALTH BENEFITS PROGRAM
Governmental Accounting Standards Board Statements No. 74 and No. 75 (GASB 74/75)
New York City Health and Hospitals Corporation (HHC)
Components of OPEB Expense for the Fiscal Year Ended June 30, 2021

46
Recognized OPEB Expense
Deferred Resources Outflows Inflows Outflows Inflows Outflows Inflows Outflows Inflows Outflows Inflows Outflows Inflows
Differences between Expected and Actual Experience 0$ 36,834,860$ 0$ 103,766,638$ 88,408,391$ 0$ 722,491,677$ 0$ 0$ 377,914,131$ 0$ 158,988,252$
Changes of Assumptions 0 0 0 560,470,769 93,272,926 0 0 678,071,103 83,308,354 0 0 154,446,986
Net Difference between Projected and Actual Earnings on OPEB Plan Investments 0 0 0 0 0 0 0 0 0 0 0 0
Total 0$ 36,834,860$ 0$ 664,237,407$ 181,681,317$ 0$ 722,491,677$ 678,071,103$ 83,308,354$ 377,914,131$ 0$ 313,435,238$
Amounts reported as Deferred Outflows of Resources and Deferred Inflows of Resources related to OPEB will be recognized in OPEB Expense as follows:
Fiscal YearEnded June 30201620172018201920202021202220232024202520262027
NEW YORK CITY HEALTH BENEFITS PROGRAM
Governmental Accounting Standards Board Statements No. 74 and No. 75 (GASB 74/75)
New York City Health and Hospitals Corporation (HHC)
OPEB Expense, Deferred Outflows of Resources, Deferred Inflows of Resources
$346,120,810Fiscal Year Ending June 30, 2017 Fiscal Year Ending June 30, 2018 Fiscal Year Ending June 30, 2019 Fiscal Year Ending June 30, 2021
$227,992,003$385,418,722Fiscal Year Ending June 30, 2016
$296,549,898$458,820,696
($119,252,676)($67,974,027)
$8,381,240$8,381,240$8,381,240
$33,959,125
$33,959,125$33,959,125$33,959,125
($10,237,267)
Fiscal Year Ending June 30, 2020$242,316,215
($56,873,702)($56,873,702)($56,873,702)($56,873,702)
($6,613,081)($6,613,081)($6,613,081)($3,769,455)
($56,873,702)$8,381,240
($59,701,950)($14,925,488)
($6,613,081)($6,613,081)
($119,252,676)($119,252,676)($119,252,676)($119,252,676)
$2,514,374
$33,959,125$11,885,692
$8,381,240$8,381,240
($59,701,950)
($6,613,081)
($59,701,950)($59,701,950)($59,701,950)($59,701,950)
($119,252,676)
($56,873,702)
$33,959,125
47
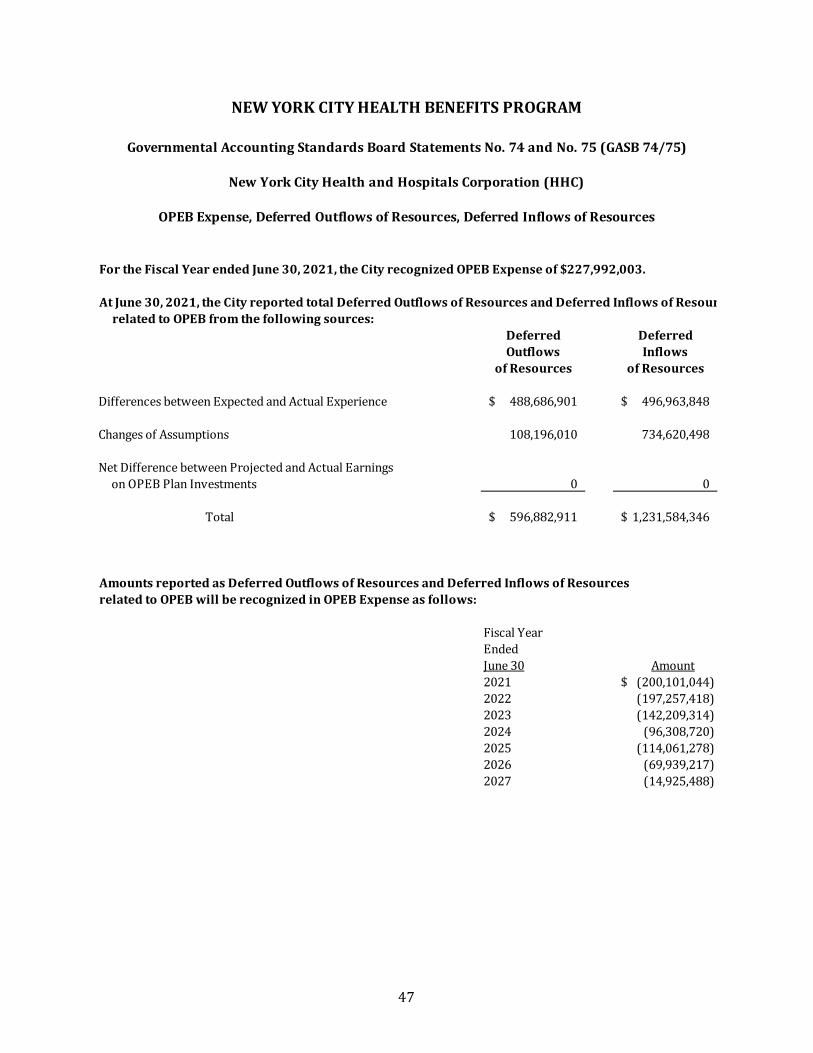
For the Fiscal Year ended June 30, 2021, the City recognized OPEB Expense of $227,992,003.
At June 30, 2021, the City reported total Deferred Outflows of Resources and Deferred Inflows of Resour related to OPEB from the following sources:
Deferred DeferredOutflows Inflows
of Resources of Resources
Differences between Expected and Actual Experience 488,686,901$ 496,963,848$
Changes of Assumptions 108,196,010 734,620,498
Net Difference between Projected and Actual Earnings on OPEB Plan Investments 0 0
Total 596,882,911$ 1,231,584,346$
Amounts reported as Deferred Outflows of Resources and Deferred Inflows of Resources related to OPEB will be recognized in OPEB Expense as follows:
Fiscal YearEnded June 30 Amount2021 (200,101,044)$ 2022 (197,257,418)2023 (142,209,314)2024 (96,308,720)2025 (114,061,278)2026 (69,939,217)2027 (14,925,488)
NEW YORK CITY HEALTH BENEFITS PROGRAM
Governmental Accounting Standards Board Statements No. 74 and No. 75 (GASB 74/75)
New York City Health and Hospitals Corporation (HHC)
OPEB Expense, Deferred Outflows of Resources, Deferred Inflows of Resources

48
New York City Housing Authority (NYCHA)

49
NYCERS TRS BERS TOTAL1. Actives
a. Number 8,893 3 0 8,896b. Salary 627,546,591$ 391,908$ NA 627,938,499$ c. Average Age 48.63 59.33 NA 48.63d. Average Service 14.72 28.00 NA 14.73e. Average Salary 70,566$ 130,636$ NA 70,587$
2. Deferreds (Includes Deferred Retirees, if any)a. Number 1,501 0 0 1,501b. Average Age 54.84 NA NA 54.84
3. Retireesa. Total1
i. Number 9,244 2 24 9,270ii. Average Age 71.91 76.99 69.10 71.90
b. By Benefit Participant / Spousei. Pre-Medicare2 1,898 / 1,280
ii. Medicare Eligible2 6,666 / 2,183iii. Welfare Fund2 7,984 / NEiv. Medicare Part B3 9,270 / 3,871
1 Retirees eligible for at least one benefit from NYCHA.2 Retirees currently eligible for benefit from NYCHA.3 Retirees eligible for benefit from NYCHA currently or in the future.
NE Not eligible.
NEW YORK CITY HEALTH BENEFITS PROGRAM
Governmental Accounting Standards Board Statements No. 74 and No. 75 (GASB 74/75)
New York City Housing Authority (NYCHA)
Summary of June 30, 2020 OPEB Data

50
1. Total Present Value of Projected BenefitsPre-Medicare Medicare Welfare Funds Part B Premium Cadillac Tax Total
a. Active 1 810,462,843$ 782,949,847$ 446,621,373$ 639,281,047$ 52,212,097$ 2,731,527,207$
b. Deferred 2 245,139,188 127,058,392 76,142,584 101,307,515 5,236,960 554,884,639
c. Retired 287,341,375 442,371,167 283,009,732 347,529,240 1,328,512 1,361,580,026
d. TOTAL 1,342,943,406$ 1,352,379,406$ 805,773,689$ 1,088,117,802$ 58,777,569$ 4,647,991,872$
2. Entry Age Accrued Liability
a. Active 1 266,146,939$ 326,497,172$ 171,894,126$ 261,590,428$ 12,679,831$ 1,038,808,496$
b. Deferred 2 245,139,188 127,058,392 76,142,584 101,307,515 5,236,960 554,884,639
c. Retired 287,341,375 442,371,167 283,009,732 347,529,240 1,328,512 1,361,580,026
d. TOTAL 798,627,502$ 895,926,731$ 531,046,442$ 710,427,183$ 19,245,303$ 2,955,273,161$
3. Market Value of Assets 0$
4. Unfunded Accrued Liability (UAL) 2,955,273,161$
5. Entry Age Normal Cost 113,427,665$
6. Salary of Active Participants 608,055,629$
7. Normal Cost Percentage 18.654%[5. / 6.]
1 Includes Total Present Value of Projected Benefits for AOP, if any. 2 Includes Deferred Retirees, if any.
NEW YORK CITY HEALTH BENEFITS PROGRAM
Governmental Accounting Standards Board Statements No. 74 and No. 75 (GASB 74/75)
New York City Housing Authority (NYCHA)
June 30, 2019 Results of the Actuarial ValuationBased on a 2.79% Discount Rate

51
1. Total Present Value of Projected BenefitsPre-Medicare Medicare Welfare Funds Part B Premium Cadillac Tax Total
a. Active 1 913,410,702$ 841,904,152$ 393,642,818$ 721,334,300$ 0$ 2,870,291,972$
b. Deferred 2 250,109,459 129,328,748 74,719,876 107,858,687 0 562,016,770
c. Retired 294,690,015 468,834,346 286,949,480 384,253,278 0 1,434,727,119
d. TOTAL 1,458,210,176$ 1,440,067,246$ 755,312,174$ 1,213,446,265$ 0$ 4,867,035,861$
2. Entry Age Accrued Liability
a. Active 1 287,596,726$ 338,622,191$ 157,205,101$ 283,732,669$ 0$ 1,067,156,687$
b. Deferred 2 250,109,459 129,328,748 74,719,876 107,858,687 0 562,016,770
c. Retired 294,690,015 468,834,346 286,949,480 384,253,278 0 1,434,727,119
d. TOTAL 832,396,200$ 936,785,285$ 518,874,457$ 775,844,634$ 0$ 3,063,900,576$
3. Market Value of Assets 0$
4. Unfunded Accrued Liability (UAL) 3,063,900,576$
5. Entry Age Normal Cost 118,663,028$
6. Salary of Active Participants 627,938,499$
7. Normal Cost Percentage 18.897%[5. / 6.]
1 Includes Total Present Value of Projected Benefits for AOP, if any. 2 Includes Deferred Retirees, if any.
NEW YORK CITY HEALTH BENEFITS PROGRAM
Governmental Accounting Standards Board Statements No. 74 and No. 75 (GASB 74/75)
New York City Housing Authority (NYCHA)
June 30, 2020 Results of the Actuarial ValuationBased on a 2.66% Discount Rate

52
New York City School Construction Authority (SCA)

53
NYCERS BERS TOTAL1. Actives
a. Number 68 746 814b. Salary $9,280,610 81,259,753 90,540,363 c. Average Age 53.49 50.67 50.91 d. Average Service 20.59 10.64 11.47 e. Average Salary $136,480 $108,927 $111,229
2. Deferreds (Includes Deferred Retirees, if any)a. Number 7 24 31b. Average Age 56.29 55.54 55.71
3. Retireesa. Total1
i. Number 59 299 358ii. Average Age 72.22 73.30 73.12
b. By Benefit Participant / Spousei. Pre-Medicare2 NR / NR
ii. Medicare Eligible2 NR / NRiii. Welfare Fund2 358 / NEiv. Medicare Part B3 NR / NR
1 Retirees eligible for at least one benefit from SCA.2 Retirees currently eligible for benefit from SCA.3 Retirees eligible for benefit from SCA currently or in the future.
NR Not responsible (benefit not the responsibility of SCA).NE Not eligible
NEW YORK CITY HEALTH BENEFITS PROGRAM
Governmental Accounting Standards Board Statements No. 74 and No. 75 (GASB 74/75)
New York City School Construction Authority (SCA)
Summary of June 30, 2020 OPEB Data

54
1. Total Present Value of Projected BenefitsPre-Medicare Medicare Welfare Funds Part B Premium Cadillac Tax Total
a. Active 1 0$ 0$ 29,776,218$ 0$ 0$ 29,776,218$
b. Deferred 2 0 0 1,739,292 0 0 1,739,292
c. Retired 0 0 10,735,593 0 0 10,735,593
d. TOTAL 0$ 0$ 42,251,103$ 0$ 0$ 42,251,103$
2. Entry Age Accrued Liability
a. Active 1 0$ 0$ 11,889,578$ 0$ 0$ 11,889,578$
b. Deferred 2 0 0 1,739,292 0 0 1,739,292
c. Retired 0 0 10,735,593 0 0 10,735,593
d. TOTAL 0$ 0$ 24,364,463$ 0$ 0$ 24,364,463$
3. Market Value of Assets 0$
4. Unfunded Accrued Liability (UAL) 24,364,463$
5. Entry Age Normal Cost 1,357,943$
6. Salary of Active Participants 85,313,119$
7. Normal Cost Percentage 1.592%[5. / 6.]
1 Includes Total Present Value of Projected Benefits for AOP, if any. 2 Includes Deferred Retirees, if any.
NEW YORK CITY HEALTH BENEFITS PROGRAM
Governmental Accounting Standards Board Statements No. 74 and No. 75 (GASB 74/75)
New York City School Construction Authority (SCA)
June 30, 2019 Results of the Actuarial ValuationBased on a 2.79% Discount Rate

55
1. Total Present Value of Projected BenefitsPre-Medicare Medicare Welfare Funds Part B Premium Cadillac Tax Total
a. Active 1 0$ 0$ 32,614,266$ 0$ 0$ 32,614,266$
b. Deferred 2 0 0 1,577,961 0 0 1,577,961
c. Retired 0 0 11,945,785 0 0 11,945,785
d. TOTAL 0$ 0$ 46,138,012$ 0$ 0$ 46,138,012$
2. Entry Age Accrued Liability
a. Active 1 0$ 0$ 12,286,206$ 0$ 0$ 12,286,206$
b. Deferred 2 0 0 1,577,961 0 0 1,577,961
c. Retired 0 0 11,945,785 0 0 11,945,785
d. TOTAL 0$ 0$ 25,809,952$ 0$ 0$ 25,809,952$
3. Market Value of Assets 0$
4. Unfunded Accrued Liability (UAL) 25,809,952$
5. Entry Age Normal Cost 1,480,875$
6. Salary of Active Participants 90,540,363$
7. Normal Cost Percentage 1.636%[5. / 6.]
1 Includes Total Present Value of Projected Benefits for AOP, if any. 2 Includes Deferred Retirees, if any.
NEW YORK CITY HEALTH BENEFITS PROGRAM
Governmental Accounting Standards Board Statements No. 74 and No. 75 (GASB 74/75)
New York City School Construction Authority (SCA)
June 30, 2020 Results of the Actuarial ValuationBased on a 2.66% Discount Rate

56
Total1. Plan Net Position @ 6/30/2019 0$
2. Changes for the year:a. ER Contributions 749,119b. EE Contributions 0c. Net Investment Income 0d. Benefit Payments (749,119)e. Administrative Expenses 0f. Other 0g. Net Changes 0$
3. Plan Net Position @ 6/30/2020 0$
4. Changes for the year:a. ER Contributions 787,691b. EE Contributions 0c. Net Investment Income 0d. Benefit Payments (787,691)e. Administrative Expenses 0f. Other 0g. Net Changes 0$
5. Plan Net Position @ 6/30/2021 0$
Market Values of Assets
NEW YORK CITY HEALTH BENEFITS PROGRAM
Governmental Accounting Standards Board Statements No. 74 and No. 75 (GASB 74/75)
New York City School Construction Authority (SCA)

57
Fixed Total
1. Market Value 6/30/2019 0$
2. Market Value 6/30/2020 0
3. Net Investment Income 0
4. Cash Flow 0(2. - 1. - 3.)
5. Projected Earnings 0(4% * 1. + 1.980% * 4.)
6. (Gain) / Loss 0(5. - 3.)
7. Recognition Period 5 Years
8. Amount Recognized in OPEB Expense 0(6. / 7.)
9. Deferred (Inflow) / Outflow of Resources 0$ (6. - 8.)
NEW YORK CITY HEALTH BENEFITS PROGRAM
Governmental Accounting Standards Board Statements No. 74 and No. 75 (GASB 74/75)
Development of Asset (Gain) / LossJune 30, 2020
New York City School Construction Authority (SCA)

58
Total
1. Market Value 6/30/2020 0$
2. Market Value 6/30/2021 0
3. Net Investment Income 0
4. Cash Flow 0(2. - 1. - 3.)
5. Projected Earnings 0(4% * 1. + 1.980% * 4.)
6. (Gain) / Loss 0(5. - 3.)
7. Recognition Period 5 Years
8. Amount Recognized in OPEB Expense 0(6. / 7.)
9. Deferred (Inflow) / Outflow of Resources 0$ (6. - 8.)
NEW YORK CITY HEALTH BENEFITS PROGRAM
Governmental Accounting Standards Board Statements No. 74 and No. 75 (GASB 74/75)
New York City School Construction Authority (SCA)
Development of Asset (Gain) / LossJune 30, 2021

59
Total
1. Disclosed Entry Age Accrued Liability (EAAL) at 6/30/2019¹ 24,920,610$ 2. Entry Age Normal Cost at 6/30/2019¹ 1,357,9433. Actual Benefit Payments-FY20 (749,119)4. Interest¹ 722,7935. (Gain)/Loss due to Experience Change¹ (571,663)6. (Gain)/Loss due to Discount Rate Change 489,564
7. Roll-Forward EAAL at 6/30/2020² 26,170,128$
1Assumes a 2.79% interest rate2Assumes a 2.66% interest rate
NEW YORK CITY HEALTH BENEFITS PROGRAM
Governmental Accounting Standards Board Statements No. 74 and No. 75 (GASB 74/75)
New York City School Construction Authority (SCA)
Roll-Forward of Entry Age Accrued Liabilities to June 30, 2020

60
Total
1. Disclosed Entry Age Accrued Liability (EAAL) at 6/30/2020¹ 26,170,128$ 2. Entry Age Normal Cost at 6/30/2020¹ 1,480,8753. Actual Benefit Payments-FY21 (787,691)4. Interest¹ 725,1095. (Gain)/Loss due to Experience Change¹ (369,757)5. (Gain)/Loss due to AOP Change1 (740,978) 6. (Gain)/Loss due to Mortality Improvement Change1 (666,639)7. (Gain)/Loss due to Discount Rate Change 1,753,341
8. Roll-Forward EAAL at 6/30/2021² 27,564,388$
1Assumes a 2.66% interest rate2Assumes a 2.18% interest rate
NEW YORK CITY HEALTH BENEFITS PROGRAM
Governmental Accounting Standards Board Statements No. 74 and No. 75 (GASB 74/75)
New York City School Construction Authority (SCA)
Roll-Forward of Entry Age Accrued Liabilities to June 30, 2021

61
Total OPEB Plan Fiduciary Net OPEBLiability Net Position Liability
(a) (b) (a) - (b)1. Balances at June 30, 2019 24,920,610$ 0$ 24,920,610$
2. Changes for the Year:a. Service Cost 1,357,943 0 1,357,943b. Interest 722,793 0 722,793c. Differences b/t Expected and Actual Experience (571,663) 0 (571,663)d. Changes in Assumptions 489,564 0 489,564e. Contributions - Employer 0 749,119 (749,119)f. Contributions - Employee 0 0 0g. Net Investment Income 0 0 0h. Actual Benefit Payments (749,119) (749,119) 0i. Administrative Expenses 0 0 0j. Other Changes 0 0 0k. Net Changes 1,249,518$ 0$ 1,249,518$
3. Balances at June 30, 2020 26,170,128$ 0$ 26,170,128$
4. Sensitivity of the Net OPEB Liability to Changes in the Discount Ratea. 1% Decrease 30,400,021$ b. 1% Increase 22,709,613$
5. Sensitivity of the Net OPEB Liability to Changes in the Healthcare Cost Trend Ratea. 1% Decrease 21,967,096$ b. 1% Increase 31,651,848$
NEW YORK CITY HEALTH BENEFITS PROGRAM
Governmental Accounting Standards Board Statements No. 74 and No. 75 (GASB 74/75)
Changes in Net OPEB Liability (NOL) by SourceBalances at June 30, 2020
New York City School Construction Authority (SCA)

62
Total OPEB Plan Fiduciary Net OPEBLiability Net Position Liability
(a) (b) (a) - (b)1. Balances at June 30, 2020 26,170,128$ 0$ 26,170,128$
2. Changes for the Year:a. Service Cost 1,480,875 0 1,480,875b. Interest 725,109 0 725,109c. Differences b/t Expected and Actual Experience (369,757) 0 (369,757)d. Changes in Assumptions 345,724 0 345,724e. Contributions - Employer 0 787,691 (787,691)f. Contributions - Employee 0 0 0g. Net Investment Income 0 0 0h. Actual Benefit Payments (787,691) (787,691) 0i. Administrative Expenses 0 0 0j. Other Changes 0 0 0k. Net Changes 1,394,260$ 0$ 1,394,260$
3. Balances at June 30, 2021 27,564,388$ 0$ 27,564,388$
4. Sensitivity of the Net OPEB Liability to Changes in the Discount Ratea. 1% Decrease 31,735,287$ b. 1% Increase 24,072,767$
5. Sensitivity of the Net OPEB Liability to Changes in the Healthcare Cost Trend Ratea. 1% Decrease 23,194,635$ b. 1% Increase 33,235,998$
NEW YORK CITY HEALTH BENEFITS PROGRAM
Governmental Accounting Standards Board Statements No. 74 and No. 75 (GASB 74/75)
New York City School Construction Authority (SCA)
Changes in Net OPEB Liability (NOL) by SourceBalances at June 30, 2021

63
2021 2020 2019 2018 2017 20161. Total OPEB Liability
a. Service Cost 1,480,875$ 1,357,943$ 1,363,069$ 1,226,189$ 1,050,170$ 1,281,787$ b. Interest 725,109 722,793 741,663 715,888 615,479 611,500c. Differences b/t Expected and Actual Experience (369,757) (571,663) 2,835,826 1,943,051 (761,806) (32,395)d. Changes of Assumptions 345,724 489,564 (3,223,925) 508,111 (3,259,111) 0e. Benefit Payments (787,691) (749,119) (637,257) (567,069) (549,250) (477,190)f. Other Changes 0 0 0 0 0 0g. Net Changes in Total OPEB Liability 1,394,260$ 1,249,518$ 1,079,376$ 3,826,170$ (2,904,518)$ 1,383,702$
2. Total OPEB Liability - Beginning 26,170,128$ 24,920,610$ 23,841,234$ 20,015,064$ 22,919,582$ 21,535,880$ 3. Total OPEB Liability - Ending 27,564,388$ 26,170,128$ 24,920,610$ 23,841,234$ 20,015,064$ 22,919,582$
4. Plan Fiduciary Net Positiona. Contributions - Employer 787,691$ 749,119$ 637,257$ 567,069$ 549,250$ 477,190$ b. Contributions - Employee 0 0 0 0 0 0c. Net Investment Income 0 0 0 0 0 0d. Benefit Payments (787,691) (749,119) (637,257) (567,069) (549,250) (477,190)e. Administrative Expenses 0 0 0 0 0 0f. Other Changes 0 0 0 0 0 0g. Net Changes in Plan Fiduciary Net Position 0$ 0$ 0$ 0$ 0$ 0$
5. Plan Fiduciary Net Position - Beginning 0$ 0$ 0$ 0$ 0$ 0$ 6. Plan Fiduciary Net Position - Ending 0$ 0$ 0$ 0$ 0$ 0$
7. Net OPEB Liability 27,564,388$ 26,170,128$ 24,920,610$ 23,841,234$ 20,015,064$ 22,919,582$
8. Plan Fiduciary Net Position as a Percentageof Total OPEB Liability 0.0% 0.0% 0.0% 0.0% 0.0% 0.0%
9. Covered Employee Payroll 90,540,363$ 85,313,119$ 80,058,947$ 73,176,662$ 68,026,651$ 60,765,975$
10. Net OPEB Liability as a Percentageof Covered Employee Payroll 30.4% 30.7% 31.1% 32.6% 29.4% 37.7%
NEW YORK CITY HEALTH BENEFITS PROGRAM
Governmental Accounting Standards Board Statements No. 74 and No. 75 (GASB 74/75)
New York City School Construction Authority (SCA)
Schedule of Changes in Net OPEB Liability and Related Ratios
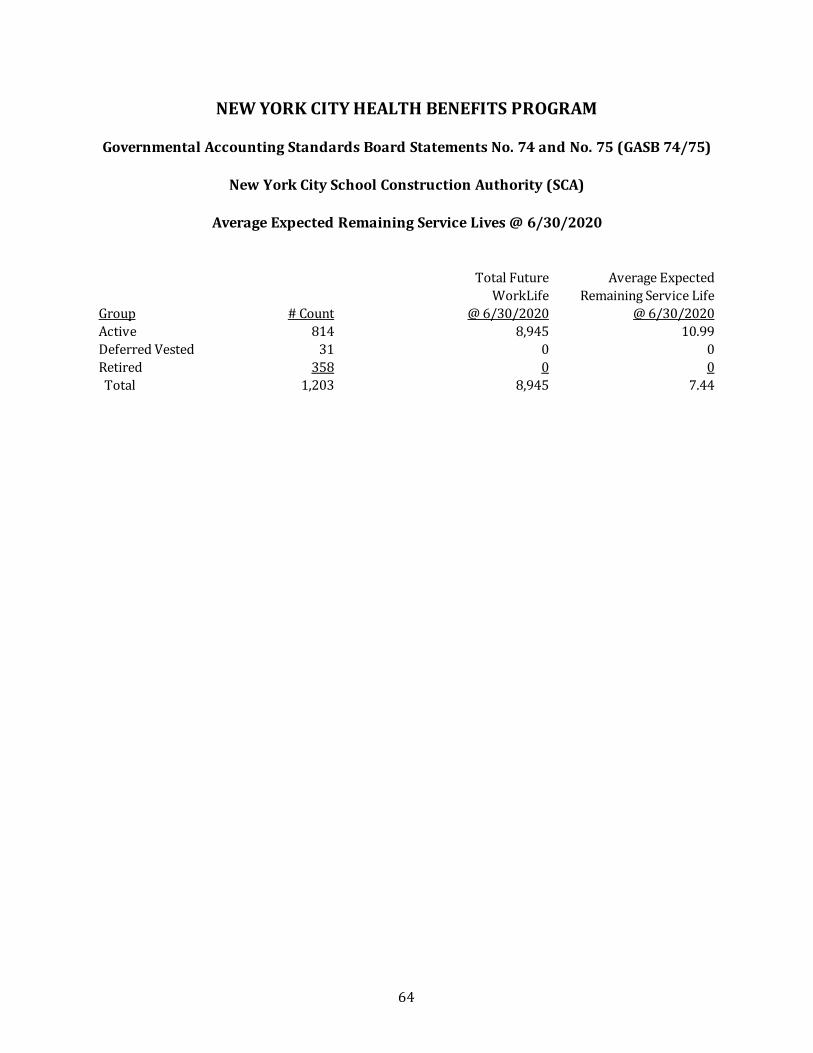
64
Total Future Average ExpectedWorkLife Remaining Service Life
Group # Count @ 6/30/2020 @ 6/30/2020Active 814 8,945 10.99Deferred Vested 31 0 0Retired 358 0 0 Total 1,203 8,945 7.44
NEW YORK CITY HEALTH BENEFITS PROGRAM
Governmental Accounting Standards Board Statements No. 74 and No. 75 (GASB 74/75)
New York City School Construction Authority (SCA)
Average Expected Remaining Service Lives @ 6/30/2020

65
Differencesbetween Expected Recognition
and Actual PeriodYear Experience (Years) 2016 2017 2018 2019 2020 2021 2022 2023 2024 2025 2026 2027 20282016 1 (32,395)$ 6.41 (5,054) (5,054) (5,054) (5,054) (5,054) (5,054) (2,071) 0 0 0 0 0 02017 (761,806)$ 6.41 0 (118,846) (118,846) (118,846) (118,846) (118,846) (118,846) (48,730) 0 0 0 0 02018 1,943,051$ 6.44 301,716 301,716 301,716 301,716 301,716 301,716 132,755 0 0 0 02019 2,835,826$ 7.45 380,648 380,648 380,648 380,648 380,648 380,648 380,648 171,290 0 02020 (571,663)$ 7.27 (78,633) (78,633) (78,633) (78,633) (78,633) (78,633) (78,633) (21,232) 02021 (369,757)$ 7.44 (49,699) (49,699) (49,699) (49,699) (49,699) (49,699) (49,699) (21,864)
Net increase (decrease) in OPEB Expense (5,054)$ (123,900)$ 177,816$ 558,464$ 479,831$ 430,132$ 433,115$ 505,302$ 385,071$ 252,316$ 42,958$ (70,931)$ (21,864)$
1Represents the Future Working Lifetime as of 6/30/2016
NEW YORK CITY HEALTH BENEFITS PROGRAM
Governmental Accounting Standards Board Statements No. 74 and No. 75 (GASB 74/75)
New York City School Construction Authority (SCA)
Increase (Decrease) in OPEB Expense Arising from the Recognition ofDifferences between Expected and Actual Experience
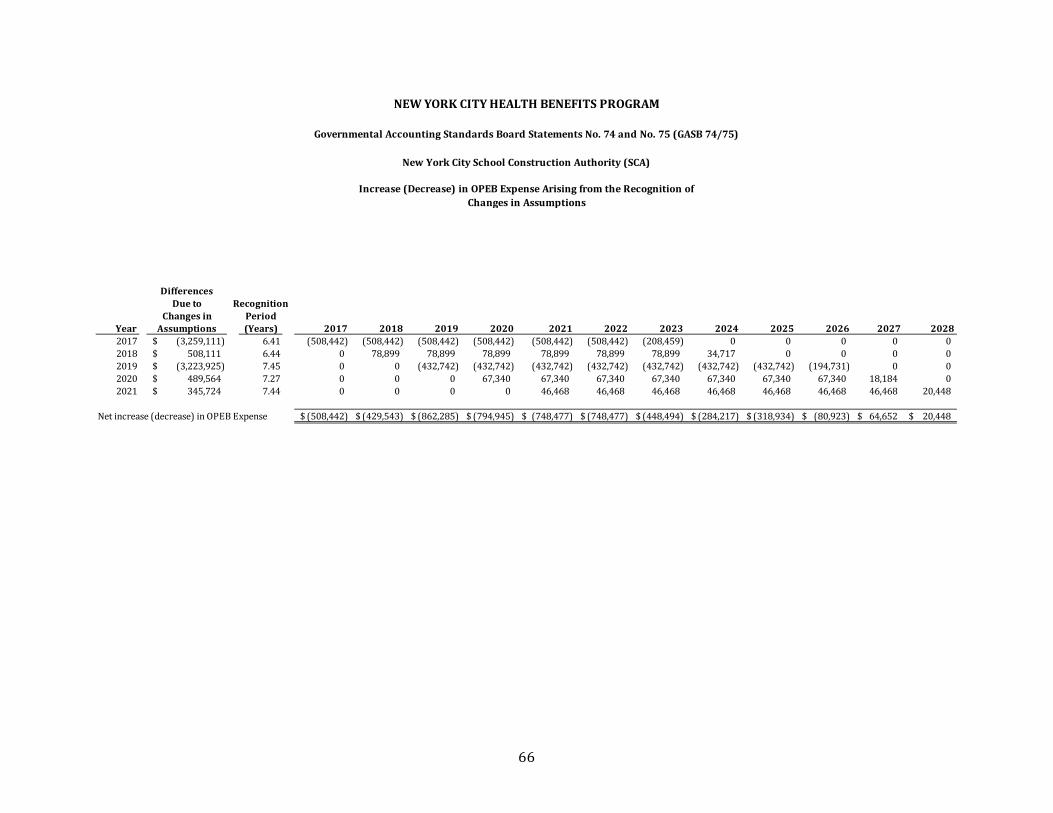
66
DifferencesDue to Recognition
Changes in PeriodYear Assumptions (Years) 2017 2018 2019 2020 2021 2022 2023 2024 2025 2026 2027 20282017 (3,259,111)$ 6.41 (508,442) (508,442) (508,442) (508,442) (508,442) (508,442) (208,459) 0 0 0 0 02018 508,111$ 6.44 0 78,899 78,899 78,899 78,899 78,899 78,899 34,717 0 0 0 02019 (3,223,925)$ 7.45 0 0 (432,742) (432,742) (432,742) (432,742) (432,742) (432,742) (432,742) (194,731) 0 02020 489,564$ 7.27 0 0 0 67,340 67,340 67,340 67,340 67,340 67,340 67,340 18,184 02021 345,724$ 7.44 0 0 0 0 46,468 46,468 46,468 46,468 46,468 46,468 46,468 20,448
Net increase (decrease) in OPEB Expense (508,442)$ (429,543)$ (862,285)$ (794,945)$ (748,477)$ (748,477)$ (448,494)$ (284,217)$ (318,934)$ (80,923)$ 64,652$ 20,448$
NEW YORK CITY HEALTH BENEFITS PROGRAM
Governmental Accounting Standards Board Statements No. 74 and No. 75 (GASB 74/75)
New York City School Construction Authority (SCA)
Increase (Decrease) in OPEB Expense Arising from the Recognition ofChanges in Assumptions

67
Differencesbetween Projected
and ActualEarnings on RecognitionOPEB Plan Period
Year Investments (Years) 2018 2019 2020 2021 2022 2023 20242018 0$ 5 0 0 0 0 0 0 02019 0$ 5 0 0 0 0 0 0 02020 0$ 5 0 0 0 0 0 0 02021 0$ 5 0 0 0 0 0 0 0
Net increase (decrease) in OPEB Expense 0$ 0$ 0$ 0$ 0$ 0$ 0$
NEW YORK CITY HEALTH BENEFITS PROGRAM
Governmental Accounting Standards Board Statements No. 74 and No. 75 (GASB 74/75)
New York City School Construction Authority (SCA)
Increase (Decrease) in OPEB Expense Arising from the Recognition ofDifferences between Projected and Actual Earnings on OPEB Plan Investments

68
Component Amount
a. Service Cost 1,357,943$ b. Interest on the Total OPEB Liability 722,793c. Differences between Expected and Actual Experience 479,831d. Changes of Assumptions (794,945)e. Employee Contributions 0f. Projected Earnings on OPEB Plan Investments 0g. Differences between Projected and Actual Earnings on Plan Investments 0h. OPEB Plan Administrative Expenses 0i. Other Changes in Fiduciary Net Position 0
Total OPEB Expense 1,765,622$
Governmental Accounting Standards Board Statements No. 74 and No. 75 (GASB 74/75)
New York City School Construction Authority (SCA)
NEW YORK CITY HEALTH BENEFITS PROGRAM
Components of OPEB Expense for the Fiscal Year Ended June 30, 2020

69
Component Amount
a. Service Cost 1,480,875$ b. Interest on the Total OPEB Liability 725,109c. Differences between Expected and Actual Experience 430,132d. Changes of Assumptions (748,477)e. Employee Contributions 0f. Projected Earnings on OPEB Plan Investments 0g. Differences between Projected and Actual Earnings on Plan Investments 0h. OPEB Plan Administrative Expenses 0i. Other Changes in Fiduciary Net Position 0
Total OPEB Expense 1,887,639$
NEW YORK CITY HEALTH BENEFITS PROGRAM
Governmental Accounting Standards Board Statements No. 74 and No. 75 (GASB 74/75)
New York City School Construction Authority (SCA)
Components of OPEB Expense for the Fiscal Year Ended June 30, 2021

70
Recognized OPEB Expense
Deferred Resources Outflows Inflows Outflows Inflows Outflows Inflows Outflows Inflows Outflows Inflows Outflows Inflows
Differences between Expected and Actual Experience 0$ 27,341$ 0$ 642,960$ 1,641,335$ 0$ 2,455,178$ 0$ 0$ 493,030$ 0$ 320,058$
Changes of Assumptions 0 0 0 2,750,669 429,212 0 0 2,791,183 422,224 0 299,256 0
Net Difference between Projected and Actual Earnings on OPEB Plan Investments 0 0 0 0 0 0 0 0 0 0 0 0
Total 0$ 27,341$ 0$ 3,393,629$ 2,070,547$ 0$ 2,455,178$ 2,791,183$ 422,224$ 493,030$ 299,256$ 320,058$
Amounts reported as Deferred Outflows of Resources and Deferred Inflows of Resources related to OPEB will be recognized in OPEB Expense as follows:
Fiscal YearEnded June 302016201720182019202020212022202320242025202620272028
NEW YORK CITY HEALTH BENEFITS PROGRAM
Governmental Accounting Standards Board Statements No. 74 and No. 75 (GASB 74/75)
New York City School Construction Authority (SCA)
OPEB Expense, Deferred Outflows of Resources, Deferred Inflows of Resources
($1,416)
($3,231)($3,231)($3,231)($3,231)($3,231)
($3,231)($2,071)
$1,888,233Fiscal Year Ending June 30, 2016 Fiscal Year Ending June 30, 2017 Fiscal Year Ending June 30, 2018 Fiscal Year Ending June 30, 2021
$1,887,639
($3,231)
($5,054)
$380,615
Fiscal Year Ending June 30, 2019$1,033,307
($627,288)($627,288)($627,288)
$380,615$380,615$380,615$380,615$380,615
($257,189)
($5,054)($5,054)($5,054)
($52,094)($23,441)
$167,472
($52,094)($52,094)($52,094)
($627,288)($627,288)($627,288)
($5,054)($5,054)
$1,690,350 $1,800,911
($52,094)($52,094)($52,094)
Fiscal Year Ending June 30, 2020$1,765,622
($11,293)($11,293)($11,293)($11,293)($11,293)($11,293)($11,293)($3,048)

71
For the Fiscal Year ended June 30, 2021, the City recognized OPEB Expense of $1,887,639.
At June 30, 2021, the City reported total Deferred Outflows of Resources and Deferred Inflows of Resources related to OPEB from the following sources:
Deferred DeferredOutflows Inflows
of Resources of Resources
Differences between Expected and Actual Experience 2,430,069$ 904,102$
Changes of Assumptions 846,655 2,642,600
Net Difference between Projected and Actual Earnings on OPEB Plan Investments 0 0
Total 3,276,724$ 3,546,702$
Amounts reported as Deferred Outflows of Resources and Deferred Inflows of Resources related to OPEB will be recognized in OPEB Expense as follows:
Fiscal YearEnded June 30 Amount2021 (318,345)$ 2022 (315,362)2023 56,8082024 100,8542025 (66,618)2026 (37,965)2027 (6,279)2028 (1,416)
NEW YORK CITY HEALTH BENEFITS PROGRAM
Governmental Accounting Standards Board Statements No. 74 and No. 75 (GASB 74/75)
New York City School Construction Authority (SCA)
OPEB Expense, Deferred Outflows of Resources, Deferred Inflows of Resources

72
New York City Municipal Water Finance Authority (WFA)

73
NYCERS BERS TOTAL1. Actives
a. Number 11 0 11b. Salary 1,209,068$ NA 1,209,068$ c. Average Age 44.45 NA 44.45d. Average Service 14.09 NA 14.09e. Average Salary 109,915$ NA 109,915$
2. Deferreds (Includes Deferred Retirees, if any)a. Number 1 0 1b. Average Age 54.00 NA 54.00
3. Retireesa. Total1
i. Number 4 1 5ii. Average Age 72.58 76.81 73.43
b. By Benefit Participant / Spousei. Pre-Medicare2 0 / 0
ii. Medicare Eligible2 5 / 1iii. Welfare Fund2 5 / NEiv. Medicare Part B3 NR / NR
1 Retirees eligible for at least one benefit from WFA.2 Retirees currently eligible for benefit from WFA.3 Retirees eligible for benefit from WFA currently or in the future.
NR Not responsible (benefit not the responsibility of WFA).NE Not eligible.
NEW YORK CITY HEALTH BENEFITS PROGRAM
Governmental Accounting Standards Board Statements No. 74 and No. 75 (GASB 74/75)
New York City Municipal Water Finance Authority (WFA)
Summary of June 30, 2020 OPEB Data

74
1. Total Present Value of Projected BenefitsPre-Medicare Medicare Welfare Funds Part B Premium Cadillac Tax Total
a. Active 1 1,137,363$ 962,583$ 495,881$ 0$ 48,956$ 2,644,783$
b. Deferred 2 256,710 85,475 50,934 0 3,786 396,905
c. Retired 0 192,815 172,181 0 238 365,234
d. TOTAL 1,394,073$ 1,240,873$ 718,996$ 0$ 52,980$ 3,406,922$
2. Entry Age Accrued Liability
a. Active 1 418,112$ 395,634$ 198,029$ 0$ 11,886$ 1,023,661$
b. Deferred 2 256,710 85,475 50,934 0 3,786 396,905
c. Retired 0 192,815 172,181 0 238 365,234
d. TOTAL 674,822$ 673,924$ 421,144$ 0$ 15,910$ 1,785,800$
3. Market Value of Assets 0$
4. Unfunded Accrued Liability (UAL) 1,785,800$
5. Entry Age Normal Cost 96,812$
6. Salary of Active Participants 1,187,306$
7. Normal Cost Percentage 8.154%[5. / 6.]
1 Includes Total Present Value of Projected Benefits for AOP, if any. 2 Includes Deferred Retirees, if any.
NEW YORK CITY HEALTH BENEFITS PROGRAM
Based on a 2.79% Discount Rate
Governmental Accounting Standards Board Statements No. 74 and No. 75 (GASB 74/75)
New York City Municipal Water Finance Authority (WFA)
June 30, 2019 Results of the Actuarial Valuation

75
1. Total Present Value of Projected BenefitsPre-Medicare Medicare Welfare Funds Part B Premium Cadillac Tax Total
a. Active 1 1,284,508$ 1,167,947$ 561,817$ 0$ 0$ 3,014,272$
b. Deferred 2 272,554 89,925 52,132 0 0 414,611
c. Retired 0 193,293 166,566 0 0 359,859
d. TOTAL 1,557,062$ 1,451,165$ 780,515$ 0$ 0$ 3,788,742$
2. Entry Age Accrued Liability
a. Active 1 389,438$ 440,846$ 212,904$ 0$ 0$ 1,043,188$
b. Deferred 2 272,554 89,925 52,132 0 0 414,611
c. Retired 0 193,293 166,566 0 0 359,859
d. TOTAL 661,992$ 724,064$ 431,602$ 0$ 0$ 1,817,658$
3. Market Value of Assets 0$
4. Unfunded Accrued Liability (UAL) 1,817,658$
5. Entry Age Normal Cost 111,880$
6. Salary of Active Participants 1,209,068$
7. Normal Cost Percentage 9.253%[5. / 6.]
1 Includes Total Present Value of Projected Benefits for AOP, if any. 2 Includes Deferred Retirees, if any.
NEW YORK CITY HEALTH BENEFITS PROGRAM
Governmental Accounting Standards Board Statements No. 74 and No. 75 (GASB 74/75)
New York City Municipal Water Finance Authority (WFA)
June 30, 2020 Results of the Actuarial ValuationBased on a 2.66% Discount Rate

76
Total1. Plan Net Position @ 6/30/2019 0$
2. Changes for the year:a. ER Contributions 20,517b. EE Contributions 0c. Net Investment Income 0d. Benefit Payments (20,517)e. Administrative Expenses 0f. Other 0g. Net Changes 0$
3. Plan Net Position @ 6/30/2020 0$
4. Changes for the year:a. ER Contributions 18,699b. EE Contributions 0c. Net Investment Income 0d. Benefit Payments (18,699)e. Administrative Expenses 0f. Other 0g. Net Changes 0$
5. Plan Net Position @ 6/30/2021 0$
Market Values of Assets
NEW YORK CITY HEALTH BENEFITS PROGRAM
Governmental Accounting Standards Board Statements No. 74 and No. 75 (GASB 74/75)
New York City Municipal Water Finance Authority (WFA)

77
Total
1. Market Value 6/30/2019 0$
2. Market Value 6/30/2020 0
3. Net Investment Income 0
4. Cash Flow 0(2. - 1. - 3.)
5. Projected Earnings 0(4% * 1. + 1.980% * 4.)
6. (Gain) / Loss 0(5. - 3.)
7. Recognition Period 5 Years
8. Amount Recognized in OPEB Expense 0(6. / 7.)
9. Deferred (Inflow) / Outflow of Resources 0$ (6. - 8.)
NEW YORK CITY HEALTH BENEFITS PROGRAM
Governmental Accounting Standards Board Statements No. 74 and No. 75 (GASB 74/75)
Development of Asset (Gain) / LossJune 30, 2020
New York City Municipal Water Finance Authority (WFA)

78
Total
1. Market Value 6/30/2020 0$
2. Market Value 6/30/2021 0
3. Net Investment Income 0
4. Cash Flow 0(2. - 1. - 3.)
5. Projected Earnings 0(4% * 1. + 1.980% * 4.)
6. (Gain) / Loss 0(5. - 3.)
7. Recognition Period 5 Years
8. Amount Recognized in OPEB Expense 0(6. / 7.)
9. Deferred (Inflow) / Outflow of Resources 0$ (6. - 8.)
NEW YORK CITY HEALTH BENEFITS PROGRAM
Governmental Accounting Standards Board Statements No. 74 and No. 75 (GASB 74/75)
New York City Municipal Water Finance Authority (WFA)
Development of Asset (Gain) / LossJune 30, 2021

79
Total
1. Disclosed Entry Age Accrued Liability (EAAL) at 6/30/2019¹ 1,827,834$ 2. Entry Age Normal Cost at 6/30/2019¹ 96,8123. Actual Benefit Payments-FY20 (20,517)4. Interest¹ 53,4135. (Gain)/Loss due to Experience Change¹ (43,206)6. (Gain)/Loss due to Discount Rate Change 32,7167. (Gain)/Loss due to Cadillac Tax Repeal² (18,300)
8. Roll-Forward EAAL at 6/30/2020² 1,928,752$
1Assumes a 2.79% interest rate2Assumes a 2.66% interest rate
NEW YORK CITY HEALTH BENEFITS PROGRAM
Governmental Accounting Standards Board Statements No. 74 and No. 75 (GASB 74/75)
Roll-Forward of Entry Age Accrued Liabilities to June 30, 2020
New York City Municipal Water Finance Authority (WFA)

80
Total
1. Disclosed Entry Age Accrued Liability (EAAL) at 6/30/2020¹ 1,928,752$ 2. Entry Age Normal Cost at 6/30/2020¹ 111,8803. Actual Benefit Payments-FY21 (18,699)4. Interest¹ 54,0345. (Gain)/Loss due to Experience Change¹ (114,048)6. (Gain)/Loss due to AOP Change1 (105,402)7. (Gain)/Loss due to Mortality Improvement Change1 (32,686)8. (Gain)/Loss due to Discount Rate Change 103,774
9. Roll-Forward EAAL at 6/30/2021² 1,927,605$
1Assumes a 2.66% interest rate2Assumes a 2.18% interest rate
NEW YORK CITY HEALTH BENEFITS PROGRAM
Governmental Accounting Standards Board Statements No. 74 and No. 75 (GASB 74/75)
New York City Municipal Water Finance Authority (WFA)
Roll-Forward of Entry Age Accrued Liabilities to June 30, 2021

81
Total OPEB Plan Fiduciary Net OPEBLiability Net Position Liability
(a) (b) (a) - (b)1. Balances at June 30, 2019 1,827,834$ 0$ 1,827,834$
2. Changes for the Year:a. Service Cost 96,812 0 96,812b. Interest 53,413 0 53,413c. Differences b/t Expected and Actual Experience (43,206) 0 (43,206)d. Change in Assumptions 32,716 0 32,716e. Contributions - Employer 0 20,517 (20,517)f. Contributions - Employee 0 0 0g. Net Investment Income 0 0 0h. Actual Benefit Payments (20,517) (20,517) 0i. Administrative Expenses 0 0 0j. Other Changes1 (18,300) 0 (18,300)k. Net Changes 100,918$ 0$ 100,918$
3. Balances at June 30, 2020 1,928,752$ 0$ 1,928,752$
4. Sensitivity of the Net OPEB Liability to Changes in the Discount Ratea. 1% Decrease 2,203,563$ b. 1% Increase 1,699,681$
5. Sensitivity of the Net OPEB Liability to Changes in the Healthcare Cost Trend Ratea. 1% Decrease 1,598,553$ b. 1% Increase 2,364,607$
1Repeal of Cadillac Tax
NEW YORK CITY HEALTH BENEFITS PROGRAM
Governmental Accounting Standards Board Statements No. 74 and No. 75 (GASB 74/75)
Changes in Net OPEB Liability (NOL) by SourceBalances at June 30, 2020
New York City Municipal Water Finance Authority (WFA)

82
Total OPEB Plan Fiduciary Net OPEBLiability Net Position Liability
(a) (b) (a) - (b)1. Balances at June 30, 2020 1,928,752$ 0$ 1,928,752$
2. Changes for the Year:a. Service Cost 111,880 0 111,880b. Interest 54,034 0 54,034c. Differences b/t Expected and Actual Experience (114,048) 0 (114,048)d. Change in Assumptions (34,314) 0 (34,314)e. Contributions - Employer 0 18,699 (18,699)f. Contributions - Employee 0 0 0g. Net Investment Income 0 0 0h. Actual Benefit Payments (18,699) (18,699) 0i. Administrative Expenses 0 0 0j. Other Changes 0 0 0k. Net Changes (1,147)$ 0$ (1,147)$
3. Balances at June 30, 2021 1,927,605$ 0$ 1,927,605$
4. Sensitivity of the Net OPEB Liability to Changes in the Discount Ratea. 1% Decrease 2,169,240$ b. 1% Increase 1,719,466$
5. Sensitivity of the Net OPEB Liability to Changes in the Healthcare Cost Trend Ratea. 1% Decrease 1,598,041$ b. 1% Increase 2,362,605$
NEW YORK CITY HEALTH BENEFITS PROGRAM
Governmental Accounting Standards Board Statements No. 74 and No. 75 (GASB 74/75)
New York City Municipal Water Finance Authority (WFA)
Changes in Net OPEB Liability (NOL) by SourceBalances at June 30, 2021

83
2021 2020 2019 2018 2017 20161. Total OPEB Liability
a. Service Cost 111,880$ 96,812$ 110,962$ 93,822$ 101,168$ 136,444$ b. Interest 54,034 53,413 46,397 43,418 43,073 42,584c. Differences b/t Expected and Actual Experience (114,048) (43,206) 571,891 (106,042) (96,417) (8,454)d. Changes of Assumptions (34,314) 32,716 (335,771) 34,849 (222,259) 0e. Benefit Payments (18,699) (20,517) (23,115) (20,396) (14,901) (16,973)f. Other Changes1 0 (18,300) 0 0 0 0g. Net Changes in Total OPEB Liability (1,147)$ 100,918$ 370,364$ 45,651$ (189,336)$ 153,601$
2. Total OPEB Liability - Beginning 1,928,752$ 1,827,834$ 1,457,470$ 1,411,819$ 1,601,155$ 1,447,554$ 3. Total OPEB Liability - Ending 1,927,605$ 1,928,752$ 1,827,834$ 1,457,470$ 1,411,819$ 1,601,155$
4. Plan Fiduciary Net Positiona. Contributions - Employer 18,699$ 20,517$ 23,115$ 20,396$ 14,901$ 16,973$ b. Contributions - Employee 0 0 0 0 0 0c. Net Investment Income 0 0 0 0 0 0d. Benefit Payments (18,699) (20,517) (23,115) (20,396) (14,901) (16,973)e. Administrative Expenses 0 0 0 0 0 0f. Other Changes 0 0 0 0 0 0g. Net Changes in Plan Fiduciary Net Position 0$ 0$ 0$ 0$ 0$ 0$
5. Plan Fiduciary Net Position - Beginning 0$ 0$ 0$ 0$ 0$ 0$ 6. Plan Fiduciary Net Position - Ending 0$ 0$ 0$ 0$ 0$ 0$
7. Net OPEB Liability 1,927,605$ 1,928,752$ 1,827,834$ 1,457,470$ 1,411,819$ 1,601,155$
8. Plan Fiduciary Net Position as a Percentageof Total OPEB Liability 0.0% 0.0% 0.0% 0.0% 0.0% 0.0%
9. Covered Employee Payroll 1,209,068$ 1,187,306$ 942,469$ 858,968$ 1,038,842$ 1,147,964$
10. Net OPEB Liability as a Percentageof Covered Employee Payroll 159.4% 162.4% 193.9% 169.7% 135.9% 139.5%
1Repeal of Cadillac Tax
NEW YORK CITY HEALTH BENEFITS PROGRAM
Governmental Accounting Standards Board Statements No. 74 and No. 75 (GASB 74/75)
New York City Municipal Water Finance Authority (WFA)
Schedule of Changes in Net OPEB Liability and Related Ratios

84
Total of Future Average ExpectedWorkLife Remaining Service Life
Group # Count @ 6/30/2020 @ 6/30/2020Active 11 159.64 14.51Deferred Vested 1 0 0Retired 5 0 0 Total 17 159.64 9.39
NEW YORK CITY HEALTH BENEFITS PROGRAM
Governmental Accounting Standards Board Statements No. 74 and No. 75 (GASB 74/75)
New York City Municipal Water Finance Authority (WFA)
Average Expected Remaining Service Lives @6/30/2020

85
Differencesbetween Expected Recognition
and Actual PeriodYear Experience (Years) 2016 2017 2018 2019 2020 2021 2022 2023 2024 2025 2026 2027 2028 2029 20302016 1 (8,454)$ 9.26 (913) (913) (913) (913) (913) (913) (913) (913) (913) (237) 0 0 0 0 02017 (96,417)$ 9.26 0 (10,412) (10,412) (10,412) (10,412) (10,412) (10,412) (10,412) (10,412) (10,412) (2,709) 0 0 0 02018 (106,042)$ 8.71 0 0 (12,175) (12,175) (12,175) (12,175) (12,175) (12,175) (12,175) (12,175) (8,642) 0 0 0 02019 571,891$ 8.51 0 0 0 67,202 67,202 67,202 67,202 67,202 67,202 67,202 67,202 34,275 0 0 02020 (43,206)$ 8.39 0 0 0 0 (5,150) (5,150) (5,150) (5,150) (5,150) (5,150) (5,150) (5,150) (2,006) 0 02021 (114,048)$ 9.39 0 0 0 0 0 (12,146) (12,146) (12,146) (12,146) (12,146) (12,146) (12,146) (12,146) (12,146) (4,734)
Net increase (decrease) in OPEB Expense (913)$ (11,325)$ (23,500)$ 43,702$ 38,552$ 26,406$ 26,406$ 26,406$ 26,406$ 27,082$ 38,555$ 16,979$ (14,152)$ (12,146)$ (4,734)$
1Represents the Future Working Lifetime as of 6/30/2016
NEW YORK CITY HEALTH BENEFITS PROGRAM
Governmental Accounting Standards Board Statements No. 74 and No. 75 (GASB 74/75)
New York City Municipal Water Finance Authority (WFA)
Increase (Decrease) in OPEB Expense Arising from the Recognition ofDifferences between Expected and Actual Experience

86
DifferencesDue to Recognition
Changes in PeriodYear Assumptions (Years) 2017 2018 2019 2020 2021 2022 2023 2024 2025 2026 2027 2028 2029 20302017 (222,259)$ 9.26 (24,002) (24,002) (24,002) (24,002) (24,002) (24,002) (24,002) (24,002) (24,002) (6,241) 0 0 0 02018 34,849$ 8.71 0 4,001 4,001 4,001 4,001 4,001 4,001 4,001 4,001 2,841 0 0 0 02019 (335,771)$ 8.51 0 0 (39,456) (39,456) (39,456) (39,456) (39,456) (39,456) (39,456) (39,456) (20,123) 0 0 02020 32,716$ 8.39 0 0 0 3,899 3,899 3,899 3,899 3,899 3,899 3,899 3,899 1,524 0 02021 (34,314)$ 9.39 0 0 0 0 (3,654) (3,654) (3,654) (3,654) (3,654) (3,654) (3,654) (3,654) (3,654) (1,428)
Net increase (decrease) in OPEB Expense (24,002)$ (20,001)$ (59,457)$ (55,558)$ (59,212)$ (59,212)$ (59,212)$ (59,212)$ (59,212)$ (42,611)$ (19,878)$ (2,130)$ (3,654)$ (1,428)$
NEW YORK CITY HEALTH BENEFITS PROGRAM
Governmental Accounting Standards Board Statements No. 74 and No. 75 (GASB 74/75)
New York City Municipal Water Finance Authority (WFA)
Increase (Decrease) in OPEB Expense Arising from the Recognition ofChanges in Assumptions

87
Differencesbetween Projected
and ActualEarnings on RecognitionOPEB Plan Period
Year Investments (Years) 2017 2018 2019 2020 2021 2022 2023 20242017 0$ 5 0 0 0 0 0 0 0 02018 0$ 5 0 0 0 0 0 0 0 02019 0$ 5 0 0 0 0 0 0 0 02020 0$ 5 0 0 0 0 0 0 0 02021 0$ 5 0 0 0 0 0 0 0 0
Net increase (decrease) in OPEB Expense 0$ 0$ 0$ 0$ 0$ 0$ 0$ 0$
NEW YORK CITY HEALTH BENEFITS PROGRAM
Governmental Accounting Standards Board Statements No. 74 and No. 75 (GASB 74/75)
New York City Municipal Water Finance Authority (WFA)
Increase (Decrease) in OPEB Expense Arising from the Recognition ofDifferences between Projected and Actual Earnings on OPEB Plan Investments

88
Component Amount
a. Service Cost 96,812$ b. Interest on the Total OPEB Liability 53,413c. Differences between Expected and Actual Experience 38,552d. Changes of Assumptions (55,558)e. Employee Contributions 0f. Projected Earnings on OPEB Plan Investments 0g. Differences between Projected and Actual Earnings on Plan Investments 0h. OPEB Plan Administrative Expenses 0i. Other Changes in Fiduciary Net Position 0j. Other Changes in Total OPEB Liability1 (18,300)
Total OPEB Expense 114,919$
1 Repeal of Cadillac Tax
Governmental Accounting Standards Board Statements No. 74 and No. 75 (GASB 74/75)
New York City Municipal Water Finance Authority (WFA)
NEW YORK CITY HEALTH BENEFITS PROGRAM
Components of OPEB Expense for the Fiscal Year Ended June 30, 2020

89
Component Amount
a. Service Cost 111,880$ b. Interest on the Total OPEB Liability 54,034c. Differences between Expected and Actual Experience 26,406d. Changes of Assumptions (59,212)e. Employee Contributions 0f. Projected Earnings on OPEB Plan Investments 0g. Differences between Projected and Actual Earnings on Plan Investments 0h. OPEB Plan Administrative Expenses 0i. Other Changes in Fiduciary Net Position 0j. Other Changes in Total OPEB Liability 0
Total OPEB Expense 133,108$
NEW YORK CITY HEALTH BENEFITS PROGRAM
Governmental Accounting Standards Board Statements No. 74 and No. 75 (GASB 74/75)
New York City Municipal Water Finance Authority (WFA)
Components of OPEB Expense for the Fiscal Year Ended June 30, 2021

90
Recognized OPEB Expense
Deferred Resources Outflows Inflows Outflows Inflows Outflows Inflows Outflows Inflows Outflows Inflows Outflows Inflows
Differences between Expected and Actual Experience 0$ 7,541$ 0$ 86,005$ 0$ 93,867$ 504,689$ 0$ 0$ 38,056$ 0$ 101,902$
Changes of Assumptions 0 0 0 198,257 30,848 0 0 296,315 28,817 0 0 30,660
Net Difference between Projected and Actual Earnings on OPEB Plan Investments 0 0 0 0 0 0 0 0 0 0 0 0
Total 0$ 7,541$ 0$ 284,262$ 30,848$ 93,867$ 504,689$ 296,315$ 28,817$ 38,056$ 0$ 132,562$
Amounts reported as Deferred Outflows of Resources and Deferred Inflows of Resources related to OPEB will be recognized in OPEB Expense as follows:
Fiscal YearEnded June 30201620172018201920202021202220232024202520262027202820292030 ($6,162)
($15,800)($15,800)($15,800)($15,800)
($15,800)($15,800)($15,800)($15,800)($15,800)
Fiscal Year Ending June 30, 2021$133,108
Fiscal Year Ending June 30, 2019
($913)($913)
Fiscal Year Ending June 30, 2016$114,919
($913)
($913)
Fiscal Year Ending June 30, 2017 Fiscal Year Ending June 30, 2018
($913)
Fiscal Year Ending June 30, 2020
NEW YORK CITY HEALTH BENEFITS PROGRAM
Governmental Accounting Standards Board Statements No. 74 and No. 75 (GASB 74/75)
New York City Municipal Water Finance Authority (WFA)
OPEB Expense, Deferred Outflows of Resources, Deferred Inflows of Resources
($913)($237)
($34,414)($34,414)($34,414)($34,414)($34,414)($34,414)($34,414)($34,414)($34,414)($8,950)
($913)($913)
($913)
$27,746$27,746
($8,174)($8,174)($8,174)($8,174)($8,174)
$14,152
$178,115 $108,914 $93,739 $141,604
($8,174)($8,174)($8,174)($5,801)
$27,746$27,746$27,746$27,746$27,746$27,746
($1,251)($1,251)($1,251)($482)
($1,251)($1,251)($1,251)($1,251)($1,251)

91
For the Fiscal Year ended June 30, 2021, the City recognized OPEB Expense of $133,108.
At June 30, 2021, the City reported total Deferred Outflows of Resources and Deferred Inflows of Resources related to OPEB from the following sources:
Deferred DeferredOutflows Inflows
of Resources of Resources
Differences between Expected and Actual Experience 370,285$ 239,483$
Changes of Assumptions 43,763 350,312
Net Difference between Projected and Actual Earnings on OPEB Plan Investments 0 0
Total 414,048$ 589,795$
Amounts reported as Deferred Outflows of Resources and Deferred Inflows of Resources related to OPEB will be recognized in OPEB Expense as follows:
Fiscal YearEnded June 30 Amount2021 (32,806)$ 2022 (32,806)2023 (32,806)2024 (32,806)2025 (32,130)2026 (4,056)2027 (2,899)2028 (16,282)2029 (15,800)2030 (6,162)
NEW YORK CITY HEALTH BENEFITS PROGRAM
Governmental Accounting Standards Board Statements No. 74 and No. 75 (GASB 74/75)
New York City Municipal Water Finance Authority (WFA)
OPEB Expense, Deferred Outflows of Resources, Deferred Inflows of Resources

92
City of New York (Excluding Component Units)

93
NYCERS TRS BERS POLICE FIRE NYCRS TOTAL1. Actives
a. Number 106,268 120,119 28,104 35,895 11,079 301,465b. Salary $8,427,005,711 $10,912,506,425 $1,410,097,003 $4,175,946,196 $1,390,404,926 $26,315,960,261c. Average Age 46.35 43.94 50.65 37.86 40.71 44.57d. Average Service 12.10 12.15 8.89 11.81 14.03 11.86e. Average Salary $79,300 $90,847 $50,174 $116,338 $125,499 $87,294
2. Deferreds (Includes Deferred Retirees, if any)a. Number 9,996 10,048 1,163 603 64 21,874b. Average Age 55.27 50.37 56.12 42.74 43.41 52.68
3. Retireesa. Total 2
i. Number 75,685 82,275 17,450 50,588 16,268 242,266 ii. Average Age 70.61 73.88 74.35 62.63 67.31 70.10
b. By Benefit3 Participant / Spouse Participant / Spouse Participant / Spouse Participant / Spouse Participant / Spouse Participant / Spousei. Pre-Medicare4 20,411 / 12,324 11,519 / 5,186 2,300 / 991 31,527 / 21,411 7,136 / 6,538 72,893 / 46,450
ii. Medicare Eligible4 55,274 / 18,042 70,756 / 21,203 15,150 / 4,920 19,061 / 10,963 9,132 / 5,097 169,373 / 60,225iii. Welfare Fund4 73,663 / NE 79,489 / NE 16,577 / NE 49,917 / NE 15,524 / NE 235,170 / NEiv. Medicare Part B5 100,074 / 37,642 83,832 / 27,093 17,483 / 5,919 50,588 / 32,374 16,268 / 11,635 268,245 / 114,663
TIAA LODW GRAND TOTAL1. Actives
a. Number 2,453 0 303,918b. Salary $238,390,647 0 $26,554,350,908c. Average Age 51.36 NA 44.63d. Average Service 15.20 NA 11.88e. Average Salary $97,183 NA $87,373
2. Deferreds (Includes Deferred Retirees, if any)a. Number 102 6 0 21,976b. Average Age 54.03 NA 52.69
3. Retireesa. Total
i. Number 936 776 243,978ii. Average Age 77.92 81.64 70.17
b. By Benefit3 Participant / Spouse Participant / Spouse Participant / Spousei. Pre-Medicare4 16 / 33 53 / 0 72,962 / 46,483
ii. Medicare Eligible4 920 / 377 723 / 0 171,016 / 60,602iii. Welfare Fund4 936 / NE NE / NE 236,106 / NEiv. Medicare Part B5 3,399 / 1,530 776 / 0 272,420 / 116,193
1 City results also include coverage for the following benefits for the following members of each component unit. These headcounts are not included above except for SCA retirees.
Health Insurance (SCA)
Welfare Fund(CUNY Senior Colleges (non-pedagogical))
Medicare Part B (HHC, SCA, WFA, CUNY
Senior Colleges)Actives 814 4,240 49,255 Deferreds 31 350 4,092 Retirees 358 2,010 29,502
2 Retirees eligible for receipt of Health Insurance, excluding Component Units.3 Includes Component Unit participants with City-provided benefits.4 Retirees currently eligible for benefit.5 Retirees eligible for benefit currently or in the future.6 Estimate due to lack of data.
NE Not eligible.
NEW YORK CITY HEALTH BENEFITS PROGRAM
Governmental Accounting Standards Board Statements No. 74 and No. 75 (GASB 74/75)City of New York (Excluding Component Units)
Summary of June 30, 2020 OPEB Data
By System Not Including Component Units 1

94
1. Total Present Value of Projected Benefits1
Pre-Medicare Medicare Welfare Funds Part B Premium Cadillac Tax Total
a. Active 1,2 $49,842,412,168 $32,355,913,387 $16,744,658,000 $29,766,221,025 $4,528,492,806 $133,237,697,386
b. Deferred 3 3,685,120,497 1,948,178,299 1,194,776,476 1,841,452,046 106,452,390 8,775,979,708
c. Retired 17,184,291,308 14,867,289,517 8,554,127,790 11,869,466,940 124,439,627 52,599,615,182
d. TOTAL $70,711,823,973 $49,171,381,203 $26,493,562,266 $43,477,140,011 $4,759,384,823 $194,613,292,276
2. Entry Age Accrued Liability
a. Active 2 $16,339,231,515 $11,556,108,498 $5,987,390,556 $10,529,382,818 $994,878,734 $45,406,992,121
b. Deferred 3 3,685,120,497 1,948,178,299 1,194,776,476 1,841,452,046 106,452,390 8,775,979,708
c. Retired 17,184,291,308 14,867,289,517 8,554,127,790 11,869,466,940 124,439,627 52,599,615,182
d. TOTAL $37,208,643,320 $28,371,576,314 $15,736,294,822 $24,240,301,804 $1,225,770,751 $106,782,587,011
3. Market Value of Assets $4,679,551,174
4. Unfunded Accrued Liability (UAL) $102,103,035,837
5. Entry Age Normal Cost $5,292,309,204
6. Salary of Active Participants4 $28,201,101,945
7. Normal Cost Percentage 18.766%[5. / 6.]
1 City results also include coverage for the following benefits for the following members of each component unit:
Health Insurance (SCA)
Welfare Fund(CUNY Senior Colleges
(non-pedagogical))
Medicare Part B (HHC, SCA, WFA, CUNY
Senior Colleges)Actives 771 4,272 45,949 AOP 82 1,260 9,088 Deferreds 35 347 4,055 Retirees 324 1,964 29,264
2 Includes Total Present Value of Projected Benefits for AOP, if any.3 Includes Deferred Retirees, if any.4 Includes Component Units except NYCHA and ECF.
Based on a 2.82% Discount Rate
NEW YORK CITY HEALTH BENEFITS PROGRAM
Governmental Accounting Standards Board Statements No. 74 and No. 75 (GASB 74/75)City of New York (Excluding Component Units)
June 30, 2019 Results of the Actuarial Valuation
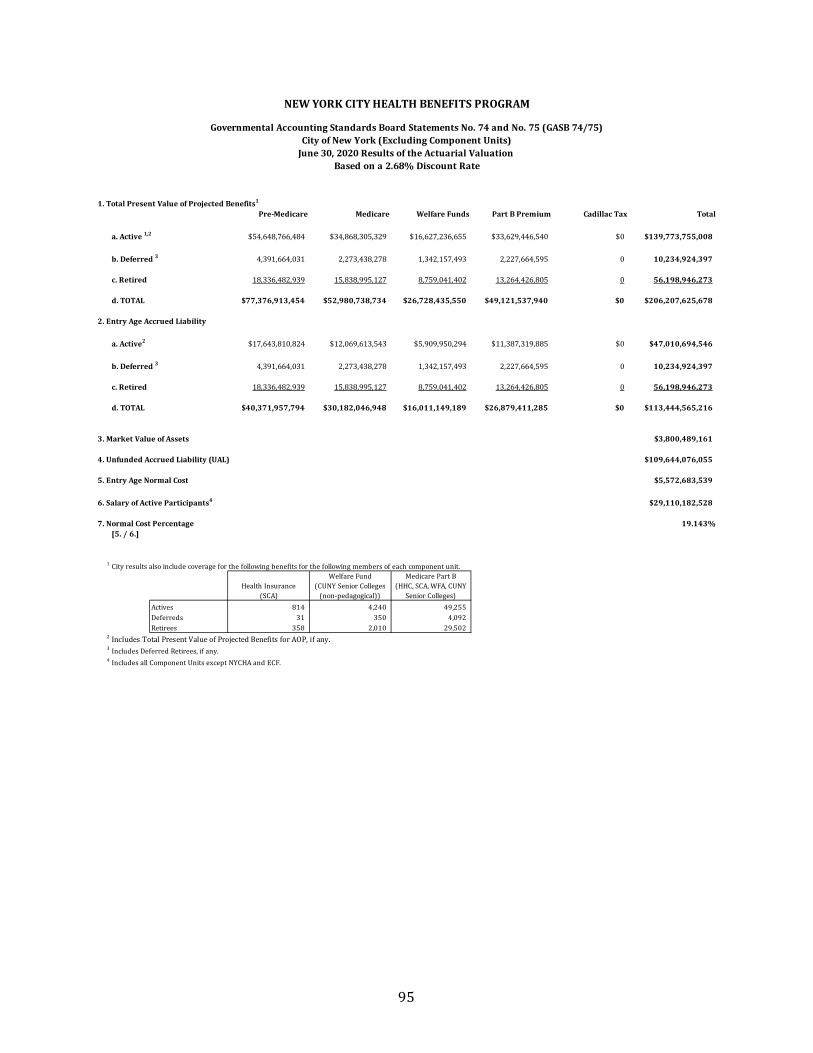
95
1. Total Present Value of Projected Benefits1
Pre-Medicare Medicare Welfare Funds Part B Premium Cadillac Tax Total
a. Active 1,2 $54,648,766,484 $34,868,305,329 $16,627,236,655 $33,629,446,540 $0 $139,773,755,008
b. Deferred 3 4,391,664,031 2,273,438,278 1,342,157,493 2,227,664,595 0 10,234,924,397
c. Retired 18,336,482,939 15,838,995,127 8,759,041,402 13,264,426,805 0 56,198,946,273
d. TOTAL $77,376,913,454 $52,980,738,734 $26,728,435,550 $49,121,537,940 $0 $206,207,625,678
2. Entry Age Accrued Liability
a. Active2 $17,643,810,824 $12,069,613,543 $5,909,950,294 $11,387,319,885 $0 $47,010,694,546
b. Deferred 3 4,391,664,031 2,273,438,278 1,342,157,493 2,227,664,595 0 10,234,924,397
c. Retired 18,336,482,939 15,838,995,127 8,759,041,402 13,264,426,805 0 56,198,946,273
d. TOTAL $40,371,957,794 $30,182,046,948 $16,011,149,189 $26,879,411,285 $0 $113,444,565,216
3. Market Value of Assets $3,800,489,161
4. Unfunded Accrued Liability (UAL) $109,644,076,055
5. Entry Age Normal Cost $5,572,683,539
6. Salary of Active Participants4 $29,110,182,528
7. Normal Cost Percentage 19.143%[5. / 6.]
1 City results also include coverage for the following benefits for the following members of each component unit.
Health Insurance (SCA)
Welfare Fund(CUNY Senior Colleges
(non-pedagogical))
Medicare Part B (HHC, SCA, WFA, CUNY
Senior Colleges)Actives 814 4,240 49,255 Deferreds 31 350 4,092 Retirees 358 2,010 29,502
2 Includes Total Present Value of Projected Benefits for AOP, if any.3 Includes Deferred Retirees, if any.4 Includes all Component Units except NYCHA and ECF.
Based on a 2.68% Discount RateJune 30, 2020 Results of the Actuarial Valuation City of New York (Excluding Component Units)
Governmental Accounting Standards Board Statements No. 74 and No. 75 (GASB 74/75)
NEW YORK CITY HEALTH BENEFITS PROGRAM

96
Total1. Plan Net Position @ 6/30/2019 4,679,551,174$
2. Changes for the year:a. ER Contributions 2,059,052,552b. EE Contributions 0c. Net Investment Income 76,119,735d. Benefit Payments (3,014,059,300)e. Administrative Expenses 0f. Other (175,000)g. Net Changes (879,062,013)$
3. Plan Net Position @ 6/30/2020 3,800,489,161$
4. Changes for the year:a. ER Contributions 3,599,557,405b. EE Contributions 0c. Net Investment Income 3,801,273d. Benefit Payments (3,183,111,369)e. Administrative Expenses (54,000)f. Other (175,000)g. Net Changes 420,018,309$
5. Plan Net Position @ 6/30/2021 4,220,507,470$
Market Values of Assets
NEW YORK CITY HEALTH BENEFITS PROGRAM
Governmental Accounting Standards Board Statements No. 74 and No. 75 (GASB 74/75)
City of New York (Excluding Component Units)

97
Total
1. Market Value 6/30/2019 4,679,551,174$
2. Market Value 6/30/2020 3,800,489,161
3. Net Investment Income 76,119,735
4. Cash Flow (955,181,748)(2. - 1. - 3.)
5. Projected Earnings1 168,269,448(4% * 1. + 1.980% * 4.)
6. (Gain) / Loss 92,149,713(5. - 3.)
7. Recognition Period 5 Years
8. Amount Recognized in OPEB Expense 18,429,943(6. / 7.)
9. Deferred (Inflow) / Outflow of Resources 73,719,770$ (6. - 8.)
1 Assumes middle of year payments
NEW YORK CITY HEALTH BENEFITS PROGRAM
Governmental Accounting Standards Board Statements No. 74 and No. 75 (GASB 74/75)
City of New York (Excluding Component Units)
Development of Asset (Gain) / LossJune 30, 2020

98
Total
1. Market Value 6/30/2020 3,800,489,161$
2. Market Value 6/30/2021 4,220,507,470
3. Net Investment Income 3,801,273
4. Cash Flow 416,217,036(2. - 1. - 3.)
5. Projected Earnings1 160,260,664 (4% * 1. + 1.980% * 4.)
6. (Gain) / Loss 156,459,391(5. - 3.)
7. Recognition Period 5 Years
8. Amount Recognized in OPEB Expense 31,291,878(6. / 7.)
9. Deferred (Inflow) / Outflow of Resources 125,167,513$ (6. - 8.)
1 Assumes middle of year payments
NEW YORK CITY HEALTH BENEFITS PROGRAM
Governmental Accounting Standards Board Statements No. 74 and No. 75 (GASB 74/75)
City of New York (Excluding Component Units)
Development of Asset (Gain) / LossJune 30, 2021

99
Total
1. Entry Age Accrued Liability (EAAL) at 6/30/2019¹ 112,442,538,275$ 2. Entry Age Normal Cost at 6/30/2019¹ 5,292,309,2043. Actual Benefit Payments-FY20 (3,014,059,300)4. Interest¹ 3,277,919,9245. (Gain)/Loss due to Experience Change¹ (5,819,208,728)6. (Gain)/Loss due to Discount Rate Change 2,507,506,3837. (Gain)/Loss due to Cadillac Tax Repeal² (1,457,818,456)
8. Roll-Forward EAAL at 6/30/2020² 113,229,187,302$
¹Assumes a 2.82% interest rate²Assumes a 2.68% interest rate
NEW YORK CITY HEALTH BENEFITS PROGRAM
Governmental Accounting Standards Board Statements No. 74 and No. 75 (GASB 74/75)
City of New York (Excluding Component Units)
Roll Forward of Entry Age Accrued Liabilities to June 30, 2020

100
Total
1. Disclosed Entry Age Accrued Liability (EAAL) at 6/30/2020¹ 113,229,187,302$ 2. Entry Age Normal Cost at 6/30/2020¹ 5,572,683,5393. Actual Benefit Payments-FY21 (3,183,111,369)4. Interest¹ 3,141,518,4595. (Gain)/Loss due to Experience Change¹ 221,150,0446. (Gain)/Loss due to AOP Change¹ (3,315,520,702)7. (Gain)/Loss due to Mortality Improvement Scale Change¹ (2,088,448,613)8. (Gain)/Loss due to Discount Rate Change 8,592,915,218
9. Roll-Forward EAAL at 6/30/2021² 122,170,373,878$
¹Assumes a 2.68% interest rate²Assumes a 2.19% interest rate
NEW YORK CITY HEALTH BENEFITS PROGRAM
Governmental Accounting Standards Board Statements No. 74 and No. 75 (GASB 74/75)
City of New York (Excluding Component Units)
Roll Forward of Entry Age Actuarial Accrued Liabilities to June 30, 2021

101
Total OPEB Plan Fiduciary Net OPEBLiability Net Position Liability
(a) (b) (a) - (b)1. Balances at June 30, 2019 112,442,538,275$ 4,679,551,174$ 107,762,987,101$
2. Changes for the Year:a. Service Cost 5,292,309,204 0 5,292,309,204b. Interest 3,277,919,924 0 3,277,919,924c. Differences b/t Expected and Actual Experience (5,819,208,728) 0 (5,819,208,728)d. Changes in Assumptions 2,507,506,383 0 2,507,506,383e. Contributions - Employer 0 2,059,052,552 (2,059,052,552)f. Contributions - Employee 0 0 0g. Net Investment Income 0 76,119,735 (76,119,735)h. Actual Benefit Payments (3,014,059,300) (3,014,059,300) 0i. Administrative Expenses 0 0 0j. Other Changes1 (1,457,818,456) (175,000) (1,457,643,456)k. Net Changes 786,649,027$ (879,062,013)$ 1,665,711,040$
3. Balances at June 30, 2020 113,229,187,302$ 3,800,489,161$ 109,428,698,141$
4. Sensitivity of the Net OPEB Liability to Changes in the Discount Ratea. 1% Decrease 129,725,569,224$ b. 1% Increase 93,549,895,869$
5. Sensitivity of the Net OPEB Liability to Changes in the Healthcare Cost Trend Ratea. 1% Decrease 90,312,654,926$ b. 1% Increase 134,753,776,933$
1The amount in the Total OPEB Liability column represents the repeal of the Cadillac Tax
NEW YORK CITY HEALTH BENEFITS PROGRAM
Governmental Accounting Standards Board Statements No. 74 and No. 75 (GASB 74/75)
City of New York (Excluding Component Units)
Changes in Net OPEB Liability (NOL) by SourceBalances at June 30, 2020

102
Total OPEB Plan Fiduciary Net OPEBLiability Net Position Liability
(a) (b) (a) - (b)1. Balances at June 30, 2020 113,229,187,302$ 3,800,489,161$ 109,428,698,141$
2. Changes for the Year:a. Service Cost 5,572,683,539 0 5,572,683,539b. Interest 3,141,518,459 0 3,141,518,459c. Differences b/t Expected and Actual Experience 221,150,044 0 221,150,044d. Changes in Assumptions 3,188,945,903 0 3,188,945,903e. Contributions - Employer 0 3,599,557,405 (3,599,557,405)f. Contributions - Employee 0 0 0g. Net Investment Income 0 3,801,273 (3,801,273)h. Actual Benefit Payments (3,183,111,369) (3,183,111,369) 0i. Administrative Expenses 0 (54,000) 54,000j. Other Changes 0 (175,000) 175,000k. Net Changes 8,941,186,576$ 420,018,309$ 8,521,168,267$
3. Balances at June 30, 2021 122,170,373,878$ 4,220,507,470$ 117,949,866,408$
4. Sensitivity of the Net OPEB Liability to Changes in the Discount Ratea. 1% Decrease 138,804,133,577$ b. 1% Increase 101,351,231,138$
5. Sensitivity of the Net OPEB Liability to Changes in the Healthcare Cost Trend Ratea. 1% Decrease 97,537,380,092$ b. 1% Increase 144,850,884,890$
NEW YORK CITY HEALTH BENEFITS PROGRAM
Governmental Accounting Standards Board Statements No. 74 and No. 75 (GASB 74/75)
City of New York (Excluding Component Units)
Changes in Net OPEB Liability (NOL) by SourceBalances at June 30, 2021

103
2021 2020 2019 2018 2017 20161. Total OPEB Liability
a. Service Cost 5,572,683,539$ 5,292,309,204$ 5,725,025,094$ 4,860,387,841$ 4,521,008,728$ 5,112,510,498$ b. Interest 3,141,518,459 3,277,919,924 3,237,262,217 3,131,103,689 2,898,446,758 2,668,923,050c. Differences b/t Expected and Actual Experience 221,150,044 (5,819,208,728) 9,362,492,183 2,293,748,135 519,255,914 (120,146,814)d. Changes of Assumptions 3,188,945,903 2,507,506,383 (6,277,325,926) 2,513,081,199 (10,974,634,867) 0e. Benefit Payments (3,183,111,369) (3,014,059,300) (2,839,210,462) (2,617,044,303) (2,424,766,464) (2,277,515,643)f. Other Changes1 0 (1,457,818,456) 0 0 0 0g. Net Changes in Total OPEB Liability 8,941,186,576$ 786,649,027$ 9,208,243,106$ 10,181,276,561$ (5,460,689,931)$ 5,383,771,091$
2. Total OPEB Liability - Beginning 113,229,187,302$ 112,442,538,275$ 103,234,295,169$ 93,053,018,608$ 98,513,708,539$ 93,129,937,448$ 3. Total OPEB Liability - Ending 122,170,373,878$ 113,229,187,302$ 112,442,538,275$ 103,234,295,169$ 93,053,018,608$ 98,513,708,539$
4. Plan Fiduciary Net Positiona. Contributions - Employer 3,599,557,405$ 2,059,052,552$ 2,652,443,121$ 2,681,020,067$ 3,020,942,554$ 2,897,128,941$ b. Contributions - Employee 0 0 0 0 0 0c. Net Investment Income 3,801,273 76,119,735 100,740,410 48,093,613 21,515,588 20,565,435d. Benefit Payments (3,183,111,369) (3,014,059,300) (2,839,210,462) (2,617,044,303) (2,424,766,464) (2,277,515,643)e. Administrative Expenses (54,000) 0 (46,110) (43,105) (41,100) (40,000)f. Other Changes (175,000) (175,000) (175,000) (130,323) (78,516) (331,067)g. Net Changes in Plan Fiduciary Net Position 420,018,309$ (879,062,013)$ (86,248,041)$ 111,895,949$ 617,572,062$ 639,807,666$
5. Plan Fiduciary Net Position - Beginning 3,800,489,161$ 4,679,551,174$ 4,765,799,215$ 4,653,903,266$ 4,036,331,204$ 3,396,523,538$ 6. Plan Fiduciary Net Position - Ending 4,220,507,470$ 3,800,489,161$ 4,679,551,174$ 4,765,799,215$ 4,653,903,266$ 4,036,331,204$
7. Net OPEB Liability 117,949,866,408$ 109,428,698,141$ 107,762,987,101$ 98,468,495,954$ 88,399,115,342$ 94,477,377,335$
8. Plan Fiduciary Net Position as a Percentageof Total OPEB Liability 3.5% 3.4% 4.2% 4.6% 5.0% 4.1%
9. Covered Employee Payroll2 $29,110,182,528 $28,201,101,945 $27,679,916,380 $26,230,448,259 $25,112,110,958 $24,204,772,333
10. Net OPEB Liability as a Percentageof Covered Employee Payroll 405.2% 388.0% 389.3% 375.4% 352.0% 390.3%
1Repeal of the Cadillac Tax.2Includes those Component Units with Medicare Part B, Health Insurance or Welfare Fund coverage provided by the City.
NEW YORK CITY HEALTH BENEFITS PROGRAM
Governmental Accounting Standards Board Statements No. 74 and No. 75 (GASB 74/75)
City of New York (Excluding Component Units)
Schedule of Changes in Net OPEB Liability and Related Ratios

104
Total Future Average ExpectedWorkLife Remaining Service Life
Group1 # Count @ 6/30/2020 @ 6/30/2020Active 351,204 4,551,493 12.96Deferred Vested 26,068 0 0Retired 273,126 0 0 Total 650,398 4,551,493 7.00
provided by the City.
NEW YORK CITY HEALTH BENEFITS PROGRAM
Governmental Accounting Standards Board Statements No. 74 and No. 75 (GASB 74/75)
Average Expected Remaining Service Lives @ 6/30/2020
City of New York (Excluding Component Units)
1Includes those Component Units with Health Insurance, Welfare Fund, or Medicare Part B coverage

105
Differencesbetween Expected Recognition
and Actual PeriodYear Experience (Years) 2016 2017 2018 2019 2020 2021 2022 2023 2024 2025 2026 20272016 1 (120,146,814)$ 6.81 (17,642,704) (17,642,704) (17,642,704) (17,642,704) (17,642,704) (17,642,704) (14,290,590) 0 0 0 0 02017 519,255,914$ 6.81 0 76,249,033 76,249,033 76,249,033 76,249,033 76,249,033 76,249,033 61,761,716 0 0 0 02018 2,293,748,135$ 6.86 0 0 334,365,617 334,365,617 334,365,617 334,365,617 334,365,617 334,365,617 287,554,433 0 0 02019 9,362,492,183$ 7.09 0 0 0 1,320,520,759 1,320,520,759 1,320,520,759 1,320,520,759 1,320,520,759 1,320,520,759 1,320,520,759 118,846,870 02020 (5,819,208,728)$ 7.16 0 0 0 0 (812,738,649) (812,738,649) (812,738,649) (812,738,649) (812,738,649) (812,738,649) (812,738,649) (130,038,185)2021 221,150,044$ 7.00 0 0 0 0 0 31,592,863 31,592,863 31,592,863 31,592,863 31,592,863 31,592,863 31,592,866
Net increase (decrease) in OPEB Expense (17,642,704)$ 58,606,329$ 392,971,946$ 1,713,492,705$ 900,754,056$ 932,346,919$ 935,699,033$ 935,502,306$ 826,929,406$ 539,374,973$ (662,298,916)$ (98,445,319)$
1Represents the Future Working Lifetime as of 6/30/2016
NEW YORK CITY HEALTH BENEFITS PROGRAM
Governmental Accounting Standards Board Statements No. 74 and No. 75 (GASB 74/75)
City of New York (Excluding Component Units)
Increase (Decrease) in OPEB Expense Arising from the Recognition ofDifferences between Expected and Actual Experience

106
DifferencesDue to Recognition
Changes in PeriodYear Assumptions (Years) 2017 2018 2019 2020 2021 2022 2023 2024 2025 2026 20272017 (10,974,634,867)$ 6.81 (1,611,546,970) (1,611,546,970) (1,611,546,970) (1,611,546,970) (1,611,546,970) (1,611,546,970) (1,305,353,047) 0 0 0 02018 2,513,081,199$ 6.86 0 366,338,367 366,338,367 366,338,367 366,338,367 366,338,367 366,338,367 315,050,997 0 0 02019 (6,277,325,926)$ 7.09 0 0 (885,377,423) (885,377,423) (885,377,423) (885,377,423) (885,377,423) (885,377,423) (885,377,423) (79,683,965) 02020 2,507,506,383$ 7.16 0 0 0 350,210,389 350,210,389 350,210,389 350,210,389 350,210,389 350,210,389 350,210,389 56,033,6602021 3,188,945,903$ 7.00 0 0 0 0 455,563,700 455,563,700 455,563,700 455,563,700 455,563,700 455,563,700 455,563,703
Net increase (decrease) in OPEB Expense (1,611,546,970)$ (1,245,208,603)$ (2,130,586,026)$ (1,780,375,637)$ (1,324,811,937)$ (1,324,811,937)$ (1,018,618,014)$ 235,447,663$ (79,603,334)$ 726,090,124$ 511,597,363$
NEW YORK CITY HEALTH BENEFITS PROGRAM
Governmental Accounting Standards Board Statements No. 74 and No. 75 (GASB 74/75)
City of New York (Excluding Component Units)
Increase (Decrease) in OPEB Expense Arising from the Recognition ofChanges in Assumptions

107
Differencesbetween Projected
and ActualEarnings on RecognitionOPEB Plan Period
Year Investments (Years) 2016 2017 2018 2019 2020 2021 2022 2023 2024 20252016 127,556,503$ 5 25,511,301 25,511,301 25,511,301 25,511,301 25,511,299 0 0 0 0 02017 151,739,578$ 5 0 30,347,916 30,347,916 30,347,916 30,347,916 30,347,914 0 0 0 02018 139,325,804$ 5 0 0 27,865,161 27,865,161 27,865,161 27,865,161 27,865,160 0 0 02019 86,189,187$ 5 0 0 0 17,237,837 17,237,837 17,237,837 17,237,837 17,237,839 0 02020 92,149,713$ 5 0 0 0 0 18,429,943 18,429,943 18,429,943 18,429,943 18,429,941 02021 156,459,391$ 5 0 0 0 0 0 31,291,878 31,291,878 31,291,878 31,291,878 31,291,879
Net increase (decrease) in OPEB Expense 25,511,301$ 55,859,217$ 83,724,378$ 100,962,215$ 119,392,156$ 125,172,733$ 94,824,818$ 66,959,660$ 49,721,819$ 31,291,879$
Differences between Projected and Actual Earnings on OPEB Plan InvestmentsIncrease (Decrease) in OPEB Expense Arising from the Recognition of
City of New York (Excluding Component Units)
Governmental Accounting Standards Board Statements No. 74 and No. 75 (GASB 74/75)
NEW YORK CITY HEALTH BENEFITS PROGRAM

108
Component Amount
a. Service Cost 5,292,309,204$ b. Interest on the Total OPEB Liability 3,277,919,924c. Differences between Expected and Actual Experience 900,754,056d. Changes of Assumptions (1,780,375,637)e. Employee Contributions 0f. Projected Earnings on OPEB Plan Investments (168,269,448)g. Differences between Projected and Actual Earnings on Plan Investments 119,392,156h. OPEB Plan Administrative Expenses 0i. Other Changes in Fiduciary Net Position 175,000j. Other Changes in Total OPEB Liability1 (1,457,818,456)
Total OPEB Expense 6,184,086,799$
1Repeal of Cadillac Tax
NEW YORK CITY HEALTH BENEFITS PROGRAM
Governmental Accounting Standards Board Statements No. 74 and No. 75 (GASB 74/75)
City of New York (Excluding Component Units)
Components of OPEB Expense for the Fiscal Year Ended June 30, 2020

109
Component Amount
a. Service Cost 5,572,683,539$ b. Interest on the Total OPEB Liability 3,141,518,459c. Differences between Expected and Actual Experience 932,346,919d. Changes of Assumptions (1,324,811,937)e. Employee Contributions 0f. Projected Earnings on OPEB Plan Investments (160,260,664)g. Differences between Projected and Actual Earnings on Plan Investments 125,172,733h. OPEB Plan Administrative Expenses 54,000i. Other Changes in Fiduciary Net Position 175,000j. Other Changes in Total OPEB Liability 0
Total OPEB Expense 8,286,878,049$
NEW YORK CITY HEALTH BENEFITS PROGRAM
Governmental Accounting Standards Board Statements No. 74 and No. 75 (GASB 74/75)
City of New York (Excluding Component Units)
Components of OPEB Expense for the Fiscal Year Ended June 30, 2021

110
Recognized OPEB Expense
Deferred Resources Outflows Inflows Outflows Inflows Outflows Inflows Outflows Inflows Outflows Inflows Outflows Inflows
Differences between Expected and Actual Experience 0$ 102,504,110$ 443,006,881$ 0$ 1,959,382,518$ 0$ 8,041,971,424$ 0$ 0$ 5,006,470,079$ 189,557,181$ 0$
Changes of Assumptions 0 0 0 9,363,087,897 2,146,742,832 0 0 5,391,948,503 2,157,295,994 0 2,733,382,203
Net Difference between Projected and Actual Earnings on OPEB Plan Investments 102,045,202 0 121,391,662 0 111,460,643 0 68,951,350 0 73,719,770 0 125,167,513 0
Total 102,045,202$ 102,504,110$ 564,398,543$ 9,363,087,897$ 4,217,585,993$ 0$ 8,110,922,774$ 5,391,948,503$ 2,231,015,764$ 5,006,470,079$ 3,048,106,897$ 0$
Amounts reported as Deferred Outflows of Resources and Deferred Inflows of Resources related to OPEB will be recognized in OPEB Expense as follows:
Fiscal YearEnded June 30201620172018201920202021202220232024202520262027
Fiscal Year Ending June 30, 2020Fiscal Year Ending June 30, 2017 Fiscal Year Ending June 30, 2018 Fiscal Year Ending June 30, 2019Fiscal Year Ending June 30, 2016$8,459,447,718 $6,184,086,799$7,035,733,262$7,641,551,274 $5,749,238,512
$7,868,595($17,642,704)($14,290,590)
2017
($1,504,950,021)($1,504,950,021)($1,504,950,021)($1,504,950,021)($1,504,950,023)($1,535,297,937)
2016$7,868,597$7,868,597$7,868,597$7,868,597
$435,143,336($1,243,591,331)
2018
$728,569,145$728,569,145$728,569,145$728,569,145$728,569,144$700,703,984$602,605,430
2019
$452,381,173
Governmental Accounting Standards Board Statements No. 74 and No. 75 (GASB 74/75)
NEW YORK CITY HEALTH BENEFITS PROGRAM
$518,448,441$518,448,441$518,448,441
Fiscal Year Ending June 30, 2021$8,286,878,049
2021
$518,448,441
2020
($444,098,317)($444,098,317)($444,098,317)($444,098,317)($444,098,319)
$487,156,569
OPEB Expense, Deferred Outflows of Resources, Deferred Inflows of Resources
City of New York (Excluding Component Units)
$518,448,442$487,156,563
($74,004,525)
$435,143,336$39,162,905
($462,528,260)($462,528,260)
$452,381,173$452,381,173$452,381,173$452,381,175

111
For the Fiscal Year ended June 30, 2021, the City recognized OPEB Expense of $8,286,878,049.
At June 30, 2021, the City reported total Deferred Outflows of Resources and Deferred Inflows of Resources related to OPEB from the following sources:
Deferred DeferredOutflows Inflows
of Resources of Resources
Differences between Expected and Actual Experience 6,684,783,503$ 4,208,022,020$
Changes of Assumptions 5,588,195,539 6,538,093,674
Net Difference between Projected and Actual Earnings on OPEB Plan Investments 242,798,176 0
Total 12,515,777,218$ 10,746,115,694$
Amounts reported as Deferred Outflows of Resources and Deferred Inflows of Resources related to OPEB will be recognized in OPEB Expense as follows:
Fiscal YearEnded June 30 Amount2021 (267,292,285)$ 2022 (294,288,086)2023 (16,156,048)2024 1,112,098,8882025 491,063,5182026 63,791,2082027 413,152,044
NEW YORK CITY HEALTH BENEFITS PROGRAM
Governmental Accounting Standards Board Statements No. 74 and No. 75 (GASB 74/75)
City of New York (Excluding Component Units)
OPEB Expense, Deferred Outflows of Resources, Deferred Inflows of Resources

112
SECTION IV – CERTIFICATION
In the opinion of the undersigned actuaries, the actuarial assumptions used are reasonable and appropriate for purposes of measurement of the obligations under GASB 74 and 75 contained herein. The cost results and actuarial exhibits presented in this Report were determined on a consistent and objective basis in accordance with applicable Actuarial Standards of Practice and generally accepted actuarial procedures. To the best of the knowledge of the undersigned, the information fairly presents the actuarial position of the postretirement benefits under the City’s Health Benefits Program in accordance with the requirements of GASB Statements No. 74 and 75 as of June 30, 2021.
Future actuarial measurements may differ significantly from current measurements due to, but not limited to, the following factors: retiree group benefits program experience differing from that anticipated by the assumptions, changes in assumptions, changes expected as part of the natural operation of the methodology used for these measurements (such as the end of an amortization period), and changes in plan provisions, applicable law or regulations. Small variations in approximations and estimates may lead to significant changes in actuarial measurements. An analysis of the potential range of such future differences other than the required disclosures related to the sensitivity to discount rate and healthcare cost trend rate assumptions is beyond the scope of this Report.
The actuaries whose signatures appear below are Members of the American Academy of Actuaries (AAA) and, together, meet the Qualification Standards of the AAA to render this Statement of Actuarial Opinion.
_____________________________________________ Sherry S. Chan, FSA, EA, MAAA, FCA Chief Actuary New York City Office of the Actuary
_____________________________________________ Thomas O’Hara, ASA, MAAA Administrative Actuary New York City Office of the Actuary

113
SECTION V – SUMMARY OF PLAN PROVISIONS
Plan Sponsor: New York City. The valuation includes results for the component units, HHC, NYCHA, SCA, and WFA that participate under the same plan terms. In addition, the valuation includes results for ECF, which participates in the New York State Health Insurance Program (NYSHIP), described later in this section.
Plan Name: New York City Health Benefits Program (Program)
Eligibility
City Retirees can participate if they satisfy one of the following criteria:
Retirees
• At least 10 years of credited service as a member of the NYCRS (five years of credited service if employed on or before December 27, 2001; 15 years of service if a member of TRS or BERS, represented by the United Federation of Teachers and employed after April 27, 2010; no service requirement for accidental disability retirements) and be working at least 20 hours a week at termination of active service, plus
• Receives a pension check from the NYCRS (or is eligible for certain Deferred Retirement benefits). Payability date varies by NYCRS and group.
Terminated Vested Members
• The same as Retirees once in receipt of a pension benefit.
Members Eligible for Certain Deferred Retirement Benefits
• Certain members of NYCERS, TRS, and BERS who have at least 20 years of credited service are eligible for up to five years of OPEB coverage prior to commencement of pension benefits.
Members Terminated for Other than Immediate Retirement
• Members who do not have retiree medical coverage under the retiree medical provisions are eligible to continue

114
coverage under COBRA provisions. COBRA continuation coverage is generally limited to certain maximum periods (i.e. generally to the end of 36 months under New York State insurance law).
Spouses and Other Dependents
• Spouses of retirees are covered. Children of retirees are covered to age 26, or longer if disabled. Dependent coverage is terminated when a retiree dies, except in the following situations:
o Lifetime coverage is provided to the surviving spouse or domestic partner, and to children up to age 26 of uniformed members of the Police or Fire Departments who die in the Line of Duty.
o Effective November 13, 2001, other surviving spouses of retired uniformed members of the Police and Fire Departments may elect to continue coverage for life by paying 102% of the stated premium.
o Effective August 31, 2010, surviving spouses of retired uniformed members of the Departments of Correction and Sanitation may elect to continue coverage for life by paying 102% of the stated premium.
ECF Retirees
• Age 55 with 10 years of service.
• Employees who retire after 1995 are also eligible for dental coverage.
Terminated Vested Members
• 10 years of service, benefit commences upon retirement.
Disability Retirement
• 10 years of service
Spouses and Other Dependents

115
• OPEB benefits continue for dependents after the death of the retiree.
TIAA Retirees
• Hired before July 1, 1976: Age 55 with 10 years of service.
• Hired on or after July 1, 1976: Age 62 with 15 years of service.
Exception for Executive Compensation Plan (ECP) employees: Age 55 with 10 years of service.
Terminated Vested Members
• Hired before July 1, 1976: Age 55 with 15 years of service.
• Hired between July 1, 1976 and August 31, 1985: Age 62 with 10 years of service and no subsequent full-time employment at another college, university, or institution of post-secondary education.
• Hired on or after September 1, 1985: Age 62 with 15 years of service and no subsequent full-time employment at another college, university, or institution of post-secondary education.
Exception for ECP Employees: Age 55 with 10 years of service and no subsequent full-time employment at another institution of post-secondary education.
Disability Retirement
• 10 years of service and receiving a benefit from the Optional Retirement Program of TIAA.
Covered Benefits
The City and certain Component Units provide OPEB through the Program. In addition, the City provides certain Program benefits through the Stabilization Fund. The City and certain Component Units contribute to various Welfare Funds, generally negotiated with and administered by various labor organizations. The City and certain Component Units also reimburse Medicare Part B Premiums paid by eligible retirees and other eligible beneficiaries.
OPEB Coverage by Agency: The City subsidizes only some of the OPEB for various groups of NYCRS retirees.

116
The table below presents, by payroll agency, those benefits assumed to be provided by the City for purposes of the Fiscal Year 2021 OPEB valuation. There is no change in coverage from the prior OPEB valuation.
For the Component Units included in the OPEB valuation, the benefit categories not paid by the City are reflected in the results of the individual Component Units (i.e. Payroll Agencies in bold below).
New York City Retirement Systems Components of Post-Retirement Medical Benefits Paid By New York City
Payroll Agency Health Insurance Welfare Fund 2 Medicare Part B
Charter Schools Yes Yes Yes Custodial Engineer Yes Yes Yes CUNY - Senior Colleges No1 Yes 3 Yes CUNY - Community Colleges Yes Yes Yes Correction Department Yes Yes Yes CP Engineers No1 No No Courts (State) Yes Yes Yes DA Investigators Yes Yes Yes Department of Education Yes Yes Yes HSG Develop Corp No No No Health and Hospital Corp No1 No Yes Housing Authority No1 No No1 Housing Police (Retirees Only) Yes Yes No1 Regular Yes Yes Yes REMIC NA NA NA Sanitation Yes Yes Yes School Construction Authority Yes No Yes State Housing No No No Transit Authority No1 No No Transit Police (Retirees Only) Yes Yes Yes Triboro Bridge No No No Water Finance Authority No1 No Yes POLICE Yes Yes Yes FIRE Yes Yes Yes TIAA - Senior Colleges No1 No Yes TIAA - Community Colleges Yes Yes Yes ECF No No No LOD Survivors Yes No Yes
1 The City pays these benefits upfront, not out of the NYCRHBT, and then is reimbursed. 2 Welfare Fund coverage not available to pre-1/1/1971 retirees. LOD death beneficiary coverage provided through
Stabilization Fund. 3 The City pays the Welfare Fund for non-pedagogical CUNY Senior Colleges retirees.
Health Insurance
The City and certain Component Units currently provide Basic Medical Coverage (Basic Coverage) at no cost if a non-Medicare-eligible retiree participates in HIP HMO or GHI/EBCBS

117
indemnity arrangement, or a Medicare-eligible retiree participates in HIP HMO or GHI/EBCBS Senior Care.
Basic Coverage includes hospital and physician coverage and excludes coverage for prescription drugs. GHI/EBCBS Senior Care coordinates with Medicare Part A and Medicare Part B on a supplemental basis. Under the HIP HMO, Medicare-eligible retirees generally participate in a Medicare Advantage Plan under Medicare Part C. Cost sharing provisions (e.g. deductibles, co-payments) are assumed to change over time to contain the overall cost of coverage. Basic Coverage under other plans may require additional retiree contributions.
Other plans available to non-Medicare-eligible retirees include Aetna EPO, CIGNA, Empire HMO, Empire EPO, GHI HMO, MetroPlus, and Vytra Health Plans.
Other plans available to Medicare-eligible retirees include Medicare supplemental plans, such as Empire Medicare-Related Coverage and various Medicare Advantage arrangements (e.g. MediBlue).
Retirees of the Component Units included in this valuation, other than ECF, have the same coverage as City retirees. It is the understanding of the OA that ECF retirees are covered by NYSHIP.
Retirees may waive Basic Coverage.
The City and the Component Units do not provide the same individual both subscriber and dependent coverage.
Medicare Part B Premium Reimbursement
Upon application, the City and certain Component Units reimburse the Medicare Part B Premium for all Medicare-eligible retirees and eligible covered dependents. The reimbursement includes the base Part B premium and any additional premium charged to high-income retirees via the Income Related Monthly Adjustment Amounts (IRMAA).
Welfare Funds
The City and certain Component Units pay annual per capita contributions directly to the various Welfare Funds that cover retirees for certain health care benefits not provided through the Basic Coverage. Welfare Fund benefits may include, but are not limited to, prescription drug, vision, and dental coverage, sometimes with dollar limits. In addition, the Welfare Funds provide non-health related benefits such as life insurance, accidental death or disability benefits, legal services, or short or long-term disability benefits. The Welfare Funds are generally separate legal entities, often administered by various labor organizations.

118
Information on the Welfare Funds is available in a Special Report issued by the Office of the Comptroller (Comptroller Report)1.
Contributions are sometimes made for active employees to Welfare Funds that are combined with retirees. Alternatively, contributions are made to separate retiree only funds. The Welfare Funds’ per capita contributions apply only to retirees and not to covered dependents even though a particular Fund may choose to extend its coverage to dependents. The contributions for retirees are generally made only on behalf of individuals who retired in or after 1971. In recent years, a portion of the Welfare Fund contributions has been reimbursed by the Stabilization Fund. The valuation includes Welfare Fund contributions whether they come from the Stabilization Fund or directly from the City or Component Units.
The per capita contribution amounts change periodically based on negotiated contract provisions. In addition to prospective increases, the collective bargaining agreements have provided for ad hoc lump-sum payment amounts to the Welfare Funds. The valuation assumes that the contribution amount to the Welfare Funds will increase at the Welfare Plan trend rates.
Stabilization Fund
The City maintains and has historically contributed to the Health Insurance Stabilization Reserve Fund (Stabilization Fund). Certain Component Units are understood to have contributed to the Stabilization Fund in situations where the GHI/EBCBS premiums paid would be lower than the HIP benchmark premium. In addition, the Stabilization Fund receives dividends from participating insurance carriers including the GHI/EBCBS arrangement.
The Stabilization Fund has been used to provide the following health related benefits:
• A GHI Home Care benefit for certain non-Medicare participants.
• Welfare Fund contributions for the Line-of-Duty beneficiaries. In addition, the Stabilization Fund has reimbursed the City, various Component Units, and other entities participating in the Program for a portion of Welfare Fund contributions.
• Injectables and Chemotherapy Drug plan for certain non-Medicare participants.
• Utilization review for the GHI/EBCBS arrangement, provided by the New York County Health Services Review Organization.
• Healthline (Intracorp) providing pre-certification of hospitalization for GHI/EBCBS participants.
1 Analysis of the Financial and Operating Practices of Union-Administered Benefit Funds with Fiscal Years Ending in
Calendar Year 2018, issued October 16, 2020, https://comptroller.nyc.gov/wp-content/uploads/documents/SR20-083S.pdf

119
In addition, under the 2014 Municipal Labor Committee (MLC) Health Savings Agreement, the Stabilization Fund had agreed to provide up to $60 million in Fiscal Year 2019 and each year thereafter to the Welfare Funds. In addition, the Stabilization Fund has made a contribution to fill the gap between savings realized from the program savings initiatives and the required savings target for the fiscal year.
ECF Coverage
NYSHIP health benefits consist of a hospital program, medical program covering amounts after copayment at participating providers, managed mental health and substance abuse program, and card-based prescription drug program. NYSHIP requires retirees to enroll in Medicare Part A and Medicare Part B, and mandates that participants be reimbursed for Medicare Part B Premiums. NYSHIP provides drug coverage to Medicare eligible participants through a Medicare Part D Employer Group Waiver Plan (EGWP).

120
SECTION VI – ACTUARIAL ASSUMPTIONS AND METHODS
General
Basis for Assumptions
The actuarial assumptions used in the Fiscal Year 2021 OPEB valuation are a combination of those used in the NYCRS pension actuarial valuations and those specific to the OPEB valuations.
For Fiscal Year 2019, the OA conducted a full review of the actuarial assumptions and methods used to fund the NYCRS. These reviews led to formalized recommendations titled “Proposed Changes in Actuarial Assumptions and Methods Used in Determining Employer Contributions for Fiscal Years Beginning on and After July 1, 2018 for [NYCRS],” and were adopted by all five of the NYCRS Boards. These are available on the Reports page of the OA website (www.nyc.gov/actuary) and are referred to as the 2019 A&M Reports.
On July 27, 2021, the Actuary issued a memorandum titled “Proposed Changes to Actuarial Assumptions and Methods.” The actuarial assumptions and methods described in that memorandum amend certain assumptions and methods from the 2019 A&M. This revised set of actuarial assumptions and methods are referred to as the “Revised 2021 A&M.”
Actuarial Cost Method
Entry Age Normal cost method, level percent of pay calculated on an individual basis.
Valuation Date June 30, 2020
Measurement Date
June 30, 2021
Asset Valuation Market value of assets.
Discount Rate 2.19% for benefits provided by the City, 2.18% for benefits provided by Component Units. Results as of the June 30, 2020 Measurement Date are presented at 2.68% for benefits provided by the City, and 2.66% for Component Units.
The projection of cash flows used to determine the discount rate assumed that the City will contribute at a rate equal to the pay-as-you-go amounts plus the average of contributions made over the most recent five-year period in excess of the pay-as-you-go amounts. The contributions apply first to service cost of future plan members based

121
on projection of overall payroll at 3.0% and normal cost rate for Tier 6 members of each of the NYCRS. Remaining contributions are applied to the current and past service costs for current plan members.
Based on those assumptions, the City’s OPEB plan’s fiduciary net position was projected to be available to make all projected OPEB payments for current active and inactive employees until 2028. After that time, benefit payments will be funded on a pay-as-you go basis. The discount rate is the single equivalent rate which results in the same present value as discounting future benefit payments made from assets at the long-term expected rate of return and discounting future benefit payments funded on a pay-as-you-go basis at the Municipal Bond 20-year Index Rate.
Results for the OPEB plans for Component Units are presented using a discount rate of the Municipal Bond 20-year Index Rate, since there is no pre-funding assumed for these plans.
Long-Term Expected Rate of Return
4.00% net of investment expenses, which includes an inflation rate of 2.50%.
The long-term rate of return is based on the NYCRHBT’s investment policy and was determined using a building-block method in which best-estimate ranges of expected future real rates of return (i.e. expected returns, net of investment expense and inflation) are developed separately from assumed inflation.
Asset Class Target Allocation
as of June 30, 2021 Long-Term Expected Real Rate of Return
Cash and cash equivalents
100% 1.50%
Nominal long-term expected rates of return for these assets are equal to the sum of the above expected long-term real rate and the expected long-term inflation rate of 2.50%.
Municipal Bond 20-year Index Rate
S&P Municipal Bond 20-Year High Grade Rate Index, which was 2.18% as of June 30, 2021. Results as of the June 30, 2020 Measurement Date are presented using the same index, which was 2.66% as of June 30, 2020.
Consumer Price Index
2.50%

122
General Wage Increases
3.00% per annum which includes an inflation rate of 2.50% and a general wage increase rate of 0.50%. For more information see the 2019 A&M Reports.
Assumed Healthcare Cost Trend Rate (HCCTR)
Fiscal Year Ending
Pre-Medicare Plans
Medicare Plans
Medicare Part B Premiums
Welfare Fund Contributions
2021 6.75% 4.90% 3.83%1 3.50% 2022 6.50% 4.90% 5.00% 3.50% 2023 6.25% 4.80% 5.00% 3.50% 2024 6.00% 4.80% 5.00% 3.50% 2025 5.75% 4.70% 5.00% 3.50% 2026 5.50% 4.70% 5.00% 3.50% 2027 5.25% 4.60% 5.00% 3.50% 2028 5.00% 4.60% 5.00% 3.50% 2029 4.75% 4.50% 5.00% 3.50%
2030 and Later 4.50% 4.50% 5.00% 3.50%
1 Reflects actual calendar year premium for the first 6 months of FY22 (July 2021 to December 2021) and 5.0% trend for the remaining 6 months.
The pre-Medicare and Medicare plan trends were developed for FY 2021 using health trend information from various sources, including City premium trend experience for HIP HMO and GHI/EBCBS, public sector benchmark survey for other large plan sponsors, the Medicare Trustees’ Report, and the SOA Getzen model.
In recent years Medicare Part B premium increases have averaged between 5% and 6%, ignoring the impact of the hold harmless provision. These increases can be attributable to factors such as the increasing prices of health care services, high cost of new technologies, and increasing utilization. While the Medicare trustees project the Part B premium to increase 6% for 2022, beyond that point they expect the increases to average 5.8% out to 2029. These increases do not account for the hold harmless provision which may mitigate them somewhat.
Historical negotiated increase rates for the larger Welfare funds have averaged between 2% and 3% in recent years, which is lower than the anticipated trend on the underlying costs of benefits provided by these funds. However, the City periodically makes one-time lump sum

123
contributions to the Welfare Funds. For these reasons the Welfare Fund contribution trend was assumed to be 3.5%.
Dependent Coverage
Non-contributory Basic Medical Coverage and Part B premium reimbursement for dependents are assumed to terminate when a retiree dies, except for Line of Duty beneficiaries. Certain other survivors of POLICE, FIRE, and uniformed members of the Departments of Correction and Sanitation are eligible for a lifetime COBRA continuation benefit. These individuals contribute 102% of the premium but the valuation includes an additional estimated cost above the value of their COBRA contribution because COBRA participants typically utilize services at a much higher rate than active participants. The valuation assumes that 30% of eligible spouses will elect the lifetime continuation benefit.
Dependents Male retirees were assumed to be four years older than their wives, and female retirees were assumed to be two years younger than their husbands; for POLICE and FIRE participants, husbands are assumed to be two years older than their wives.
Child dependents of current retirees are assumed to receive coverage until age 26.
Children are assumed to be covered for eight years after retirement plus an additional five years for service retirements of POLICE, FIRE, and NYCERS retirees who were eligible to retire based only on service and no minimum age.
Dependent allocation assumptions are shown below and are based on recent experience.

124
DEPENDENT COVERAGE ASSUMPTIONS
Group NYCERS - HHC
NYCERS - NYCHA
NYCERS - Other TRS BERS POLICE FIRE TIAA
Male - Single Coverage 40% 35% 35% 50% 45% 15% 10% 55% - Spouse 40% 35% 35% 30% 45% 10% 20% 40% - Child/No Spouse 5% 10% 5% 5% 2% 10% 5% 2.5% - Spouse and Child 15% 20% 25% 15% 8% 65% 65% 2.5% Female - Single Coverage 70% 75% 70% 60% 60% 45% 10% 55% - Spouse 20% 15% 20% 30% 35% 10% 20% 40% - Child/No Spouse 5% 8% 5% 5% 2.5% 25% 5% 2.5% - Spouse and Child 5% 2% 5% 5% 2.5% 20% 65% 2.5%
Note: For accidental death, 70% of POLICE and 80% of FIRE members are assumed to have family coverage.

125
Active Off Payroll (AOP) Liabilities
40% of the measured liability of the AOP population as of June 30, 2019, which is roughly equivalent to assuming 60% of the AOP members will terminate membership prior to vesting and not receive OPEB. Active members off payroll is no longer treated as a separate status as of June 30, 2020. Those on a known short-term leave of absence are treated as actives, and the remaining members are included as inactive members entitled to but not yet receiving benefits if they have met the OPEB vesting requirements. Otherwise, they are not included in the valuation.
Participation Rates
Based on recent experience.
Actual elections are used for current retirees. Some current retirees not eligible for Medicare are assumed to change elections upon attaining age 65 based on election patterns of Medicare-eligible retirees.
For current retirees who appear to be eligible for health coverage but have not made an election (i.e. non-filers), the valuation reflects single GHI/EBCBS coverage and Part B premium benefits only, to approximate the obligation if these individuals were to file for coverage. For future retirees, the portion assumed not to file for future benefits and is valued similarly, are as follows.
NYCERS - HHC 13% NYCERS - NYCHA 13% NYCERS - Others 10% TRS 6% BERS 12% POLICE 1% FIRE 2% TIAA 0%
This non-filer group also includes some participants who do not qualify for coverage because they were working less than 20 hours a week at termination.
Detailed assumptions for future Program retirees are presented below.

126
PLAN PARTICIPATION ASSUMPTIONS
Benefits NYCERS - HHC
NYCERS - NYCHA
NYCERS - Other TRS BERS POLICE FIRE TIAA
Pre-Medicare - GHI/EBCBS 72% 65% 72% 80% 70% 85% 80% 90% - HIP HMO 20% 26% 20% 8% 16% 9% 12% 6% - Other HMO 4% 4% 4% 2% 2% 4% 6% 4% - Waiver 4% 5% 4% 10% 12% 2% 2% 0% Medicare - GHI 72% 72% 72% 90% 78% 85% 80% 90% - HIP HMO 20% 20% 20% 6% 16% 9% 12% 6% - Other HMO 4% 4% 4% 2% 2% 4% 6% 4% - Waiver 4% 4% 4% 2% 4% 2% 2% 0% Post-Medicare Migration
- Other HMO to GHI 0% 0% 0% 0% 0% 0% 0% 0% - HIP HMO to GHI 0% 23% 0% 25% 0% 0% 0% 0% - Pre-Med. Waiver - To GHI @ 65 0% 10% 0% 40% 67% 0% 0% 0% - To HIP @ 65 0% 10% 0% 40% 0% 0% 0% 0%

127
Per Capita Claim Costs
GHI/EBCBS plans are insured via a Minimum Premium arrangement while the HIP and many of the Other HMOs are community-rated. Costs reflect age-adjusted premiums for all plans.
Initial monthly premium rates used in valuations are shown below:
Plan Monthly Health Insurance
Costs FY2021
HIP HMO Non-Medicare Single $ 776.01
Non-Medicare Family $ 1,901.23 Medicare $ 181.58 GHI/EBCBS Non-Medicare Single $ 775.66 Non-Medicare Family $ 2,035.61 Medicare $ 194.14 Other HMOs1 Non-Medicare Single $ 1,160.34 Non-Medicare Family $ 2,701.42 Medicare Single $ 291.83 Medicare Family $ 576.92
1Other HMO premiums represent the total premium for medical (not prescription drug) coverage, including retiree contributions.
Additionally, the individual monthly rates at age 65 used in valuations are shown below:
Plan Monthly Costs @ Age 65
FY2021
HIP HMO Non-Medicare $ 1,748.12
Medicare $ 181.58 GHI/EBCBS Non-Medicare $ 1,784.57 Medicare $ 191.63 Other HMOs Varies by system

128
Claims data was generally not provided to the OA for the HIP coverage or for Other HMOs. OLR provided a copy of the claims component of the Fiscal Year 2021 GHI/EBCBS renewals. For the non-Medicare participants, retiree claims were not separated from active claims. The claims information provided was compared to the premium rates provided.
Based on information provided by OLR, estimates of margins that had been included in the premiums but expected to be refunded were removed from both the GHI and EBCBS non-Medicare premiums before age adjustment.
A retiree who elects Basic Medical Coverage other than the benchmark HIP and GHI/EBCBS plans is required to contribute the full difference in cost. The OA confirmed, based on data provided by OLR, that net employer premiums were consistent with the benchmark rates and stated policy regarding other coverage.
In valuing future retirees, the various monthly premium rates for Other HMOs were blended by proportion of enrollment.
Administrative Expenses
Assumed to be included in reported premium amounts.
Medicare Part D Drug coverage is offered to Program retirees via riders or through the Welfare Funds. It is the understanding of the OA that the City has filed for and is receiving the Medicare Part D Retiree Drug Subsidy (RDS) for a small number of retirees. It is also understood that some Welfare Funds participate in the RDS program, while others participate in Part D by providing EGWP drug benefits. The value of the RDS is not knowingly reflected herein, in accordance with GASB Statement 75 and Technical Bulletin No. 2006-1.
Medicare Part B Premiums
Calendar Year Monthly Premium 2013 - 2015 $ 104.90
2016 $ 109.97 2017 $ 113.63 2018 $ 125.85 2019 $ 134.43 2020 $ 143.21 2021 $ 146.97
Medicare Part B Premium reimbursement amounts have been updated to reflect actual premium rates announced for calendar years through 2021. Due to limited cost-of-living adjustments in Social Security

129
benefits, some Medicare Part B participants will not be charged the Medicare Part B premium originally projected or ultimately announced for those years. Thus, the valuation uses a blended estimate as a better representation of future Part B premium costs.
For the Fiscal Year 2020 OPEB valuation the annual premium used was $1,741.11, which is equal to 12 times an average of the Calendar Year 2020 and 2021 monthly premiums above.
For Calendar Year 2021, the monthly premium of $146.97 was determined as follows:
• 3.5% of the basic $104.90 monthly hold-harmless amount, assuming that there would be no claims made for the slight increase in Part B premiums for continuing retirees, and
• 96.5% of the announced premium of $148.50 for Calendar Year 2021, representing the proportion of the Medicare population that will pay the announced amount.
The Calendar Year 2020 monthly premium of $143.21 was determined similarly, using 3.5% of the $104.90 hold-harmless amount and 96.5% of the $144.60 rate that was in effect for Calendar Year 2020.
An additional 11.4% load is added to the base Medicare Part B Premium amounts each year to account for the income-related Medicare Part B premiums for high income individuals. This assumption was updated from the previous valuation to reflect more recent experience.
Medicare Part B Premium Reimbursement
90% of Medicare participants are assumed to claim reimbursement; based on historical data.
Welfare Funds It is the understanding of the OA that the benefits provided from the Welfare Funds are adjusted from time to time so that costs to the Welfare Funds do not exceed available assets and income and further, that the benefit type and levels provided to retirees also differ from the benefits provided to active employees even within the same fund.
The OPEB valuation reflects the Welfare Fund contribution, which in turn is used to pay various premiums or claims for coverage provided by each of the funds. Such coverage could potentially vary by age and could involve various cross subsidies within the pool of each fund
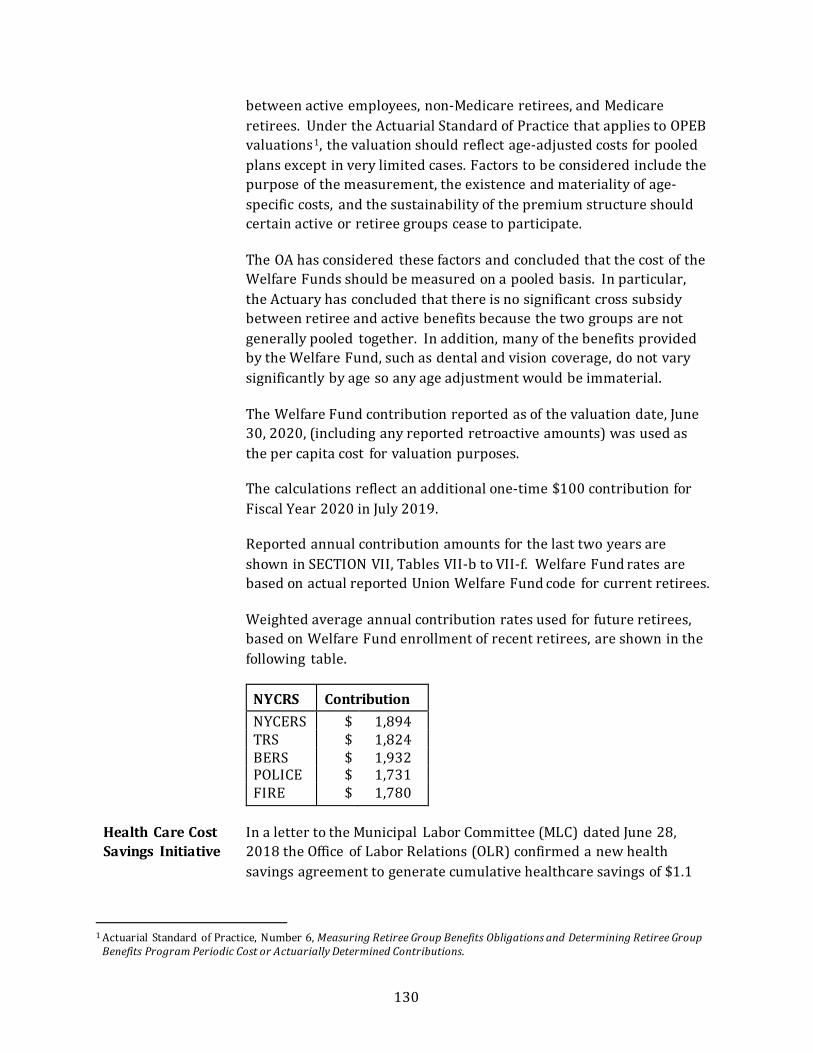
130
between active employees, non-Medicare retirees, and Medicare retirees. Under the Actuarial Standard of Practice that applies to OPEB valuations1, the valuation should reflect age-adjusted costs for pooled plans except in very limited cases. Factors to be considered include the purpose of the measurement, the existence and materiality of age-specific costs, and the sustainability of the premium structure should certain active or retiree groups cease to participate.
The OA has considered these factors and concluded that the cost of the Welfare Funds should be measured on a pooled basis. In particular, the Actuary has concluded that there is no significant cross subsidy between retiree and active benefits because the two groups are not generally pooled together. In addition, many of the benefits provided by the Welfare Fund, such as dental and vision coverage, do not vary significantly by age so any age adjustment would be immaterial.
The Welfare Fund contribution reported as of the valuation date, June 30, 2020, (including any reported retroactive amounts) was used as the per capita cost for valuation purposes.
The calculations reflect an additional one-time $100 contribution for Fiscal Year 2020 in July 2019.
Reported annual contribution amounts for the last two years are shown in SECTION VII, Tables VII-b to VII-f. Welfare Fund rates are based on actual reported Union Welfare Fund code for current retirees.
Weighted average annual contribution rates used for future retirees, based on Welfare Fund enrollment of recent retirees, are shown in the following table.
NYCRS Contribution NYCERS $ 1,894 TRS $ 1,824 BERS $ 1,932 POLICE $ 1,731 FIRE $ 1,780
Health Care Cost Savings Initiative
In a letter to the Municipal Labor Committee (MLC) dated June 28, 2018 the Office of Labor Relations (OLR) confirmed a new health savings agreement to generate cumulative healthcare savings of $1.1
1 Actuarial Standard of Practice, Number 6, Measuring Retiree Group Benefits Obligations and Determining Retiree Group
Benefits Program Periodic Cost or Actuarially Determined Contributions.

131
billion during Fiscal Years 2019 through 20211. The letter did not clarify how these savings would be achieved or how they would be spread across active and retiree groups. As details have not been communicated as of the close of Fiscal Year 2021, these changes are not reflected in this valuation. Separately, the City and OLR have agreed to replace the existing GHI Senior Care Medicare-supplement plan with a Medicare Advantage plan effective January 1, 2022. This changed is described in more detail in the “Subsequent Events” section below.
Age and Gender Related Morbidity
The premiums are age and gender adjusted for GHI/EBCBS, HIP, and Other HMOs. The assumed relative costs of coverage are consistent with information presented in the 2013 study Health Care Costs - From Birth to Death, sponsored by the Society of Actuaries.
For non-Medicare costs, a sample of factors used are:
Age Male Female Age Male Female 20 0.170 0.225 45 0.355 0.495 25 0.146 0.301 50 0.463 0.576 30 0.181 0.428 55 0.608 0.671 35 0.227 0.466 60 0.783 0.783 40 0.286 0.467 64 0.957 0.917
Children costs assume a factor of 0.229.
Medicare costs prior to age 65 assume an additional disability-related morbidity factor. A sample of factors used are:
Age Male Female Age Male Female 20 0.323 0.422 60 1.493 1.470 25 0.278 0.565 65 0.919 0.867 30 0.346 0.804 70 0.946 0.885 35 0.432 0.876 75 1.032 0.953 40 0.545 0.878 80 1.122 1.029 45 0.676 0.929 85 1.217 1.116 50 0.883 1.082 90 1.287 1.169 55 1.159 1.260 95 1.304 1.113
99 and Older 1.281 0.978
The age adjustment for the non-Medicare GHI/EBCBS premium reflects a 4.0% reduction in the GHI portion of the monthly premium (with the GHI portion representing $366.18 out of $775.66 for single coverage,
1 https://www1.nyc.gov/assets/olr/downloads/pdf/collectivebargaining/health-benefits-agreement-fiscal-years-2019-
2021.pdf

132
and $970.95 out of $2,035.61 for family coverage for Fiscal Year 2021 rates) and a 2.0% reduction in the EBCBS portion of the premium (with the EBCBS portion representing the remainder of the premiums) for the estimated margin anticipated to be returned.
COBRA There is no cost to the City for COBRA beneficiaries who enroll in community-rated HMO’s, including HIP, since these individuals pay their full community rate. However, there is a cost under the experience rated GHI/EBCBS coverage.
The valuation assumes 15% of employees not eligible for OPEB elect COBRA coverage for 15 months based on experience of other large employers. A lump-sum COBRA cost of $1,350 was assumed for terminations during Fiscal Year 2021. This amount is increased by the Pre-Medicare HCCTR for future years but is not adjusted for age-related morbidity.
Census data was not available for surviving spouses of POLICE, FIRE, Correction, nor Sanitation members who are entitled to lifetime COBRA continuation coverage because this benefit is administered directly by the insurance carriers. The number and obligation for the surviving spouses with lifetime coverage were estimated based on the current census data of POLICE and FIRE retirees and the projected number of deaths that would have occurred since the inception of this benefit on November 13, 2001 (and on August 31, 2010 for the Departments of Correction and Sanitation).
Stabilization Fund A 0.4% load is applied to all City GASB75 obligations to reflect certain benefits paid for retirees directly from the Stabilization Fund, which is unchanged from the Fiscal Year 2020 OPEB valuation. The load is not applicable to Component Units.
This amount is based on the historical five-year average allocation between active and retired participants in the Fiscal Years 2017 through 2021 Stabilization Fund benefits provided by OLR. The allocation takes into consideration retirees on average are older and have costlier medical benefits than actives, and also separates out Welfare Fund contribution reimbursements from other Stabilization Fund benefits.
Also, since Welfare Fund contributions reimbursed by the Stabilization Fund are considered a part of Welfare Fund benefits, they are not included in the determination of this load.

133
Implicit Rate Subsidy
These results reflect employer contributions for the City, HHC, and NYCHA that include certain expenditures that were initially nominally allocated to active costs rather than retiree costs.
The Implicit Rate Subsidy is the difference between the age-adjusted premiums approximating retiree claims costs and the actual cash premiums paid on behalf of retirees. The Implicit Rate Subsidy is assumed to be the additional cost for coverage of retirees that, in this case, had initially been allocated to active costs because the cash premiums do not vary by age of the covered individual.
The Implicit Rate Subsidy was estimated by the OA directly from the assumptions and data used in the OPEB valuations, reflecting the amounts paid for Basic Coverage and amounts paid to the Stabilization Fund directly as cash premium costs in lieu of the benchmark HIP premium.
Other OPEB Coverage
The valuation reflects an estimate for the cost of the implicit subsidy provided to terminated employees who elect COBRA.
The OA understands that medical benefits not provided under the Basic Coverage, such as prescription drug coverage, may be provided through optional riders. These optional riders may provide separately rated coverage with stand-alone premiums. Alternatively, prescription drug coverage may be available on an integrated basis with medical coverage for the other HMOs, but in those situations, medical-only coverage is offered if the Welfare Plan offers drug coverage.
The cost of riders is either fully paid by the employees or retirees who enroll in that benefit or is provided through various Welfare Funds. Thus, the City does not directly pay for any of the premiums of these separately rated riders. As such, any implicit subsidy in the price of these separately rated riders is paid by the actives that are assumed to pay more than the cost of their own rider coverage1. Thus, this valuation does not include any implicit subsidy on these separately rated riders in this valuation.
It is the understanding of the OA that no other OPEB, such as life insurance or long-term care benefits, are directly subsidized by the
1 See discussion in questions 4.117 and 4.118 of Implementation Guide No. 2017-2, Financial Reporting for
Postemployment Benefit Plans other than Pension Plans of GASB Statements 74 and 75. In particular, question 4.118 says “Only if the amounts expected to be paid by active employees exceed the expected claim costs, or the age-adjusted premiums approximating claim costs, on an ongoing basis can it be concluded that the active employees are subsidizing the inactive-plan member healthcare benefit.”

134
City through its general account 1. The City and the Component Units (except CUNY for certain retirees and ECF) generally provide most death and disability benefits through the NYCRS. Those benefits are measured as part of the obligations of the NYCRS and are not subject to GASB74 or GASB75.
Certain former New York State Court employees, who are covered by the City payment to NYSHIP, are not included in the OPEB valuation. The cash cost for these benefits paid from the Plan during Fiscal Year 2021 was negligible.
HCR Repeal The Affordable Care Act (ACA) continues to face uncertainty due to legal, regulatory, and legislative challenges. As of the writing of this Report, there has been no action finalized that is expected to have a significant impact on the measured obligation.
Subsequent Events
The GHI Senior Care Medicare-supplement plan will be replaced with a Medicare Advantage plan effective January 1, 2022. The GHI Senior Care plan will still be available to retirees but only on a contributory basis. This change is expected to produce significant cost savings for the City. However, since this change was announced after June 30, 2021, it will not be reflected until the June 30, 2022 valuation.
1 Such benefits may be funded through the Welfare Benefit Funds.

135
Educational Construction Fund
Basis for Assumptions
The demographic assumptions and salary scale used for ECF are based on the report “Development of Recommended Actuarial Assumptions for Other Post Employment Benefit Plans Actuarial Valuations Participating Agency Version,” dated August 2021 for the valuation year beginning April 1, 2020, prepared by Aon Hewitt (2020 State Report). This report has not yet been published on the State’s website. Since ECF employees and retirees participate in the New York State and Local Employees’ Retirement System and the New York State Health Insurance Program (NYSHIP), the Actuary adopted assumptions based on the recommendations of the 2020 State Report for this valuation. These assumptions reflect revisions to the demographic assumptions (e.g. mortality, withdrawal, retirement, and disability rates) and salary scale from those used in the prior OPEB valuation.
Participation Future retirees are assumed to continue to participate in the health and dental insurance programs.
Dependents Based on the 2020 State Report, 60% of males and 35% of females are assumed to cover a spouse at retirement.
Female dependent spouses are assumed to be three years younger than their husbands. Male dependent spouses are assumed to be two years older than their wives.
Per Capita Claims Costs
Based on the 2020 State Report, the costs were projected with trend to the fiscal year starting at the valuation date. This valuation relies on the costs developed for the State valuation as communicated by the State’s actuary, which were assumed to be suitable for this purpose. The age 65 rates are:
Plan Annual Costs @ Age 65
Non-Medicare $ 20,855 Medicare (Reflecting EGWP) $ 3,089

136
The premiums for health coverage are:
Empire Plan Monthly Health Insurance Costs Non-Medicare Single $ 1,074.87 Non-Medicare Family $ 2,452.24 Medicare Single $ 389.77 Medicare Family $ 1,107.40
65% of the Empire Plan (Medicare) premium is assumed to reflect the cost for prescription drug benefits in developing the trend applied to the Medicare premium.
Collectively bargained plan changes to the prescription drug program took effect on January 1, 2019. These changes improved the pricing terms thereby lowering the claims and increasing the rebates.
The premiums for dental coverage are:
Tier Monthly Dental Insurance Costs
Single $ 33.50 2-Person $ 65.00 Family $ 87.50
Age Related Morbidity
The per capita costs are adjusted for relative cost by age. These factors are a blend of the medical and prescription drug age-related morbidity factors set out in the 2020 State Report. A sample of factors used are:
Age Factor Age Factor
40 0.379 70 1.185 45 0.446 75 1.326 50 0.540 80 1.411 55 0.666 85 1.484 60 0.827 90+ 1.522 65 1.000
Medicare Part B Premium Reimbursement
100% of Medicare participants are assumed to receive reimbursement since retirees do not have to request reimbursement, unless where otherwise specified by ECF.
Medicare Part D NYSHIP is providing drug coverage for ECF Medicare retirees through an EGWP. For valuation purposes, only the net contribution amount is

137
valued for the Welfare Arrangements. The Federal Subsidies and Pharmaceutical Manufacturers’ brand discounts under the EGWP are reflected in the per capita costs for ECF.

138
CUNY
Basis for Assumptions
The assumptions used for CUNY TIAA for mortality, disability, and salary increases are the same as those used for TRS’ Pension Actuarial Valuation.
The OPEB valuation also assumes:
• Terminated employees with the required number of years of service for eligibility have no subsequent full-time employment at another college, university, or institution of post-secondary education.
• CUNY TIAA participants maintain any required TIAA account balances and annuity benefits.
Withdrawal and Retirement Rates
Based on TIAA experience.
Years of Service Withdrawal
Age Retirement
0 15.0% 55 2.0% 1 12.0% 56 2.0% 2 11.0% 57 2.0% 3 10.0% 58 2.0% 4 9.0% 59 2.0% 5 7.0% 60 3.0% 6 6.0% 61 3.0% 7 6.0% 62 4.0% 8 6.0% 63 5.0% 9 4.0% 64 6.0%
10 4.0% 65 10.0% 11 3.0% 66 5.0% 12 3.0% 67 5.0% 13 2.0% 68 5.0%
14-19 2.0% 69 10.0% 20+ 1.0% 70 100.0%

139
SECTION VII – DEMOGRAPHIC INFORMATION
The OA performed tests for reasonability on the census data provided for this valuation. On the basis of these tests, the Actuary believes the data is sufficiently complete and appropriate for determining the OPEB obligations in total for the City, for the Plan, and for the Component Units presented in this valuation.
In general, the census data used in this valuation is based upon the census data used in the June 30, 2020 (Lag) pension actuarial valuations of NYCRS to determine the Preliminary Fiscal Year 2022 employer contributions.
This census data was supplemented by information provided by OLR related to eligible retirees and other eligible beneficiaries covered by the Program. The census data does not generally include employees who are not yet participants in NYCRS.
In addition, census data was provided for the following groups not part of NYCRS:
• Active employees of CUNY who participate in TIAA or the Cultural Institutions Retirement System.
• Retired employees of CUNY who participate in TIAA and have been participating in the New York City Health Benefits Program.
• Line-of-Duty Survivors who are currently receiving continued lifetime medical coverage and Medicare Part B Premium reimbursements.
Census data was not available for individuals on COBRA continuation, including those surviving spouses of POLICE, FIRE, Corrections, or Sanitation members who are entitled to similar lifetime COBRA continuation coverage, as this benefit is administered directly by the insurance carriers. These participants’ obligation was estimated based on current census of POLICE, FIRE, Corrections, and Sanitation retirees.
The following tables set forth details of the census data used in this Report:

140
Plan Participation
Table VII-a
Pre-Medicare Headcounts GHI Indemnity HIP HMO Other HMO Waived Total
NYCERS* 15,139 3,907 587 778 20,411 TRS 9,594 899 83 943 11,519 BERS* 1,648 410 24 218 2,300 POLICE 26,533 2,308 1,335 1,351 31,527 FIRE 6,059 521 442 114 7,136 TIAA 14 0 2 0 16 LODW 39 11 3 0 53 Component Units: HHC 2,572 604 98 118 3,392 NYCHA 1,281 509 47 61 1,898 WFA 0 0 0 0 0
Medicare Headcounts GHI Indemnity HIP HMO Other HMO Waived Total
NYCERS* 40,044 9,168 2,976 3,086 55,274 TRS 61,775 4,088 1,488 3,405 70,756 BERS* 11,665 2,198 246 1,041 15,150 POLICE 15,507 1,617 1,410 527 19,061 FIRE 7,339 904 719 170 9,132 TIAA 816 59 45 0 920 LODW 609 93 21 0 723 Component Units: HHC 14,675 3,175 717 1,013 19,580 NYCHA 4,948 1,101 235 382 6,666 WFA 3 1 0 1 5 *These NYCRS’ headcounts include SCA retirees since the City is responsible for SCA’s health insurance coverage.

141
Annual Welfare Fund Contributions Table VII-b: NYCERS
UWF Description Count1 6/30/18 Rate2
6/30/19 Rate2
6/30/20 Rate2
001 NYC MANAGEMENT WELFARE FUND 8,451 $1,740 $1,940 $1,940 005 ALLIED BUILDNG INSPECTORS 365 1,740 1,740 1,740 010 ASST DEP WARDENS ASSC SBF 441 1,740 1,740 1,740 030 CORRECTION CAPTAINS ASSOC 1,901 1,590 1,590 1,590 035 CORRECT OFFICRS BEN ASSOC 9,586 1,740 1,740 1,740 040 NYS COURT OFFICERS ASSOC 0 830 830 830 045 CWA LOCAL 1182 SEC BEN FD 467 1,740 1,740 1,740 046 CWA L1181 SEC BEN FND RET 330 1,740 1,740 1,740 048 ADM FUND OF THE DEA PDCNY 5 1,573 1,573 1,573 049 ADM FUND OF THE DEA PDCNY 140 1,573 1,573 1,573 050 ADM FUND OF THE DEA PDCNY 97 1,573 1,573 1,573 055 ADMFD OF THE DEA PDCNY-DI 123 1,573 1,573 1,573 060 DISTRICT COUNCIL 37 37,391 1,940 1,940 1,940 061 DC 37 - (TAPD CIVILIANS) 3 1,940 1,940 1,940 066 ORG OF STAFF ANA-MEBA-FER 93 1,740 1,740 1,740 070 DOCTORS CNCL RET WELF FND 493 1,540 1,540 1,540 075 LOCAL 3 - ELEC INSPECTORS 30 1,740 1,740 1,740 080 NYC RET HLTH & WEL FD-FAD 152 1,740 1,740 1,740 081 UNKNOWN 1 1,740 1,740 1,740 100 NYC RET HLTH & WEL FD-LPN 619 1,740 1,740 1,740 105 OSA SUPV.EMG.MED.SVC.SPEC 35 1,740 1,740 1,740 106 OSA WELF FND-SCHOOL SEC/T 40 1,740 1,740 1,740 107 OSA WELF FUND -SAN CHIEFS 81 1,640 1,740 1,740 108 ORG OF STAFF ANALYSTS 2,560 1,740 1,740 1,740 109 LCL 14 MUN W F-CRANE OPER 30 1,740 1,740 1,740 110 L 1199 NHHSEU (PREV L144) 570 1,690 1,690 1,690 115 NYC RET HLTH &WEL FD-L306 16 1,740 1,740 1,740 120 LOCAL 333 INS FND NYC EES 184 1,740 1,740 1,740 130 TEAMSTERS L237 ADMIN FUND 41 2,220 2,220 2,220 131 UNKNOWN 47 1,940 1,940 1,940 135 RET CWA L1183 BOE H&W FND 115 1,853 1,853 1,853 140 1199 NHHSEU 403 1,740 1,740 1,740 155 CWA LOCAL 1180 ADMIN FUND 6,074 1,775 1,775 1,775 156 CWA LOCAL 1180 ADMIN FUND 1 1,775 1,775 1,775 160 NYC DEPY SHER ASS RET SBF 89 1,465 1,465 1,465 162 UFT WELFARE FUND 50 1,820 1,820 1,820 163 UFT WELFARE FUND 41 1,820 1,820 1,820

142
Table VII-b: NYCERS (continued)
UWF Description Count1 6/30/18 Rate2
6/30/19 Rate2
6/30/20 Rate2
164 COUNCIL OF SUPERVISORS AND ADMINISTRATORS
10 1,820 1,820 1,820
165 RET WELF FND AUTO SVC WKR 38 1,740 1,740 1,740 170 PBA (NYPD) 8 1,853 1,853 1,853 171 PBA (NYPD) (TA) 1,271 1,853 1,853 1,853 172 PBA (NYPD) (HA) 410 1,853 1,853 1,853 185 NYC RET HLTH&WEL FD-NYSNA 4,294 1,740 1,740 1,740 187 PAVERS & RDBULDERS INSPCT 33 1,740 1,740 1,740 188 LEEBA RETIREES WELF FUND 10 1,740 1,740 1,740 190 UNITED PROBATION OFFICERS 440 1,823 1,823 1,823 200 SANITATION OFF RET WEL FN 2,366 1,490 1,490 1,290 225 SOC NYPD LT BENEV ASSOCIA 2 1,665 1,665 1,665 226 SOC NYPD CAPT ENDOW ASSOC 5 1,665 1,665 1,665 228 SOC NYPD LT BENEV ASS0(T) 85 1,665 1,665 1,665 229 SOC NYPD CAPT END ASS (T) 22 1,665 1,665 1,665 230 SBA HLTH&WELF FUND/RET(T) 187 1,740 1,740 1,740 231 SOC NYPD LT BENEV ASSO(H) 61 1,665 1,665 1,665 232 SOC NYPD CAPT END ASSN(H) 32 1,665 1,665 1,665 233 SBA HLTH&WELF FUND/RET(H) 102 1,740 1,740 1,740 235 TEAMSTERS L237 ADMIN FUND 7,378 2,220 2,220 2,220 250 UNIF SANMEN'S ADM FUND 6,936 2,009 2,009 2,009 251 LCL 831 UNF SANIT WORKER 234 1,940 1,940 1,940 260 LCL 300 RETIREE WELF FUND 427 1,740 1,740 1,740 261 LEEBA RETIREES WELF FUND 9 1,740 1,840 1,840 262 LEEBA RETIREE WELF FUND SEA 5 1,740 1,740 1,740 275 PROFESSIONAL STAFF CONGRESS 206 1,965 1,965 1,965 276 PROFESSIONAL STAFF CONGRESS 3 1,965 1,965 1,965 555 CIVILIAN, TRANSIT POLICE DEPT. NYC
TRANSIT 20 1,740 1,740 1,740
556 UNKNOWN 5 1,940 1,940 1,940 700 LCL 237 RWF(L621 SUP MEC) 286 174 2,020 2,020 701 LCL 237 RWF(L621 SUP I W) 10 1,740 2,020 2,020 702 LOCAL 237 RWF(L621 DDMEM) 7 1,740 2,020 2,020 703 TEAMSTERS L237 ADMIN FUND 94 2,220 2,220 2,220 704 L1969(L806 BRDG PAINTERS) 33 1,740 2,140 2,140 705 L.40 361&417 JT UN SEC FD 48 1,640 1,640 1,640 706 LOCAL 3 -COMM ELECTRICIAN 53 1,640 1,640 1,740 709 L237RWF (L621 ADFM) 4 1,740 2,020 2,020 710 LCL UNION#3 IBEW NYC ELEC 5 1,740 1,740 1,740 711 LCL 3 IBEW ELECTRCN WEST 2 1,740 1,740 1,740 712 LCL 3 IBEW ELCTRCN SUP HL 589 1,740 1,740 1,740

143
Table VII-b: NYCERS (continued)
UWF Description Count1 6/30/18 Rate2
6/30/19 Rate2
6/30/20 Rate2
714 LCL 237 ELEV MECH RETIREE 306 1,940 2,220 2,220 715 TEAMSTERS L237 ADMN FUND 26 2,220 2,220 2,220 717 LOCAL1969 GLAZIERS 34 2,140 2,140 2,140 720 DC37 LOCKSMITH SUPV LKSMT 46 1,840 1,940 1,940 724 RET H&W FD L3 IBEW-SUP.ME 79 1,640 1,640 1,640 725 UNKNOWN 39 1,740 1,740 1,740 727 NYC RET HLTH & WEL FD-PL 471 1,740 1,740 1,740 728 LCL 1969 NYC PAINTERS 337 2,140 2,140 2,140 730 PAVERS RDBLDR DC PAVERS 1 1,440 1,440 1,440 731 TEAMSTERS L237 ADMIN FUND 28 2,220 2,220 2,220 732 TEAMSTERS L237 ADMIN FUND 217 2,195 2,220 2,220 736 RET.WF AUTO MECH-UPSTATE 36 1,740 1,740 1,740 738 RET WELF FND AUTO MECHNYC 909 1,740 1,740 1,740 739 RET WELF FUND-TRACT OPERS 7 1,740 1,740 1,740 741 RET WEL FND MOTOR GRA OPR 19 1,740 1,740 1,740 742 LCL 14 PILE DRIVING ENGNR 2 1,715 1,715 1,715 743 DC 37 HIGHWAY REPAIRERS 332 1,940 1,940 1,940 744 DC 37 FURNIT MAINTAINER 1 1,740 1,940 1,940 745 DC37 CYLD PRESS OPER 20 1,740 1,940 1,940 746 LCL 300 HIGHWAY REPAIRERS 16 1,740 1,740 1,740 747 PAVERS RDBLDRS HWY REPAIR 12 1,740 1,740 1,740 748 LCL 14-RETIR. GAS RLR ENG 12 1,740 1,740 1,740 749 DC37SUPERVISOR HIGHWAY RE 94 1,840 1,940 1,990 750 LCL300 SUPV.HWY REPAIRER 6 1,640 1,640 1,640 751 PVRS + RDBLDRS DC SUP HR 4 1,640 1,640 1,640 753 DC37 COMPOSITOR (JOB) 6 1,940 1,940 1,940 754 RET WEL FUND CARRGE UPHOL 2 1,940 1,740 1,740 756 TEAMSTERS L237 ADMIN FUND 52 2,220 2,220 2,220 777 PATROLMEN’S BENEVOLENT
ASSOCIATION (LINE-OF-DUTY SURVIVORS)
3 0 0 0
782 TEAMSTERS L237 ADMIN FUND 2 2,220 2,220 2,220 786 DC37 CITY LABORERS 396 1,740 1,940 1,940 787 DC37 CONSTRUCTION LABORER 277 1,940 1,940 1,990 804 TEAMSTERS L237 ADMIN FUND 1,085 2,220 2,220 2,220 808 LCL 30 OILER 223 1,740 1,740 1,740 812 DC37 RADIO REPAIR MECHANI 58 1,740 1,940 1,940 814 LCL 246 RWF RUBR TIRE REP 17 1,940 1,940 1,940 816 DC37 SEWAGE TRTMT WKRS 463 1,740 1,940 1,940 818 RET WEL FND SGN PTRS/LTRS 4 1,740 1,740 1,740 820 LCL 30 STAT ENG SR ST ENG 527 1,740 1,740 1,740 823 NYC DIST.COUNCIL OF CARPS 451 1,740 1,740 1,740 824 NYC DIST CNCL CARPS RETIR 1 1,740 1,740 1,740

144
Table VII-b: NYCERS (continued)
UWF Description Count1 6/30/18 Rate2
6/30/19 Rate2
6/30/20 Rate2
825 NYC DIST COUNCIL OF CARPS 5 1,740 1,740 1,740 826 LOCAL 3-SR STAT ENG ELEC 109 1,740 1,740 1,740 827 RET WEL FND SHEET MTL WKR 48 1,740 1,740 1,740 828 LOCAL 3 - STAT ENG ELECTR 241 1,740 1,740 1,740 832 DC 37 HI-PRESS PLANT TEND 95 1,740 1,940 1,940 837 LCL LDG 5 BLKSMTH HLP SUP 43 2,583 2,583 2,583 838 NYC DIST. COUNCIL OF CARP 28 1,740 1,740 1,740 839 LCL LDG 5 BOLRMKR HLP SUP 15 860 860 860 842 NYC MUNI STMFTR&HLP HW FD 93 1,740 1,740 1,740 843 LOCAL 15-GASOLINE RLR ENG 27 1,740 1,740 1,740 845 LCL 15 WELDERS FD 65 1,740 1,740 1,740 847 LCL 15 HIPRESS OPER. 2 1,065 1,065 1,065 848 LCL 15 TRACTOR OPER(SANI) 97 1,740 1,740 1,740 888 Either not entitled to Welfare Fund
Benefits or UWF contribution is not funded by the City. Medicare Part B reimbursement.
135 0 0 0 901 1 0 0 0 902 1 0 0 0 948 1 0 0 0 950 12 0 0 0 960 16 0 0 0 999 54 0 0 0 Blank 7,023 0 0 0
Total Count: 111,527
1 Data includes entire population provided by OLR and supplemented by the OA, including Component Units and other groups not attributable to the City for GASB75 purposes.
2 Rates used as of June 30, 2018, June 30, 2019, and June 30, 2020 include any known one-time Welfare Fund payments paid during the Fiscal Year following the date of the rate. Also reflected are any known retroactive increases as of their effective date. Effective rates and information on one-time payments are based on information supplied by OLR. The rate for DC37 was used for UWFs without a reported rate. Rates for Professional Staff Congress came from its website. An additional $100 was added to each amount as of 7/1/2018 and 7/1/2019, assuming that any welfare funds who have not yet negotiated the increase will do so in the future.

145
Table VII-c: TRS
UWF Description Count1 6/30/18 Rate2
6/30/19 Rate2
6/30/20 Rate2
001 NYC MANAGEMENT WELFARE FUND 173 $1,740 $1,940 $1,940 035 CORRECT OFFICRS BEN ASSOC 1 1,740 1,740 1,740 045 CWA LOCAL 1182 SEC BEN FUND 1 1,740 1,740 1,740 055 ADMFD OF THE DEA PDCNY-DI 1 1,573 1,573 1,573 060 DISTRICT COUNCIL 37 737 1,940 1,940 1,940 108 ORG OF STAFF ANALYSTS 4 1,740 1,740 1,740 155 CWA LOCAL 1180 ADMIN FUND 19 1,775 1,775 1,775 160 NYC DEPY SHER ASS RET SBF 0 1,465 1,465 1,465 163 UFT 70,445 1,820 1,820 1,820 164 COUNCIL OF SUPERVISORS AND
ADMINISTRATORS 7,536 1,820 1,820 1,820
185 NYC RET HLTH&WEL FD-NYSNA 1 1,740 1,740 1,740 200 SANITATION OFF RET WEL FN 1 1,490 1,490 1,290 227 SBA HLTH & WELF FND/RETIR 2 1,740 1,740 1,740 235 TEAMSTERS L237 ADMIN FUND 9 2,220 2,220 2,220 260 LCL 300 RETIREE WELF FUND 1 1,740 1,740 1,740 275 PROFESSIONAL STAFF CONGRESS 2,081 1,965 1,965 1,965 276 PROFESSIONAL STAFF CONGRESS 15 1,965 1,965 1,965 277 SBA HLTH & WELF FND/RETIR 5 1,965 1,965 1,965 724 RET H&W FD L3 IBEW-SUP.ME 1 1,640 1,640 1,640 888 Either not entitled to Welfare Fund
Benefits or UWF contribution is not funded by the City. Medicare Part B
reimbursement.
16 0 0 0 999 20 0 0 0 Blank 2,765 0 0 0
Total Count: 83,834
1 Data includes entire population provided by OLR and supplemented by the OA, including Component Units and other groups not attributable to the City for GASB75 purposes.
2 Rates used as of June 30, 2018, June 30, 2019, and June 30, 2020 include any known one-time Welfare Fund payments paid during the Fiscal Year following the date of the rate. Also reflected are any known retroactive increases as of their effective date. Effective rates and information on one-time payments are based on information supplied by OLR. The rate for DC37 was used for UWFs without a reported rate. Rates for Professional Staff Congress came from its website. An additional $100 was added to each amount as of 7/1/2018 and 7/1/2019, assuming that any welfare funds who have not yet negotiated the increase will do so in the future.

146
Table VII-d: BERS
UWF Description Count1 6/30/19 Rate2
6/30/18 Rate2
6/30/17 Rate2
001 NYC MANAGEMENT WELFARE FUND 656 $1,740 $1,940 $1,940 035 CORRECT OFFICRS BEN ASSOC 1 1,740 1,740 1,740 045 CWA LOCAL 1182 SEC BEN FUND 1 1,740 1,740 1,740 060 DISTRICT COUNCIL 37 12,991 1,940 1,940 1,940 106 OSA WELF FND-SCHOOL SEC/T 8 1,740 1,740 1,740 108 ORG OF STAFF ANALYSTS 21 1,740 1,740 1,740 115 NYC RET HLTH &WEL FD-L306 9 1,740 1,740 1,740 130 TEAMSTERS L237 ADMIN FUND 331 2,220 2,220 2,220 131 DISTRICT COUNCIL 37 566 1,940 1,940 1,940 135 RET CWA L1183 BOE H&W FND 1 1,853 1,853 1,853 155 CWA LOCAL 1180 ADMIN FUND 443 1,775 1,775 1,775 162 UFT WELFARE FUND 28 1,820 1,820 1,820 163 UFT WELFARE FUND 920 1,820 1,820 1,820 164 COUNCIL OF SUPERVISORS AND
ADMINISTRATION 8 1,820 1,820 1,820
165 RET WELF FND AUTO SVC WKR 2 1,740 1,740 1,740 185 NYC RET HLTH&WEL FD-NYSNA 3 1,740 1,740 1,740 235 TEAMSTERS L237 ADMIN FUND 390 2,220 2,220 2,220 250 UNIF SANMEN'S ADM FUND 1 2,009 2,009 2,009 260 LCL 300 RETIREE WELF FUND 64 1,740 1,740 1,740 275 PROFESSIONAL STAFF CONGRESS 9 1,965 1,965 1,965 555 CIVILIAN, TRANSIT POLICE DEPT. NYC
TRANSIT 1 1,740 1,740 1,740
700 LCL 237 RWF(L621 SUP MEC) 6 174 2,020 2,020 703 TEAMSTERS L237 ADMIN FUND 2 2,220 2,220 2,220 708 LOCAL 246, DEPT OF EDUCATION 2 1,940 1,940 1,940 710 LCL UNION#3 IBEW NYC ELEC 2 1,740 1,740 1,740 712 LCL 3 IBEW ELCTRCN SUP HL 54 1,740 1,740 1,740 714 LCL 237 ELEV MECH RETIREE 3 1,940 2,220 2,220 717 LOCAL1969 GLAZIERS 12 2,140 2,140 2,140 720 DC37 LOCKSMITH SUPV LKSMT 4 1,840 1,940 1,940 724 RET H&W FD L3 IBEW-SUP.ME 27 1,640 1,640 1,640 725 UNKNOWN 1 1,740 1,740 1,740 727 NYC RET HLTH & WEL FD-PL 51 1,740 1,740 1,740 728 LCL 1969 NYC PAINTERS 26 2,140 2,140 2,140 731 TEAMSTERS L237 ADMIN FUND 10 2,220 2,220 2,220 732 TEAMSTERS L237 ADMIN FUND 12 2,195 2,220 2,220 738 RET WELF FND AUTO MECHNYC 32 1,740 1,740 1,740 740 RET WELF FND GEN MECHANIC 1 1,290 1,290 1,290 744 DC 37 FURNIT MAINTAINER 4 1,740 1,940 1,940 756 TEAMSTERS L237 ADMIN FUND 1 2,220 2,220 2,220

147
Table VII-d: BERS (continued)
UWF Description Count1 6/30/18 Rate2
6/30/19 Rate2
6/30/20 Rate2
760 LOCAL 246, DEPT OF EDUCATION 6 1,740 1,740 1,740 786 DC37 CITY LABORERS 19 1,740 1,940 1,940 787 DC37 CONSTRUCTION LABORER 2 1,940 1,940 1,990 804 TEAMSTERS L237 ADMIN FUND 13 2,220 2,220 2,220 812 DC37 RADIO REPAIR MECHANI 7 1,740 1,940 1,940 820 LCL 30 STAT ENG SR ST ENG 7 1,740 1,740 1,740 823 NYC DIST.COUNCIL OF CARPS 100 1,740 1,740 1,740 826 LOCAL 3-SR STAT ENG ELEC 1 1,740 1,740 1,740 827 RET WEL FND SHEET MTL WKR 8 1,740 1,740 1,740 832 DC 37 HI-PRESS PLANT TEND 1 1,740 1,940 1,940 838 NYC DIST. COUNCIL OF CARP 11 1,740 1,740 1,740 839 LCL LDG 5 BOLRMKR HLP SUP 1 860 860 860 842 NYC MUNI STMFTR&HLP HW FD 34 1,740 1,740 1,740 845 LCL 15 WELDERS FD 2 1,740 1,740 1,740 888 Either not entitled to Welfare Fund
Benefits or UWF contribution is not funded by the City. Medicare Part B
reimbursement.
8 0 0 0 999 15 0 0 0 Blank 571 0 0 0
Total Count: 17,510
1 Data includes entire population provided by OLR and supplemented by the OA, including Component Units and other groups not attributable to the City for GASB75 purposes.
2 Rates used as of June 30, 2018, June 30, 2019, and June 30, 2020 include any known one-time Welfare Fund payments paid during the Fiscal Year following the date of the rate. Also reflected are any known retroactive increases as of their effective date. Effective rates and information on one-time payments are based on information supplied by OLR. The rate for DC37 was used for UWFs without a reported rate. Rates for Professional Staff Congress came from its website. An additional $100 was added to each amount as of 7/1/2018 and 7/1/2019, assuming that any welfare funds who have not yet negotiated the increase will do so in the future.

148
Table VII-e: POLICE
UWF Description Count 6/30/18 Rate1
6/30/19 Rate1
6/30/20 Rate1
001 NYC MANAGEMENT WELFARE FUND 120 $1,740 $1,940 $1,940 035 CORRECT OFFICRS BEN ASSOC 1 1,740 1,740 1,740 048 ADM FUND OF THE DEA PDCNY 12,824 1,573 1,573 1,573 055 ADMFD OF THE DEA PDCNY-DI 1 1,573 1,573 1,573 163 UFT WELFARE FUND 2 1,820 1,820 1,820 164 COUNCIL OF SUPERVISORS AND
ADMINISTRATION 1 1,820 1,820 1,820
170 PBA (NYPD) 23,329 1,853 1,853 1,853 225 SOC NYPD LT BENEV ASSOCIATION 4,014 1,665 1,665 1,665 226 SOC NYPD CAPT ENDOW ASSOCIATION 1,436 1,665 1,665 1,665 227 SBA HLTH & WELF FND/RETIR 7,949 1,740 1,740 1,740 240 UFOA LOCAL 854 RETIREES 1 1,695 1,695 1,695 777 PATROLEMEN'S BENEVOLENT
ASSOCIATION (LINE-OF-DUTY SURVIVORS)
239 0 0 0
888
Either not entitled to Welfare Fund benefits or UWF contribution is not funded by the City. Medicare Part B
reimbursement.
149 0 0 0 901 4 0 0 0 926 13 0 0 0 927 57 0 0 0 930 31 0 0 0 931 11 0 0 0 948 125 0 0 0 949 1 0 0 0 Blank 280 0 0 0
Total Count: 50,588
1 Rates used as of June 30, 2018, June 30, 2019, and June 30, 2020 include any known one-time Welfare Fund payments paid during the Fiscal Year following the date of the rate. Also reflected are any known retroactive increases as of their effective date. Effective rates and information on one-time payments are based on information supplied by OLR. The rate for DC37 was used for UWFs without a reported rate. Rates for Professional Staff Congress came from its website. An additional $100 was added to each amount as of 7/1/2018 and 7/1/2019, assuming that any welfare funds who have not yet negotiated the increase will do so in the future.

149
Table VII-f: FIRE
UWF Description Count 6/30/18 Rate1
6/30/19 Rate1
6/30/20 Rate1
001 NYC MANAGEMENT WELFARE FUND 91 $1,740 $1,940 $1,940 060 DISTRICT COUNCIL 37 8 1,940 1,940 1,940 065 RET FIREFIGHTRS SBF-UN ME 97 1,760 1,760 1,760 163 UFT WELFARE FUND 7 1,820 1,820 1,820 170 PBA (NYPD) 2 1,853 1,853 1,853 205 RETIRED FIREFIGHTERS SBF 10,488 1,820 1,820 1,820 206 RET FIREFIGHTRS SBF-WIPER 12 1,670 1,670 1,670 240 UFOA LOCAL 854 RETIREES 4,819 1,695 1,695 1,695 888
Either not entitled to Welfare Fund Benefits or UWF contribution is not funded by the City. Medicare Part B
reimbursement.
122 0 0 0 901 3 0 0 0 905 360 0 0 0 940 200 0 0 0 941 1 0 0 0 Blank 58 0 0 0
Total Count: 16,268
1 Rates used as of June 30, 2018, June 30, 2019, and June 30, 2020 include any known one-time Welfare Fund payments paid during the Fiscal Year following the date of the rate. Also reflected are any known retroactive increases as of their effective date. Effective rates and information on one-time payments are based on information supplied by OLR. The rate for DC37 was used for UWFs without a reported rate. Rates for Professional Staff Congress came from its website. An additional $100 was added to each amount as of 7/1/2018 and 7/1/2019, assuming that any welfare funds who have not yet negotiated the increase will do so in the future.

150
SECTION VIII – SUMMARY OF KEY TERMS
Actuarial present value of projected benefit payments
Projected benefit payments discounted to reflect the expected effects of the time value (present value) of money and the probabilities of payment.
Actuarial valuation
The determination, as of a point in time (the actuarial valuation date), of the service cost, total OPEB liability, and related actuarial present value of projected benefit payments for OPEB performed in conformity with Actuarial Standards of Practice unless otherwise specified by the GASB.
Actuarial valuation date
The date as of which an actuarial valuation is performed.
Discount rate
The single rate of return that, when applied to all projected benefit payments, results in an actuarial present value of projected benefit payments equal to the total of the following:
1. The actuarial present value of benefit payments projected to be made in future periods in which
a. the amount of the OPEB plan’s fiduciary net position is projected to be greater than the benefit payments that are projected to be made in that period, and
b. OPEB plan assets up to that point are expected to be invested using a strategy to achieve the long-term expected rate of return, calculated using the long-term expected rate of return on OPEB plan investments
2. The actuarial present value of projected benefit payments not included in (a), calculated using a yield or index rate for 20-year, tax-exempt general obligation municipal bonds with an average rating of AA/Aa or higher (or equivalent quality on another rating scale).
Employer Group Waiver Plan (EGWP)
A group Medicare Part D prescription drug plan option that is offered to retirees who are entitled to prescription drug coverage as part of their OPEB plan.

151
Entry age normal cost method
A method under which the actuarial present value of the projected benefits of each individual included in an actuarial valuation is allocated on a level basis over the earnings or service of the individual between entry age and assumed exit age(s). The portion of this actuarial present value allocated to a valuation year is called the normal cost. The portion of this actuarial present value not provided for at a valuation date by the actuarial present value of future normal costs is called the Total OPEB Liability for purposes of measurements under GASB74 and GASB75.
Healthcare cost trend rates
The rates of change in per capita health claims costs over time as a result of factors such as medical inflation, utilization of healthcare services, plan design, and technological developments.
Income Related Monthly Adjustment Amount (IRMAA)
An additional premium amount for Medicare Part B and Medicare prescription drug coverage for higher income beneficiaries.
Net OPEB liability
The liability of employers and non-employer contributing entities to employees for benefits provided through an OPEB plan less any assets that are dedicated to providing OPEB to plan members and that are protected from creditors of the employers.
Other postemployment benefits (OPEB)
Benefits (such as death benefits, life insurance, disability, and long-term care) that are paid in the period after employment and that are provided separately from a pension plan, as well as healthcare benefits paid in the period after employment, regardless of the manner in which they are provided. OPEB does not include termination benefits or termination payments for sick leave.
Projected benefit payments
All benefits (including refunds of employee contributions) estimated to be payable through the OPEB plan (including amounts to be paid by employers or non-employer contributing entities as the benefits come due) to current active and inactive employees as a result of their past service and their expected future service.

152
Service cost
The portions of the actuarial present value of projected benefit payments that are attributed to a valuation year.
Total OPEB liability
The liability of employers and non-employer contributing entities to employees for benefits provided through an OPEB plan.