fish food 2019 report final 12-31-19
TRANSCRIPT

Fish Food on Floodplain Farm Fields
2019 Annual Report of Experimental Results
Prepared by California Trout for the United States Bureau of Reclamation
In partnership with Reclamation District 108, River Garden Farms, Robbins Rice Company, Davis Ranches, Montna Farms, the California Rice Commission and the
UC Davis Center for Watershed Sciences
Management Team Project Leader Jacob Katz – CalTrout Project Administration Ian Smith – USBR, Jayme Ohlhaver – CalTrout Science Coordinator Jacob Montgomery – CalTrout Data Steward Jacob Montgomery – CalTrout Logistics Lewis Bair – Reclamation District No 108,
Roger Cornwell – River Garden Farms Technical Advisors David Guy – NCWA, Rod Wittler & Josh Isreal – USBR,
Donald Ratcliff – USFWS, Paul Butner – CRC, Jon Rubin –Westlands, Griffin Hill – SLDMWA, Ted Sommer & Kris Tjernell – DWR, Brian Ellrott – NMFS, Mark Peatry – DU, Collin Purdy – CDFW, Carson Jeffres, Andrew Ryppel – UC Davis, Alison Collins – MWD, Chuck Hanson – SWC
Project Funding The United States Bureau of Reclamation, the Water Foundation, in-kind funding from Northern California Water Association, public agencies and participating farms
SUMMARY California’s native fish populations are in dramatic decline. Before the Central Valley was developed, leveed and drained, food webs produced on over four million acres of seasonally inundated floodplain supported robust fish and wildlife populations. Over the last century and a half, development—primarily for agriculture and flood control—has cut off 95% of wetlands from Central Valley rivers, effectively starving river ecosystems of the foundation of the aquatic food web: the solar energy captured by plants and algae on floodplains. This project explored the ecological impact and operational feasibility of augmenting aquatic food web resources in the Sacramento River by reconnecting floodplain and river food webs. The project utilizes existing irrigation and flood protection infrastructure to deliver high-residence time floodwaters containing floodplain-derived food web resources produced on intentionally inundated winter farm fields back to the river where they can benefit fish populations of conservation concern.

This project utilized water infrastructure owned by Reclamation District 108 to divert winter river flows to shallowly flood (i.e., ~12 inches) approximately 5,000 acres of Colusa Basin farm fields during the non-growing season. After being inundated for four to six weeks, fields were drained into canals. Drain waters were then pumped into the Sacramento River where floodplain-derived food web resources (i.e., zooplankton) that were produced during the long residence time of waters on the floodplain became available for consumption by juvenile salmonids and other fish confined to leveed, relatively food-scarce river channel habitats. During the drainage action, zooplankton density in the Sacramento River increased by an average of 40x at the pump outfall and by up to 6x one mile downstream. Juvenile Chinook salmon held in floating cages in the river at the location of floodplain discharge grew at a rate 500% faster than fish caged in similar habitats upstream, presumably because they had access to floodplain-derived food resources while the upstream fish did not. Fish caged one mile downstream from the point of discharge grew at a rate 300% faster than those upstream of the discharge point. These results demonstrate that managed export of high-residence time floodwaters can deliver floodplain-derived food web resources to the Sacramento River ecosystem at a scale sufficient to improve growth rates of juvenile Chinook salmon in river habitats. INTRODUCTION The benefits of annual floodplain inundation to riverine ecosystems and fish populations are well recognized in relatively unaltered tropical river systems (Junk et al. 1986, Bayley 1991). However, floodplains and other seasonally inundated off-channel river habitats have not been as thoroughly studied in temperate climates (Tockner and Stanford 2002). In Europe and North America, levees have been constructed along almost every major lowland river to allow development of fertile floodplains for farms and cities (Richter et al. 2003). In the Central Valley of California approximately 95% of the approximately four million acres of historical floodplain wetlands have been drained or are no longer accessible to aquatic species behind ~3360 km of state and federal levees (Inamine et al. 2010). This landscape-scale hydrologic divorce of river channel and floodplain has only recently been widely recognized, and ecosystem responses have just begun to be studied and quantified (Opperman et al. 2009). Recent statewide analyses of the conservation status of freshwater fishes have concluded that lack of floodplain and other off-channel habitat is an important contributor to widespread decline of many fish species (Moyle et al. 2011, Katz et al. 2013a, CalTrout 2017). The wetland, farm field, leveed river channel, and drainage canal aquatic habitats studied here are typical of those found in developed, drained and leveed river valleys globally. In this study, we explore how energy (carbon) flows from farm fields (lands today managed as terrestrial habitat but that were historically seasonally inundated floodplain wetlands) into aquatic food webs in the intensively managed agricultural landscape of the lower Sacramento River Valley (Fig. 1). The Sacramento Valley is a Mediterranean climate where summers are long and dry and almost all precipitation falls in winter and spring. Historically this resulted in rivers with high seasonal

variability in flows, with extensive floodplain wetland flooding occurring during the winter/spring wet season in most years. Inundated Central Valley floodplains are generally warmer due to increased surface area and residence time, compared to the relatively cool and swift river channel (Ahearn et al. 2006, Grosholz and Gallo 2006). When floodwaters spread out across the floodplain, the water surface area available for phytoplankton to absorb sunlight expands exponentially, compared to when rivers are confined to the river channel. Elevated phytoplankton growth in floodplain habitats provides food resources for grazing zooplankton and other invertebrates, which ultimately become food resources for fishes (Sommer et al. 2001a, Muller-Solger et al. 2002, Ahearn et al. 2006, Grosholz and Gallo 2006, Jeffres et al. 2008). These autotrophic (algal-based) food webs are widely recognized as important drivers of aquatic food web productivity, and their scale is directly correlated to the extent of surface waters. Less widely recognized are heterotrophic (detritus-based) food webs whereby energy transfer on inundated floodplains and similar off-channel habitats is driven by the breakdown of plant biomass (Bastviken et al. 2003, Deines et al. 2007, Murase and Frenzel 2007, Palijan 2012, Saseverino et al. 2012). Elevated decomposition of terrestrial and deciduous carbon sources by microorganisms also provides an abundant resource for grazing zooplankton and other invertebrates, which offers an alternative food web pathway for fishes. In floodplains especially, much of the potential detrital plant biomass is terrestrial, grown on floodplains during summer and only available to the aquatic food web when floodplains are inundated by floodwaters. Heterotrophic food web energy transfer occurred on the over four million acres annually in the pre-developed Central Valley. Today in the Sacramento Valley, only approximately 100,000 acres are still periodically hydrologically connected to the river. These acres are within the levee footprint and primarily managed as flood protection “by-passes” designed to accept floodwaters during times of extreme high water. Flood bypasses are recieving increased attention due to the limited amount of floodplain habitats remaining hydrologically connected to fish-bearing river channels. Bypasses may be modified to better mimic historical shallow flooding patterns that once sustained aquatic food webs and were important drivers of fish and wildlife abundance in the Sacramento Valley. Recent research has shown that agricultural fields in the Sacramento Valley’s bypass system can also provide a productive food web and abundant food resources for juvenile salmonids when intentionally flooded using existing irrigation infrastructure (Katz et al. 2012-2015, Corline et al. 2017). The overall rapid growth and robust body condition of the salmon in these studies (Jeffres et al. 2019, in review) demonstrates that managed winter flooding of bypass agriculture fields during the non-growing season using existing water infrastructure can provide high quality habitat for rearing juvenile Chinook salmon annually. This benefit can be achieved even during below normal and dry water years. These results suggest that changes to agricultural management and infrastructure that increase the frequency and extend the inundation duration of bypass flood events could allow bypass agriculture fields to serve as large-scale surrogates for seasonally inundated floodplain wetland habitat for juvenile Chinook salmon (Sommer et al. 2001b, Katz et al. 2017a). Another potential opportunity to improve the contribution of wetlands to aquatic food web production in the Sacramento Valley is the approximately 500,000 acres of rice ground that

occupy the heavy peat soils of the historical floodplain. These “dry-side” fields are inaccessible to juvenile salmonids due to flood protection levees. Over the last three decades, rice growers in the Sacramento Valley have adopted and continue to refine farm practices that provide wetland habitat for waterfowl and shorebirds on winter-flooded rice fields that remain in active agricultural production during summer (Eadie et al. 2008, Elphick 2008, Elphick et al. 2010, Strum et al. 2013). One of these practices, which occurs on approximately 300,000 acres of rice ground in the Sacramento Valley annually, is the shallow flooding of rice fields after harvest in fall to aid in rice stubble decomposition (decomp). This managed inundation produces conditions similar to natural floodplain wetlands (i.e., surrogate floodplains), and has had positive, population-scale effects on native waterfowl species, including recent all-time high counts of wetland birds (Elphick et al. 2010). California Trout’s Fish Food program is dedicated to understanding the aquatic food web production dynamics on such surrogate floodplains and to developing management practices that reconnect “dry-side” food web resources to “wet-side” fish populations. Current farm practices keep decomp water on fields where it percolates into the ground or evaporates. Unfortunately for fish, very little of this decomp water, which is rich in zooplankton and other invertebrates (i.e., fish food), returns back to the river. In 2017, the pilot Fish Food survey found high zooplankton densities across multiple dry-side managed floodplains (33 sites across 6 counties in the Sacramento Valley; Katz et al. 2017b). In 2018, the Fish Food program experimented with draining increasingly larger flooded rice acreage (5 drainage experiments ranging from 4-3,000 acres) and observed up to 600% increase in canal zooplankton density 15 miles “downstream” from the field outlet within the Colusa Basin Drain (Katz et al. 2018). This report presents the results of the Fish Food program’s 2019 Pilot Action, which increased the scale of managed floodplain drainage and focused on ecological responses in the receiving fish-bearing waterway. The Pilot Action intentionally inundated over 5,000 acres, drained the water through existing irrigation canals and large flood-control lift pumps, and assessed the effects of managed floodplain drainage on wet-side water quality, zooplankton density, and fish growth rate in the Sacramento. METHODS Study location Flooding for the Pilot Action experiment took place in the Colusa Basin on 5,435 acres owned by Reclamation District 108 (RD 108) near Knights Landing, CA. Sampling was conducted in the RD108 canal system immediately before canal water was pumped into the Sacramento River at the Rough and Ready pumping facility (approximately river mile 100), and in the River up- and downstream of the pump discharge location (Fig.1).
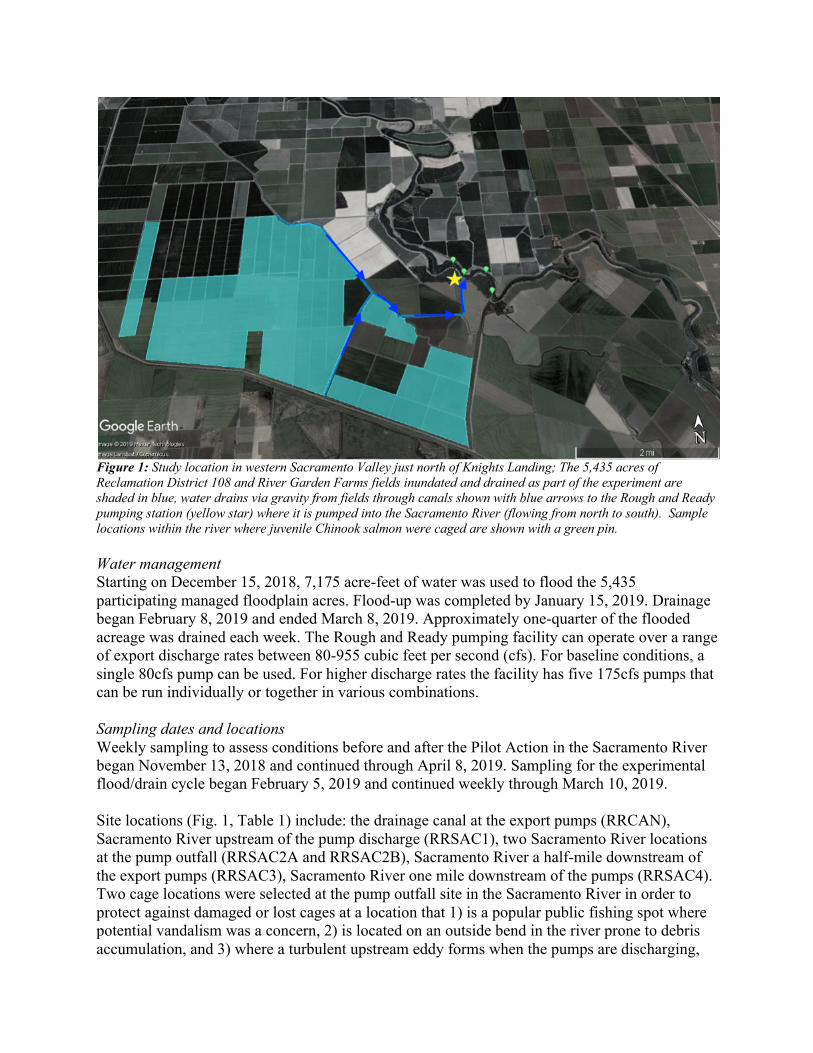
Figure 1: Study location in western Sacramento Valley just north of Knights Landing; The 5,435 acres of Reclamation District 108 and River Garden Farms fields inundated and drained as part of the experiment are shaded in blue, water drains via gravity from fields through canals shown with blue arrows to the Rough and Ready pumping station (yellow star) where it is pumped into the Sacramento River (flowing from north to south). Sample locations within the river where juvenile Chinook salmon were caged are shown with a green pin. Water management Starting on December 15, 2018, 7,175 acre-feet of water was used to flood the 5,435 participating managed floodplain acres. Flood-up was completed by January 15, 2019. Drainage began February 8, 2019 and ended March 8, 2019. Approximately one-quarter of the flooded acreage was drained each week. The Rough and Ready pumping facility can operate over a range of export discharge rates between 80-955 cubic feet per second (cfs). For baseline conditions, a single 80cfs pump can be used. For higher discharge rates the facility has five 175cfs pumps that can be run individually or together in various combinations. Sampling dates and locations Weekly sampling to assess conditions before and after the Pilot Action in the Sacramento River began November 13, 2018 and continued through April 8, 2019. Sampling for the experimental flood/drain cycle began February 5, 2019 and continued weekly through March 10, 2019. Site locations (Fig. 1, Table 1) include: the drainage canal at the export pumps (RRCAN), Sacramento River upstream of the pump discharge (RRSAC1), two Sacramento River locations at the pump outfall (RRSAC2A and RRSAC2B), Sacramento River a half-mile downstream of the export pumps (RRSAC3), Sacramento River one mile downstream of the pumps (RRSAC4). Two cage locations were selected at the pump outfall site in the Sacramento River in order to protect against damaged or lost cages at a location that 1) is a popular public fishing spot where potential vandalism was a concern, 2) is located on an outside bend in the river prone to debris accumulation, and 3) where a turbulent upstream eddy forms when the pumps are discharging,

making tethering cages particularly challenging. The second location (RRSAC2B), immediately upstream of the export pumps and within the upstream eddy and protected from view and from debris by riparian vegetation, was added to create redundancy and alleviate some of these concerns. Table 1: Sample location codes and descriptions
Site Code Site Description Start Date Number of samples
RRSAC1 river, upstream 11/13/2018 19 RRSAC2A river, outfall (exposed) 1/8/2019 18 RRSAC2B river, outfall (protected) 2/12/2019 9 RRSAC3 river, downstream 0.5 miles 2/5/2019 10 RRSAC4 river, downstream 1.0 miles 2/5/2019 10 RRCAN floodplain drainage canal 11/13/2018 19
Water quality and zooplankton sampling At each sample location, water quality data was collected with a YSI Exo2 multi-parameter sonde. Water quality parameters collected were: temperature (degrees C), dissolved oxygen (mg/L), turbidity (NTU), chlorophyl-a fluorescence (µg/L), electrical conductivity (µg/cm), salinity (PSU), and pH. Onset HOBO dissolved oxygen and temperature data loggers were deployed at all locations collecting continuous data at 15-minute intervals. All sites were sampled for zooplankton diversity and abundance using net tows. In the river, a 30-cm diameter x 150 µm mesh zooplankton net fitted with a flowmeter was thrown five meters and retrieved through the water column four times orthogonal to water flow, accounting for drift. Flow meter data was recorded to quantify the volume of water sampled. In the canal site where water stage fluctuations occasionally limit the use of a larger net, a 15-cm diameter x 150 µm mesh zooplankton net was thrown five meters and retrieved through the water column four times. Shallow-water nets cannot be fitted with a flowmeter and the volume of water sampled can be determined by the area of the mouth of the net multiplied by the distance towed (π*.0752*20 ~ 0.35m3). All zooplankton samples were preserved in 95% ethanol. Zooplankton were identified to the lowest taxonomic level possible and counted using a dissecting microscope at 8x magnification. Dry carbon biomass conversions either taken from the literature (Dumont 1975) or measured empirically by the Kimmerer Laboratory at San Francisco State’s Romber Tiburon Center were applied to zooplankton species counts to estimate zooplankton biomass. Fish growth Two or three enclosures were deployed at each site (two each at RRSAC2A and RRSAC2B and three everywhere else), each containing 10 PIT-tagged Feather River hatchery-origin juvenile Chinook salmon. Fish enclosures were built with 1-inch PVC, measured 4-feet wide by 4-feet long by 2-feet deep, and encased in ¼-inch black plastic square mesh with a re-sealable access door on the top panel. Fish enclosures were equipped with four bullet-shaped crab floats and tethered to shore. Each week, fish were caught out of their enclosures, scanned for PIT
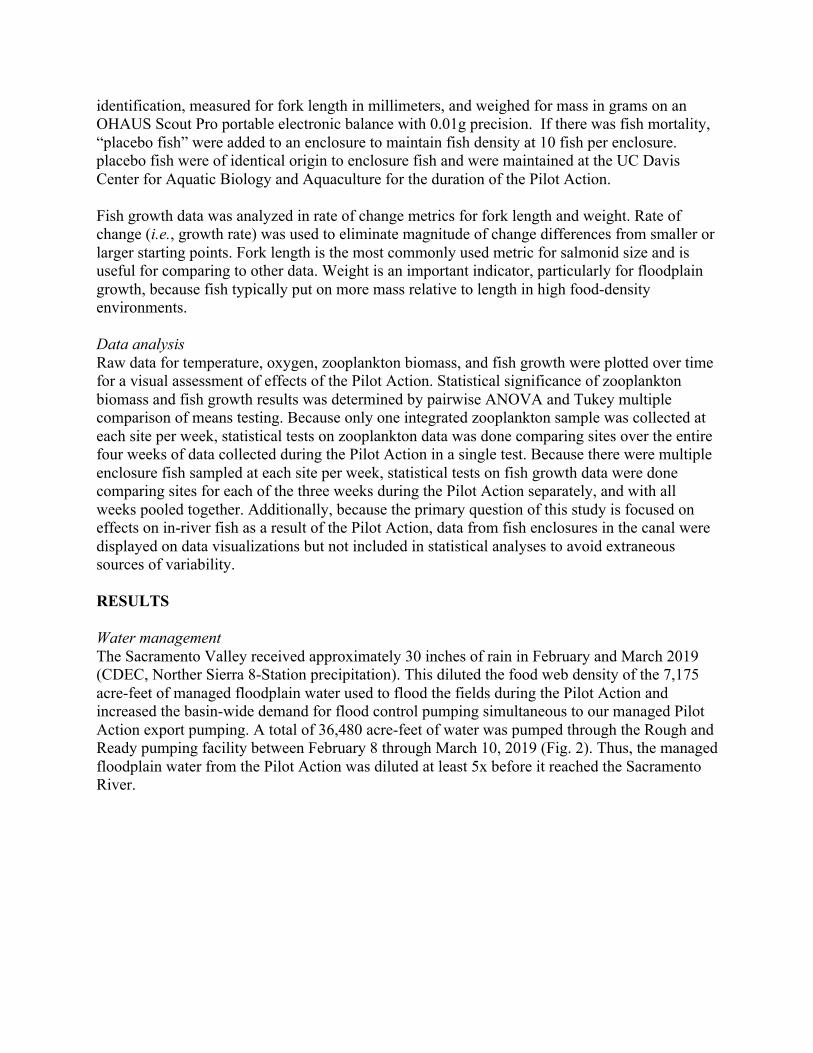
identification, measured for fork length in millimeters, and weighed for mass in grams on an OHAUS Scout Pro portable electronic balance with 0.01g precision. If there was fish mortality, “placebo fish” were added to an enclosure to maintain fish density at 10 fish per enclosure. placebo fish were of identical origin to enclosure fish and were maintained at the UC Davis Center for Aquatic Biology and Aquaculture for the duration of the Pilot Action. Fish growth data was analyzed in rate of change metrics for fork length and weight. Rate of change (i.e., growth rate) was used to eliminate magnitude of change differences from smaller or larger starting points. Fork length is the most commonly used metric for salmonid size and is useful for comparing to other data. Weight is an important indicator, particularly for floodplain growth, because fish typically put on more mass relative to length in high food-density environments. Data analysis Raw data for temperature, oxygen, zooplankton biomass, and fish growth were plotted over time for a visual assessment of effects of the Pilot Action. Statistical significance of zooplankton biomass and fish growth results was determined by pairwise ANOVA and Tukey multiple comparison of means testing. Because only one integrated zooplankton sample was collected at each site per week, statistical tests on zooplankton data was done comparing sites over the entire four weeks of data collected during the Pilot Action in a single test. Because there were multiple enclosure fish sampled at each site per week, statistical tests on fish growth data were done comparing sites for each of the three weeks during the Pilot Action separately, and with all weeks pooled together. Additionally, because the primary question of this study is focused on effects on in-river fish as a result of the Pilot Action, data from fish enclosures in the canal were displayed on data visualizations but not included in statistical analyses to avoid extraneous sources of variability. RESULTS Water management The Sacramento Valley received approximately 30 inches of rain in February and March 2019 (CDEC, Norther Sierra 8-Station precipitation). This diluted the food web density of the 7,175 acre-feet of managed floodplain water used to flood the fields during the Pilot Action and increased the basin-wide demand for flood control pumping simultaneous to our managed Pilot Action export pumping. A total of 36,480 acre-feet of water was pumped through the Rough and Ready pumping facility between February 8 through March 10, 2019 (Fig. 2). Thus, the managed floodplain water from the Pilot Action was diluted at least 5x before it reached the Sacramento River.
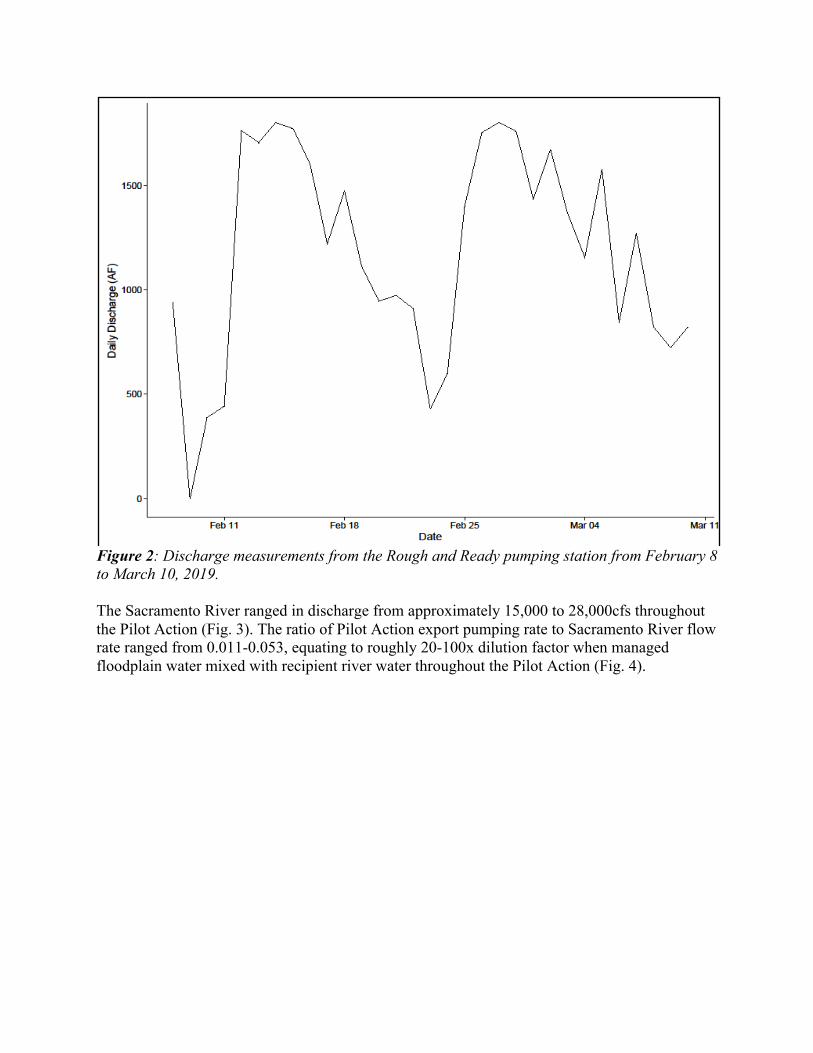
Figure 2: Discharge measurements from the Rough and Ready pumping station from February 8 to March 10, 2019. The Sacramento River ranged in discharge from approximately 15,000 to 28,000cfs throughout the Pilot Action (Fig. 3). The ratio of Pilot Action export pumping rate to Sacramento River flow rate ranged from 0.011-0.053, equating to roughly 20-100x dilution factor when managed floodplain water mixed with recipient river water throughout the Pilot Action (Fig. 4).

Figure 3: Sacramento River flow measured at the Wilkins Slough CDEC station.

Figure 4: Ratio of managed floodplain water export flow to Sacramento River flow throughout the Pilot Action. Water quality All temperature and oxygen data collected during the Pilot Action was within the accepted physiological tolerance range of juvenile Chinook salmon (Moyle 2002). Overall, the temperature was higher and the dissolved oxygen concentration was lower in the Rough and Ready canal relative to the adjacent Sacramento River. A one-degree Fahrenheit increase in temperature and 0.2 mg/L decrease in oxygen concentration was observed in the river at the pump outfall sites compared to the upstream location. Temperatures returned to baseline river conditions by one mile downstream. However, dissolved oxygen levels one-mile downstream of the pump discharge location remained slightly below the levels observed upstream (Figs. 5 and 6).

Figure 5: Continuous temperature data from all 6 Pilot Action sample sites.

Figure 6: Continuous oxygen concentration data from all 6 Pilot Action sample sites. Zooplankton Before the Pilot Action began, the pump outfall site (RRSAC2A) averaged nearly twice the zooplankton biomass as the upstream site (RRSAC1), however the difference was not statistically significant (p = 0.153). During the Pilot Action, a statistically significant difference in zooplankton biomass density between upstream and outfall sites (p = 0.0191 and 0.0193, RRSAC2A and RRSAC2B respectively) was detected. Differences in zooplankton biomass density between the upstream site, the site half-mile downstream (p = 0.0596, RRSAC3), and one-mile downstream site (p = 0.0462, RRSAC4) were also detected. Canal total zooplankton biomass density always showed statistically significant differences from all river sites. See Table 2 for zooplankton biomass summary statistics by site.

Table 2: Total zooplankton biomass density summary before, during, and after Pilot Action. All zooplankton units are micrograms of dry carbon biomass per cubic meter water. X’s indicate no data collected.
Site Before Pilot Action During Pilot Action After Pilot Action min max mean sd min max mean sd min max mean sd
RRSAC1 11 1,921 638 642 53 148 96 41 170 429 316 117 RRSAC2A 81 2,446 1,225 917 338 7,207 3,969 2,958 191 1,535 776 456 RRSAC2B x x x x 480 4,428 2,136 1,561 x x x x RRSAC3 x x x x 142 883 472 378 x x x x RRSAC4 x x x x 129 1,104 581 458 x x x x RRCAN 672 42,904 13,021 15,260 12,952 42,437 25,041 11,056 2,730 7,058 4,108 2,005
In addition to increasing the total biomass of zooplankton in the river as a result of the Pilot Action (on average, approximately 40x at the outfall and up to 6x one mile downstream), the species assemblage of the in-river zooplankton community also changed. The floodplain zooplankton community is characterized by a high proportion of Cladocera spp. whereas rivers and canals tend to have more copepods (both cyclopoid and calanoid spp.). Before and after the Pilot Action, the river zooplankton community contained approximately 13-43% Cladocera spp. However, during the Pilot Action, the river zooplankton community shifted to approximately 55-70% Cladocera spp. See Table 3 for Cladocera spp. proportion summary statistics by site. See Figure 7 for a visualization of community and abundance trends in zooplankton biomass before, during, and after the Pilot Action. Table 3: Proportion of zooplankton biomass comprised of Cladocera spp. summary before, during, and after Pilot Action. X’s indicate no data collected.
Site Before Pilot Action During Pilot Action After Pilot Action min max mean sd min max mean sd min max mean sd
RRSAC1 0.0374 0.6730 0.4000 0.1869 0.0945 0.3832 0.1977 0.1166 0.0905 0.1774 0.1313 0.0467 RRSAC2A 0.3126 0.6074 0.4318 0.1116 0.6170 0.8087 0.7069 0.0696 0.0523 0.4775 0.2184 0.1424 RRSAC2B x x x x 0.4363 0.8649 0.7012 0.1702 x x x x RRSAC3 x x x x 0.4879 0.6486 0.5454 0.0714 x x x x RRSAC4 x x x x 0.4839 0.6926 0.5666 0.0766 x x x x RRCAN 0.0639 0.7214 0.3759 0.2412 0.6196 0.8054 0.7425 0.0716 0.0557 0.6115 0.3056 0.2687

Figure 7: Zooplankton biomass and assemblage data from river sites before, during, and after the Pilot Action (February 8 through March 10, 2019). Fish growth At the time of initial placement of enclosure fish into the Pilot Action field sites, their length ranged from 36-58 mm with a mean of 48 mm, and their weight ranged from 0.53-2.01 grams with a mean of 1.14 grams. At the end of the first week, nearly all fish less than 45 mm in length had disappeared from the cages, with no bodies remaining. This implies that, rather than mortality, many small fish escaped from the enclosures. Combining initial escape and mortality throughout the Pilot Action, the final fish count ended with: 25 fish in the canal, 22 fish upstream of the outfall, 14 and 15 fish at the outfall (RRSAC2A and RRSAC2B, respectively), 22 fish one half-mile downstream, and 27 fish one-mile downstream. For sites in the Sacramento River, the lowest average growth rate for all metrics was observed at the upstream site and the highest average growth rate for all metrics was at the outfall site. Except for a few high condition factor observations at the one-mile downstream site, the canal site outperformed every river site for every growth metric. In general, the river sites in descending order of growth rate performance ranked: RRSAC2A, RRSAC2B, RRSAC4, RRSAC3, RRSAC1. See Table 4 for a summary of growth rate statistics for all sites during the Pilot Action.

Table 4: Summary growth rate statistics for the duration of the Pilot Action. Units for each metric are millimeters per day and grams per day respectively.
Site Length Weight min max mean sd min max mean sd
RRSAC1 -0.333 0.5 0.091 0.165 -0.043 0.041 0.007 0.018 RRSAC2A -0.167 0.857 0.322 0.2 -0.01 0.081 0.035 0.021 RRSAC2B -0.167 0.714 0.286 0.217 -0.012 0.075 0.029 0.017 RRSAC3 -0.333 0.667 0.194 0.178 -0.022 0.068 0.018 0.017 RRSAC4 -0.333 0.714 0.267 0.229 -0.025 0.061 0.023 0.019 RRCAN -0.5 1.286 0.549 0.375 0.005 0.167 0.064 0.032
For overall fork length growth rate throughout the Pilot Action (all weeks pooled), all downstream river sites performed better than the upstream river site with strong statistical significance (p-values ranged from <0.001 – 0.024). The only other statistically significant comparison among the pooled downstream sites was the difference between growth rates at RRSAC2A and RRSAC3 (p = 0.011). When data are analyzed within each week, the comparisons between downstream and upstream sites were also statistically significant in week two (p-values ranged from <0.001 – 0.048) and in week three (all p-values <0.001), except for the comparison between RRSAC1 and RRSAC3 in week three, which was not significant (p = 0.568). No statistically significant differences among sites was found in week one. See Figure 8 for a visualization of fork length growth rate data by week and pooled for all weeks of the Pilot Action.

Figure 8: Fork length growth rate during the Pilot Action. For overall weight growth rate throughout the Pilot Action (all weeks pooled), all downstream river sites performed better than the upstream river site with strong statistical significance (p-values ranged from <0.001 – 0.005). Other statistically significant comparisons among the pooled downstream sites were the differences between growth rates at RRSAC2A and RRSAC2B compared with RRSAC3 (p <0.001 and p = 0.024, respectively). When data were analyzed within each week, the comparisons between downstream and upstream sites were also statistically significant in week two (all p-values <0.001) and in week three (all p-values <0.001), except for RRSAC3 which was not significantly different from RRSAC1 (p = 0.239). In week three, all comparisons among downstream sites were statistically significant (p-values ranged from <0.001 – 0.002), except for the comparison between RRSAC2B and RRSAC4 (p = 0.99). No statistically significant differences among sites was found in week one. See Figure 9 for a visualization of weight growth rate data by week and pooled for all weeks of the Pilot Action.

Figure 9: Weight growth rate during Pilot Action. Discussion Results show that managed export of high residence-time floodwaters can deliver floodplain-derived food web resources to the river ecosystem at a scale sufficient to improve growth rates of juvenile Chinook salmon in river habitats. During the approximately month-long Pilot Action, the river habitats saw an increase in zooplankton density of approximately 40x at the pump outfall and up to 6x one mile downstream. Fish caged at the pump outfall put on weight at approximately 5x the rate of those caged upstream. The zooplankton species assemblage of the in-river zooplankton community also took on a more floodplain-based composition, including a greater proportion of higher nutritional value and greater biomass per individual cladocerans species—the preferred prey species of juvenile Chinook salmon (Katz et al. 2017a, Corline et al. 2017, Goertler et al. 2018). Export of floodplain-derived food web resources from “dry-side” agricultural floodplains to “wet-side” fish-bearing channels will always be a relatively small volume compared to in-channel flows. It seems likely that the impact of floodplain exports will have the greatest impact

on river food webs during dry conditions. When there is relatively less streamflow, water drained off the floodplain will make up a greater proportion of the total volume of water in-stream. The winter of 2018-19 was one of the wettest on record. The river ran bankfull and stream channels were close to capacity during the February and March time frame of this experiment. Floodplain food web densities were diluted by a factor of 5x by run-off from precipitation before reaching the Rough and Ready pumping facility. Stream flow volume in the river during the duration of the experiment was 20-100x that of the drain water pumped. Given these extreme flood conditions that combined to diminish the impact of the floodplain trophic subsidy, we were pleasantly surprised to have detected such a strong floodplain signal in the river food web. We surmise that the benefit to fish populations would be even greater during normal and dry conditions when there is little floodplain habitat inundated in the Sacramento Valley nor floodplain-derived food web resources available to fish in-stream. This Pilot Action demonstrates the feasibility of reintegrating managed agricultural floodplains into the Sacramento River aquatic ecosystem at the landscape-scale. Although only single flood and drainage cycle was reported here, in the future we plan to explore the feasibility of flooding and draining the same lands multiple times, thereby increasing both the magnitude and timing that floodplain resources would be available to out-migrating salmonids. These results reiterate a simple fact of natural history: fish grow better when they have something to eat. Recovery of endangered fish populations will be impossible without first recovering the ecological processes which build and sustain functioning aquatic food webs. In order for California’s water system to provide water security for people and alleviate the regulatory burden and economic disruption caused by the ever-increasing threat of extinction in a collapsing ecosystem, threatened fish populations must regain access to the abundant food resources created on inundated floodplains. If implemented by irrigation and reclamation districts over hundreds of thousands of acres, a portfolio of floodplain practices similar to those documented in this report has the potential to reintegrate floodplain productivity into river food webs and enhance growth and survival of Sacramento Valley fish populations. References: Ahearn, D. S., J. H. Viers, J. F. Mount, and R. A. Dahlgren. 2006. Priming the productivity pump: flood pulse driven trends in suspended algal biomass distribution across a restored floodplain. Freshwater Biology 51:1417-1433. Bastviken, D., J. Ejlertsson, I. Sundh, and L. Tranvik. 2003. Methane as a source of carbon and energy for lake pelagic food webs. Ecology 84:969-981. Bayley, P. B. 1991. The flood pulse advantage and the restoration of river-floodplain systems. Regulated Rivers: Research & Management 6:75-86. California Trout. 2017. “SOS II: Fish in Hot Water; Status, threats, and solutions for California salmon, steelhead, and trout”. Self-published report.

Corline, N. J., T. Sommer, C. A. Jeffres, and J. Katz. 2017. Zooplankton ecology and trophic resources for rearing native fish on an agricultural floodplain in the Yolo Bypass California, USA. Wetlands Ecology and Management:1-13. Deines, P., P. L. Bodelier, and G. Eller. 2007. Methane-derived carbon flows through methane- oxidizing bacteria to higher trophic levels in aquatic systems. Environmental microbiology 9:1126-1134. Eadie, J., C. Elphick, K. Reinecke, and M. Miller. 2008. Wildlife values of North American ricelands. Elphick, C. S. 2008. Landscape effects on waterbird densities in California rice fields: taxonomic differences, scale-dependence, and conservation implications. Waterbirds:62-69. Elphick, C. S., O. Taft, and P. M. Lourenço. 2010. Management of rice fields for birds during the non-growing season. Waterbirds:181-192. Goertler, P., K. Jones, J. Cordell, B. Schreier, and T. Sommer. 2018. Effects of Extreme Hydrologic Regimes on Juvenile Chinook Salmon Prey Resources and Diet Composition in a Large River Floodplain. Transactions of the American Fisheries Society 147:287-299. Grosholz, E., and E. Gallo. 2006. The influence of flood cycle and fish predation on invertebrate production on a restored California floodplain. Hydrobiologia 568:91-109. Inamine, M., S. Punyamurthula, H. Bonakdar, S. Mahnke, R. Millet, and P. Dell. 2010. California’s Levee Evaluation Program. in US Society of Dams, 30th Conference, Sacramento, California. Jeffres, C. A., J. J. Opperman, and P. B. Moyle. 2008. Ephemeral floodplain habitats provide best growth conditions for juvenile Chinook salmon in a California river. Environmental Biology of Fishes 83:449-458. Jeffres, C. A., E. J. Holmes, T. R. Sommer, and J. V. E. Katz. 2019. Detrital Food Web Drives Aquatic Ecosystem Productivity in a Managed Floodplain. bioRxiv:610055. Junk, W. J., P. B. Bayley, and R. E. Sparks. 1989. The flood pulse concept in river-floodplain systems. Canadian special publication of fisheries and aquatic sciences 106:110-127. Katz, J., P. B. Moyle, R. M. Quiñones, J. Israel, and S. Purdy. 2013a. Impending extinction of salmon, steelhead, and trout (Salmonidae) in California. Environmental Biology of Fishes 96:1169-1186. Katz, J., Jeffres, C., Conrad, L., Sommer, T. 2012. “The Knaggs Ranch: Experimental Agricultural Floodplain Pilot Study 2011-2012.” Report to the US Bureau of Reclamation.

Katz, J., Jeffres, C., Conrad, L., Sommer, T., Corline, N., Martinez, J., Brumbaugh, S., Takata, L., Ikemiyagi, N., Kiernan, J., and Moyle, P. 2013b. “The Experimental Agricultural Floodplain Habitat Investigation at Knaggs Ranch on Yolo Bypass 2012-2013.” Report to the US Bureau of Reclamation. Katz, J., Jeffres, C., Conrad, L., Sommer, T., Takata, L., Ikemiyagi, N., Holmes, E., and Bell-Tilcock, M. 2014. “The Experimental Agricultural Floodplain Habitat Investigation at Knaggs Ranch on Yolo Bypass 2013-2014.” Report to the US Bureau of Reclamation. Katz, J., Jeffres, C., Conrad, L., Sommer, T., Takata, L., Ikemiyagi, N., Holmes, E., and Bell-Tilcock, M. 2015. “The Effects of Flow on Volitional Out-migration of Juvenile Chinook Salmon from Yolo Bypass Rice Fields Managed as Agricultural Floodplain Habitat: A report of the Experimental Agricultural Floodplain Habitat Investigation 2014-2015.” Report to the US Bureau of Reclamation. Katz, J. V., C. Jeffres, J. L. Conrad, T. R. Sommer, J. Martinez, S. Brumbaugh, N. Corline, and P. B. Moyle. 2017a. Floodplain farm fields provide novel rearing habitat for Chinook salmon. PLoS ONE 12:e0177409. Katz, J., Montgomery, J., Jeffres, C., Holmes, E., Ogaz, M., Saron, G., and Tillcock, M. 2017b. “Fish Food on Floodplain Farm Fields: Report of the 2017 Pilot Year Investigations.” Katz, J., Montgomery, J., Jeffres, C., Holmes, E. 2018 “Fish Food on Floodplain Farm Fields: 2018 Annual Report.” Moyle, P. B. 2002. Inland fishes of California. University of California Press, Berkeley, Ca. Moyle, P. B., J. V. Katz, and R. M. Quiñones. 2011. Rapid decline of California’s native inland fishes: A status assessment. Biological Conservation 144:2414-2423. Muller-Solger, A. B., A. D. Jassby, and D. C. Muller-Navarra. 2002. Nutritional quality of food resources for zooplankton (Daphnia) in a tidal freshwater system (Sacramento-San Joaquin River Delta). Limnology and Oceanography 47:1468-1476. Murase, J., and P. Frenzel. 2007. A methane-driven microbial food web in a wetland rice soil. Environmental microbiology 9:3025-3034. Opperman, J. J., G. E. Galloway, J. Fargione, J. F. Mount, B. D. Richter, and S. Secchi. 2009. Sustainable floodplains through large-scale reconnection to rivers. Science 326:1487-1488. Palijan, G. 2012. Abundance and biomass responses of microbial food web components to hydrology and environmental gradients within a floodplain of the River Danube. Microbial ecology 64:39-53.

Richter, B. D., R. Mathews, D. L. Harrison, and R. Wigington. 2003. Ecologically sustainable water management: Mmanaging river flows for ecological integrity. Ecological Applications 13:206-224. Sanseverino, A. M., D. Bastviken, I. Sundh, J. Pickova, and A. Enrich-Prast. 2012. Methane carbon supports aquatic food webs to the fish level. PLoS ONE 7:e42723. Sommer, T., B. Harrell, M. Nobriga, R. Brown, P. Moyle, W. Kimmerer, and L. Schemel. 2001b. California's Yolo Bypass: Evidence that flood control can be compatible with fisheries, wetlands, wildlife, and agriculture. Fisheries 26:6-16. Sommer, T. R., M. L. Nobriga, W. C. Harrell, W. Batham, and W. J. Kimmerer. 2001a. Floodplain rearing of juvenile Chinook salmon: Eevidence of enhanced growth and survival. Canadian Journal of Fisheries and Aquatic Sciences 58:325-333. Strum, K. M., M. E. Reiter, C. A. Hartman, M. N. Iglecia, T. R. Kelsey, and C. M. Hickey. 2013. Winter management of California's rice fields to maximize waterbird habitat and minimize water use. Agriculture, ecosystems & environment 179:116-124. Tockner, K., and J. A. Stanford. 2002. Riverine flood plains: present state and future trends. Environmental conservation 29:308-330.