fisheries · encourages comprehensive education of fisheries scientists ... beth beard production...
TRANSCRIPT
Fisheries • vol 33 no 2 • february 2008 • www.fisheries.org 53
FisheriesAmerican Fisheries Society • www.fisheries.org
Fish NewsLegislative UpdateJournal HighlightsCalendarJob Center
FisheriesVoL 33 No 2
FebrUary 2008
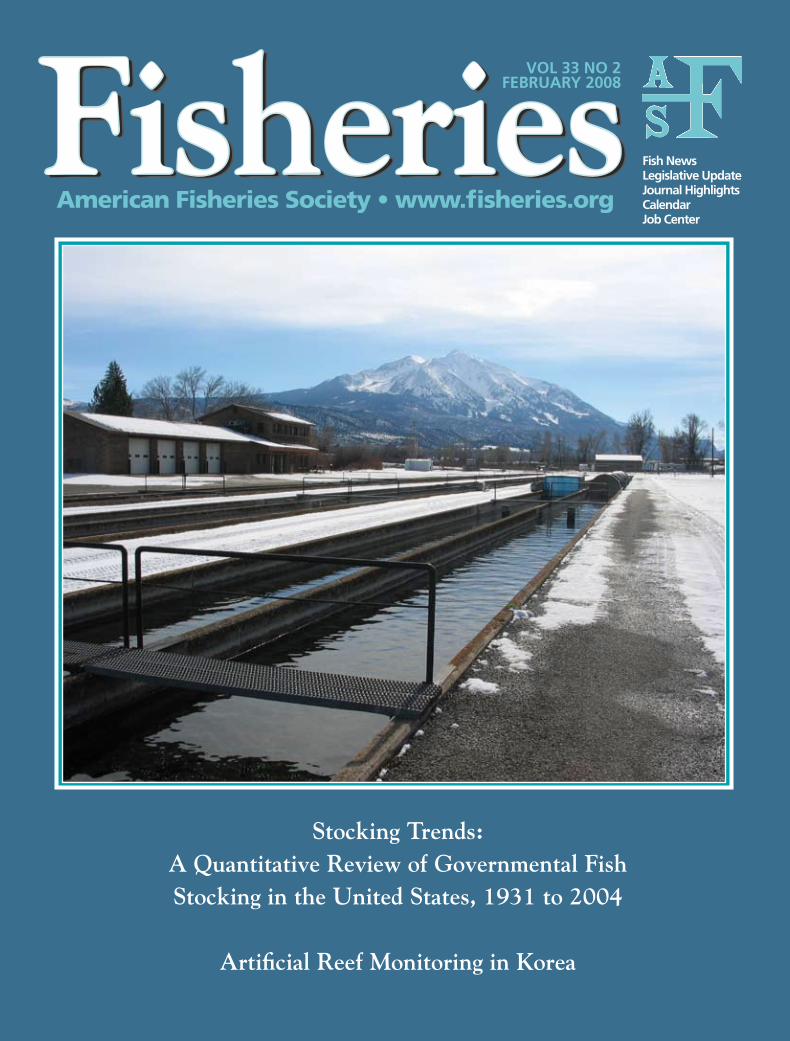
Stocking Trends: A Quantitative Review of Governmental Fish Stocking in the United States, 1931 to 2004
Artificial Reef Monitoring in Korea

Northwest Marine Technology, Inc.
54 Fisheries • vol 33 no 2 • february 2008 • www.fisheries.org
Lifelong Identification
We frequently discuss tag retention with our customers—it varies widely with the tag, species, tag location, and skill of the tagger. Our Coded Wire Tag (CWT) is exceptional for its high retention across many taxa, even when implanted in very small animals. Retention for the life of the animal is the norm. Here are some interesting examples of long-term CWT recoveries:
Biologists have been tagging sturgeon with CWT on the Missouri and Mississippi rivers in the central US for decades. In 2002, this effort was rewarded when biologists recaptured a fish that had been tagged an incredible 24 years before. Millions of lake trout have been tagged with CWT and released into North America’s Great Lakes. In 2006, tagged lake trout were recovered 22 years after release.
Since 1986, biologists at Hubbs-SeaWorld Research Institute in California have reared, tagged, and released more than a million white seabass to help rebuild the stocks of this popular sport fish. Seabass with CWT have been recovered 10 years after release, weighing over 17 pounds. In the Pacific northwest of Canada and the US, over 1.1 billion hatchery coho and Chinook salmon have been released with CWT. Most coho return to spawn by age 3. However, CWT recoveries show that they often return at ages 5 and 6. The longer lived Chinook mainly return at age 5, but CWT data shows that there are still returns at age 7 and 8.
This research, and many other programs around the world rely on Coded Wire Tags to identify and track aquatic organisms. Please contact us if we can help with yours.
Using coded wire tags, researchers at Florida’s Mote Marine Lab are assessing the effect of release habitat on the recapture rate of hatchery reared snook. They recently recaptured their largest hatchery snook to date in the same spot where it had been released 6 years before. Photo by J. Brennan.
Corporate Office 360.468.3375 [email protected]
Biological Services 360.596.9400 [email protected]
Northwest Marine Technology, Inc.www.nmt.us Washington, USA
Fisheries • vol 33 no 2 • february 2008 • www.fisheries.org 55
FisheriesameriCaN FisHeries soCiety • www.FisHeries.orgedITorIal / subscrIpTIoN / cIrculaTIoN offIces5410 Grosvenor lane, suite 110 • bethesda, Md 20814-2199301/897-8616 • fax 301/897-8096 • [email protected] american fisheries society (afs), founded in 1870, is the oldest and largest professional society representing fisheries scientists. The afs promotes scientific research and enlightened management of aquatic resources for optimum use and enjoyment by the public. It also encourages comprehensive education of fisheries scientists and continuing on-the-job training.
dues and fees for 2008 are $76 in North america ($88 elsewhere) for regular members, $19 in North america ($22 elsewhere) for student members, and $38 ($44) retired members. fees include $19 for Fisheries subscription. Nonmember and library subscription rates are $106 ($127). price per copy: $3.50 member; $6 nonmember. fisheries (IssN 0363-2415) is published monthly by the american fisheries society; 5410 Grosvenor lane, suite 110; bethesda, Md 20814-2199 ©copyright 2008. periodicals postage paid at bethesda, Maryland, and at an additional mailing office. a copy of fisheries Guide for authors is available from the editor or the afs website, www.fisheries.org. If requesting from the managing editor, please enclose a stamped, self-addressed envelope with your request. republication or systematic or multiple reproduction of material in this publication is permitted only under consent or license from the american fisheries society. postmaster: send address changes to fisheries, american fisheries society; 5410 Grosvenor lane, suite 110; bethesda, Md 20814-2199.
fisheries is printed on 10% post-consumer recycled paper with soy-based printing inks.
CoVer: colorado division of Wildlife crystal river Hatchery.Credit: M. anders Halverson
VoL 33 No 2FebrUary 2007
AFS OFFICERS
PresideNt Mary c. fabrizioPresideNt eLeCt William G. franzinFirst ViCe PresideNt donald c. JacksonseCoNd ViCe PresideNt Wayne a. HubertPast PresideNt Jennifer l. NielsenexeCUtiVe direCtor Ghassan “Gus” N. rassam
FISHERIES STAFF
seNior editor Ghassan “Gus” N. rassamdireCtor oF PUbLiCatioNs aaron lernermaNagiNg editor beth beardProdUCtioN editor cherie Worth
EdITORS
sCieNCe editorsMadeleine Hall-arber Ken ashleydoug beard Ken currens William e. Kelso deirdre M. Kimball robert T. lackey dennis lassuy allen rutherford book reView editors francis Juanes ben letcher Keith Nislow
advanced Telemetry systems, Inc. . . 103
emperor aquatics, Inc. . . . . . . . . 93
floy Tag . . . . . . . . . . . . . . . . 79
frigid units, Inc. . . . . . . . . . . . . 67
Halltech . . . . . . . . . . . . . . . 77
Hydroacoustic Technology, Inc. . . . . 57
little river research and design . . . . 68
Memorial university of Newfoundland 101
National conservation leadership Institute 99
Northwest Marine Technology, Inc. . . 54
onset . . . . . . . . . . . . . . . . . 95
rutgers university . . . . . . . . . . 101
Vemco (amirix systems, Inc.) . . . . . 63
Vemco (amirix systems, Inc.) . . . . . 65
tell advertisers you found them through Fisheries!
69
COlumn:56 PreSident'S HookCan Certification as a Fisheries Professional Help You?a conversation with roger rulifson reveals the many benefits of certification, from serving as an expert witness in legal proceedings to finding employment in the public or private sectors. Roger A Rulifson and Mary C. Fabrizio
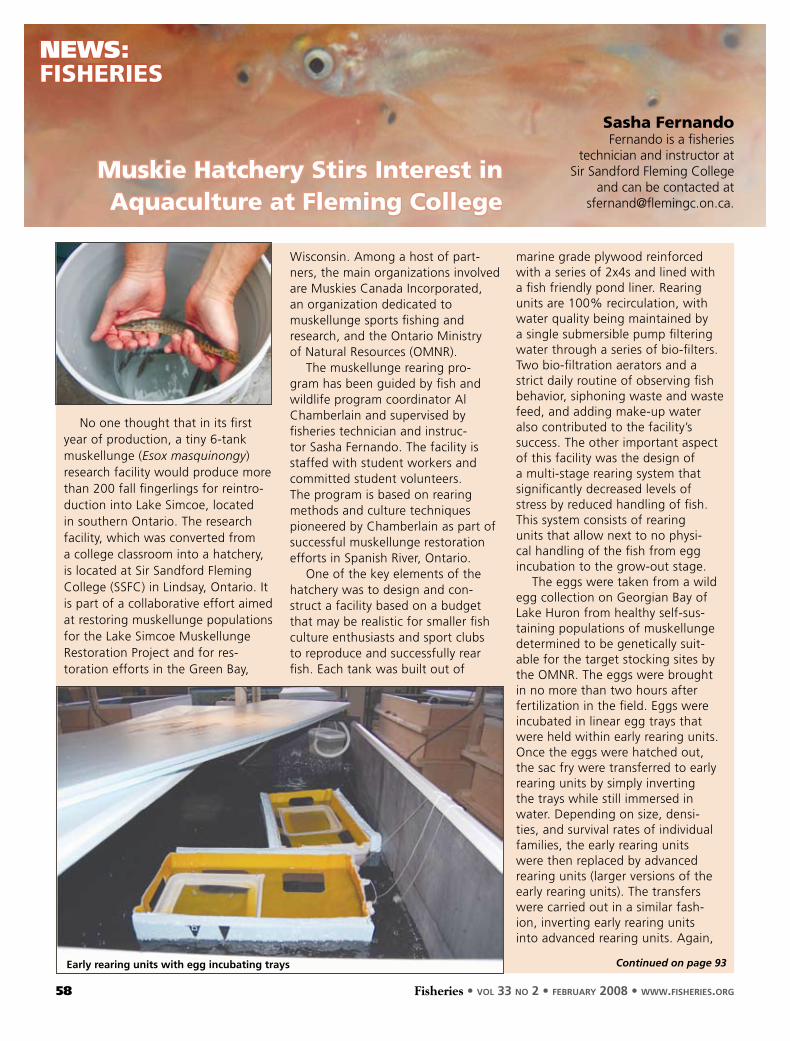
nEwS:58 FiSHerieSMuskie Hatchery Stirs interest in Aquaculture at Fleming CollegeSasha Fernando
JOuRnAl HIgHlIgHTS:59 trAnSACtionS oF tHe AMeriCAn FiSHerieS SoCietY
updATE:60 LegiSLAtion And PoLiCYElden Hawkes, Jr.
FeATURe:61 FiSh hAbiTATPost-Placement Management of Artificial Reefs in Korea The post-placement management of artificial reefs is an important process in recovering and sustaining the performance of reefs. Authors describe the survey components and their methods for the post-management of artificial reefs. Chang Gil Kim and Ho Sang Kim
FeATURe:69 FiSh CUlTUReStocking Trends: A Quantitative Review of Governmental Fish Stocking in the United States, 1931 to 2004This article describes the total number and weight of fish stocked by government agencies in the United States in 2004 and also examines historical trends.M. Anders Halverson
COlumn:
76 gueSt direCtor'S LineSix decades of Fishery genetics: taking Stocka recent symposium examined the past, present, and future of fishery genetics, especially its role in helping solve crucial fisheries management questions. The event also honored fred utter for his many years of leadership in this field.Robin S. Waples, Walton W. Dickhoff, Lorenz Hauser, and Nils Ryman
nEwS:
80 unitS
AgEnCy pROFIlE:
85 u.S. FiSH And WiLdLiFe ServiCeurban Fishing and the uSFWS: new opportunities in Changing times Bennie M. Williams
CAlEndAR:
88 FiSHerieS eventS
COlumn:
90 StudentS' AngLeeducation, networking, and Fun: A preview of student activities at the 2008 AFS Annual Meeting in ottawaMichael R. Donaldson and Melissa R. Wuellner
ObITuARy:
94 HoWArd CLeMenSProfessor emeritus, university of oklahoma
updATE:
95 AnnuAL Meetingdestination ottawa—A Capital idea
AnnOunCEmEnTS:
99 Job Center
61
Advertising index
Contents

56 Fisheries • vol 33 no 2 • february 2008 • www.fisheries.org
COlumn:PreSident'S Hook
Can Certification as a Fisheries Professional Help You?
Fabrizio: I understand that fisher-ies professionals can be called upon to serve as “expert witnesses” in the court-room or before congressional panels. What types of issues require expert testimony by fisheries professionals?
rulifson: Many, actually, and most of the cases that require expert witnesses will be controversial. any activity that may cause harm to the environment could involve a court case with expert testimony. lawyers on both sides of the argument will seek testimony from researchers and agency personnel familiar with the issue at hand and the potential effects on fish and fisheries. for example, the other day a colleague walked into my office asking for advice about testifying as an expert witness before a congressional committee during hearings on the potential harm to marine mammals of underwater acoustic tests conducted by a certain branch of the military. apparently, the committee was not very knowledgeable about the fact that fish can hear too. My colleague came to me because I have testified as an expert witness in the past, although for a different project, and because he knew that I am a certified fisheries professional and he was not.
Fabrizio: but, roger, you have earned a graduate degree—why would you need to be certified? Isn’t it enough to provide evidence of your academic credentials and your scholarly publication record to be considered an “expert?”
rulifson: a court of law is not an aca-demic institution and the requirements for establishing a person’s expertise are differ-
ent from what we typically encounter in the workplace. attorneys involved in the case will examine your credentials to determine if you can serve as an “expert witness.” This is because an expert witness can testify not only about scientific facts, but can also provide opinions in his/her area of expertise. attorneys seek the professional judgment of scientists, and this requires some form of certification in order to establish cred-ibility. What saved me and my reports and publications from being discredited was the fact that I was “certified fisheries scientist No. 1558.” My certificate is signed by afs president bill lewis, afs executive director carl sullivan, and the chair of the board of professional certification, larry olmsted. The certificate hangs proudly on my wall in my university office for my students to see.
Fabrizio: so, establishing your cred-ibility in a court of law where one serves as an expert witness is one reason to become certified, but are there any other reasons to consider certification?
rulifson: sure! some state agencies require certification before hiring fisher-ies professionals, even at the entry level (e.g., alabama). other states require that applicants meet the basic provisions for cer-tification and will declare this requirement in the vacancy announcement and during the interview process (e.g., North carolina and Wisconsin). In addition, some state agencies offer increases in pay to those who become certified while on the job.
Fabrizio: This would imply that candidates for afs certification are
mainly state agency professionals and others who may be required to serve as an expert witness. Is this true?
rulifson: Yes, in general. since 2002, most of the professionals that applied for certification for the first time were primar-ily state biologists (28%), industry biolo-gists (24%), and students (21%). federal employees (8%) and those professionals working in academia (4%) made up a minority. also represented were county biologists (1%) and biologists working with non-governmental organizations (1%). The remainder were unemployed, often recent post-graduates (13%).
Fabrizio: It seems that some stu-dents could benefit from certification as they prepare themselves for the job market. Is there any evidence of this?
rulifson: Industry biologists see the value of being certified by an authoritative body. This is reflected in the fact that nearly one-fourth of the applications for afs certi-fication have been from industry applicants. other professional organizations also offer certification, but for different disciplines in ecology. for example, on my last visit to canada, I saw a medium-sized advertise-ment in the Halifax, Nova scotia, news-paper announcing the recent hire of two staff members at a private wetlands survey company, and the ad proudly proclaimed that the new hires were “wetlands certi-fied.” below the tag line was a photograph of two young scientists with appropriate field equipment, standing in a wetland and
roger A rulifson and Mary C. Fabrizioafs president fabrizio can be contacted at [email protected]. roger a. rulifson is a senior scientist and professor in the Institute for Interdisciplinary coastal science and policy, and the department of biology at east carolina university in Greenville, North carolina. He can be contacted at [email protected].
the american Fisheries society is the only fisheries organization that offers professional certification as one of its many services. though certification may not be for everyone, some aFs members find this service vital and absolutely necessary. might you benefit from aFs certification? this month, i’ve asked roger rulifson to speak with me about the benefits of certification, from serving as an expert witness to improving your employment success in some segments of the job market.
Continued on page 68

Hydroacoustic Technology, Inc.
Fisheries • vol 33 no 2 • february 2008 • www.fisheries.org 57
58 Fisheries • vol 33 no 2 • february 2008 • www.fisheries.org
nEwS:FiSHerieS
No one thought that in its first year of production, a tiny 6-tank muskellunge (Esox masquinongy) research facility would produce more than 200 fall fingerlings for reintro-duction into lake simcoe, located in southern ontario. The research facility, which was converted from a college classroom into a hatchery, is located at sir sandford fleming college (ssfc) in lindsay, ontario. It is part of a collaborative effort aimed at restoring muskellunge populations for the lake simcoe Muskellunge restoration project and for res-toration efforts in the Green bay,
Wisconsin. among a host of part-ners, the main organizations involved are Muskies canada Incorporated, an organization dedicated to muskellunge sports fishing and research, and the ontario Ministry of Natural resources (oMNr).
The muskellunge rearing pro-gram has been guided by fish and wildlife program coordinator al chamberlain and supervised by fisheries technician and instruc-tor sasha fernando. The facility is staffed with student workers and committed student volunteers. The program is based on rearing methods and culture techniques pioneered by chamberlain as part of successful muskellunge restoration efforts in spanish river, ontario.
one of the key elements of the hatchery was to design and con-struct a facility based on a budget that may be realistic for smaller fish culture enthusiasts and sport clubs to reproduce and successfully rear fish. each tank was built out of
marine grade plywood reinforced with a series of 2x4s and lined with a fish friendly pond liner. rearing units are 100% recirculation, with water quality being maintained by a single submersible pump filtering water through a series of bio-filters. Two bio-filtration aerators and a strict daily routine of observing fish behavior, siphoning waste and waste feed, and adding make-up water also contributed to the facility’s success. The other important aspect of this facility was the design of a multi-stage rearing system that significantly decreased levels of stress by reduced handling of fish. This system consists of rearing units that allow next to no physi-cal handling of the fish from egg incubation to the grow-out stage.
The eggs were taken from a wild egg collection on Georgian bay of lake Huron from healthy self-sus-taining populations of muskellunge determined to be genetically suit-able for the target stocking sites by the oMNr. The eggs were brought in no more than two hours after fertilization in the field. eggs were incubated in linear egg trays that were held within early rearing units. once the eggs were hatched out, the sac fry were transferred to early rearing units by simply inverting the trays while still immersed in water. depending on size, densi-ties, and survival rates of individual families, the early rearing units were then replaced by advanced rearing units (larger versions of the early rearing units). The transfers were carried out in a similar fash-ion, inverting early rearing units into advanced rearing units. again,
Muskie Hatchery Stirs interest in Aquaculture at Fleming College
Sasha Fernandofernando is a fisheries
technician and instructor at sir sandford fleming college
and can be contacted at [email protected].
Continued on page 93early rearing units with egg incubating trays

Fisheries • vol 33 no 2 • february 2008 • www.fisheries.org 59
Life History of Hickory shad in the st. Johns river, Florida. Julianne e. Harris, richard s. Mcbride, and roy o. Williams, pages 1463-1471.
Population status of white sturgeon in the Lower Columbia river within Canada. robyn l. Irvine, dana c. schmidt, and larry r. Hildebrand, pages 1472-1479.
mitochondrial dNa Haplotype diversity in apparent xy Female Fall-run and spring-run Chinook salmon in California's Central Valley. Kevin s. Williamson and bernie May, pages 1480-1486.
bypass system modification at bonneville dam on the Columbia river improved the survival of Juvenile salmon. John W. ferguson, benjamin p. sandford, rachel e. reagan, lyle G. Gilbreath, edward b. Meyer, richard d. ledgerwood, and Noah s. adams, pages 1487-1510.
scaling acoustic telemetry of bluefish in an estuarine observatory: detection and Habitat Use Patterns. Thomas M. Grothues and Kenneth W. able, pages 1511-1519.
annual Fecundity of tautog in Long island sound: size effects and Long-term Changes in a Harvested Population. lori Hosaka laplante and eric T. schultz, pages 1520-1533.
age, growth, and reproduction of greater amberjack off the southeastern U.s. atlantic Coast. patrick J. Harris, david M. Wyanski, d. byron White, paulette p. Mikell, and pamela b. eyo, pages 1534-1545.
[Note] the effects of boat Propeller scarring on Nekton growth in subtropical seagrass meadows. dana d. burfeind and Gregory W. stunz, pages 1546-1551.
anticipated Climate warming effects on bull trout Habitats and Populations across the interior Columbia river basin. bruce e. rieman, daniel Isaak, susan adams, dona Horan, david Nagel, charles luce, and deborah Myers, pages 1552-1565.
relationships between body Condition indices and Proximate Composition in adult walleyes. s. d. Kaufman, T. a. Johnston, W. c. leggett, M. d. Moles, J. M. casselman, and a. I. schulte-Hostedde, pages 1566-1576.
Population dynamics and distribution Patterns of Longfin smelt in the san Francisco estuary. Jonathan a. rosenfield and randall d. baxter, pages 1577-1592.
exposure of Unionid mussels to electric Current: assessing risks associated with electrofishing. f. Michael Holliman, Thomas J. Kwak, W. Gregory cope, and Jay f. levine, pages 1593-1606.
[Note] the effects of temperature, dissolved oxygen, and asian tapeworm infection on growth and survival of the topeka shiner. Jessica J. Koehle and Ira r. adelman, pages 1607-1613.
[Note] bridging the energy gap: anadromous blueback Herring Feeding in the Hudson and mohawk rivers, New york. paul W. simonin, Karin e. limburg, and leonard s. Machut, pages 1614-1621.
early discrimination of atlantic salmon smolt age: time Course of the relative effectiveness of body size and shape. Jamie H. pearlstein, benjamin H. letcher, and Mariska obedzinski, pages 1622-1632.
[Note] expansion of a Northern snakehead Population in the Potomac river system. John odenkirk and steve owens, pages 1633-1639.
an evaluation of the relative influence of spatial, statistical, and biological Factors on the accuracy of stream Fish species Presence models. John c. ruiz and James T. peterson, pages 1640-1653.
river restoration effects on steelhead Populations in the manistee river, michigan: analysis Using an individual-based model. Jeffrey a. Tyler and edward s. rutherford, pages 1654-1673.
impacts of marker Class bias relative to Locus-specific Variability on Population inferences in Chinook salmon: a Comparison of single-Nucleotide Polymorphisms with short tandem repeats and allozymes. christian T. smith, anton antonovich, William d. Templin, carita M. elfstrom, shawn r. Narum, and lisa W. seeb, pages 1674-1687.
what Causes Variability in Pink salmon Family size? Harold J. Geiger, Ivan Wang, pat Malecha, Kyle Hebert, William W. smoker, and anthony J. Gharrett, pages 1688-1698.
anthropogenic impacts on american eel demographics in Hudson river tributaries, New york. leonard s. Machut, Karin e. limburg, robert e. schmidt, and dawn dittman, pages 1699-1713.
effects of water temperature on interspecific Competition between Juvenile bull trout and brook trout in an artificial stream. Mike c. rodtka and John p. Volpe, pages 1714-1727.
[Note] relationships between a Fish index of biotic integrity and mean Length and density of brook trout and brown trout in wisconsin streams. Joanna d. Tober Griffin and andrew H. fayram, pages 1728-1735.
Freshwater sculpins: Phylogenetics to ecology. susan b. adams and david a. schmetterling, pages 1736-1741.
mitochondrial dNa Variation in the ozark Highland members of the banded sculpin Cottus carolinae Complex. andrew p. Kinziger, damon H. Goodman, and rebecca s. studebaker, pages 1742-1749.
size-dependent territoriality of mottled sculpin in a southern appalachian stream. J. Todd petty and Gary d. Grossman, pages 1750-1761.
reproductive ecology of slimy sculpin in small New brunswick streams. rachel a. Keeler and richard a. cunjak, pages 1762-1768.
movement Patterns of Japanese Fluvial sculpin Cottus pollux in a Headwater stream. Takaharu Natsumeda, pages 1769-1777.
Use of techniques from Foraging theory to Quantify the Cost of Predation for benthic Fishes. Karl M. polivka, pages 1778-1790.
interactions between slimy sculpin and trout: slimy sculpin growth and diet in relation to Native and Nonnative trout. Julie K. H. Zimmerman and bruce Vondracek, pages 1791-1800.
ontogenetic diet shifts of Prickly sculpin in the Lake washington basin, washington. roger a. Tabor, eric J. Warner, Kurt l. fresh, brian a. footen, and Jeffrey r. chan, pages 1801-1813.
JOuRnAl HIgHlIgHTS:trAnSACtionS oF tHe AMeriCAn FiSHerieS SoCietY
to subscribe to aFs journals go to www.fisheries.org and click on Publications/Journals.
VOlumE 136 ISSuE 6
nOVEmbER 2007

60 Fisheries • vol 33 no 2 • february 2008 • www.fisheries.org
bill to reverse ePa global warming waiver decision
on 28 January, u.s. senator barbara boxer (d-ca), chair of the senate committee on environment and public Works, introduced legislation that would direct the u.s. environmental protection agency (epa) to grant california a waiver under the clean air act to cut global warming pol-lution from motor vehicles.
cosponsors of the bill include senators dianne feinstein (d-ca), Joseph lieberman (I-cT), Hillary clinton (d-NY), frank lautenberg (d-NJ), benjamin cardin (d-Md), bernie sanders (I-VT), sheldon Whitehouse (d-rI), edward Kennedy (d-Ma), patrick leahy (d-VT), christopher dodd (d-cT), John Kerry (d-Ma), barbara a. Mikulski (d-Md), olympia snowe (r-Me), susan collins (r-Me), bill Nelson (d-fl.), barack obama (d-Il), and roberts Menendez (d-NJ).
The bill directs the administra-tor of the environmental protection agency to grant california's request for the waiver, which will allow california to implement its green-house gas emissions standards for motor vehicles. The waiver will also permit other states to adopt california's emissions standards.
fourteen other states have adopted california's standards, or are in the process of adopting them. another four are moving toward adopting the california standards. all together, those 19 states represent more than 152,000,000 americans —a majority of the u.s. population.
marine Protected areas Federal advisory Committee issues recommendations.
on 19 November 2007, the Marine protected areas federal advisory committee issued its recommendation for developing a framework for Mpas. Marine protected areas (Mpas) include sites that vary in size, shape, objec-tives, and types and levels of protec-tion, but focus on conservation. Mpas in the united states include national marine sanctuaries, some fi sheries management areas, national wildlife refuges, and state conservation areas. The committee's role is to provide expert advice and recommendations to the secretaries of commerce and the Interior on implementation of aspects of section 4 of executive order 13158, the heart of the national Mpa initiative.
The committee issued recommenda-tions on the following components: a process for determining which exist-ing Mpa sites will constitute the initial national system of Mpas, a model for developing plans for effective Mpa management, incentives for par-ticipation in the National system of Marine protected areas, and regional approaches to planning and coordi-nation of marine protected areas.
The committee divided its processes for determining Mpas into two sub-headings: (1) moving existing Marine Managed areas (MMas) to the set of eligible Mpas and (2) moving the set of Mpas to the initial National system of Marine protected areas. Guidelines for moving existing Mpas include confi rm-ing that a site meets the defi nition of Mpas and the site meets the priority objectives. The second subheading focuses the governmental processes in
the nominating of existing Mpas to be included in the national Mpa system.
In regards to creating a model for developing plans for effective Mpa man-agement, the committee recommended that the management plan should be preceded by a statement about the his-tory of Mpas, and that the management plan should contain the following com-ponents: statement of goals, list of man-agement objectives, list of management actions, procedures for determining effectiveness of management actions, and procedures for periodically review-ing and updating the management plan.
The committee also outlined its rec-ommendations for providing incentives for participation in the national system of Mpas. These incentives would be designed to encourage the participation and cooperation by government agen-cies and by existing and future partners. These recommendations include the departments of commerce and the Interior committing to the following:
• using monetary and non-mon-etary incentives to realize the benefi ts of a national system;
• developing a range of cost esti-mates to develop and imple-ment a national system;
• seeking legislative opportunities to authorize the national system to provide a legal authority;
• establishing long-term fund-ing mechanisms;
• Informing Mpa programs and sites of the potential benefi ts of the national system;
• directing their national and regional management, educa-tion, and research programs to
updATE:LegiSLAtion And PoLiCY
elden Hawkes, Jr.
aFs Policy Coordinator Hawkes can be contacted at
ehawkes@fi sheries.org.
Continued on page 85
Fisheries • vol 33 no 2 • february 2008 • www.fisheries.org 61
Korea has been installing artificial reefs since 1971 to enhance the produc-tivity of its coastal fisheries. Up until 2005, national funding increased every year, totaling approximately $686 mil-lion (U.S.), with the total installation volume amounting to approximately 9.4 million m3 (KNFRDI 2005). Artificial reefs in Korea hold an important posi-tion in terms of the nation’s fishery pol-icy and their installation will increase in the future.
However, recently lost trawl and trammel gill netting have become prevalent at artificial reefs (Kim 2001). Excessive fishing operations along the reefs tend to lead not only to isolation (e.g., towing away by fishing gear) of reef modules from piled reef heaps, but
also to the accumulation of lost fish-ing equipment (Kim et al. 2003, 2005, 2006). In particular, derelict fishing gear that becomes entangled with arti-ficial reefs is liable to disturb the attrac-tion of fish in and around the reefs, and ultimately results in lowered productiv-ity (Kim et al. 2006; Seaman and Jensen 2000). Furthermore, anglers have become reluctant to fish the artificial reefs due to the repeated entanglement of their fish hooks with abandoned fish-ing nets. In addition, frequent typhoons tend to cause overturns, wrecks, and separations among the artificial reefs installed in waters shallower than 20 m. The combination of reckless human behavior and natural calamity has erected significant obstacles to enlarg-
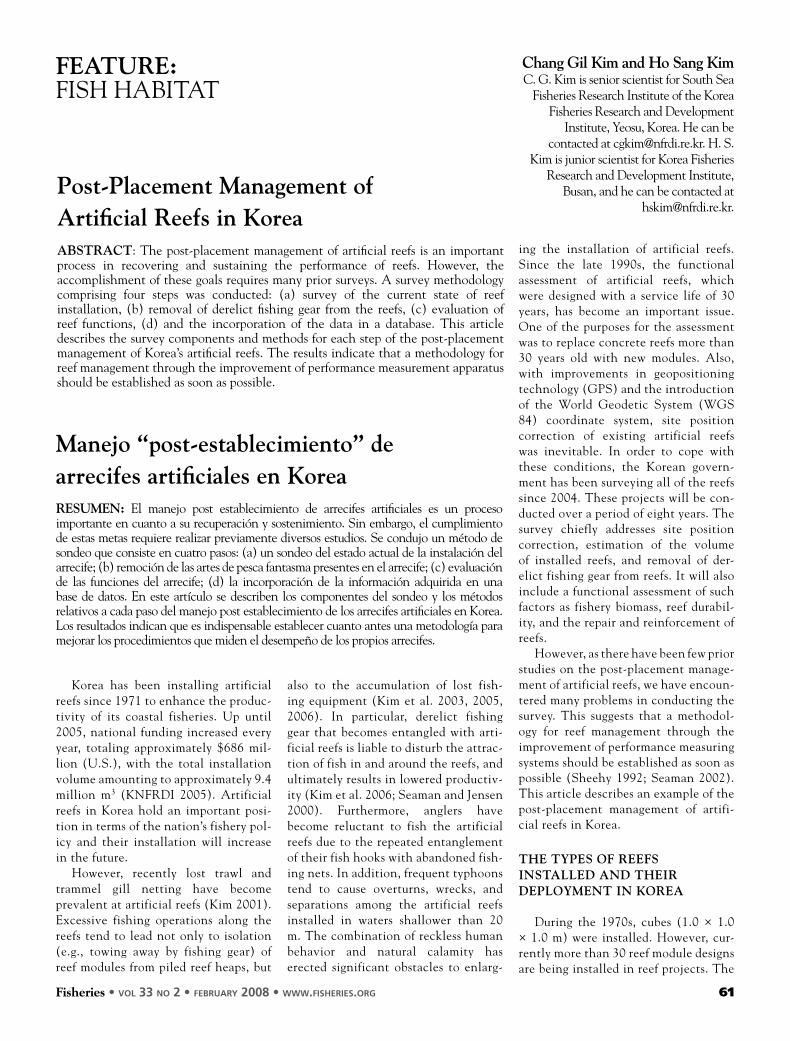
Post-Placement Management of Artificial Reefs in Korea AbSTRACT: The post-placement management of artificial reefs is an important process in recovering and sustaining the performance of reefs. However, the accomplishment of these goals requires many prior surveys. A survey methodology comprising four steps was conducted: (a) survey of the current state of reef installation, (b) removal of derelict fishing gear from the reefs, (c) evaluation of reef functions, (d) and the incorporation of the data in a database. This article describes the survey components and methods for each step of the post-placement management of Korea’s artificial reefs. The results indicate that a methodology for reef management through the improvement of performance measurement apparatus should be established as soon as possible.
FeATURe:FISH HAbITAT
Chang Gil Kim and ho Sang Kim C. G. Kim is senior scientist for South Sea
Fisheries Research Institute of the Korea Fisheries Research and Development
Institute, Yeosu, Korea. He can be contacted at [email protected]. H. S.
Kim is junior scientist for Korea Fisheries Research and Development Institute,
busan, and he can be contacted at [email protected].
Manejo “post-establecimiento” de arrecifes artificiales en KoreaReSUMen: El manejo post establecimiento de arrecifes artificiales es un proceso importante en cuanto a su recuperación y sostenimiento. Sin embargo, el cumplimiento de estas metas requiere realizar previamente diversos estudios. Se condujo un método de sondeo que consiste en cuatro pasos: (a) un sondeo del estado actual de la instalación del arrecife; (b) remoción de las artes de pesca fantasma presentes en el arrecife; (c) evaluación de las funciones del arrecife; (d) la incorporación de la información adquirida en una base de datos. En este artículo se describen los componentes del sondeo y los métodos relativos a cada paso del manejo post establecimiento de los arrecifes artificiales en Korea. Los resultados indican que es indispensable establecer cuanto antes una metodología para mejorar los procedimientos que miden el desempeño de los propios arrecifes.
ing the installation of artificial reefs. Since the late 1990s, the functional assessment of artificial reefs, which were designed with a service life of 30 years, has become an important issue. One of the purposes for the assessment was to replace concrete reefs more than 30 years old with new modules. Also, with improvements in geopositioning technology (GPS) and the introduction of the World Geodetic System (WGS 84) coordinate system, site position correction of existing artificial reefs was inevitable. In order to cope with these conditions, the Korean govern-ment has been surveying all of the reefs since 2004. These projects will be con-ducted over a period of eight years. The survey chiefly addresses site position correction, estimation of the volume of installed reefs, and removal of der-elict fishing gear from reefs. It will also include a functional assessment of such factors as fishery biomass, reef durabil-ity, and the repair and reinforcement of reefs.
However, as there have been few prior studies on the post-placement manage-ment of artificial reefs, we have encoun-tered many problems in conducting the survey. This suggests that a methodol-ogy for reef management through the improvement of performance measuring systems should be established as soon as possible (Sheehy 1992; Seaman 2002). This article describes an example of the post-placement management of artifi-cial reefs in Korea.
The TyPeS oF ReeFS inSTAlled And TheiR dePloyMenT in KoReA
During the 1970s, cubes (1.0 × 1.0 × 1.0 m) were installed. However, cur-rently more than 30 reef module designs are being installed in reef projects. The

62 Fisheries • vol 33 no 2 • february 2008 • www.fisheries.org
height of these reefs ranges from 2–10 m, and their bulk volumes are between 8 and 800 m3. The main materials used to fabricate these reefs are concrete and steel, although concrete reefs represent over 90% of the 31 reef designs. Of these, the dice reef (2 x 2 x 2 m) accounts for over 75% of the total reefs.
Artificial reef size in Korea is divided into three units of measurement—the unit block, reef set, and reef group (Kim 2001). Reefs which measure more than 3 m in height, i.e., jumbo reefs (5.0 x 5.7 x 6.5 m), are installed by unit blocks at intervals of two to three times the largest bottom dimen-sion of the reef module. Reefs of less than 3 m in height, i.e., dice reefs, are placed in a random pile. The overall bottom area (footprint) of a dice reef set ranges from 20 x 20 m to 25 x 25 m, whereas the height of each instal-lation varies from 3 to 6 m.
SySTeM FoR PoST-PlACeMenT MAnAGeMenT oF ARTiFiCiAl ReeFS in KoReA
The survey comprises four steps: survey of the state of reef installa-tions, removal of derelict fishing gear from reefs, evaluation of reef func-tions, and incorporating surveyed data into a database. Each step of the work is conducted as follows.
Survey of the state of reef installation
The first step includes surveying for location correction, volume, height, scouring, turnover, settlement, and dispersion of installed reefs. A survey for the correction of reef locations is made by using both a rough sur-vey and a detailed survey. The rough survey includes information such as the rough location, shape, turnover, and dispersion of reefs in an area of 400 x 400 m, which is the mini-mum area of a reef set in Korea. The detailed survey contains information such as volume, height, scouring, and settlement of reefs in an area of 100 x 100 m. The rough surveys are conducted by using side scan sonar (SSS) and the detailed surveys use a multi-beam echo sounder (MbES).
This combination of equipment has proven to save time and effort for the survey. MbES provides precise informa-tion on the installed reefs (Shyue and Yang 2002). As the survey by a MbES, however, is carried out at relatively nar-row intervals of a certain area, it can become expensive. Therefore, detect-ing a synoptic location of reefs over a considerably wider area by SSS may be more cost-effective than MbES, which
is operated in a limited area (e.g., 100 x 100 m). However, the methodology sug-gested here may be applied differently according to the level of reef informa-tion needed (Cuevas et al. 2002).
The SSS used are a Sea View 400S and a DSME UTECH S-150, which have a sound frequency of 400 kHz. The horizontal beam width is 0.2 and 0.3 degrees, and the vertical beam width is 40 degrees. The survey range
scale is about 100 m with duplicated line spacing of 50%. The tow speed is 2 to 3 knots (KNFRDI 2006). On the other hand, the MbES used are a Reson 9001 and a Simmrad EM 3002, which have a beam width of less than 1.5 degrees and a swath width that is twice the water depth. The survey range scale is approxi-mately 20 m for 200% coverage, and vessel speed is about 3 knots (KNFRDI 2006). Information on the scouring and settlement obtained by the MbES is confirmed by a diver using scuba equipment.
An estimation of the installed reef volume is only made of dice reef sets which have a unit volume of 1 m3 and 8 m3. This is because dice reefs are randomly piled up, while the other units are installed indi-vidually. As previously described, the guidelines regarding reefs in Korea prescribe the volume of a reef set as 800 m3. When a dice reef block of 8 m3 is used, 100 blocks are installed as a reef set. Thus, the esti-mation of reef volume (the number of installed reefs) has two meanings: one concerns whether installed reefs are precisely placed in a given area or not; the other concerns whether they have retained their stability without any settlement or burial. The number of installed reef units is calculated by dividing the bulk vol-ume of MbES by 1 m3 or 8 m3 of the dice reefs. As the value, however, does not provide information on the actual quantity, the coefficient of the shape of the piled reefs is used. This is because an acquired bulk volume has a different void space ratio according to the piled shapes. Figure 1 shows that, although all of 3 shapes consist of 100 units of dice reef, their volumes (i.e., 953, 1075, 1,113 m3) are different according to
Figure 1. differences in bulk volume by Mbes according to piled shapes of dice reef (2 x 2 x 2 m).
Figure 2. scouring and accretion of artificial reefs. The upper picture shows a simple type with predominant scouring/erosion around reefs, and the lower picture a mixed type with both scouring and accretion around reefs.
Figure 3. fishing gear entangled with artificial reefs. The bottom left shows an eel pot, and the bottom right is a spring trap.
Vemco (amirix systems, Inc.)
Fisheries • vol 33 no 2 • february 2008 • www.fisheries.org 63
their installed shape. Therefore, to obtain the actual vol-ume, the coefficient should be considered. The coefficient in this study was derived from the value of 3 different reef set shapes with approximately 4 m of reef installation height. For example, if the surveyed mean reef volume—which con-sists of 100 dice reefs—is 1,047 m3, then 800 m3 divided by 1,047 m3 gives 0.76. The actual number of reefs is estimated by multiplying the volume of MbES by 0.76, and then divid-ing by either 1 m3 or 8 m3 of dice reefs. The estimation of reef volume is also affected by settlement. In this case, we regard a reef block with less than 50 cm of settlement as the same volume measurement as one with no settlement. This is based upon actual field experience that reef function is not affected by 50 cm burial when 2 m in height (Kim et al. 2006). Nevertheless, a more logical approach is required to obtain precise information.
Scouring around reefs is classified as two types: a sim-ple type with predominant scouring/erosion around reefs and a mixed type with both scouring and accretion around reefs (Figure 2). The former is found at reef sets installed in deeper water where the current is very strong, and the latter is observed around reefs in shallower areas of water with a depth of less than 20 m. However, in some places both types are observed, irrespective of water depth. Scouring has been found to be much deeper and wider at reefs with a steady current rather than at reefs influenced by waves. Scouring is the result of flow acceleration and separation around the structure, where a horseshoe vortex is induced by the verti-cal pressure gradient along the leading edge of the structure. The extent and volume of the wave or current-induced scour-ing depends on a reef ’s shape, size, and location relative to the bottom, the nature of the primary flow, and the sediment parameters (Sheng 2000). In relation to reef shape, scouring is also influenced by the type of reef structure, such as face or frame structure, the width of the base element, and the slope of the reef face against the current (Nakamura 1979). However, in this survey the influence of these factors has not been analyzed, and only the type of scouring occurring around reefs is identified.
A reef placed onto a soft muddy bottom may sink through the bottom sediment soon after impact with the sea floor. Even with a hard substrate, local scouring/erosion and the accretion of sediments in the vicinity of the reef may lead to the partial or complete burial of the reef. During this survey, burial of reefs was found to be caused by both the accumula-tion of transported sediment and the weight of reefs. Over a period of years, a reef can be buried by sediment, only to reappear again after a few more years. This phenomenon has been empirically observed over a period of about 10 years and was also observed at the reefs on calcareous bottom that are frequently subject to typhoons.
Estimation of the amount of waste fishing gear and its removal
The amount of derelict fishing gear in and around the reefs is estimated by multiplying the abandoned gear quantity per surveyed area by the total surface area of a reef set. An assessment of waste fishing gear per area is made based upon a

64 Fisheries • vol 33 no 2 • february 2008 • www.fisheries.org
sample value observed in the four quar-ters across an individual reef unit or a reef set. A visual search is carried out by divers on reefs that are shallower than 40 m. After estimating the amount of waste fishing gear at these reef sites, removal is conducted by both divers and a crane mounted on a barge. Waste fishing gear found in the reefs consists chiefly of trawl nets, trammel gillnets, spring traps, and eel pots (Figure 3). Trawl nets and trammel gill nets cover up the reefs, curl up into stacks in and around the reefs, and are swayed by the current. The cost of the removal of the waste in a reef set is affected by various factors, such as the depth of the reef, the quantity of waste fishing gear, and the condition of the waste fishing gear entangled in the reefs. (i.e., has
it formed into stacks snarled by the repeated actions of the current, or does it cover the reef). The quantity of waste in reefs is time-dependant. It means that the waste quantity tends to increase as time goes by. However, this tendency may be different at different reef sites (Kim et al. 2005; 2006). Therefore, it is very important to decide whether the waste fishing gears should be removed when they are abandoned in and on the reefs. We were able to remove waste fishing gear at reefs with more than 30 kg of waste per reef set. Although a small volume of waste is observed in the reefs, the fishing gear enmeshed in the reefs is cut away by divers in order to enable fish to freely swim in and out of the reefs. because the removal of waste fishing gear in water deeper than
40 m incurs considerable cost, we are dependent upon the experience of fish-ermen, chiefly anglers. This is because anglers know empirically where there is waste in any reef set, and they know how to remove it. The tool used for removal resembles a sort of grappling hook, which was devised based upon the experience of fishermen. Weighing around 10 kg, its overall shape is akin to the branches of a tree: 12 small and thin bars are welded at an angle of some 30 degrees to a main bar. The sizes of the small and main bars are Ø1.7 x 10 cm and Ø 10 x 60 cm. It is generally used around the bottom of piled reefs (Figure 4).
Underwater work requires consid-erable effort and expense. In order to decrease the costs, many measures need
Figure 4. View of removing abandoned fishing gear around artificial reefs in waters deeper than 40 m using grappling hooks (Ø 10x60 cm).

Vemco (amirix systems, Inc.)
Fisheries • vol 33 no 2 • february 2008 • www.fisheries.org 65
to be taken (Sheehy 1992; Seaman 2000), including trials conducted by scientific equipment rather than divers. Side scan sonar with low frequency (e.g., 400 kHz) is chiefly used to obtain the shape of a reef of a certain size. However, SSS with a high frequency (e.g., 1200 KHZ) may make it possible to detect fishing gear consisting of thin netting thread. There are many methods of taking away the waste fishing gear, such as hauling reefs contaminated with fishing gear up on a barge and reinstalling them again, cutting the gear away using a remotely operated vehicle (ROV), or removing it with a grap-pling hook (Japan National Coastal Fisheries Development Association 2000). These methods are restricted by water depth and current. In consideration of the working efficiency of the reefs, a method which makes use of a robot (e.g., ROV) must surely be adopted.
Survey for the assessment of reef performance
This survey was made to assess whether existing reefs ful-fill their requirements, including the durability of the reef structures, enhancement of the fishery harvest, and increase in biomass. An assessment of durability is conducted to determine the time when existing reefs should be replaced or refilled by newly manufactured reef units, which is generally 30 years after the original time of installation. The assess-ment of biomass is carried out to recover and reinforce the performance of the existing reefs.
In relation to the durability of the concrete reefs, it is not easy to observe changes in their structural characteristics. Also, few studies have been conducted on the durability of fully submerged concrete structures such as artificial reefs. The durability of the concrete structures is affected by various fac-tors such as strength, water-cement ratio, the type of cement, curing conditions, the thickness of its concrete cover and so on (Mehta et al. 1993). Here the term “curing” of concrete stands for procedures devoted to promote cement hydration, consisting of control of time, temperature, and humidity con-ditions immediately after the placement of a concrete mixture into framework. The thickness of its concrete cover means the distance from the surface to a reinforced bar. In Korea, artificial reef guidelines prescribe that a concrete reef must be manufactured with a compressive strength of more than 21 magapascal (MPa; Korea Ministry of Maritime Affairs and Fisheries 2004). A steel reef is designed based upon the rate of steel corrosion (Japan Steel Korakubu 1999). Steel ele-ments of more than 6 mm are used for steel reef structures. As steel reefs in Korea only have been installed since 2000, just concrete reefs are referred to here. The durability of a con-crete reef was assessed by two steps: a simple and a detailed survey. The simple survey is carried out by observing changes in the external appearance of a reef, such as the occurrence of cracks on a reef ’s surface (Figure 5); the detailed survey examines physical and chemical factors. The physical factors include strength, porosity, microstructure, specific gravity, and absorption of water; the chemical factors refer to lev-els of pH, Cl-, chemical composition, and the corrosion of steel bars in concrete reefs. The strength of concrete reefs can be measured by destructive and non-destructive meth-ods, i.e., the core strength, the Schmidt hammer test, and

66 Fisheries • vol 33 no 2 • february 2008 • www.fisheries.org
the ultrasonic pulse test (Neville 1981). Porosity is calculated using a porosim-eter and by electron microscope scan-ning for microstructure. The corrosion of steel bars is evaluated by the Half-Cell Potential of reinforced steel in concrete. According to some of the results, however, the core strength of a 25-year-old concrete reef was some 20% lower than the specified strength. Also, its chloride content was much higher than the threshold value likely to cause corrosion of a steel bar in concrete. However, the corrosion of steel bars in concrete reefs has not been observed (Kim et al. 2003).
A survey for the repair of reefs was conducted on shellfish and seaweed reefs installed in shallow waters with a depth of less than 20 m. Here “repair” means to return the overturned or separated reefs to the status quo, and “reinforcement” means to replace the functionally degraded reefs with new ones. As these reefs are liable to be iso-lated, overturned, and even buried by heavy waves, proper repairs should be taken. Decisions on the repair of reefs are chiefly based upon their stabil-ity against physical conditions such as waves and current, and upon socio-eco-nomic conditions such as the suitabil-ity for repair costs and the calculated return-on-investment (Milon et al. 2000). We only conduct repair works when more than 20% of the reefs in a reef set are seen to be in abnormal situ-ations (Kim et al. 2006). Meanwhile, the reinforcement of a reef set is chiefly carried out on the reefs in waters deeper than 20 m. The decision to reinforce the reefs is based upon biological conditions such as target species and fish catch, and socioeconomic conditions such as the capacity of angling boats. In Korea, the 800 m3 of a reef set is as small as the area that two to three fishing boats of less than two tons can operate. Reefs are added to a reef set when fishermen demand the enlargement of a reef, and then only when the fish catch of a reef set is two times greater than that of a non-artificial reef area. Evaluation of reef functions in this study have exam-ined only limited factors. In order to evaluate them synthetically, however, they should be approached with system-atical methodologies based upon marine ecosystem restoration (Seaman 2007).
Construction of surveyed data in the database
All information and materials regard-ing artificial reefs are computerized in a database. The data include information on site selection, reef structure, reef manufacture, deployment, effective-ness, and post-placement management. All of the information incorporated is based on reef sets.
The development of the data-base was intended both to capture the results of the survey of the existing reefs in new projects, and to enable effec-tive management of the installed reefs (Seaman 2004). However, we are now faced with another problem. Once this information was provided to fishermen, overfishing in the reefs became more prevalent than in the past. In particu-lar, the use of the gill nets increased, resulting in an increase in the volume of abandoned fishing gear found on the reefs. This tendency can be a collateral adverse function of data availability. In relation to the control of excessive fishing operations in the reefs, although the law designates artificial reefs as a protected marine area, it is not easy to draw any conclusions (e.g., the designa-tion of a protected area to a reef set for a limited period of time). How to medi-ate the scope of their operations among the different types of fishing gear and to monitor the protected marine areas remain problems that await a future solution. One of the best practical mea-sures may indeed be the exercise of con-trol and management by the fishermen themselves.
SUMMARy
The survey for the post-placement management of artificial reefs in Korea includes four steps: survey of the state
of reef installations, removal of der-elict fishing gear from reefs, evalua-tion of reef functions, and input of the surveyed data into a database for reef management. The first step includes the survey of the location correction, volume, height, scouring, turnover, set-tlement, and dispersion of the installed reefs. Two types of scouring around reefs were observed: a simple type with pre-dominant scouring/erosion around reefs and a mixed type with both scouring and accretion around reefs. The former was found at reef sets installed in deeper areas of water where the current is very strong, and the latter was observed around reefs in shallower areas of water with a depth of less than 20 m.
The amount of derelict fishing gear in and around the reefs was estimated by multiplying the abandoned quan-tity per surveyed area by the total sur-face area of a reef set. An assessment of derelict fishing gear per area was made based upon a sample value observed in the four quarters across an individual reef unit or a reef set. The waste fishing gear found in the reefs consisted chiefly of trawl nets, trammel gillnets, spring traps, and eel pots. They were cover-ing up the reefs, curled up into stacks in and around the reefs, and were swayed by the current.
A survey for the repair of reefs was conducted on shellfish and seaweed reefs installed in shallower waters with a depth of less than 20 m. We only con-ducted repair work when more than 20% of the reefs in a reef set were seen to be in abnormal situations. The decision to reinforce the reefs was based upon bio-logical conditions such as target species and fish catch, and socioeconomic con-ditions such as the capacity of angling boats. Reefs are added to a reef set when fishermen demand the enlargement of a reef, and then only when the fish catch of a reef set is two times greater than that of a non-artificial reef.
All information and materials regarding artificial reefs are placed in a computerized database for future analysis. The construction of the data-base was intended both to reflect the results of the survey of the existing reefs in new projects, and to inform effective management of the installed reefs. However, once this information was provided to fishermen, overfish-
Figure 5. Views of surveying the durability of concrete reefs.
frigid units, Inc.
Fisheries • vol 33 no 2 • february 2008 • www.fisheries.org 67
ing in the reefs became more prevalent than in the past. In particular, the use of the gill nets increased, resulting in an increase in the volume of abandoned fishing gear found in the reefs.
ACKnowledGeMenTS
We appreciate the assistance of J. R. Kim. Also we are grateful to William Seaman, Jr. of the University of Florida and Daniel J. Sheehy for their construc-tive criticisms of this article.
ReFeRenCeS
Cuevas, K.J., M.V. buchanan, and d. Moss. 2002. Utilizing side scan sonar as an artificial reef management tool. Oceans ’02 MTS/IEEE 1:136-140.
Japan national Coastal Fisheries development Association. 2000. Guide to creation of artificial reef for coastal fisheries consolidation and development projects, 99-107. Japan National Coastal Fisheries Development Association, Tokyo. (In Japanese)
Japan Steel Korakubu. 1999. Manual for steel reefs. 1-80. Japan Steel Korakubu, Tokyo. (In Japanese)
Kim, C. G. 2001. Artificial reefs in Korea. Fisheries 26(12):15-18.
Kim, C. G., h.S. Kim, T. h. Kim, b. K. Son and S. J. Jung. 2003. Report on post-management survey of arti-ficial reef in Kyong Nam province of Korea. Korea National Fisheries Research and Development Institute 1-92. busan. (In Korean)
Kim, C. G., h. S. Kim, J.w. Seo and d. b. Kim. 2005. Report on post-management survey of artificial reef in Kyong Nam province of Korea. Korea National Fisheries Research and Development Institute 1-76. (In Korean)
Kim, C. G., h. S. Kim, and J. w. Seo. 2006. Report on post-management survey of artificial reef in Kyong Nam province of Korea. Korea National Fisheries Research and Development Institute 1-102. (In Korean)
Korea Ministry of Maritime Affairs and Fisheries. 2004. Guidance for excursion and management of artifi-
cial reef project in Korea. 39-68. (In Korean)
KnFRdi (Korea national Fisheries Research and development institute). 2005. Actual results of artificial reef installation in Korea. Korea National Fisheries Research and Development Institute 1-22. (In Korean)
_____. 2006. Manuals for fisheries resource enhancement project in Korea. Korea National Fisheries Research and Development Institute 6-39. (In Korean)
Mehta, P. K., and P. J. M. Monteiro. 1993. Concrete structure, proper-ties, and materials. Prentice Hall, Englewood Cliffs, New Jersey, 113-178.
Milon, J. w., S.M. holland and d.V. whitmarsh. 2000. Pages 165-194 in Seaman, W. Jr., ed. Artificial reef evaluation with application to natu-ral marine habitats. CRC Press, New York.
nakamura, M. 1979. The science of fisheries engineering, the industrial-current affairs news agency publisher.

little river research and design
68 Fisheries • vol 33 no 2 • february 2008 • www.fisheries.org
437-441. Tokyo. (In Japanese) The Industrial-Current Affairs News Agency
neville, A. M. 1981. Properties of concrete. Pitman Publishing Inc., Massachusetts.
Seaman, w., Jr. 2002. Unifying trends and opportunities in global artificial reef research, including evaluation. ICES Journal of Marine Science 59:S514-516.
_____. 2004. Artificial reef monitoring in Florida coastal counties. Florida Sea Grant college program, Univeristy of Florida.
_____. 2007. Artificial habitats and the restoration of degraded marine ecosystems and fisheries. Hydrobiologia 580: 143-155.
Seaman, w., Jr., and A. C. Jensen. 2000. Pages 1-19 in W. Seaman, Jr., ed. Artificial reef evaluation with application to natural marine habitats. CRC Press, New York.
Sheehy, J. 1992. Pages 543-581 in Thayer G. W., ed. Restoring the nation’s marine environment. National Oceanic and Atmospheric Administration, Silver Spring, Maryland.
Sheng, y. P. 2000. Pages 5-64 in Seaman, W., Jr., ed. Artificial reef evaluation with application to natural marine habi-tats. CRC Press, New York.
Shyue, S. w. and K. C. yang. 2002. Investigating terrain changes around artificial reefs by using a multi-beam echo sounder. ICES Journal of Marine Science 59:S338-342.Im acin henibh exero ent ad ex ea at. Duipit laorercil ea facinci duipsum eriure consenibh ex ex esto etue dunt augiatie feugait, conulla faccum eu feum volorti ssectem
looking very pleased. obviously, this private consulting company believed that having certified professionals made their work more credible than companies without certified wetland scientists. credibility is the name of the game for industry and private consultants employing fisheries profession-als, and for the research reports generated by those individuals for the company.
Fabrizio: You have served on the afs board of professional certification for six years now, including several years as chair of the education subcommittee. What type of activity have you seen during that time?
rulifson: from october 2002 to June 2007, I kept track of the number and type of applications submitted to the education subcommittee. Typically, our subcommittee does not receive applications of previously-certified professionals requesting to change their level of certification (e.g., requesting a change from associate to full) or request-ing to be recertified. during this period, the subcommittee considered 168 applications:
87 for the associate level, 60 for full profes-sional, and 21 as “either.” of the total, 18 applicants held ph.d.s or their ph.d. was pending, 80 had a M.s. degree, 29 had a M.s. degree pending, 3 had a M.a. degree, and 2 had other degrees. The two schools with the highest number of applicants during that period were auburn university (8% of all applicants) and Tennessee Tech—cookeville (6%). Interestingly, some of the best fisheries programs in the united states have had the fewest applicants.
Fabrizio: submitting your creden-tials for review by the afs board of certification sounds intimidating. can you give us any advice on how to prepare a successful application for certifica-tion as an afs fisheries professional?
rulifson: My advice is to read the instructions carefully before filling out the necessary forms. an applicant will need an official transcript from all post-secondary institutions attended (unless courses were transferred and show up on another transcript). application forms for those graduating with an undergraduate
degree after 1 July 2002 are different, so make sure to use the proper form. some applications become delayed because of incomplete information provided in section II: Minimum coursework requirements. sometimes the coursework listed by the applicant is inappropriate for the required category, and members of the education subcommittee must search for a more appropriate course on the transcript. In some cases, the content of courses that are listed are not intuitively obvious to the committee, in which case the com-mittee must consult the college website for a description of the course (assum-ing the course is listed on the website). In other cases, the committee must table the application until a better description (e.g., syllabus) becomes available from the student or a faculty member. but for most applicants the process is straight-forward.
set a good example for your students, get that raise, and be prepared for the judge’s gavel. Go to www.fisheries.org and click on “education, certification” to find out about this program. a
Continued from page56

Fisheries • vol 33 no 2 • february 2008 • www.fisheries.org 69
inTRodUCTion
Fish stocking in the United States by the state and federal governments has been a frequent topic of debate in recent decades. Fisheries managers have often led the discussion and have been rigor-ously examining the efficacy and effects of their stocking programs. The American Fisheries Society has published at least three different volumes on the topic since 1986 (Stroud 1986; Schramm and Piper 1995; Nickum et al. 2004).
However, other groups have also weighed in on various aspects of the gov-ernmental stocking programs. In 1994, at the request of U.S. Fish and Wildlife Service (USFWS) Director Mollie beattie, an outside panel reviewed the National Fish Hatchery system and con-cluded that, with certain caveats, “the provision of hatchery fish for recreational fishing is not a federal responsibility” (The Conservation Fund 1994). In 1999, at the
request of Representative George Miller, the General Accounting Office (GAO) investigated the USFWS fish hatchery pro-gram (GAO 1999). In its report, the GAO again criticized the agency for dedicating too many of its resources to commercial and recreational fisheries and not enough to “recovering threatened or endangered species and restoring other native fish stocks to self-sustaining levels.”
More recently, scientists have con-tended that fish stocking may be at least partially responsible for the decline and disappearance of amphibian species and other aquatic biodiversity around the globe (e.g., Knapp 2005). This story has received widespread coverage in the popular press and thus become a topic of concern for at least some portion of the American public (e.g., Krist 2001). On the flip side, other segments of the general public continue to push for an increase in the level of stock-ing. Jackson et al. (2004) concluded from a survey of fisheries managers that, “pub-
Stocking Trends: A Quantitative Review of Governmental Fish Stocking in the United States, 1931 to 2004AbSTRACT: This article provides a quantitative review of the type, number, and estimated weight of the fish stocked by the 50 state agencies and the U.S. Fish and Wildlife Service in the United States in 2004. I examined trends in the light of data from earlier reports dating back to 1931. Among other things, this analysis shows that 1.7 billion fish were stocked by these agencies in 2004, representing 104 types of fish weighing an estimated 19.8 million kg. This was the largest number of types of fish (species, subspecies, and hybrids) and the largest total weight of fish ever stocked for those years for which information was available. because many fish are being stocked at larger sizes, the total number of fish stocked in 2004 was in fact lower than in the first half of the twentieth century. Reflecting a long-term trend, most of the stocking was done by state agencies. The majority of the fish stocked (by estimated weight) were in western states and the most commonly stocked fish by this measure were coldwater sportfish, especially rainbow trout (Oncorhynchus mykiss).
FeATURe:FISH CULTURE
M. Anders halversonHalverson is a research associate at
the Center of the American West, University of Colorado, boulder. He
can be contacted at [email protected].
Revisión cuantitativa de los peces almacenados por el gobierno de los estados Unidos, de 1931 a 2004ReSUMen: En este artículo se presenta una revisión de los tipos, número y peso estimado de las especies de peces almacenados por las 50 agencias estatales y por el servicio de Pesca y Vida Silvestre de los EU en 2004. Se examinan las tendencias de los datos a la luz de reportes previos que datan de 1931. Entre otras cosas, el presente análisis muestra que 1.7 mil millones de peces fueron almacenados por estas agencias en el 2004, lo que representa 104 tipos de peces con un peso estimado de 19.8 millones de kilogramos. Este fue el número más alto de tipos de peces (especies, subespecies e híbridos) y el mayor peso total de peces almacenados jamás registrado. Ya que muchos peces que están siendo almacenados son de tallas grandes, el número total de peces almacenados en el 2004 fue de hecho menor que el de la primera mitad del siglo XX. Reflejando una tendencia de largo plazo, mucho del trabajo de almacenamiento fue realizado por las agencias estatales. La mayor parte de los peces fueron almacenados (por peso estimado) por las agencias del oeste del país y, en este sentido, los tipos más comunes fueron peces de agua fría destinado a la pesca deportiva, especialmente la trucha arcoíris (Oncorhynchus mykiss).
70 Fisheries • vol 33 no 2 • february 2008 • www.fisheries.org
lic pressure to stock cultured fishes is an important influence on agency decisions to use cultured fishes.”
In response to such criticism and debate, managers have made substantial changes in their approach to fish stocking in recent years. The federal government has increas-ingly sought to focus its efforts on the res-toration of and recovery of native fishes and has transferred many of its hatcheries to the states (GAO 1999). State agencies have also made changes. In the last few decades, state agencies have become much more likely to emphasize habitat manage-ment programs over fish culture, reduce or eliminate stocking in certain waters due to concerns about its potential impacts on biodiversity and native species, use native fishes and sterile fishes in their stocking programs, analyze the justifications for stocking individual waters and monitor the results, and increase the size of the stocked fish to improve survival (Jackson et al. 2004).
However, all of the criticism and all of the management changes that have been made in recent decades have taken place despite the lack of what would seem to be a crucial piece of data. Although Stroud (1986) and Heidinger (1993) provide valuable reviews, no single document since 1973 has compiled and compre-hensively quantified the number, weight, and type of fish stocked by the state and federal governments in the United States. This article attempts to at least partially fill that gap by (1) documenting recent fish stocking statistics by all government agencies involved in the enterprise in the United States and (2) reviewing some of the historical trends that have led to cur-rent fish stocking programs. I have inten-tionally avoided any attempt to resolve any of the debates or make management recommendations here—such steps would require value judgments as well as science and data. Rather, I have tried to provide an unbiased quantitative review of gov-ernmental fish stocking programs in the United States so that it will be available to ground the debates when they occur in other venues.
MeThodS
I sought fish stocking data from all 50 state fish and game agencies for the year 2004 from agency websites or by contact-ing agency officials. I also obtained stock-ing data from officials with the USFWS,
the primary federal agency that currently stocks fish. Though I was able to get data from all 50 states and the federal govern-ment, in some cases the data represented fiscal year 2004 or fiscal year 2005 instead of calendar year 2004 and in one case (Arkansas) I was only able to obtain data for 2002. I refer to these data as data for the year 2004 in the rest of this document. To avoid double counting, I removed all records where data showed that fishes were not stocked but were instead transferred to another hatchery, aquarium, etc.
The datasets from the USFWS and 22 states included data on number and weight for every type of fish stocked. Four state datasets included information on weight for some of the fishes stocked. Datasets from 9 states included informa-tion about size class for the types of fish stocked. When the data included size class instead of total weight, weight was estimated based on standard conversion factors (egg, fry = 0.02 g/fish; fingerling, yearling = 3 g/fish; subcatchable, subadult, intermediate = 40 g/fish; catchable, adult = 100 g/fish; broodstock = 450 g/fish; parr = 2 g/fish; smolt = 50 g/fish; forage species = 1 g/fish; Everest et al. 1986; Fish 2004). Data from 13 states included information on the length of the fish stocked. In such cases, I estimated weight based on the commonly-used allometric function W = CLn where W is the weight, C is a specific constant, L is the averge length, and n is the exponential rate of change of weight as a function of length (Carlander 1969). I used the median values for C and n from Fishbase (Froese and Pauly 2006). Six state datasets lacked information on the size or weight of at least some of the fish stocked. In such cases, I estimated weight based on the average weight per fish by species from those data that included weight.
It should be emphasized that all three of the weight estimation techniques have the potential to introduce substantial amounts of error. Under any given set of definitions, size classes may include fish that are one half to twice the size of the average, and there may be different defini-tions in use. As Carlander (1969) points out, length-weight equations may not be exactly the same at early stages of growth because fry and young fingerlings are often more slender. In addition, the exponential nature of the length-weight equation has the potential to introduce a large degree of error into any weight estimate based on average length. (However, because it is
likely that the data on average length was actually back-calculated by the agencies with a similar equation, this may not be as much of a source of error as it might at first appear.) And because different agencies use different stocking techniques for different purposes, the average size of the fishes in a given state may be very different from the average size of those fishes in the nation as a whole. Thus, using the average weight of fishes stocked in the country as a whole to estimate the weight of fishes stocked by those states for which no weight data was available may also introduce error.
For the analyses, I divided the fishes into typical management categories, though in many cases I lumped strains together. Thus, for example, I categorized all Oncorhynchus mykiss as rainbow trout except for those described as steelhead. I also placed each type of fish in one of the following categories: coldwater sport, coolwater sport, warmwater sport, salmon and steelhead, forage, rare or declining, marine and anadromous, and other. These categories are often polyphyletic from a taxonomic point of view and even from a management point of view are sometimes problematic. In many cases, a fish could have been placed in one of several catego-ries. The data for each type for the year 2004 are presented in Table 1 should a dif-ferent classification system be needed.
To analyze geographical trends, I used the same four divisions used by the American Fisheries Society: Western (Alaska, Arizona, New Mexico, Utah, California, Nevada, Colorado, Wyoming, Hawaii, Idaho, Montana, Oregon, Washington), North Central (Illinois, Indiana, Iowa, Kansas, Michigan, Minnesota, Missouri, Nebraska, North Dakota, Ohio, South Dakota, Wisconsin), Southern (Alabama, Arkansas, Florida, Georgia, Kentucky, Louisiana, Maryland, Mississippi, North Carolina, Oklahoma, South Carolina, Tennessee, Texas, Virginia, West Virginia), and Northeastern (New York, Pennsylvania, Massachusetts, Connecticut, Rhode Island, Delaware, New Jersey, Maine, New Hampshire, Vermont). because the data from the U.S. Fish and Wildlife Service included information about which state the fish were stocked in, I also divided and included this data in each of the divisions as appropriate.
To analyze temporal trends for the federal government, I gathered data from reports issued by the U.S. Fish and Wildlife Service and its predecessors. At

Fisheries • vol 33 no 2 • february 2008 • www.fisheries.org 71
the state level, I surveyed the literature for documents that reported data for mul-tiple states. I identified six manuscripts between 1931 and 1973 that contained at least some of these data in a format that was suitable for this analysis (bureau of Fisheries 1932; Earle 1937; Tunison et al. 1949a, b; Hagen and O’Connor 1959; bureau of Sport Fisheries and Wildlife 1968; Calhoun 1974). because not all of these documents included all 50 states, I identified the 33 states that were included in all 6 of these documents and used these states to analyze historical trends.
Different agencies and different eras used different systems for classifying the size classes of the fish stocked. To analyze trends in these data, I categorized all fish as eggs and fry (<2.5 cm), fingerlings (2.5 to 15.2 cm), and large fish (>15.2 cm).
ReSUlTS And diSCUSSion
State and federal agencies reported stocking approximately 1.75 billion fish in the waters of the United States in 2004, weighing an estimated 20 million kg (Table 1). I emphasize again that the weight esti-mate should be used with some caution. However, it appears to be relatively robust. Most of the datasets from the bigger agen-cies included weight data, such that 69% of the total estimated weight of fish stocked in the United States by all agencies was from such sources. About 22% of the total estimated weight was based on datasets that included lengths, and 6% was from datasets that included size classes. Only 3% of the weight estimate was based on datasets that included no data on the size of fish stocked.
In terms of total weight, fish stocking in the public waters of the United States was a bigger enterprise in 2004 than in any other year for which the data are readily available. Although this claim is based on historical data from 33 states and the fed-eral government, it would probably hold true if data were available for all the states in the years analyzed. However, without another complete dataset after 1973, it is difficult to know whether the total weight in 2004 represents a peak, a plateau, or a decline since that time. There is some evidence that it may be one of the latter. For example, in the decades between those years many states reduced the number of water bodies stocked and turned instead to wild fish management (e.g., Stone 1995; White et al. 1995); many states
reduced their stocking programs out of concern for native fauna, or because stud-ies showed them to be economically inef-ficient (Jackson et al. 2004); some states were forced to reduce stocking in response to whirling disease (e.g., Epifanio 2000); and some agencies even began removing fish from areas that had previously been stocked (e.g., USFWS 1998; Moore et al. 2005).
based on the data from the federal gov-ernment and the 33 states for which data was available in all years, it appears that the total number of fish stocked in the 1930s was about 7 times higher than in 2004. However, the total estimated weight of the fish stocked in 2004 was about 10 times greater than that stocked in the 1930s (Table 2, 1). The divergent trends of the total number and total weight of fish stocked suggest there has been a large shift in the size of fish stocked over the last 80 years, and it would probably be even more pronounced were the data available from the 1930s and earlier (Figure 1). The trend is especially strong among salmon, steel-head, and coldwater sport fishes.
The upward trend in the size of fish stocked is probably the result of numerous factors. Many of the fish stocked in the early years were marine species that were propa-gated from eggs and milt of fish caught for commercial purposes. Such programs were viewed as an easy means of mitigating the effects of capturing mature fish and little effort was put into them beyond fertiliz-ing the eggs and releasing them back into the ocean (e.g., bureau of Fisheries 1932; Tunison 1949a; Allard 1978). The efficacy of such efforts for maintaining commercial catch was increasingly questioned, how-ever, and by the middle of the century they had largely ceased (e.g., Tunison 1949a). Stocking larger individuals also became more common as managers focused less on trying to establish populations and species in waters to which they were not native, and more on planting individual fish that could be caught by anglers (e.g., Shetter 1947; Towle 2000). And, in terms of the latter goal, there was a growing percep-tion among fisheries managers during the recreation boom that followed World War II that the higher survival rate of larger fish might, in some cases, compensate for the higher cost of producing them (e.g., Leitritz 1970).
Some species such as walleye (Sander vitreus) continue to be stocked at a small size because diet, disease, cannibalism, and
other factors make it prohibitively difficult to raise them to large sizes (M. Mason, Iowa Department of Natural Resources, pers. comm.). but for other species such as rainbow trout, catchables are now the most commonly stocked size class (Figure 2).
because of the small size at which they are typically stocked, close to 60% of the total number of fish stocked were walleye, however, they accounted for less than 1% of the fish stocked by weight in the year 2004. Conversely, although they accounted for only about 5% of the total number of fish stocked, rainbow trout (not including steelhead) made up an estimated 50% of the fish stocked by weight (Table 1, Figure 3). More broadly, coldwater sport fishes made up the majority of stocked fish by weight (65%), while coolwater sport fishes made up the majority of fishes stocked by number (64%) (Table 1). Sportfishes and the forage fishes planted for their benefit made up a vast majority of the fish stocked in 2004 by both number and weight (82% and 72%, respectively). Though this may seem unremarkable today, it is interest-ing to note that this was not always the case. Many governmental fish stocking programs were begun as a means to sup-port commercial fisheries—an enterprise that waned in the first half of the twen-tieth century when managers concluded most of these programs were having little effect (e.g., U.S. Commission of Fish and Fisheries 1874; Tunison 1949a)
Agencies reported stocking 104 types of fish (species, subspecies, and hybrids) in 2004. Although most of these fish were stocked for sport and commercial fishing, at least 37 of these fishes were considered threatened, endangered, or of special con-cern by state or federal governments, and an additional 16 were rare or had under-gone a severe population decline. Mostly because of the propagation of such rare species, the total number of species propa-gated in 2004 is larger than at any other time for which data were available.
based on the data from the federal gov-ernment and the 33 states for which data was available in all years, the federal gov-ernment produced a smaller percentage of the total number of fish stocked in 2004 than in any other year. The total weight of fish stocked by the federal government in 2004 was smaller than in any other year except 1947 and 1958 (Table 2). The types of fish stocked by the federal government reflected the patterns described above and

72 Fisheries • vol 33 no 2 • february 2008 • www.fisheries.org
tab
le 1
. Typ
es o
f fis
h st
ocke
d by
the
u.s
. fis
h an
d W
ildlif
e se
rvic
e an
d th
e st
ate
gove
rnm
ents
in 2
004.
The
firs
t nu
mbe
r re
pres
ents
the
est
imat
ed n
umbe
r in
tho
usan
ds. T
he n
umbe
r in
par
enth
eses
repr
esen
ts
wei
ght
in t
hous
ands
of
kilo
gram
s. T
he s
tate
s ar
e gr
oupe
d in
to f
our
regi
ons
(see
tex
t). a
ster
isks
indi
cate
hyb
rids.
Tho
se t
ypes
with
a (3
) aft
er t
he n
ame
are
trip
loid
s. In
som
e ca
ses
the
data
repo
rted
wer
e fo
r th
e 20
04 o
r 20
05 fi
scal
, not
cal
enda
r ye
ar. T
he d
ata
for
ark
ansa
s is
for
the
yea
r 20
02. a
ll re
cord
s w
here
the
dat
a sh
owed
the
fish
wer
e no
t st
ocke
d bu
t w
ere
inst
ead
tran
sfer
red
to a
noth
er h
atch
ery,
aqu
ariu
m, e
tc.
wer
e re
mov
ed f
rom
the
dat
a. T
he fi
nal c
olum
n re
pres
ents
the
tot
al n
umbe
r of
sta
tes
in w
hich
the
fish
wer
e re
port
ed s
tock
ed b
y th
e st
ate
or f
eder
al g
over
nmen
t.
typ
e C
om
mo
n n
ame
UsF
ws
wes
tern
N
ort
h C
entr
al
No
rth
east
ern
so
uth
ern
tota
l #
stat
es
Co
Ldw
ate
r s
Port
C
oreg
onus
clu
peaf
orm
is
lake
whi
tefis
h 0
(0)
0 (0
) 61
0.2
(0.3
) 0.
2 (<
0.05
) 0
(0)
610.
4 (0
.3)
2O
ncor
hync
hus
clar
ki
cut
thro
at t
rout
1,
324.
0 (4
0.6)
4,
936.
1 (1
28.2
) 0
(0)
0 (0
) 21
1.1
(17.
6)
6,47
1.2
(186
.3)
7O
ncor
hync
hus
clar
ki b
ouvi
eri
Yello
wst
one
cutt
hroa
t 0
(0)
1,47
5.0
(23.
0)
0 (0
) 0
(0)
0 (0
) 1,
475.
0 (2
3.0)
3
Onc
orhy
nchu
s m
ykis
s
rain
bow
tro
ut
8,30
0.4
(856
.9)
51,0
37.0
(4,5
24.7
) 6,
146.
7 (8
43.3
) 4,
074.
4 (7
55.5
) 9,
633.
2 (1
,716
.4)
79,1
91.7
(8
,696
.8)
45O
ncor
hync
hus
myk
iss
(3)
rain
bow
tro
ut (3
) 0
(0)
6,23
2.2
(1,2
66.9
) 0
(0)
0 (0
) 0
(0)
6,23
2.2
(1,2
66.9
) 1
Onc
orhy
nchu
s m
ykis
s ag
uabo
nita
G
olde
n tr
out
0 (0
) 11
3.8
(0.1
) 0
(0)
8.8
(7.2
) 39
.7
(13.
8)
162.
3 (2
1.2)
5
Onc
orhy
nchu
s m
ykis
s*cl
arki
ra
inbo
w*c
utth
roat
0
(0)
549.
7 (4
1.3)
0
(0)
0 (0
) 0
(0)
549.
7 (4
1.3)
2
Onc
orhy
nchu
s m
ykis
s*cl
arki
(3)
rain
bow
*cut
thro
at (3
) 0
(0)
38.3
(0
.2)
0 (0
) 0
(0)
0 (0
) 38
.3
(0.2
) 1
Onc
orhy
nchu
s ne
rka
Kok
anee
0
(0)
39,1
68.6
(1
06.0
) 0
(0)
84.0
(<
0.05
) 0
(0)
39,2
52.6
(1
06.0
) 10
Salm
o sa
lar
(land
lock
ed)
land
lock
ed a
tlant
ic s
alm
on
162.
1 (1
2.9)
12
.6
(1.6
) 0
(0)
1,41
4.0
(39.
8)
0 (0
) 1,
588.
7 (5
4.3)
6
Salm
o tr
utta
br
own
trou
t 69
8.4
(36.
6)
2,32
3.9
(92.
4)
5,49
0.6
(237
.4)
6,60
7.6
(797
.1)
1,57
2.2
(142
.6)
16,6
92.7
(1
,306
.1)
39Sa
lmo
trut
ta (s
ea r
un)
sea
run
brow
n tr
out
0 (0
) 0
(0)
0 (0
) 29
.0
(2.6
) 0
(0)
29.0
(2
.6)
1Sa
lmo
trut
ta x
Sal
velin
us f
ontin
alis
Ti
ger
trou
t 0
(0)
458.
4 (6
.3)
0 (0
) 8.
3 (6
.8)
0 (0
) 46
6.7
(13.
1)
6Sa
lvel
inus
alp
inus
a
rctic
cha
r 0
(0)
300.
8 (5
.6)
0 (0
) 0
(0)
0 (0
) 30
0.8
(5.6
) 1
Salv
elin
us f
ontin
alis
br
ook
trou
t 34
5.0
(6.2
) 1,
383.
3 (7
5.3)
97
4.2
(35.
6)
4,52
5.8
(528
.9)
827.
2 (1
20.4
) 8,
055.
5 (7
66.5
) 27
Salv
elin
us f
ontin
alis
*nam
aycu
sh
spla
ke
0 (0
) 38
2.8
(4.4
) 53
9.9
(19.
0)
66.2
(1
0.4)
0
(0)
988.
9 (3
3.9)
8
Salv
elin
us n
amay
cush
la
ke t
rout
4,
434.
4 (1
61.3
) 2,
325.
3 (1
63.7
) 1,
466.
9 (3
9.3)
1,
056.
8 (3
9.7)
16
8.4
(3.0
) 9,
451.
8 (4
06.9
) 14
tota
l co
ldw
ater
sp
ort
fish
15,2
64.4
(1
,114
.5)
110,
737.
6 (6
,439
.6)
15,2
28.4
(1,1
75.0
) 17
,875
.2 (2
,188
.1)
12,4
51.7
(2
013.
9)
171,
557.
4 (1
2,93
1.1)
Co
oLw
ate
r s
Port
Es
ox lu
cius
N
orth
ern
pike
3,
520.
5 (0
.8)
679.
0 (0
.2)
5,61
8.7
(9.2
) 10
7.9
(1.2
) 18
.5
(<0.
05)
9,94
4.6
(11.
4)
16Es
ox lu
cius
*mas
quin
ongy
Ti
ger
mus
kie
0 (0
) 42
.3
(2.5
) 64
.7
(0.4
) 25
0.5
(7.5
) 13
.5
(0.1
) 37
1.0
(10.
6)
15Es
ox m
asqu
inon
gy
Mus
kellu
nge
0 (0
) 0
(0)
1,71
2.9
(19.
1)
738.
0 (2
.6)
110.
8 (1
.6)
2,56
1.7
(23.
2)
16Es
ox n
iger
c
hain
pic
kere
l 0
(0)
0 (0
) 0
(0)
1.5
(<0.
05)
0 (0
) 1.
5 (<
0.05
) 1
Perc
a fla
vesc
ens
Ye
llow
per
ch
720.
4 (0
.4)
122.
2 (6
.8)
3,70
8.6
(78.
6)
1,00
0.0
(<0.
05)
0 (0
) 5,
551.
3 (8
5.9)
12
Sand
er c
anad
ensi
s sa
uger
0
(0)
349.
4 (<
0.05
) 28
,723
.0
(2.5
) 18
.6
(<0.
05)
382.
9 (0
.2)
29,4
74.0
(2
.8)
9Sa
nder
can
aden
sis*
vitr
eus
saug
eye
0 (0
) 11
,739
.5
(0.2
) 15
,325
.6
(4.3
) 4.
0 (<
0.05
) 69
9.6
(0.7
) 27
,768
.8
(5.1
) 9
Sand
er v
itreu
s W
alle
ye
15,6
77.9
(3
.8)
78,8
36.7
(2
.2)
630,
595.
6 (1
33.9
) 30
3,39
2.2
(9.7
) 17
,637
.6
(4.9
) 1,
046,
140.
1 (1
54.4
) 34
tota
l co
olw
ater
sp
ort
fish
19,9
18.8
(5
.0)
91,7
69.1
(1
2.0)
68
5,74
9.3
(248
.0)
305,
512.
7 (2
1.0)
18
,863
.0
(7.5
) 1,
121,
812.
9 (2
93.5
)
wa
rm
wa
ter
sPo
rt
Am
blop
lites
rup
estr
is
rock
bas
s 0
(0)
0 (0
) 0
(0)
3.5
(<0.
05)
0 (0
) 3.
5 (<
0.05
) 1
Am
eiur
us m
elas
bl
ack
bullh
ead
0 (0
) 0
(0)
3.6
(1.0
) 0
(0)
0 (0
) 3.
6 (1
.0)
1A
mei
urus
nat
alis
Ye
llow
bul
lhea
d 0
(0)
0 (0
) <
0.05
(<
0.05
) 0
(0)
0 (0
) <
0.05
(<
0.05
) 1
Icta
luru
s fu
rcat
us
blue
cat
fish
0 (0
) 16
9.8
(0.3
) 45
.5
(1.8
) 0
(0)
1,23
5.5
(49.
6)
1,45
0.7
(51.
7)
9Ic
talu
rus
punc
tatu
s c
hann
el c
atfis
h 41
8.7
(22.
5)
1,83
0.5
(102
.0)
6,40
2.5
(191
.9)
422.
1 (8
.0)
5,06
5.2
(385
.6)
14,1
38.9
(7
10.1
) 38
Lepi
sost
eus
plat
ysto
mus
sh
ortn
ose
gar
<0.
05
(<0.
05)
0 (0
) 0
(0)
0 (0
) 0
(0)
<0.
05
(<0.
05)
Lepo
mis
aur
itus
redb
reas
t su
nfish
0
(0)
0 (0
) 0
(0)
0 (0
) 1,
190.
4 (3
.6)
1,19
0.4
(3.6
) 1
Lepo
mis
gib
bosu
s pu
mpk
inse
ed
0 (0
) 0
(0)
0.7
(0.1
) 0
(0)
0 (0
) 0.
7 (0
.1)
1Le
pom
is m
acro
chiru
s bl
uegi
ll
1,29
2.8
(1.2
) 75
.2
(1.3
) 5,
347.
1 (1
4.8)
42
.3
(1.0
) 10
,737
.7
(23.
6)
17,4
95.1
(4
1.8)
31
Lepo
mis
mac
roch
irus*
cyan
ellu
s bl
uegi
ll*G
reen
sun
fish
0 (0
) 0.
7 (<
0.05
) 0
(0)
0 (0
) 0
(0)
0.7
(<0.
05)
1Le
pom
is m
icro
loph
us
rede
ar s
unfis
h 98
.7
(<0.
05)
0 (0
) 92
7.4
(1.1
) 34
.7
(<0.
05)
1,75
1.0
(3.5
) 2,
811.
8 (4
.7)
16Le
pom
is s
pp.
sunfi
sh
0 (0
) 0
(0)
139.
1 (2
.6)
3.0
(0.4
) 2,
130.
8 (4
.4)
2,27
2.9
(7.4
) 9
Mic
ropt
erus
cat
arac
tae
shoa
l bas
s 0
(0)
0 (0
) 0
(0)
0 (0
) 21
2.8
(0.6
) 21
2.8
(0.6
) 1
Mic
ropt
erus
dol
omie
u sm
allm
outh
bas
s 17
.1
(0.1
) 93
.3
(1.4
) 24
9.7
(1.0
) 48
.2
(0.4
) 63
.6
(0.3
) 47
2.0
(3.1
) 22
Mic
ropt
erus
pun
ctul
atus
sp
otte
d ba
ss
0 (0
) 0
(0)
0 (0
) 0
(0)
2.7
(<0.
05)
2.7
(<0.
05)
1M
icro
pter
us s
alm
oide
s la
rgem
outh
bas
s 1,
798.
2 (2
.2)
529.
4 (5
.9)
2,41
4.0
(9.8
) 30
.0
(0.2
) 17
,584
.4
(62.
2)
22,3
56.0
(8
0.2)
35
Mor
one
chry
sops
W
hite
bas
s 0.
4 (0
.1)
0 (0
) 82
0.3
(0.7
) 0
(0)
2,33
1.3
(1.2
) 3,
152.
0 (2
.1)
4M
oron
e sa
xatil
is
strip
ed b
ass
1,65
6.9
(14.
7)
100.
0 (<
0.05
) 23
6.5
(0.7
) 13
,734
.4
(<0.
05)
18,6
25.8
(3
8.3)
34
,353
.7
(53.
7)
20M
oron
e sa
xatil
is*c
hrys
ops
Hyb
rid s
trip
ed b
ass
0 (0
) 3,
672.
3 (0
.7)
13,8
35.4
(6
.6)
137.
4 (0
.8)
14,3
64.8
(1
7.2)
32
,009
.9
(25.
3)
27Po
mox
is a
nnul
aris
W
hite
cra
ppie
0
(0)
0 (0
) 12
7.3
(3.0
) 1.
1 (<
0.05
) 61
6.8
(11.
6)
745.
1 (1
4.6)
7
Pom
oxis
nig
rom
acul
atus
bl
ack
crap
pie
47.5
(0
.1)
215.
7 (2
.0)
529.
1 (5
.5)
1.2
(0.1
) 1,
588.
6 (4
.3)
2,38
2.0
(11.
9)
18Po
mox
is s
pp.
cra
ppie
0
(0)
0 (0
) 0.
2 (<
0.05
) 0
(0)
0 (0
) 0.
2 (<
0.05
) 1
Pylo
dict
is o
livar
is
flat
head
cat
fish
0 (0
) 4.
3 (<
0.05
) 0.
4 (<
0.05
) 0
(0)
44.9
(0
.3)
49.6
(0
.3)
5to
tal w
arm
wat
er s
po
rt fi
sh
5,
330.
4 (4
1.0)
6,
691.
2 (1
13.6
) 31
,078
.7
(240
.5)
14,4
57.8
(1
0.9)
77
,546
.1
(606
.4)
135,
104.
2 (1
,012
.5)
saLm
oN
aN
d s
teeL
Hea
dO
ncor
hync
hus
gorb
usch
a pi
nk s
alm
on
0 (0
) 1,
820.
3 (2
.2)
0 (0
) 0
(0)
0 (0
) 1,
820.
3 (2
.2)
1O
ncor
hync
hus
keta
c
hum
sal
mon
96
6.2
(0.9
) 36
,741
.4
(35.
9)
0 (0
) 0
(0)
0 (0
) 37
,707
.5
(36.
8)
1O
ncor
hync
hus
kisu
tch
coh
o sa
lmon
3,
528.
2 (9
0.0)
33
,597
.8
(838
.1)
1,79
4.0
(55.
8)
250.
0 (6
.7)
0 (0
) 39
,170
.1
(990
.6)
9O
ncor
hync
hus
myk
iss
(shd
) st
eelh
ead
4,39
2.6
(369
.7)
20,1
10.9
(1,6
66.1
) 2,
289.
1 (1
22.9
) 1,
975.
8 (7
3.9)
0
(0)
28,7
68.3
(2
,232
.7)
11O
ncor
hync
hus
nerk
a(so
ckey
e)
sock
eye
salm
on
0 (0
) 12
,862
.8
(12.
1)
0 (0
) 0
(0)
0 (0
) 12
,862
.8
(12.
1)
2
Onc
orhy
nchu
s ts
haw
ytsc
ha
chi
nook
sal
mon
42
,238
.9
(388
.8)
105,
942.
7 (1
,606
.7)
8,31
2.6
(61.
3)
1,83
7.2
(8.1
) 0
(0)
158,
331.
3 (2
,064
.9)
14Sa
lmo
sala
r a
tlant
ic s
alm
on
11,0
73.1
(7
5.1)
0
(0)
49.0
(4
.9)
2,63
5.6
(5.2
) 0
(0)
13,7
57.6
(8
5.2)
5
tota
l sa
lmo
n a
nd
ste
elh
ead
62
,198
.9
(924
.4)
211,
075.
8 (4
,161
.2)
12,4
44.6
(2
45.0
) 6,
698.
6 (9
3.9)
0
(0)
292,
417.
9 (5
,424
.5)
ra
re
or
deC
LiN
iNg
Aci
pens
er f
ulve
scen
s la
ke s
turg
eon
52.9
(1
.0)
0 (0
) 65
.6
(0.6
) 4.
6 (0
.1)
19.4
(0
.1)
142.
4 (1
.8)
5A
cipe
nser
tra
nsm
onta
nus
Whi
te s
turg
eon
0 (0
) 1.
9 (0
.2)
0 (0
) 0
(0)
0 (0
) 1.
9 (0
.2)
1A
losa
med
iocr
is
Hic
kory
sha
d 0
(0)
0 (0
) 0
(0)
6,11
5.7
(0.1
) 0
(0)
6,11
5.7
(0.1
) 1
Alo
sa a
estiv
alis
bl
ueba
ck h
errin
g 21
8.0
(<0.
05)
0 (0
) 0
(0)
0 (0
) 0
(0)
218.
0 (<
0.05
) A
losa
pse
udoh
aren
gus
ale
wife
3.
2 (<
0.05
) 0
(0)
0 (0
) 4.
3 (<
0.05
) 0
(0)
7.5
(<0.
05)
1A
losa
sap
idis
sim
a a
mer
ican
sha
d 4,
792.
2 (<
0.05
) 0
(0)
0 (0
) 4,
710.
4 (<
0.05
) 2,
329.
8 (<
0.05
) 11
,832
.4
(<0.
05)
3A
trac
tost
eus
spat
ula
alli
gato
r ga
r <
0.05
(<
0.05
) 0
(0)
0 (0
) 0
(0)
0 (0
) <
0.05
(<
0.05
) C
atos
tom
us d
isco
bolu
s bl
uehe
ad s
ucke
r 0
(0)
0.5
(0.1
) 0
(0)
0 (0
) 0
(0)
0.5
(0.1
) 1
Cat
osto
mus
latip
inni
s fl
anne
lmou
th s
ucke
r 0
(0)
0.4
(0.1
) 0
(0)
0 (0
) 0
(0)
0.4
(0.1
) 1
Cat
osto
mus
ple
beiu
s ri
o G
rand
e su
cker
0
(0)
0.3
(<0.
05)
0 (0
) 0
(0)
0 (0
) 0.
3 (<
0.05
) 1
Cha
smis
tes
lioru
s Ju
ne s
ucke
r 0
(0)
25.0
(1
.7)
0 (0
) 0
(0)
0 (0
) 25
.0
(1.7
) 1
Ethe
osto
ma
crag
ini
ark
ansa
s da
rter
0
(0)
1.1
(<0.
05)
0 (0
) 0
(0)
0 (0
) 1.
1 (<
0.05
) 1
Fund
ulus
julis
ia
barr
ens
topm
inno
w
4.1
(<0.
05)
0 (0
) 0
(0)
0 (0
) 0
(0)
4.1
(<0.
05)
1G
ila e
lega
ns
bony
tail
17.0
(3
.9)
11.8
(1
.1)
0 (0
) 0
(0)
0 (0
) 28
.8
(5.0
) 2
Gila
nig
resc
ens
chi
huah
a ch
ub
4.5
(0.1
) 0
(0)
0 (0
) 0
(0)
0 (0
) 4.
5 (0
.1)
1G
ila p
ando
ra
rio
Gra
nde
chub
0
(0)
36.2
(0
.1)
0 (0
) 0
(0)
0 (0
) 36
.2
(0.1
) 1
Gila
rob
usta
ro
undt
ail c
hub
0 (0
) 15
.8
(0.1
) 0
(0)
0 (0
) 0
(0)
15.8
(0
.1)
1G
ila r
obus
ta jo
rdan
i pa
hran
agat
roun
dtai
l chu
b 2.
4 (0
.1)
0 (0
) 0
(0)
0 (0
) 0
(0)
2.4
(0.1
) 1
Hyb
ogna
thus
am
arus
ri
o G
rand
e si
lver
y m
inno
w
93.2
(0
.2)
0 (0
) 0
(0)
0 (0
) 0
(0)
93.2
(0
.2)
1La
mpe
tra
appe
ndix
a
mer
ican
bro
ok la
mpr
ey
0 (0
) 0
(0)
0 (0
) 0.
1 (<
0.05
) 0
(0)
0.1
(<0.
05)
1M
oxos
tom
a ro
bust
um
robu
st re
dhor
se
0 (0
) 0
(0)
0 (0
) 0
(0)
34.9
(0
.1)
34.9
(0
.1)
1N
otro
pis
tope
ka
Tope
ka s
hine
r 0
(0)
0 (0
) 13
.3
(<0.
05)
0 (0
) 0
(0)
13.3
(<
0.05
) 1
Onc
orhy
nchu
s ap
ache
a
pach
e tr
out
156.
5 (1
7.8)
11
2.0
(12.
8)
0 (0
) 0
(0)
0 (0
) 26
8.5
(30.
6)
1O
ncor
hync
hus
clar
ki b
ehnk
ei
fine
spo
tted
cut
thro
at
0 (0
) 84
6.3
(28.
6)
0 (0
) 0
(0)
0 (0
) 84
6.3
(28.
6)
3O
ncor
hync
hus
clar
ki h
ensh
awi
laho
ntan
cut
thro
at
0 (0
) 24
0.2
(0.2
) 0
(0)
0 (0
) 0
(0)
240.
2 (0
.2)
1O
ncor
hync
hus
clar
ki le
wis
i W
ests
lope
cut
thro
at
0 (0
) 97
7.4
(12.
5)
0 (0
) 0
(0)
0 (0
) 97
7.4
(12.
5)
2O
ncor
hync
hus
clar
ki p
leur
iticu
s c
olor
ado
riv.
cut
thro
at
0 (0
) 87
9.9
(3.0
) 0
(0)
0 (0
) 0
(0)
879.
9 (3
.0)
2O
ncor
hync
hus
clar
ki s
tom
ias
Gre
enba
ck c
utth
roat
0
(0)
689.
9 (0
.7)
0 (0
) 0
(0)
0 (0
) 68
9.9
(0.7
) 1
Onc
orhy
nchu
s cl
arki
uta
h bo
nnev
ille
cutt
hroa
t 0
(0)
142.
7 (5
.3)
0 (0
) 0
(0)
0 (0
) 14
2.7
(5.3
) 1
Onc
orhy
nchu
s cl
arki
virg
inal
is
rio
Gra
nde
cutt
hroa
t 0
(0)
192.
3 (1
.5)
0 (0
) 0
(0)
0 (0
) 19
2.3
(1.5
) 2
Onc
orhy
nchu
s gi
lae
Gila
tro
ut
6.3
(0.3
) 0
(0)
0 (0
) 0
(0)
0 (0
) 6.
3 (0
.3)
2Pe
trom
yzon
mar
inus
se
a la
mpr
ey
0 (0
) 0
(0)
0 (0
) 0.
1 (<
0.05
) 0
(0)
0.1
(<0.
05)
1Ph
oxin
us e
os
Nor
ther
n re
dbel
ly d
ace
0 (0
) 0.
5 (<
0.05
) 0
(0)
0 (0
) 0
(0)
0.5
(<0.
05)
1Ph
oxin
us e
ryth
roga
ster
so
uthe
rn re
dbel
ly d
ace
0 (0
) 1.
5 (<
0.05
) 0
(0)
0 (0
) 0
(0)
1.5
(<0.
05)
1Pl
agop
teru
s ar
gent
issi
mus
W
ound
fin
4.4
(<0.
05)
0 (0
) 0
(0)
0 (0
) 0
(0)
4.4
(<0.
05)
1Po
lyod
on s
path
ula
padd
lefis
h 66
.5
(6.8
) 0
(0)
2.1
(<0.
05)
2.4
(1.3
) 54
.6
(36.
9)
125.
6 (4
5.1)
8
Ptyc
hoch
eilu
s lu
cius
c
olor
ado
pike
min
now
28
0.5
(0.3
) 5.
3 (0
.2)
0 (0
) 0
(0)
0 (0
) 28
5.8
(0.5
) 3
Scap
hirh
ynch
us a
lbus
pa
llid
stur
geon
20
.9
(0.6
) 5.
6 (0
.5)
0 (0
) 0
(0)
0 (0
) 26
.5
(1.1
) 4
Scap
hirh
ynch
us p
lato
rync
hus
shov
elno
se s
turg
eon
0 (0
) 72
.5
(<0.
05)
0 (0
) 0
(0)
0 (0
) 72
.5
(<0.
05)
1Th
ymal
lus
arct
icus
a
rctic
gra
ylin
g 0
(0)
269.
6 (7
.2)
0 (0
) 0
(0)
0 (0
) 26
9.6
(7.2
) 3
Xyr
auch
en t
exan
us
razo
rbac
k su
cker
63
.1
(9.7
) 15
.5
(2.4
) 0
(0)
0 (0
) 0
(0)
78.6
(1
2.1)
3
tota
l rar
e o
r d
eclin
ing
5,78
5.6
(40.
9)
4,54
4.1
(78.
1)
81.0
(0
.7)
10,8
37.7
(1
.4)
2,43
8.7
(37.
1)
23,6
87.1
(1
58.2
)
For
ag
e C
atos
tom
us c
omm
erso
nii
Whi
te s
ucke
r 0
(0)
0 (0
) 1,
601.
6 (1
.5)
0 (0
) 0
(0)
1,60
1.6
(1.5
) 1
cyp
rinid
ae s
pp.
Min
now
s 0
(0)
0 (0
) 0
(0)
0 (0
) 15
9.8
(0.1
) 15
9.8
(0.1
) 1
Dor
osom
a ce
pedi
anum
G
izza
rd s
had
0 (0
) 0.
8 (0
.3)
0.6
(0.1
) 0
(0)
0 (0
) 1.
4 (0
.3)
3D
oros
oma
pete
nens
e Th
read
fin s
had
0 (0
) 0
(0)
30.8
(<
0.05
) 0
(0)
0 (0
) 30
.8
(<0.
05)
1Er
imyz
on o
blon
gus
cre
ek c
hubs
ucke
r 0
(0)
0 (0
) 0
(0)
0 (0
) 0.
9 (0
.1)
0.9
(0.1
) 1
Men
idia
ber
yllin
a*au
dens
M
issi
ssip
pi in
land
silv
ersi
de
0 (0
) 0
(0)
0 (0
) 0
(0)
15.6
(0
.1)
15.6
(0
.1)
1N
otem
igon
us c
ryso
leuc
as
Gol
den
shin
er
0 (0
) 0
(0)
1.6
(<0.
05)
5.0
(0.1
) 0
(0)
6.5
(0.1
) 2
Pim
epha
les
prom
elas
fa
thea
d m
inno
w
0 (0
) 1.
0 (<
0.05
) 2,
326.
7 (1
95.9
) 73
.5
(0.1
) 27
6.2
(0.2
) 2,
677.
4 (1
96.3
) 10
tota
l fo
rag
e fi
sh
0
(0)
1.8
(0.3
) 3,
961.
3 (1
97.6
) 78
.5
(0.1
) 45
2.5
(0.5
) 4,
494.
0 (1
98.5
)
ma
riN
e Sc
iaen
ops
ocel
latu
s re
d dr
um
334.
8 (0
.1)
0 (0
) 0
(0)
0 (0
) 0
(0)
334.
8 (0
.1)
1to
tal m
arin
e
334.
8 (0
.1)
0 (0
) 0
(0)
0 (0
) 0
(0)
334.
8 (0
.1)
otH
er
Cte
noph
aryn
godo
n id
ella
G
rass
car
p 0
0)
0 (0
) 58
.3
(0.6
) 0
(0)
8.9
(5.6
) 67
.3
(6.1
) 7
Cte
noph
aryn
godo
n id
ella
(3)
Gra
ss c
arp
(3)
0 (0
) 0.
5 (0
.1)
0.5
(0.2
) 0
(0)
5.8
(13.
0)
6.8
(13.
2)
5to
tal o
ther
0 (0
) 0.
5 (0
.1)
58.9
(0
.7)
0 (0
) 14
.7
(18.
6)
74.1
(1
9.3)
gr
aN
d t
ota
L
108,
832.
9 (2
,126
.1)
424,
820.
2 (10
,804
.8)
748,
602.
1 (2
,107
.4)
355,
460.
4 (2
,315
.6)
111,
766.
8 (2
,684
.0)
1,74
9,48
2.3
(20,
037.
8)
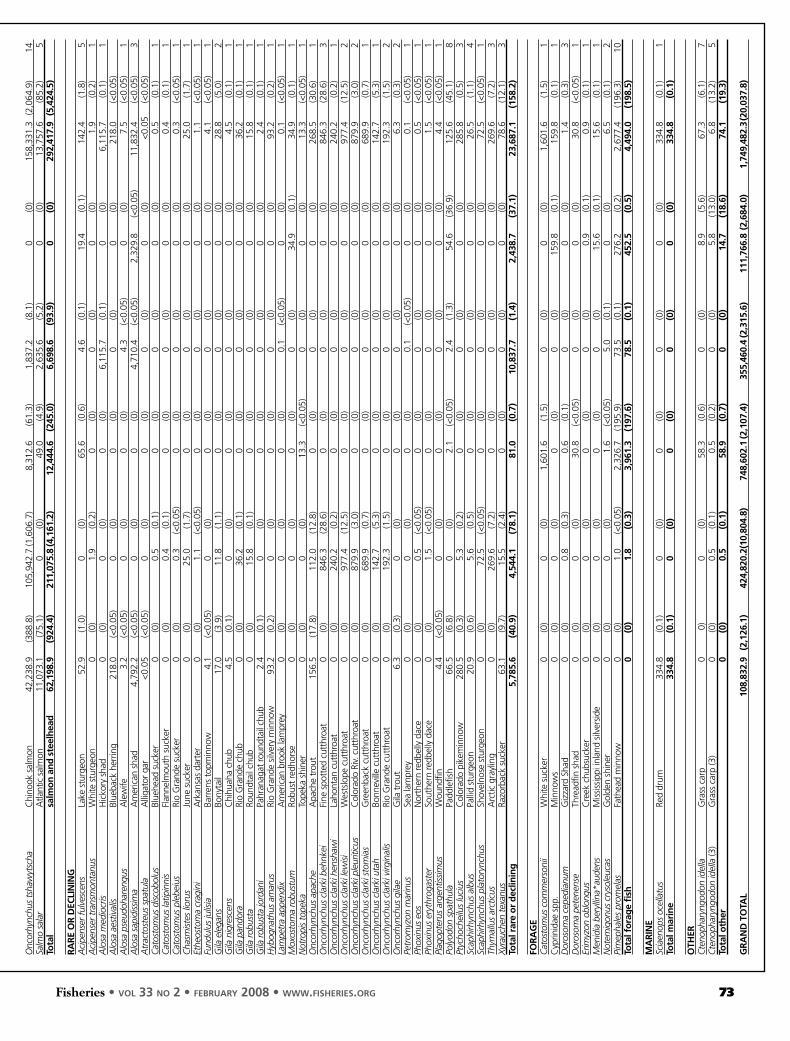
Fisheries • vol 33 no 2 • february 2008 • www.fisheries.org 73
tab
le 1
. Typ
es o
f fis
h st
ocke
d by
the
u.s
. fis
h an
d W
ildlif
e se
rvic
e an
d th
e st
ate
gove
rnm
ents
in 2
004.
The
firs
t nu
mbe
r re
pres
ents
the
est
imat
ed n
umbe
r in
tho
usan
ds. T
he n
umbe
r in
par
enth
eses
repr
esen
ts
wei
ght
in t
hous
ands
of
kilo
gram
s. T
he s
tate
s ar
e gr
oupe
d in
to f
our
regi
ons
(see
tex
t). a
ster
isks
indi
cate
hyb
rids.
Tho
se t
ypes
with
a (3
) aft
er t
he n
ame
are
trip
loid
s. In
som
e ca
ses
the
data
repo
rted
wer
e fo
r th
e 20
04 o
r 20
05 fi
scal
, not
cal
enda
r ye
ar. T
he d
ata
for
ark
ansa
s is
for
the
yea
r 20
02. a
ll re
cord
s w
here
the
dat
a sh
owed
the
fish
wer
e no
t st
ocke
d bu
t w
ere
inst
ead
tran
sfer
red
to a
noth
er h
atch
ery,
aqu
ariu
m, e
tc.
wer
e re
mov
ed f
rom
the
dat
a. T
he fi
nal c
olum
n re
pres
ents
the
tot
al n
umbe
r of
sta
tes
in w
hich
the
fish
wer
e re
port
ed s
tock
ed b
y th
e st
ate
or f
eder
al g
over
nmen
t.
typ
e C
om
mo
n n
ame
UsF
ws
wes
tern
N
ort
h C
entr
al
No
rth
east
ern
so
uth
ern
tota
l #
stat
es
Co
Ldw
ate
r s
Port
C
oreg
onus
clu
peaf
orm
is
lake
whi
tefis
h 0
(0)
0 (0
) 61
0.2
(0.3
) 0.
2 (<
0.05
) 0
(0)
610.
4 (0
.3)
2O
ncor
hync
hus
clar
ki
cut
thro
at t
rout
1,
324.
0 (4
0.6)
4,
936.
1 (1
28.2
) 0
(0)
0 (0
) 21
1.1
(17.
6)
6,47
1.2
(186
.3)
7O
ncor
hync
hus
clar
ki b
ouvi
eri
Yello
wst
one
cutt
hroa
t 0
(0)
1,47
5.0
(23.
0)
0 (0
) 0
(0)
0 (0
) 1,
475.
0 (2
3.0)
3
Onc
orhy
nchu
s m
ykis
s
rain
bow
tro
ut
8,30
0.4
(856
.9)
51,0
37.0
(4,5
24.7
) 6,
146.
7 (8
43.3
) 4,
074.
4 (7
55.5
) 9,
633.
2 (1
,716
.4)
79,1
91.7
(8
,696
.8)
45O
ncor
hync
hus
myk
iss
(3)
rain
bow
tro
ut (3
) 0
(0)
6,23
2.2
(1,2
66.9
) 0
(0)
0 (0
) 0
(0)
6,23
2.2
(1,2
66.9
) 1
Onc
orhy
nchu
s m
ykis
s ag
uabo
nita
G
olde
n tr
out
0 (0
) 11
3.8
(0.1
) 0
(0)
8.8
(7.2
) 39
.7
(13.
8)
162.
3 (2
1.2)
5
Onc
orhy
nchu
s m
ykis
s*cl
arki
ra
inbo
w*c
utth
roat
0
(0)
549.
7 (4
1.3)
0
(0)
0 (0
) 0
(0)
549.
7 (4
1.3)
2
Onc
orhy
nchu
s m
ykis
s*cl
arki
(3)
rain
bow
*cut
thro
at (3
) 0
(0)
38.3
(0
.2)
0 (0
) 0
(0)
0 (0
) 38
.3
(0.2
) 1
Onc
orhy
nchu
s ne
rka
Kok
anee
0
(0)
39,1
68.6
(1
06.0
) 0
(0)
84.0
(<
0.05
) 0
(0)
39,2
52.6
(1
06.0
) 10
Salm
o sa
lar
(land
lock
ed)
land
lock
ed a
tlant
ic s
alm
on
162.
1 (1
2.9)
12
.6
(1.6
) 0
(0)
1,41
4.0
(39.
8)
0 (0
) 1,
588.
7 (5
4.3)
6
Salm
o tr
utta
br
own
trou
t 69
8.4
(36.
6)
2,32
3.9
(92.
4)
5,49
0.6
(237
.4)
6,60
7.6
(797
.1)
1,57
2.2
(142
.6)
16,6
92.7
(1
,306
.1)
39Sa
lmo
trut
ta (s
ea r
un)
sea
run
brow
n tr
out
0 (0
) 0
(0)
0 (0
) 29
.0
(2.6
) 0
(0)
29.0
(2
.6)
1Sa
lmo
trut
ta x
Sal
velin
us f
ontin
alis
Ti
ger
trou
t 0
(0)
458.
4 (6
.3)
0 (0
) 8.
3 (6
.8)
0 (0
) 46
6.7
(13.
1)
6Sa
lvel
inus
alp
inus
a
rctic
cha
r 0
(0)
300.
8 (5
.6)
0 (0
) 0
(0)
0 (0
) 30
0.8
(5.6
) 1
Salv
elin
us f
ontin
alis
br
ook
trou
t 34
5.0
(6.2
) 1,
383.
3 (7
5.3)
97
4.2
(35.
6)
4,52
5.8
(528
.9)
827.
2 (1
20.4
) 8,
055.
5 (7
66.5
) 27
Salv
elin
us f
ontin
alis
*nam
aycu
sh
spla
ke
0 (0
) 38
2.8
(4.4
) 53
9.9
(19.
0)
66.2
(1
0.4)
0
(0)
988.
9 (3
3.9)
8
Salv
elin
us n
amay
cush
la
ke t
rout
4,
434.
4 (1
61.3
) 2,
325.
3 (1
63.7
) 1,
466.
9 (3
9.3)
1,
056.
8 (3
9.7)
16
8.4
(3.0
) 9,
451.
8 (4
06.9
) 14
tota
l co
ldw
ater
sp
ort
fish
15,2
64.4
(1
,114
.5)
110,
737.
6 (6
,439
.6)
15,2
28.4
(1,1
75.0
) 17
,875
.2 (2
,188
.1)
12,4
51.7
(2
013.
9)
171,
557.
4 (1
2,93
1.1)
Co
oLw
ate
r s
Port
Es
ox lu
cius
N
orth
ern
pike
3,
520.
5 (0
.8)
679.
0 (0
.2)
5,61
8.7
(9.2
) 10
7.9
(1.2
) 18
.5
(<0.
05)
9,94
4.6
(11.
4)
16Es
ox lu
cius
*mas
quin
ongy
Ti
ger
mus
kie
0 (0
) 42
.3
(2.5
) 64
.7
(0.4
) 25
0.5
(7.5
) 13
.5
(0.1
) 37
1.0
(10.
6)
15Es
ox m
asqu
inon
gy
Mus
kellu
nge
0 (0
) 0
(0)
1,71
2.9
(19.
1)
738.
0 (2
.6)
110.
8 (1
.6)
2,56
1.7
(23.
2)
16Es
ox n
iger
c
hain
pic
kere
l 0
(0)
0 (0
) 0
(0)
1.5
(<0.
05)
0 (0
) 1.
5 (<
0.05
) 1
Perc
a fla
vesc
ens
Ye
llow
per
ch
720.
4 (0
.4)
122.
2 (6
.8)
3,70
8.6
(78.
6)
1,00
0.0
(<0.
05)
0 (0
) 5,
551.
3 (8
5.9)
12
Sand
er c
anad
ensi
s sa
uger
0
(0)
349.
4 (<
0.05
) 28
,723
.0
(2.5
) 18
.6
(<0.
05)
382.
9 (0
.2)
29,4
74.0
(2
.8)
9Sa
nder
can
aden
sis*
vitr
eus
saug
eye
0 (0
) 11
,739
.5
(0.2
) 15
,325
.6
(4.3
) 4.
0 (<
0.05
) 69
9.6
(0.7
) 27
,768
.8
(5.1
) 9
Sand
er v
itreu
s W
alle
ye
15,6
77.9
(3
.8)
78,8
36.7
(2
.2)
630,
595.
6 (1
33.9
) 30
3,39
2.2
(9.7
) 17
,637
.6
(4.9
) 1,
046,
140.
1 (1
54.4
) 34
tota
l co
olw
ater
sp
ort
fish
19,9
18.8
(5
.0)
91,7
69.1
(1
2.0)
68
5,74
9.3
(248
.0)
305,
512.
7 (2
1.0)
18
,863
.0
(7.5
) 1,
121,
812.
9 (2
93.5
)
wa
rm
wa
ter
sPo
rt
Am
blop
lites
rup
estr
is
rock
bas
s 0
(0)
0 (0
) 0
(0)
3.5
(<0.
05)
0 (0
) 3.
5 (<
0.05
) 1
Am
eiur
us m
elas
bl
ack
bullh
ead
0 (0
) 0
(0)
3.6
(1.0
) 0
(0)
0 (0
) 3.
6 (1
.0)
1A
mei
urus
nat
alis
Ye
llow
bul
lhea
d 0
(0)
0 (0
) <
0.05
(<
0.05
) 0
(0)
0 (0
) <
0.05
(<
0.05
) 1
Icta
luru
s fu
rcat
us
blue
cat
fish
0 (0
) 16
9.8
(0.3
) 45
.5
(1.8
) 0
(0)
1,23
5.5
(49.
6)
1,45
0.7
(51.
7)
9Ic
talu
rus
punc
tatu
s c
hann
el c
atfis
h 41
8.7
(22.
5)
1,83
0.5
(102
.0)
6,40
2.5
(191
.9)
422.
1 (8
.0)
5,06
5.2
(385
.6)
14,1
38.9
(7
10.1
) 38
Lepi
sost
eus
plat
ysto
mus
sh
ortn
ose
gar
<0.
05
(<0.
05)
0 (0
) 0
(0)
0 (0
) 0
(0)
<0.
05
(<0.
05)
Lepo
mis
aur
itus
redb
reas
t su
nfish
0
(0)
0 (0
) 0
(0)
0 (0
) 1,
190.
4 (3
.6)
1,19
0.4
(3.6
) 1
Lepo
mis
gib
bosu
s pu
mpk
inse
ed
0 (0
) 0
(0)
0.7
(0.1
) 0
(0)
0 (0
) 0.
7 (0
.1)
1Le
pom
is m
acro
chiru
s bl
uegi
ll
1,29
2.8
(1.2
) 75
.2
(1.3
) 5,
347.
1 (1
4.8)
42
.3
(1.0
) 10
,737
.7
(23.
6)
17,4
95.1
(4
1.8)
31
Lepo
mis
mac
roch
irus*
cyan
ellu
s bl
uegi
ll*G
reen
sun
fish
0 (0
) 0.
7 (<
0.05
) 0
(0)
0 (0
) 0
(0)
0.7
(<0.
05)
1Le
pom
is m
icro
loph
us
rede
ar s
unfis
h 98
.7
(<0.
05)
0 (0
) 92
7.4
(1.1
) 34
.7
(<0.
05)
1,75
1.0
(3.5
) 2,
811.
8 (4
.7)
16Le
pom
is s
pp.
sunfi
sh
0 (0
) 0
(0)
139.
1 (2
.6)
3.0
(0.4
) 2,
130.
8 (4
.4)
2,27
2.9
(7.4
) 9
Mic
ropt
erus
cat
arac
tae
shoa
l bas
s 0
(0)
0 (0
) 0
(0)
0 (0
) 21
2.8
(0.6
) 21
2.8
(0.6
) 1
Mic
ropt
erus
dol
omie
u sm
allm
outh
bas
s 17
.1
(0.1
) 93
.3
(1.4
) 24
9.7
(1.0
) 48
.2
(0.4
) 63
.6
(0.3
) 47
2.0
(3.1
) 22
Mic
ropt
erus
pun
ctul
atus
sp
otte
d ba
ss
0 (0
) 0
(0)
0 (0
) 0
(0)
2.7
(<0.
05)
2.7
(<0.
05)
1M
icro
pter
us s
alm
oide
s la
rgem
outh
bas
s 1,
798.
2 (2
.2)
529.
4 (5
.9)
2,41
4.0
(9.8
) 30
.0
(0.2
) 17
,584
.4
(62.
2)
22,3
56.0
(8
0.2)
35
Mor
one
chry
sops
W
hite
bas
s 0.
4 (0
.1)
0 (0
) 82
0.3
(0.7
) 0
(0)
2,33
1.3
(1.2
) 3,
152.
0 (2
.1)
4M
oron
e sa
xatil
is
strip
ed b
ass
1,65
6.9
(14.
7)
100.
0 (<
0.05
) 23
6.5
(0.7
) 13
,734
.4
(<0.
05)
18,6
25.8
(3
8.3)
34
,353
.7
(53.
7)
20M
oron
e sa
xatil
is*c
hrys
ops
Hyb
rid s
trip
ed b
ass
0 (0
) 3,
672.
3 (0
.7)
13,8
35.4
(6
.6)
137.
4 (0
.8)
14,3
64.8
(1
7.2)
32
,009
.9
(25.
3)
27Po
mox
is a
nnul
aris
W
hite
cra
ppie
0
(0)
0 (0
) 12
7.3
(3.0
) 1.
1 (<
0.05
) 61
6.8
(11.
6)
745.
1 (1
4.6)
7
Pom
oxis
nig
rom
acul
atus
bl
ack
crap
pie
47.5
(0
.1)
215.
7 (2
.0)
529.
1 (5
.5)
1.2
(0.1
) 1,
588.
6 (4
.3)
2,38
2.0
(11.
9)
18Po
mox
is s
pp.
cra
ppie
0
(0)
0 (0
) 0.
2 (<
0.05
) 0
(0)
0 (0
) 0.
2 (<
0.05
) 1
Pylo
dict
is o
livar
is
flat
head
cat
fish
0 (0
) 4.
3 (<
0.05
) 0.
4 (<
0.05
) 0
(0)
44.9
(0
.3)
49.6
(0
.3)
5to
tal w
arm
wat
er s
po
rt fi
sh
5,
330.
4 (4
1.0)
6,
691.
2 (1
13.6
) 31
,078
.7
(240
.5)
14,4
57.8
(1
0.9)
77
,546
.1
(606
.4)
135,
104.
2 (1
,012
.5)
saLm
oN
aN
d s
teeL
Hea
dO
ncor
hync
hus
gorb
usch
a pi
nk s
alm
on
0 (0
) 1,
820.
3 (2
.2)
0 (0
) 0
(0)
0 (0
) 1,
820.
3 (2
.2)
1O
ncor
hync
hus
keta
c
hum
sal
mon
96
6.2
(0.9
) 36
,741
.4
(35.
9)
0 (0
) 0
(0)
0 (0
) 37
,707
.5
(36.
8)
1O
ncor
hync
hus
kisu
tch
coh
o sa
lmon
3,
528.
2 (9
0.0)
33
,597
.8
(838
.1)
1,79
4.0
(55.
8)
250.
0 (6
.7)
0 (0
) 39
,170
.1
(990
.6)
9O
ncor
hync
hus
myk
iss
(shd
) st
eelh
ead
4,39
2.6
(369
.7)
20,1
10.9
(1,6
66.1
) 2,
289.
1 (1
22.9
) 1,
975.
8 (7
3.9)
0
(0)
28,7
68.3
(2
,232
.7)
11O
ncor
hync
hus
nerk
a(so
ckey
e)
sock
eye
salm
on
0 (0
) 12
,862
.8
(12.
1)
0 (0
) 0
(0)
0 (0
) 12
,862
.8
(12.
1)
2
Onc
orhy
nchu
s ts
haw
ytsc
ha
chi
nook
sal
mon
42
,238
.9
(388
.8)
105,
942.
7 (1
,606
.7)
8,31
2.6
(61.
3)
1,83
7.2
(8.1
) 0
(0)
158,
331.
3 (2
,064
.9)
14Sa
lmo
sala
r a
tlant
ic s
alm
on
11,0
73.1
(7
5.1)
0
(0)
49.0
(4
.9)
2,63
5.6
(5.2
) 0
(0)
13,7
57.6
(8
5.2)
5
tota
l sa
lmo
n a
nd
ste
elh
ead
62
,198
.9
(924
.4)
211,
075.
8 (4
,161
.2)
12,4
44.6
(2
45.0
) 6,
698.
6 (9
3.9)
0
(0)
292,
417.
9 (5
,424
.5)
ra
re
or
deC
LiN
iNg
Aci
pens
er f
ulve
scen
s la
ke s
turg
eon
52.9
(1
.0)
0 (0
) 65
.6
(0.6
) 4.
6 (0
.1)
19.4
(0
.1)
142.
4 (1
.8)
5A
cipe
nser
tra
nsm
onta
nus
Whi
te s
turg
eon
0 (0
) 1.
9 (0
.2)
0 (0
) 0
(0)
0 (0
) 1.
9 (0
.2)
1A
losa
med
iocr
is
Hic
kory
sha
d 0
(0)
0 (0
) 0
(0)
6,11
5.7
(0.1
) 0
(0)
6,11
5.7
(0.1
) 1
Alo
sa a
estiv
alis
bl
ueba
ck h
errin
g 21
8.0
(<0.
05)
0 (0
) 0
(0)
0 (0
) 0
(0)
218.
0 (<
0.05
) A
losa
pse
udoh
aren
gus
ale
wife
3.
2 (<
0.05
) 0
(0)
0 (0
) 4.
3 (<
0.05
) 0
(0)
7.5
(<0.
05)
1A
losa
sap
idis
sim
a a
mer
ican
sha
d 4,
792.
2 (<
0.05
) 0
(0)
0 (0
) 4,
710.
4 (<
0.05
) 2,
329.
8 (<
0.05
) 11
,832
.4
(<0.
05)
3A
trac
tost
eus
spat
ula
alli
gato
r ga
r <
0.05
(<
0.05
) 0
(0)
0 (0
) 0
(0)
0 (0
) <
0.05
(<
0.05
) C
atos
tom
us d
isco
bolu
s bl
uehe
ad s
ucke
r 0
(0)
0.5
(0.1
) 0
(0)
0 (0
) 0
(0)
0.5
(0.1
) 1
Cat
osto
mus
latip
inni
s fl
anne
lmou
th s
ucke
r 0
(0)
0.4
(0.1
) 0
(0)
0 (0
) 0
(0)
0.4
(0.1
) 1
Cat
osto
mus
ple
beiu
s ri
o G
rand
e su
cker
0
(0)
0.3
(<0.
05)
0 (0
) 0
(0)
0 (0
) 0.
3 (<
0.05
) 1
Cha
smis
tes
lioru
s Ju
ne s
ucke
r 0
(0)
25.0
(1
.7)
0 (0
) 0
(0)
0 (0
) 25
.0
(1.7
) 1
Ethe
osto
ma
crag
ini
ark
ansa
s da
rter
0
(0)
1.1
(<0.
05)
0 (0
) 0
(0)
0 (0
) 1.
1 (<
0.05
) 1
Fund
ulus
julis
ia
barr
ens
topm
inno
w
4.1
(<0.
05)
0 (0
) 0
(0)
0 (0
) 0
(0)
4.1
(<0.
05)
1G
ila e
lega
ns
bony
tail
17.0
(3
.9)
11.8
(1
.1)
0 (0
) 0
(0)
0 (0
) 28
.8
(5.0
) 2
Gila
nig
resc
ens
chi
huah
a ch
ub
4.5
(0.1
) 0
(0)
0 (0
) 0
(0)
0 (0
) 4.
5 (0
.1)
1G
ila p
ando
ra
rio
Gra
nde
chub
0
(0)
36.2
(0
.1)
0 (0
) 0
(0)
0 (0
) 36
.2
(0.1
) 1
Gila
rob
usta
ro
undt
ail c
hub
0 (0
) 15
.8
(0.1
) 0
(0)
0 (0
) 0
(0)
15.8
(0
.1)
1G
ila r
obus
ta jo
rdan
i pa
hran
agat
roun
dtai
l chu
b 2.
4 (0
.1)
0 (0
) 0
(0)
0 (0
) 0
(0)
2.4
(0.1
) 1
Hyb
ogna
thus
am
arus
ri
o G
rand
e si
lver
y m
inno
w
93.2
(0
.2)
0 (0
) 0
(0)
0 (0
) 0
(0)
93.2
(0
.2)
1La
mpe
tra
appe
ndix
a
mer
ican
bro
ok la
mpr
ey
0 (0
) 0
(0)
0 (0
) 0.
1 (<
0.05
) 0
(0)
0.1
(<0.
05)
1M
oxos
tom
a ro
bust
um
robu
st re
dhor
se
0 (0
) 0
(0)
0 (0
) 0
(0)
34.9
(0
.1)
34.9
(0
.1)
1N
otro
pis
tope
ka
Tope
ka s
hine
r 0
(0)
0 (0
) 13
.3
(<0.
05)
0 (0
) 0
(0)
13.3
(<
0.05
) 1
Onc
orhy
nchu
s ap
ache
a
pach
e tr
out
156.
5 (1
7.8)
11
2.0
(12.
8)
0 (0
) 0
(0)
0 (0
) 26
8.5
(30.
6)
1O
ncor
hync
hus
clar
ki b
ehnk
ei
fine
spo
tted
cut
thro
at
0 (0
) 84
6.3
(28.
6)
0 (0
) 0
(0)
0 (0
) 84
6.3
(28.
6)
3O
ncor
hync
hus
clar
ki h
ensh
awi
laho
ntan
cut
thro
at
0 (0
) 24
0.2
(0.2
) 0
(0)
0 (0
) 0
(0)
240.
2 (0
.2)
1O
ncor
hync
hus
clar
ki le
wis
i W
ests
lope
cut
thro
at
0 (0
) 97
7.4
(12.
5)
0 (0
) 0
(0)
0 (0
) 97
7.4
(12.
5)
2O
ncor
hync
hus
clar
ki p
leur
iticu
s c
olor
ado
riv.
cut
thro
at
0 (0
) 87
9.9
(3.0
) 0
(0)
0 (0
) 0
(0)
879.
9 (3
.0)
2O
ncor
hync
hus
clar
ki s
tom
ias
Gre
enba
ck c
utth
roat
0
(0)
689.
9 (0
.7)
0 (0
) 0
(0)
0 (0
) 68
9.9
(0.7
) 1
Onc
orhy
nchu
s cl
arki
uta
h bo
nnev
ille
cutt
hroa
t 0
(0)
142.
7 (5
.3)
0 (0
) 0
(0)
0 (0
) 14
2.7
(5.3
) 1
Onc
orhy
nchu
s cl
arki
virg
inal
is
rio
Gra
nde
cutt
hroa
t 0
(0)
192.
3 (1
.5)
0 (0
) 0
(0)
0 (0
) 19
2.3
(1.5
) 2
Onc
orhy
nchu
s gi
lae
Gila
tro
ut
6.3
(0.3
) 0
(0)
0 (0
) 0
(0)
0 (0
) 6.
3 (0
.3)
2Pe
trom
yzon
mar
inus
se
a la
mpr
ey
0 (0
) 0
(0)
0 (0
) 0.
1 (<
0.05
) 0
(0)
0.1
(<0.
05)
1Ph
oxin
us e
os
Nor
ther
n re
dbel
ly d
ace
0 (0
) 0.
5 (<
0.05
) 0
(0)
0 (0
) 0
(0)
0.5
(<0.
05)
1Ph
oxin
us e
ryth
roga
ster
so
uthe
rn re
dbel
ly d
ace
0 (0
) 1.
5 (<
0.05
) 0
(0)
0 (0
) 0
(0)
1.5
(<0.
05)
1Pl
agop
teru
s ar
gent
issi
mus
W
ound
fin
4.4
(<0.
05)
0 (0
) 0
(0)
0 (0
) 0
(0)
4.4
(<0.
05)
1Po
lyod
on s
path
ula
padd
lefis
h 66
.5
(6.8
) 0
(0)
2.1
(<0.
05)
2.4
(1.3
) 54
.6
(36.
9)
125.
6 (4
5.1)
8
Ptyc
hoch
eilu
s lu
cius
c
olor
ado
pike
min
now
28
0.5
(0.3
) 5.
3 (0
.2)
0 (0
) 0
(0)
0 (0
) 28
5.8
(0.5
) 3
Scap
hirh
ynch
us a
lbus
pa
llid
stur
geon
20
.9
(0.6
) 5.
6 (0
.5)
0 (0
) 0
(0)
0 (0
) 26
.5
(1.1
) 4
Scap
hirh
ynch
us p
lato
rync
hus
shov
elno
se s
turg
eon
0 (0
) 72
.5
(<0.
05)
0 (0
) 0
(0)
0 (0
) 72
.5
(<0.
05)
1Th
ymal
lus
arct
icus
a
rctic
gra
ylin
g 0
(0)
269.
6 (7
.2)
0 (0
) 0
(0)
0 (0
) 26
9.6
(7.2
) 3
Xyr
auch
en t
exan
us
razo
rbac
k su
cker
63
.1
(9.7
) 15
.5
(2.4
) 0
(0)
0 (0
) 0
(0)
78.6
(1
2.1)
3
tota
l rar
e o
r d
eclin
ing
5,78
5.6
(40.
9)
4,54
4.1
(78.
1)
81.0
(0
.7)
10,8
37.7
(1
.4)
2,43
8.7
(37.
1)
23,6
87.1
(1
58.2
)
For
ag
e C
atos
tom
us c
omm
erso
nii
Whi
te s
ucke
r 0
(0)
0 (0
) 1,
601.
6 (1
.5)
0 (0
) 0
(0)
1,60
1.6
(1.5
) 1
cyp
rinid
ae s
pp.
Min
now
s 0
(0)
0 (0
) 0
(0)
0 (0
) 15
9.8
(0.1
) 15
9.8
(0.1
) 1
Dor
osom
a ce
pedi
anum
G
izza
rd s
had
0 (0
) 0.
8 (0
.3)
0.6
(0.1
) 0
(0)
0 (0
) 1.
4 (0
.3)
3D
oros
oma
pete
nens
e Th
read
fin s
had
0 (0
) 0
(0)
30.8
(<
0.05
) 0
(0)
0 (0
) 30
.8
(<0.
05)
1Er
imyz
on o
blon
gus
cre
ek c
hubs
ucke
r 0
(0)
0 (0
) 0
(0)
0 (0
) 0.
9 (0
.1)
0.9
(0.1
) 1
Men
idia
ber
yllin
a*au
dens
M
issi
ssip
pi in
land
silv
ersi
de
0 (0
) 0
(0)
0 (0
) 0
(0)
15.6
(0
.1)
15.6
(0
.1)
1N
otem
igon
us c
ryso
leuc
as
Gol
den
shin
er
0 (0
) 0
(0)
1.6
(<0.
05)
5.0
(0.1
) 0
(0)
6.5
(0.1
) 2
Pim
epha
les
prom
elas
fa
thea
d m
inno
w
0 (0
) 1.
0 (<
0.05
) 2,
326.
7 (1
95.9
) 73
.5
(0.1
) 27
6.2
(0.2
) 2,
677.
4 (1
96.3
) 10
tota
l fo
rag
e fi
sh
0
(0)
1.8
(0.3
) 3,
961.
3 (1
97.6
) 78
.5
(0.1
) 45
2.5
(0.5
) 4,
494.
0 (1
98.5
)
ma
riN
e Sc
iaen
ops
ocel
latu
s re
d dr
um
334.
8 (0
.1)
0 (0
) 0
(0)
0 (0
) 0
(0)
334.
8 (0
.1)
1to
tal m
arin
e
334.
8 (0
.1)
0 (0
) 0
(0)
0 (0
) 0
(0)
334.
8 (0
.1)
otH
er
Cte
noph
aryn
godo
n id
ella
G
rass
car
p 0
0)
0 (0
) 58
.3
(0.6
) 0
(0)
8.9
(5.6
) 67
.3
(6.1
) 7
Cte
noph
aryn
godo
n id
ella
(3)
Gra
ss c
arp
(3)
0 (0
) 0.
5 (0
.1)
0.5
(0.2
) 0
(0)
5.8
(13.
0)
6.8
(13.
2)
5to
tal o
ther
0 (0
) 0.
5 (0
.1)
58.9
(0
.7)
0 (0
) 14
.7
(18.
6)
74.1
(1
9.3)
gr
aN
d t
ota
L
108,
832.
9 (2
,126
.1)
424,
820.
2 (10
,804
.8)
748,
602.
1 (2
,107
.4)
355,
460.
4 (2
,315
.6)
111,
766.
8 (2
,684
.0)
1,74
9,48
2.3
(20,
037.
8)
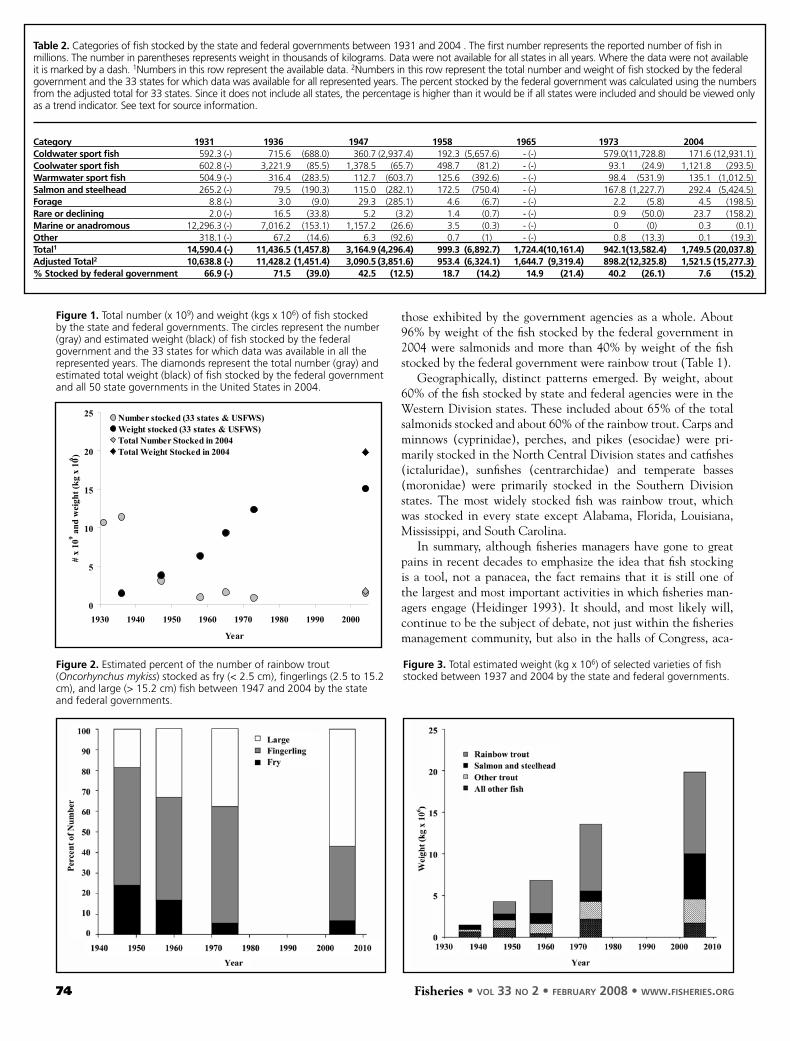
74 Fisheries • vol 33 no 2 • february 2008 • www.fisheries.org
0
5
10
15
20
25
1930 1940 1950 1960 1970 1980 1990 2000
Year
# x
109 a
nd w
eigh
t (kg
x 1
06 )
Number stocked (33 states & USFWS)Weight stocked (33 states & USFWS)Total Number Stocked in 2004Total Weight Stocked in 2004
table 2. categories of fish stocked by the state and federal governments between 1931 and 2004 . The first number represents the reported number of fish in millions. The number in parentheses represents weight in thousands of kilograms. data were not available for all states in all years. Where the data were not available it is marked by a dash. 1Numbers in this row represent the available data. 2Numbers in this row represent the total number and weight of fish stocked by the federal government and the 33 states for which data was available for all represented years. The percent stocked by the federal government was calculated using the numbers from the adjusted total for 33 states. since it does not include all states, the percentage is higher than it would be if all states were included and should be viewed only as a trend indicator. see text for source information.
Category 1931 1936 1947 1958 1965 1973 2004Coldwater sport fish 592.3 (-) 715.6 (688.0) 360.7 (2,937.4) 192.3 (5,657.6) - (-) 579.0 (11,728.8) 171.6 (12,931.1)Coolwater sport fish 602.8 (-) 3,221.9 (85.5) 1,378.5 (65.7) 498.7 (81.2) - (-) 93.1 (24.9) 1,121.8 (293.5)warmwater sport fish 504.9 (-) 316.4 (283.5) 112.7 (603.7) 125.6 (392.6) - (-) 98.4 (531.9) 135.1 (1,012.5)salmon and steelhead 265.2 (-) 79.5 (190.3) 115.0 (282.1) 172.5 (750.4) - (-) 167.8 (1,227.7) 292.4 (5,424.5)Forage 8.8 (-) 3.0 (9.0) 29.3 (285.1) 4.6 (6.7) - (-) 2.2 (5.8) 4.5 (198.5)rare or declining 2.0 (-) 16.5 (33.8) 5.2 (3.2) 1.4 (0.7) - (-) 0.9 (50.0) 23.7 (158.2)marine or anadromous 12,296.3 (-) 7,016.2 (153.1) 1,157.2 (26.6) 3.5 (0.3) - (-) 0 (0) 0.3 (0.1)other 318.1 (-) 67.2 (14.6) 6.3 (92.6) 0.7 (1) - (-) 0.8 (13.3) 0.1 (19.3)total1 14,590.4 (-) 11,436.5 (1,457.8) 3,164.9 (4,296.4) 999.3 (6,892.7) 1,724.4 (10,161.4) 942.1 (13,582.4) 1,749.5 (20,037.8)adjusted total2 10,638.8 (-) 11,428.2 (1,451.4) 3,090.5 (3,851.6) 953.4 (6,324.1) 1,644.7 (9,319.4) 898.2 (12,325.8) 1,521.5 (15,277.3)% stocked by federal government 66.9 (-) 71.5 (39.0) 42.5 (12.5) 18.7 (14.2) 14.9 (21.4) 40.2 (26.1) 7.6 (15.2)
those exhibited by the government agencies as a whole. About 96% by weight of the fish stocked by the federal government in 2004 were salmonids and more than 40% by weight of the fish stocked by the federal government were rainbow trout (Table 1).
Geographically, distinct patterns emerged. by weight, about 60% of the fish stocked by state and federal agencies were in the Western Division states. These included about 65% of the total salmonids stocked and about 60% of the rainbow trout. Carps and minnows (cyprinidae), perches, and pikes (esocidae) were pri-marily stocked in the North Central Division states and catfishes (ictaluridae), sunfishes (centrarchidae) and temperate basses (moronidae) were primarily stocked in the Southern Division states. The most widely stocked fish was rainbow trout, which was stocked in every state except Alabama, Florida, Louisiana, Mississippi, and South Carolina.
In summary, although fisheries managers have gone to great pains in recent decades to emphasize the idea that fish stocking is a tool, not a panacea, the fact remains that it is still one of the largest and most important activities in which fisheries man-agers engage (Heidinger 1993). It should, and most likely will, continue to be the subject of debate, not just within the fisheries management community, but also in the halls of Congress, aca-
Figure 1. Total number (x 109) and weight (kgs x 106) of fish stocked by the state and federal governments. The circles represent the number (gray) and estimated weight (black) of fish stocked by the federal government and the 33 states for which data was available in all the represented years. The diamonds represent the total number (gray) and estimated total weight (black) of fish stocked by the federal government and all 50 state governments in the united states in 2004.
Figure 2. estimated percent of the number of rainbow trout (Oncorhynchus mykiss) stocked as fry (< 2.5 cm), fingerlings (2.5 to 15.2 cm), and large (> 15.2 cm) fish between 1947 and 2004 by the state and federal governments.
Figure 3. Total estimated weight (kg x 106) of selected varieties of fish stocked between 1937 and 2004 by the state and federal governments.

Fisheries • vol 33 no 2 • february 2008 • www.fisheries.org 75
demia, and among interested citizens and private organizations. Hopefully, this arti-cle will help make these debates fruitful and constructive while at the same time emphasizing the need for fisheries man-agement agencies to make their stocking data—both numbers and sizes—standard-ized and publicly accessible. a
ACKnowledGMenTS
This material is based upon work sup-ported by the National Science Foundation under Grant SES-0522262. I am very grateful to all of the people at the state and federal agencies who provided data. Robert Pos, Roy Schiff, Phil Pister, Mike Mason, two anonymous reviewers, and the sci-ence editor reviewed and provided helpful comments on the manuscript. Finally, my thanks go to Patricia Nelson Limerick and the people at the Center of the American West at the University of Colorado, who have provided invaluable guidance and assistance with this project.
ReFeRenCeS
Allard, d.C., Jr. 1978. Spencer Fullerton baird and the U. S. Fish Commission. Arno Press, New York.
bureau of Fisheries. 1932. Report of the United States Commissioner of Fisheries for the Fiscal Year 1931 with Appendixes. U.S. Government Printing Office, Washington, D.C.
bureau of Sport Fisheries and wildlife. 1968. National survey of needs for hatch-ery fish. Resource Publication 63. U.S. Department of the Interior, Washington, D.C.
Calhoun, A. 1974. Report of the national task force for public fish hatchery policy. U.S. Fish and Wildlife Service, Denver, Colorado.
Carlander, K. d. 1969. Handbook of fresh-water fishery biology. Vol. 1. Iowa State University Press, Ames, Iowa.
earle, S. 1937. Fish culture is big business in the United States. Progressive Fish Culturist 31:1-29.
epifanio, J. 2000. The status of coldwater fishery management in the United States: an overview of state programs. Fisheries 25(7):13-27.
everest, F. h., G. h. Reeves, J. K. Sedell, d. b. hohler, and T. Cain. 1987. The effects of habitat enhancement on steel-head trout and coho salmon smolt pro-duction, habitat utilization, and habitat availability in Fish Creek, Oregon, 1983-
1986. Annual Report 1986 prepared for U.S. Department of Energy, bonneville Power Administration, Portland, Oregon.
Fish, J. T. 2004. Overview of lake stocking for recreational fisheries in interior Alaska. Pages 33-43 in M. J. Nickum, P. M. Mazik, J. G. Nickum, and D. D. MacKinlay, eds. Propagated fish in resource management. American Fisheries Society Symposium 44, bethesda, Maryland.
Froese, R. and d. Pauly (editors). 2006. Fishbase. World Wide Web electronic publication. Available at: www.fishbase.org, version (06/2006).
GAo (General Accounting office). 1999. Report to the ranking minority mem-ber, Committee on Resources, House of Representatives: National fish hatcher-ies classification of the distribution of fish and fish eggs needs and refinement. Washington, D.C.
hagen, w., and J. P. o’Connor. 1959. Public fish culture in the United States, 1958; a statistical summary. U.S. Fish and Wildlife Service Circular 58. U.S. Government Printing Office, Washington, D.C.
heidinger, R. C. 1993. Stocking for sport fisheries enhancement. Pages 309-333 in C. C. Kohler, and W. A. Hubert, eds. Inland fisheries management in North America. American Fisheries Society, bethesda, Maryland.
Jackson, J. R., J. C. boxrucker, and d. w. willis. 2004. Trends in agency use of propagated fishes as a management tool in inland fisheries. Pages 121-138 in M. J. Nickum, P. M. Mazik, J. G. Nickum, and D. D. MacKinlay, eds. Propagated fish in resource management. American Fisheries Society Symposium 44, bethesda, Maryland.
Knapp, R. A. 2005. Turning back the clock: restoring lake ecosystems by eradicat-ing introduced fish. Presentation in the American Museum of Natural History Center for biodiversity and Conservation Spring Symposium 2005: new cur-rents in conserving freshwater systems. Available at: http://cbc.amnh.org/sympo-sia/archives/freshwater/presenters/tran-scripts/knapp-text.pdf
Krist, J. 2001. A Sierra Nevada fish story. Ventura County Star. (May 3).
leitritz, e. 1970. A history of California’s fish hatcheries 1870-1960. California Department of Fish and Game Fish bulletin 150, Sacramento.
Moore, S. e., M. A. Kulp, J. hammonds, and b. Rosenlund. 2005. Restoration of Sams Creek and an assessment of brook trout restoration methods; Great Smoky Mountains National
Park. U.S. Department of the Interior, National Park Service Technical Report NPS/NRWRD/NRTR-2005/342.
nickum, M. J., P. M. Mazik, J. G. nickum, and d. d. MacKinlay (editors). 2004. Propagated fish in resource management. American Fisheries Society Symposium 44, bethesda, Maryland.
Schramm, h. l., Jr. and R. G. Piper (edi-tors). 1995. Uses and effects of cultured fishes in aquatic ecosystems. American Fisheries Society, bethesda, Maryland.
Shetter, d. S. 1947. Further results from spring and fall plantings of legal-sized, hatchery-reared trout in streams and lakes of Michigan. Transactions of the American Fisheries Society 74:35-58.
Stone, M. d. 1995. Fish stocking pro-grams in Wyoming: a balanced perspec-tive. Pages 47-51 in H. L. Schramm, Jr., and R. G. Piper, eds. Uses and effects of cultured fishes in aquatic ecosystems. American Fisheries Society Symposium 15, bethesda, Maryland.
Stroud, R. h. (editor). 1986. Fish culture in fisheries management. American Fisheries Society, bethesda, Maryland.
The Conservation Fund. 1994. Report of the National Fish Hatchery Review Panel. Arlington, Virginia.
Towle, J. C. 2000. Authored ecosystems: Livingston Stone and the transformation of California fisheries. Environmental History 5(1):54-74.
Tunison, A. V., S. M. Mullin, and o. l. Meehan. 1949a. Survey of fish culture in the United States. Progressive Fish Culturist 11(1): 31-69.
_____. 1949b. Survey of fish culture in the United States. Progressive Fish Culturist 11(4): 253-262.
U.S. Commission of Fish and Fisheries. 1874. Report of the Commissioner for 1872 and 1873. U.S. Government Printing Office, Washington, D.C.
USFwS (U.S. Fish and wildlife Service). 1998. Greenback cutthroat trout recov-ery plan. U.S. Fish and Wildlife Service, Denver, Colorado.
white, R. J., J. R. Karr, and w. nehlsen. 1995. better roles for fish stocking in aquatic resource management. Pages 527-547 in H. L. Schramm, Jr., and R. G. Piper, eds. Uses and effects of cultured fishes in aquatic ecosystems. American Fisheries Society Symposium 15, bethesda, Maryland.

76 Fisheries • vol 33 no 2 • february 2008 • www.fisheries.org
COlumn:gueSt direCtor'S Line
Six decades of Fishery genetics: taking Stock
robin S. Waples, Walton W. dickhoff, Lorenz Hauser, and
nils ryman
Waples and dickhoff are at the Northwest fisheries science center in
seattle, Washington. Waples can be reached at [email protected].
Hauser is at the school of aquatic and fishery sciences, university of
Washington, seattle. ryman is at the department of Zoology, stockholm
university, stockholm, sweden.
The field of fishery genetics has definitely come of age. That was the overwhelming consensus at a recent meeting held in seattle entitled, “six decades of fishery Genetics: a retrospective View and a Vision for the future.” This symposium, jointly sponsored by Noaa fisheries’ Northwest fisheries science center and the university of Washington’s school of aquatic and fishery sciences, drew 150 participants from 8 countries and 4 continents. The symposium had three major objectives. first, as part of its retrospective view, the meet-ing honored fred utter’s long record of scientific contributions to the field. It was suggested that his legacy can be attributed largely to four factors.
Vision: utter was one of the earli-est to see the relevance of genetic information to fishery management and he has never wavered in his efforts to promote that connection.
mentoring: Many of his early students and colleagues have gone on to play major roles in the field, and utter continues as a men-tor through his activities at the university of Washington and the american fisheries society.
Humanity: Never one to bother with artifice, utter treats everyone with generosity and respect—to the pleasant surprise of many fledgling students who have sought his counsel.
stamina: utter’s scientific career already spans the terms of nine u.s. presidents (and counting). He took a summer job at the Montlake laboratory in 1953 (shortly after Harry Truman vacated the oval office), and he remains actively engaged in scientific activities well into his eigth decade. More information about utter’s career and his recent recognition as a Noaa History Maker can be found at
http://celebrating200years.noaa.gov/ historymakers/side_hon_mentions.html.
The ride through these six decades has not always been easy; many bumps have occurred along the way, and areas of tension between fishery genetics and fishery management persist today. Indeed, phil pister, who sent his regrets at not being able to attend, suggested (perhaps only partly tongue in cheek) that a better title for the meeting might have been, “How to survive six decades of fish Geneticists.” according to pister, an eminent trout biologist (who shall remain anonymous but whose initials are rb) keeps a (large) bottle of whiskey in his desk drawer, ready for the next call from a fish geneticist. and one com-menter noted that managers of some pelagic fish stocks, discouraged with the type of information provided by geneti-cists, have recently turned back to more traditional types of data for evaluat-ing stock structure. Nevertheless, the
su Kim
at the six decades of fishery Genetics conference held in seattle, Washington, fred utter (second from left) is honored with an award for his recognition as a Noaa History Maker and he receives congratulations from usha Varanasi, director of the Noaa fisheries Northwest fisheries science center; Nancy utter; robin Waples, NWfsc; and Nils ryman, stockholm university.

Halltech
Fisheries • vol 33 no 2 • february 2008 • www.fisheries.org 77
meeting provided abundant evidence for application of genetic methods to practical problems in fishery manage-ment. This was aptly demonstrated by Michael Hansen from denmark, who described results of a series of detailed investigations of hatchery-wild interac-tions that have led to a revolution in the local management of salmonid fishes.
reflecting on development of the field of fishery genetics, two major phases can be identified. phase 1 is get-ting the attention of fishery managers. This phase was often very protracted, and for some species in some geo-graphic areas it is still difficult to get managers to take genetic information seriously. In phase 2, having attracted the attention of managers, geneticists must deliver information that is timely and relevant for the problems that managers must deal with. This has not always been easy, and this challenge has not always been dealt with effec-tively by geneticists. some of us recall
a comment made by ellen Marsden at an afs annual Meeting nearly two decades ago to the effect that:
If significant differences are found [between samples from different areas], geneticists say the populations should be managed as separate stocks; if no differ-ences are found, they still say they should be managed separately because there might be differ-ences they couldn’t detect.
as Marsden noted, if this is the only type of guidance geneticists can provide, it would not be surprising if managers stopped asking for our advice. This example might be apocryphal, but it contains enough truth to serve as a persistent warning to geneticists. furthermore, if geneticists lose the faith of managers because of the inability to deliver useful information, it might be a long time before we get their attention again. central to this difficulty is the
reality that genetic measures of popu-lation differentiation tend to become saturated at relatively low levels of gene flow, well below the levels of migra-tion that define the transition between demographic independence and demographic coupling. because defin-ing this transition region is often the primary concern of fishery managers, geneticists face an ongoing challenge to deliver in phase 2. strongly diverged populations that require separate management are easy to identify, but based on genetic markers alone it is very difficult to demonstrate that flux of individuals is sufficiently large to make two systems demographically coupled.
The second major objective of the meeting was to provide a brief over-view of the broad array of current applications of genetic and molecular methods to all aspects of modern fishery biology. This was a challeng-ing task, as rapid advances in dNa technology have opened up a vast
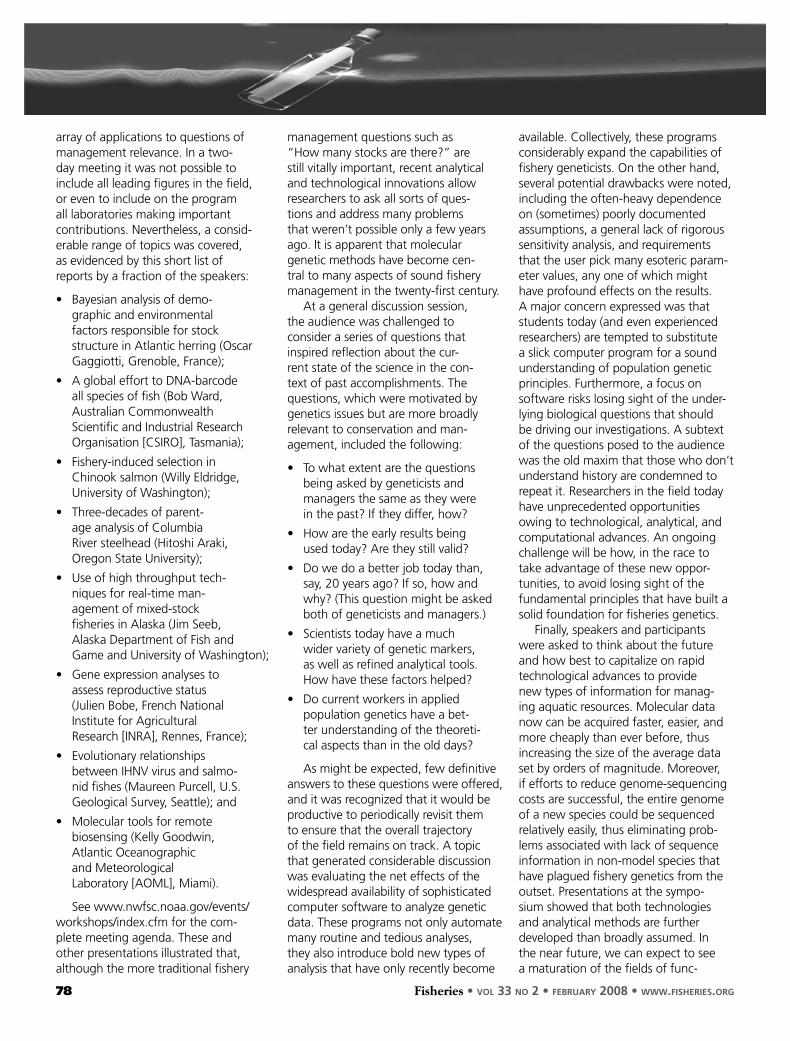
78 Fisheries • vol 33 no 2 • february 2008 • www.fisheries.org
array of applications to questions of management relevance. In a two-day meeting it was not possible to include all leading figures in the field, or even to include on the program all laboratories making important contributions. Nevertheless, a consid-erable range of topics was covered, as evidenced by this short list of reports by a fraction of the speakers:
• bayesian analysis of demo-graphic and environmental factors responsible for stock structure in atlantic herring (oscar Gaggiotti, Grenoble, france);
• a global effort to dNa-barcode all species of fish (bob Ward, australian commonwealth scientific and Industrial research organisation [csIro], Tasmania);
• fishery-induced selection in chinook salmon (Willy eldridge, university of Washington);
• Three-decades of parent-age analysis of columbia river steelhead (Hitoshi araki, oregon state university);
• use of high throughput tech-niques for real-time man-agement of mixed-stock fisheries in alaska (Jim seeb, alaska department of fish and Game and university of Washington);
• Gene expression analyses to assess reproductive status (Julien bobe, french National Institute for agricultural research [INra], rennes, france);
• evolutionary relationships between IHNV virus and salmo-nid fishes (Maureen purcell, u.s. Geological survey, seattle); and
• Molecular tools for remote biosensing (Kelly Goodwin, atlantic oceanographic and Meteorological laboratory [aoMl], Miami).
see www.nwfsc.noaa.gov/events/workshops/index.cfm for the com-plete meeting agenda. These and other presentations illustrated that, although the more traditional fishery
management questions such as “How many stocks are there?” are still vitally important, recent analytical and technological innovations allow researchers to ask all sorts of ques-tions and address many problems that weren’t possible only a few years ago. It is apparent that molecular genetic methods have become cen-tral to many aspects of sound fishery management in the twenty-first century.
at a general discussion session, the audience was challenged to consider a series of questions that inspired reflection about the cur-rent state of the science in the con-text of past accomplishments. The questions, which were motivated by genetics issues but are more broadly relevant to conservation and man-agement, included the following:
• To what extent are the questions being asked by geneticists and managers the same as they were in the past? If they differ, how?
• How are the early results being used today? are they still valid?
• do we do a better job today than, say, 20 years ago? If so, how and why? (This question might be asked both of geneticists and managers.)
• scientists today have a much wider variety of genetic markers, as well as refined analytical tools. How have these factors helped?
• do current workers in applied population genetics have a bet-ter understanding of the theoreti-cal aspects than in the old days?
as might be expected, few definitive answers to these questions were offered, and it was recognized that it would be productive to periodically revisit them to ensure that the overall trajectory of the field remains on track. a topic that generated considerable discussion was evaluating the net effects of the widespread availability of sophisticated computer software to analyze genetic data. These programs not only automate many routine and tedious analyses, they also introduce bold new types of analysis that have only recently become
available. collectively, these programs considerably expand the capabilities of fishery geneticists. on the other hand, several potential drawbacks were noted, including the often-heavy dependence on (sometimes) poorly documented assumptions, a general lack of rigorous sensitivity analysis, and requirements that the user pick many esoteric param-eter values, any one of which might have profound effects on the results. a major concern expressed was that students today (and even experienced researchers) are tempted to substitute a slick computer program for a sound understanding of population genetic principles. furthermore, a focus on software risks losing sight of the under-lying biological questions that should be driving our investigations. a subtext of the questions posed to the audience was the old maxim that those who don’t understand history are condemned to repeat it. researchers in the field today have unprecedented opportunities owing to technological, analytical, and computational advances. an ongoing challenge will be how, in the race to take advantage of these new oppor-tunities, to avoid losing sight of the fundamental principles that have built a solid foundation for fisheries genetics.
finally, speakers and participants were asked to think about the future and how best to capitalize on rapid technological advances to provide new types of information for manag-ing aquatic resources. Molecular data now can be acquired faster, easier, and more cheaply than ever before, thus increasing the size of the average data set by orders of magnitude. Moreover, if efforts to reduce genome-sequencing costs are successful, the entire genome of a new species could be sequenced relatively easily, thus eliminating prob-lems associated with lack of sequence information in non-model species that have plagued fishery genetics from the outset. presentations at the sympo-sium showed that both technologies and analytical methods are further developed than broadly assumed. In the near future, we can expect to see a maturation of the fields of func-

floy Tag
Fisheries • vol 33 no 2 • february 2008 • www.fisheries.org 79
tional genomics and gene expression, with potentially widespread and novel applications designed to improve our understanding of how aquatic ecosystems function. The molecular revolution in biology promises to continue to transform fishery genetics and open research opportunities that were unthinkable before; as a consequence, we expect that develop-ments over the next decade will rival, and perhaps even surpass, the remarkable advances in fishery genetics of the last six decades.
In part inspired by the themes of this meet-ing, lorenz Hauser, robin Waples, and Gary carvalho will edit a special issue of Fish and Fisheries devoted to fishery genetics. Major papers planned for the special issue, targeted to appear in december 2008, will cover (1) paradigm shifts, (2) functional genomics, (3) insights into connectivity in marine systems from genetic and non-genetic data, (4) bridging the gap between molecular genetics and adap-tive variation, and (5) more effective integration of genetics into fishery management. a.
The Moving Box
AFS has received a purchase offer for most of its office space from Nations Academy, contingent on the school obtaining a zoning exemption. However, application for the exemption has been held up due to a county commission declaring part of the Grosvenor property as “Legacy Open Space,” forcing the academy to rework its site plans. It is now thought that the purchase may not be finalized until May 2009. Meanwhile, the ad hoc AFS Transition Committee made its final report to the Governing Board, who will discuss possible transition issues at its retreat at the mid-term meeting in March. The report addresses relocation considerations such partnerships, ownership options, pros and cons of various locations, staff preferences, and minimum physical specifications. The Governing Board is also expected to discuss possibly creating a foundation to handle any proceeds from the sale. We will keep you posted.

80 Fisheries • vol 33 no 2 • february 2008 • www.fisheries.org
Fisheries management section 2007 Awards Presentations
The fisheries Management section
(fMs) was fortunate to have many
deserving nominees in 2007, so there
were either individual or multiple
winners of all available awards. fMs
president Joe larscheid and president
elect ron essig presented these
awards at the fMs business meet-
ing on 2 september 2007 at afs annual Meeting in san francisco.
The highest honor given by the fMs is selection into the fisheries Management Hall of excellence (Hoe). The hall is located at the aK-sar-beN aquarium in Gretna, Nebraska, where plaques of inductees are prominently displayed. It was established in 1992 with stated objectives: (1) to recog-nize fisheries management profes-
sionals who have made outstanding contributions to the advancement of fisheries management; (2) to pro-vide a site where the contributions of those honored can be displayed and viewed by the public and other fisheries professionals; (3) to empha-size the accomplishment, dedica-tion, and principles of those honored in the Hoe; and (4) to describe the fisheries management profession.
In 2007, there were three inductees into the Hoe. Hannibal bolton was recognized for his notable contribu-tions to fisheries management in the Great lakes area and in Washington, dc, and for his inspirational work in minority recruitment and mentoring within the fisheries profession during his 30+ year career with the u.s. fish and Wildlife service. dave Willis was recognized for his national leadership in fisheries management education and applied research with an impres-sive array of publications, including Fisheries Techniques, 2nd edition, and for his exemplary involvement in many afs leadership positions. Jack Wingate
nEwS:unitS
forrest boney receives an award of Merit. roy Williams receives an award of excellence.
fMs president Joe larscheid on the left and ron essig present awards. Hannibal bolton, u.s. fish and Wildlife service, is inducted into the fMs Hall of excellence.
dave Willis is inducted into the Hall of excellence, the fMs's highest honor.
Jack Wingate's Hall of excellence award is accepted on his behalf by Wayne Hubert.

Fisheries • vol 33 no 2 • february 2008 • www.fisheries.org 81
nEwSunitS
was recognized for his outstanding leadership in resolving large lake fisher-ies research and management issues in Minnesota over a 25-year period and for his dedicated long-time service in leadership roles at every level of afs.
The award of excellence is given for inspirational leadership in the fishery profession and substantial achievements for afs and the fisher-ies resource. The recipients must have effectively communicated their work at the national and/or international level. This award is given for cumula-tive accomplishments rather than a singular effort. There were two winners of this award in 2007. James cowan was recognized for his dedicated service to state, regional, and national fisheries management, including 15 years for the Gulf of Mexico fishery Management council and 10 years for the National research council ocean studies board. roy Williams was recognized for his 39 years of marine fisheries management in florida and his pioneering efforts in moving marine fisheries management from a reactive to a more proactive process.
The conservation achievement award recognizes any significant action, program, or initiative by a nonmember individual, non-governmental organiza-tion, or state/provincial, local, or federal agency that contributes substantially to fishery conservation or fishery science. The 2007 winner of this fMs award was the southeast aquatic resources partnership (sarp). sarp was created in 2001 as a groundbreaking partner-ship of 13 states, 4 regional fishery commissions, many federal agencies, and numerous private organizations. Its southeast aquatic Habitat plan, to be completed in late 2007, should serve as a model for regional implementation of the National fish Habitat action plan.
The award of Merit recognizes a singular accomplishment or an indi-vidual or group acting as a team or committee for contributions in fisher-ies management and research. The award is given for outstanding leader-ship, administration, or project-related accomplishment in any aspect of the fisheries profession. There were two awards of Merit presented in 2007. The first was a joint award to paul
balkenbush and James Vincent for their leadership of a contingent of oklahoma department of Wildlife conservation employees, cooperators, and volunteers to enhance a 2,800 foot portion of the lower Mountain fork river through a hydraulically improved low-flow chan-nel, enhanced stream habitat, two-acre wetland construction, and creation of a new 1,200 foot trout stream. The sec-ond was presented to forrest bonney for his 35 years of brook trout man-agement in Maine, including revamp-ing regulations, authoring a species management plan, and publishing two books in 2006–2007 on this species for laymen and technical audiences.
—Ron Essig
southeast aquatic resources partnership coordinator scott robinson accepts the conservation achievement award.
The awards of Merit are presented to paul balkenbush and James Vincent, oklahoma department of Wildlife conservation.
Fish Health sectionCall for papers for 2008 meeting
The 2008 annual Meeting of the fHs-afs will be held in charlottetown, prince edward Island, canada, from 9–12 July.
The conference website (www.upei.ca/fHs-afs2008) is open to accept online registration / payment as well as submission of abstracts for oral presenta-tions and posters. registration for this meeting will include an “al la carte” menu allowing for the selection of continu-ing education activities, special evening events, and/or confer-ence registration. registration will include lunches on the 10–12th. accommodations and travel arrangements should be booked separately using the website links provided to university of prince edward Island (upeI) conference services and airlines which service prince edward Island. a large block of rooms have been reserved at a special rate on the upeI campus adja-cent to the conference halls. We encourage attendees to utilize these discounted accommoda-tions on a first-come basis.
—Dave Groman
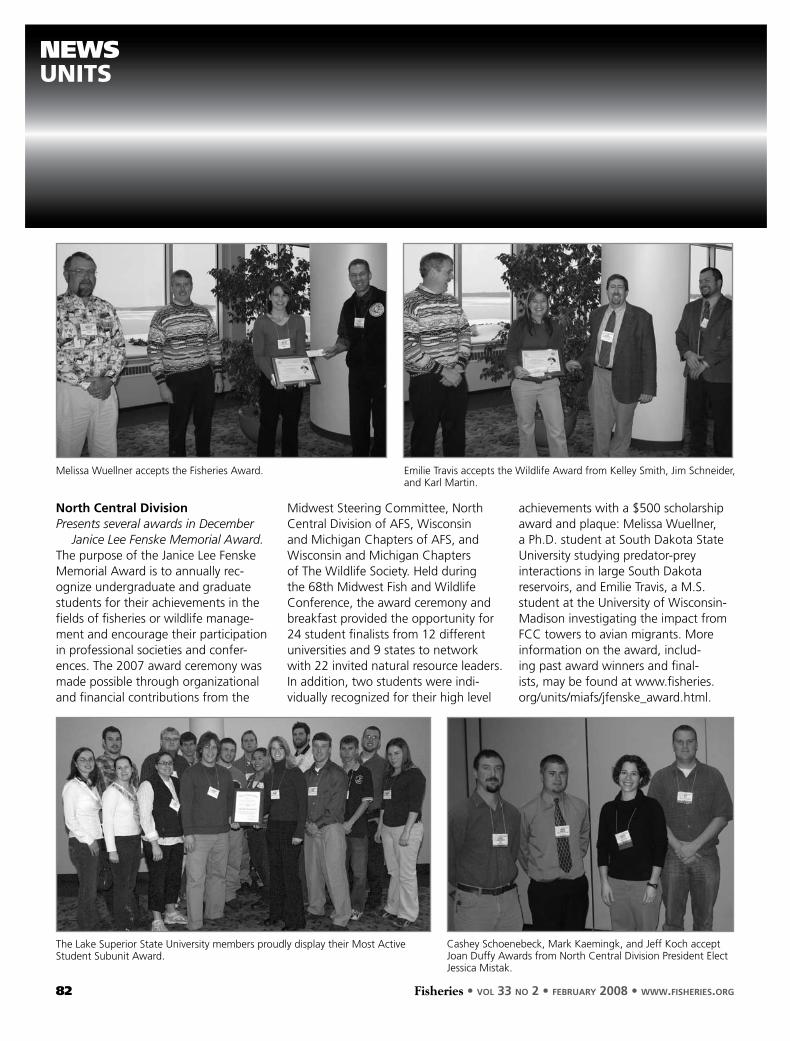
82 Fisheries • vol 33 no 2 • february 2008 • www.fisheries.org
North Central divisionPresents several awards in December
Janice Lee Fenske Memorial Award. The purpose of the Janice lee fenske Memorial award is to annually rec-ognize undergraduate and graduate students for their achievements in the fields of fisheries or wildlife manage-ment and encourage their participation in professional societies and confer-ences. The 2007 award ceremony was made possible through organizational and financial contributions from the
Midwest steering committee, North central division of afs, Wisconsin and Michigan chapters of afs, and Wisconsin and Michigan chapters of The Wildlife society. Held during the 68th Midwest fish and Wildlife conference, the award ceremony and breakfast provided the opportunity for 24 student finalists from 12 different universities and 9 states to network with 22 invited natural resource leaders. In addition, two students were indi-vidually recognized for their high level
achievements with a $500 scholarship award and plaque: Melissa Wuellner, a ph.d. student at south dakota state university studying predator-prey interactions in large south dakota reservoirs, and emilie Travis, a M.s. student at the university of Wisconsin-Madison investigating the impact from fcc towers to avian migrants. More information on the award, includ-ing past award winners and final-ists, may be found at www.fisheries.org/units/miafs/jfenske_award.html.
nEwSunitS
emilie Travis accepts the Wildlife award from Kelley smith, Jim schneider, and Karl Martin.
The lake superior state university members proudly display their Most active student subunit award.
cashey schoenebeck, Mark Kaemingk, and Jeff Koch accept Joan duffy awards from North central division president elect Jessica Mistak.
Melissa Wuellner accepts the fisheries award.
Fisheries • vol 33 no 2 • february 2008 • www.fisheries.org 83
nEwSunitS
Most Active Student Subunit Award. The North central division of afs rec-ognized lake superior state university with the 2007 Most active student subunit award. This award is in recog-nition of carrying out the most active program in developing interest among undergraduate and graduate students in fisheries science and fulfilling the mission of the North central division of the american fisheries society. according to the North central division awards committee, lake superior state university stood out as the unanimous award winner among the seven nomi-nated student subunits. The subunit was commended for their well-rounded program that balances fisheries man-agement experiences, professional development, and community outreach.
Joan Duffy Award. five chapters nominated students for a $100 match-ing Joan duffy award scholarship from the North central division. The award winners were casey schoenebeck – dakota chapter, Jared Mobley—Indiana chapter, Jeff Koch—Iowa chapter,
Mark Kaemingk—Michigan chapter, and Tony barada—Nebraska chapter.
Most Active Large Chapter. The Minnesota chapter continues their tra-dition of excellence by being awarded their seventh Most active chapter award since 2000. The chapter has continued to pursue a wide variety of activities within the state and has actively supported and worked towards the parent society’s missions of mem-ber services, information outreach, and aquatic services. some of their key activities include an annual meet-ing with guest panels and speakers, student support through scholarships and mentoring, representation on Ncd technical committees, informa-tive newsletters, and issue advocacy.
Best Communications. The Indiana chapter was presented the 2007 best communications award in recogni-tion of the North central division’s most efficient, useful, and attrac-tive newsletter and website to dis-seminate information to members.
Meritorious Service. The North central division recognized Michael
Hansen for his exemplary commitment to afs by awarding him with the 2007 Meritorious service award. Hansen is a distinguished professor at the university of Wisconsin-stevens point (uWsp) and was nominated by two of his former students, patrick schmalz and Jessica doemel. Hansen serves as faculty adviser for the uWsp student subunit of the american fisheries society. In addition, he is co-editor of the North American Journal of Fisheries Management and has been a member of afs since 1986. In 2004, Hansen was appointed to the Great lakes fishery commission by president bush. a faculty member since 1996, Hansen holds degrees from Michigan state university, cornell university, and uWsp. He received the university scholar award in 2000. He is also an adjunct assistant professor at the university of Michigan, Michigan state university, and uW—Milwaukee. He continues to conduct research on fishery man-agement issues for the Wisconsin department of Natural resources.
—Jessica Mistak
Minnesota chapter president Michael duval accepts the Most active large chapter award from North central division president Joe Hennessy.
Indiana chapter president angie Grier accepts the best communications award from North central division president Joe Hennessy.
Michael Hansen accepts the Meritorious service award from North central division president Joe Hennessy.

84 Fisheries • vol 33 no 2 • february 2008 • www.fisheries.org
New england ChapterHolds winter meeting in Massachusetts
Held at the doyle conservation center in leominster, Massachusetts, on 9 January, the southern New england chapter’s 2008 winter meet-ing attracted 105 attendees, which included 42 students. barry chernoff of Wesleyan university, Middletown, connecticut, gave the keynote pre-sentation “of Jacare, piranhas and candiru: conserving biological diversity and aquatic ecosystems in south america.” chernoff discussed the great biodiversity found in freshwaters of south america and the need to protect and conserve these resources. The problems of species identifica-tion, complexities of fish ecology, and habitat protection needs were noted. Topics of papers presented at
the meeting included the status of marine aquaculture in New england, management of connecticut northern pike fisheries, effect of spatial scale and sampling effort in determin-ing fish diversity, recent trends in the federal aid in sport fishing restoration expenditures, procedures for produc-ing high-quality but low-cost fecundity data, methyl mercury in Massachusetts sunfish, emigration of juvenile alewife, thermostability of pleuronectid lipovi-tellin, environmental effects on squid distribution, projecting mixed-species yield of New england groundfish, and quantifying striped bass predation on connecticut river alosines. six posters (all by students) were also presented: a laboratory study of predator (bluefish)-prey (squid) interactions; bioaccumu-lation of trace heavy metals by blue
mussels; recent innovations and appli-cations of the Target fish community approach; variations in tautog otolith microchemistry; use of reef-ball artificial structures in Mount Hope bay, rhode Island; and effects of feeding ecology and diet history on mercury accumula-tion in temperate flatfishes. abstracts may be found on the chapter’s website: www.snec-fisheries.org.
Two awards were presented at the meeting. rich bell of the university of rhode Island Graduate school of oceanography received the saul b. saila best student paper award for his presentation at the June 2007 chapter meeting on the stock assessment of chambo (Oreochromis sp.) in lake Malawi. don danila was presented the chapter’s special achievement award for his contributions as the recording secretary of the fisheries advisory council to the connecticut department of environmental protection. at the meeting, chapter membership approved a resolution supporting leg-islation in connecticut creating marine and all waters fishing licenses to meet a federal angler registry requirement.
nEwSunitS
Karina Mrakovcich presents rich bell with the saul b. saila best student paper award.
don danila receives the chapter special achievement award from Jason Vokoun.
barry chernoff presents the keynote address at the winter southern New england chapter meeting.
student paper presenters included (left to right) Tobias stover, chiu-Yen Kuo, benjamin Gahagan, Nikki Jacobson, sean lucey, and owen Nichols.
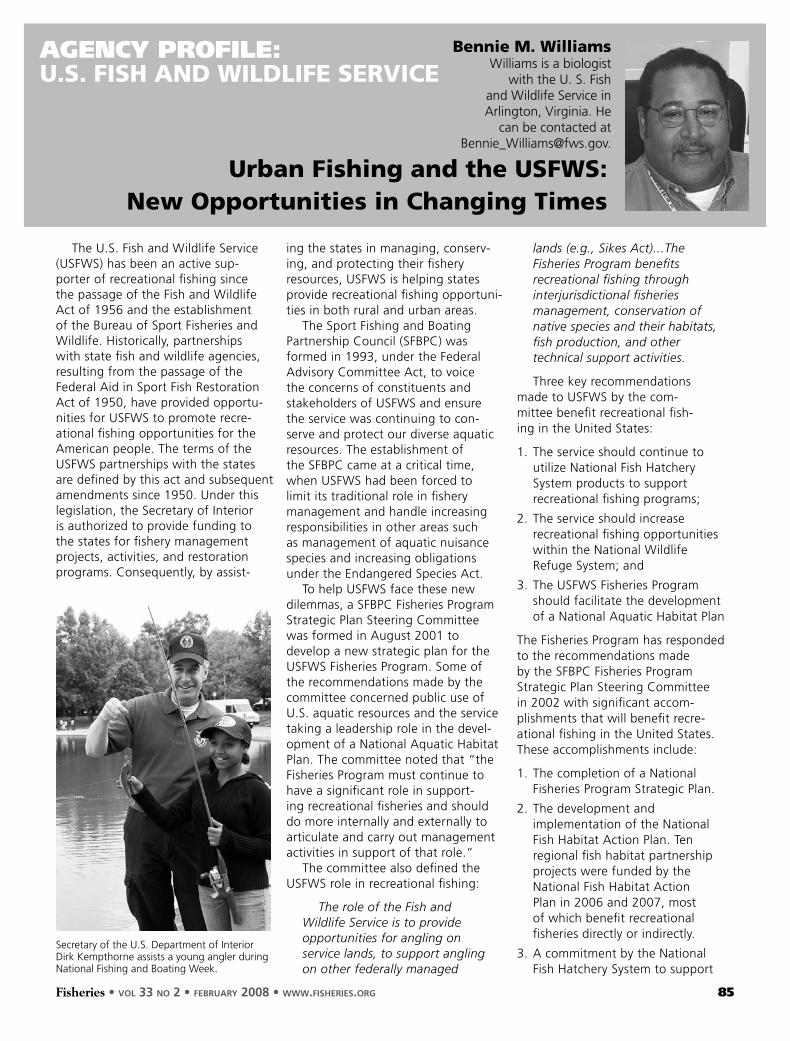
Fisheries • vol 33 no 2 • february 2008 • www.fisheries.org 85
The u.s. fish and Wildlife service (usfWs) has been an active sup-porter of recreational fishing since the passage of the fish and Wildlife act of 1956 and the establishment of the bureau of sport fisheries and Wildlife. Historically, partnerships with state fish and wildlife agencies, resulting from the passage of the federal aid in sport fish restoration act of 1950, have provided opportu-nities for usfWs to promote recre-ational fishing opportunities for the american people. The terms of the usfWs partnerships with the states are defined by this act and subsequent amendments since 1950. under this legislation, the secretary of Interior is authorized to provide funding to the states for fishery management projects, activities, and restoration programs. consequently, by assist-
ing the states in managing, conserv-ing, and protecting their fishery resources, usfWs is helping states provide recreational fishing opportuni-ties in both rural and urban areas.
The sport fishing and boating partnership council (sfbpc) was formed in 1993, under the federal advisory committee act, to voice the concerns of constituents and stakeholders of usfWs and ensure the service was continuing to con-serve and protect our diverse aquatic resources. The establishment of the sfbpc came at a critical time, when usfWs had been forced to limit its traditional role in fishery management and handle increasing responsibilities in other areas such as management of aquatic nuisance species and increasing obligations under the endangered species act.
To help usfWs face these new dilemmas, a sfbpc fisheries program strategic plan steering committee was formed in august 2001 to develop a new strategic plan for the usfWs fisheries program. some of the recommendations made by the committee concerned public use of u.s. aquatic resources and the service taking a leadership role in the devel-opment of a National aquatic Habitat plan. The committee noted that “the fisheries program must continue to have a significant role in support-ing recreational fisheries and should do more internally and externally to articulate and carry out management activities in support of that role.”
The committee also defined the usfWs role in recreational fishing:
The role of the Fish and Wildlife Service is to provide opportunities for angling on service lands, to support angling on other federally managed
lands (e.g., Sikes Act)...The Fisheries Program benefits recreational fishing through interjurisdictional fisheries management, conservation of native species and their habitats, fish production, and other technical support activities.
Three key recommendations made to usfWs by the com-mittee benefit recreational fish-ing in the united states:
1. The service should continue to utilize National fish Hatchery system products to support recreational fishing programs;
2. The service should increase recreational fishing opportunities within the National Wildlife refuge system; and
3. The usfWs fisheries program should facilitate the development of a National aquatic Habitat plan
The fisheries program has responded to the recommendations made by the sfbpc fisheries program strategic plan steering committee in 2002 with significant accom-plishments that will benefit recre-ational fishing in the united states. These accomplishments include:
1. The completion of a National fisheries program strategic plan.
2. The development and implementation of the National fish Habitat action plan. Ten regional fish habitat partnership projects were funded by the National fish Habitat action plan in 2006 and 2007, most of which benefit recreational fisheries directly or indirectly.
3. a commitment by the National fish Hatchery system to support
AgEnCy pROFIlE:u.S. FiSH And WiLdLiFe ServiCe
bennie M. Williams Williams is a biologist
with the u. s. fish and Wildlife service in arlington, Virginia. He
can be contacted at [email protected].
urban Fishing and the uSFWS: new opportunities in Changing times
secretary of the u.s. department of Interior dirk Kempthorne assists a young angler during National fishing and boating Week.

86 Fisheries • vol 33 no 2 • february 2008 • www.fisheries.org
recreational fisheries with hatchery products in restoration, mitigation, and special conservation projects. The National fish Hatchery system produces 41 species in 42 states that are beneficial to recreational fisheries.
4. a commitment by the National Wildlife refuge system to increase recreational fishing opportunities in the system. In 2006, the system completed a refuge system fishing guide, which cites recreational fishing opportunities on 270 National Wildlife refuges.
5. The National fish passage program has significantly impacted the amount of habitat available to native fish species by removing numerous fish passage barriers on u.s. waterways. since its inception in 1999, the fish passage program has worked with over 200 partners, supporting 550 projects, removing or bypassing 442 barriers, and restoring access to over 6,673 miles of river and 54,425 acres of wetlands for fish spawning and growth. The fish passage program is performance and results based, leveraging the program’s investment of $24.4 million with partner contributions, often at a 1:3 ratio.
The increasing importance of urban fishing is a renewed priority. Growing urbanization within the united states has forced the fisheries program to strategically plan for the future, support recreational fishing, and cultivate aquatic resource stewardship in an increasingly urbanized society. This is a difficult task when most u.s. citizens reside in urban areas where recreational fishing opportu-
nities may be limited and many of the aquatic habitats are degraded.
The service realizes the tacti-cal efficiency of supporting urban recreational fishing for the purpose of cultivating and nurturing future stake-holders that will support the fisheries program’s mission of conserving and protecting u.s. aquatic resources in the future. This type of strategy demonstrates usfWs commitment to strategic planning so that it will maintain its leadership role in fish and wildlife resource management.
recent trends in urbanization, population growth, and popula-tion shifts in the united states are severely impacting the health of our nation’s urban, aquatic habi-tats. Many urban, aquatic habitats are becoming degraded because of increasing amounts of impervious surfaces, poor water quality, and the construction of dams or barri-ers on rivers. The u.s. Geological survey supported this trend in 1995 by noting that “80% of the u.s. population lives in urban areas.” The “2006 National survey of fishing, Hunting and Wildlife-associated recreation: state overview” revealed that “fishing continues to be a popular activity for the american people, with 13% of the national population, 16 years or older, engag-ing in fishing in 2006” but there was also a “12% decline in anglers nationwide from 2001 to 2006.”
a decrease in anglers nationwide results in a corresponding decrease in fishing license sales at the state level. decreasing fishing license sales limit the amount of sport fishing restoration funding a state is eli-gible to receive and use for fishery management projects and activities,
sport fishing and boating safety, and aquatic resource education.
In addition to the environmental impacts of urbanization of aquatic habitats, possible social and cultural impacts have been recognized by the service. decreasing fishing license sales at the state level could be a result of an erosion of our traditional angling culture due to recent demo-graphic shifts from rural areas to urban areas. Many urban residents have limited access to aquatic habi-tats that support recreational fisheries and might not participate in angling because of the poor health of these habitats. other potential anglers may not fish because of health advisories which warn anglers that the fish they catch may not be safe for human consumption. The recent declining trend in angling cited by the national fishing and hunting survey may be an indicator of a new social impact of urbanization. This social impact centers around the disconnection of u.s. youth with nature. richard louv, author of Last Child in the Woods, described this disconnection with nature as “nature deficit disorder.”
In addition to urbanization, other factors may be exacerbating the disconnection of the outdoors with u.s. youth. These factors include:
1. unstable education budgets which limit the opportunities for field trips, outdoor play, outdoor sports, and other outdoor activities while at school.
2. The increased amount of time spent indoors by youth on video games, the Internet, and television.
3. Visitation to public lands decreasing by 25% between 1987 and 2003 as cited by the National park service.
AgEnCy pROFIlE:u.S. FiSH And WiLdLiFe ServiCe

Fisheries • vol 33 no 2 • february 2008 • www.fisheries.org 87
4. decreasing support for outdoor-oriented extracurricular programs (e.g., boys and Girls clubs of america, boy scouts, Girl scouts, and 4-H club of america).
The usfWs is now poised to fight a strategic battle on mul-tiple fronts to support urban sport fishing because it realizes the negative consequences if it does not. These fronts will sup-port urban fishing both directly and indirectly. They include:
1. continue to remove fish barriers which obstruct fish passage throughout u.s. waterways through the fish passage program;
2. continue to support, develop, and increase outdoor environmental education initiatives and opportunities through usfWs programs that will help u.s. youth reconnect with nature;
3. continue to work with other federal agencies and non-governmental organizations to develop a national outreach program to reconnect youth with nature;
4. examine future possibilities to fund viable fish habitat restoration projects in urban areas through the National fish Habitat action plan;
5. continue to increase recreational fishing opportunities within the National Wildlife refuge system and other federal lands when feasible;
6. continue to supply National fish Hatchery system products to the states for fishery management, restoration, mitigation, and special conservation projects which benefit recreational fisheries;
7. continue to celebrate National fishing and boating Week nationwide, with events that celebrate the benefits of participating in recreational boating and fishing activities;
8. continue to support the recreational boating and fishing foundation’s national outreach plan; and
9. continue to support and participate in both interior and coastal interjurisdictional fishery management projects and activities.
It is logical to hypothesize that over time, an inherent appre-ciation for the outdoors and the value of u.s. natural resources may continue to diminish simply because of our constituents’ lack of physical exposure or positive personal experiences in healthy outdoor habitats. consequently, the usfWs realizes that by sup-porting urban fishing, it is mak-ing a strategic investment that will pay profitable dividends in the future. In doing so, the service is fulfilling its core mis-sion of: “Working with others to conserve, protect and enhance fish wildlife and plants and their habitats for the continuing ben-efit of the american people.”
To continue its leadership role in the above mission, the usfWs must now develop new ways to cultivate fish and wildlife resource stewardship in a primarily urban constituency with decreased exposure to healthy habitats and youth who are spending less time outdoors. The service knows its ability to slow the rising tide of negative, environmental, cultural, and social impacts associated with urbanization is directly linked to its ability to facilitate the develop-ment of new cooperative partner-ships that will enable the service to strategically invest resources in urban areas, which help cre-ate healthy habitats, healthy fish, healthy economies, and healthy people. This principle is a basic recycling rule, often quoted by the mother of the service’s recently retired assistant director for fisheries and habitat conser-vation, Mamie parker: “With no deposit you get no returns!” au.s. fish and Widlife service director dale Hall.
assistant director of the u.s. fish and Wildlife service, Mamie parker, speaks at dc fishing day during National fishing and boating Week in 2007.
laV
oN
da
Wa
lToN
AgEnCy pROFIlE:u.S. FiSH And WiLdLiFe ServiCe

88 Fisheries • vol 33 no 2 • february 2008 • www.fisheries.org
CAlEndAR:FiSHerieS eventS
to see more event listings go to www.fisheries.org and click click Calendar of events.
to submit upcoming events for inclusion on the aFs web Calendar, please send event name; dates; city, state/province; and
web address or contact information to [email protected]. (if space is available, events may also be printed in Fisheries magazine.)
date eVeNt Name City, state For more iNFormatioN
mar 2-7 2008 ocean sciences meeting orlando, florida http://aslo.org/meetings/orlando20081
mar 5-8 26th annual salmonid restoration Conference lodi, california www.calsalmon.org
mar 13-15 seventh biennial Conference on University education in Natural resources oregon http://uenr.forestry.oregonstate.edu/index.htm
mar 25-29 73rd North american wildlife and Natural resources Conference phoenix, arizona www.wildlifemanagementinstitute.org
mar 30-apr 2 20th Northeast recreation research symposium New York adirondack park, New York www.esf.edu/nerr/
apr 6-13 National shellfisheries association and 37th annual benthic ecology meeting providence, rhode Island www.shellfish.org
apr 14-17 resilience, adaptation, and transformation in turbulent times stockholm, sweden www.resilience2008.org
apr 15-16 Fourth international symposium of Pakistan Fisheries society lahorne, pakistan shawn alam, [email protected]
apr 16-17 NePa: writing the Perfect ea/FoNsi or eis Honolulu, Hawaii www.nwetc.org/pol-302_04-08
apr 27-30 aFs Northeast division annual meeting Marriott seaview, Galloway, New Jersey scott decker, [email protected], 603/271-2491
apr 29-may2 21st annual National NaLms Conference: enhancing the states' Lake management Programs chicago, Illinois www.nalms.org/conferences/2008chicago/brochure.pdf
may 4-8 western division and the oregon Chapter of the aFs annual meeting: Human Population growth and Fisheries—the western Challenge portland, oregon www.wdafs.org
may 12-13 american institute of biological sciences annual meeting 2008: Climate, environment, and infectious disease arlington, Virginia www.aibs.org
may 12-16 river management society meeting portland, Maine www.river-management.org/symposium.asp
may 19-23 international Conference on echohydrological Processes and sustainable Floodplain management: opportunities and Concepts for water Hazard mitigation, and ecological and socioeconomic sustainability lodz, poland www.erce.unesco.lodz.pl
may 19-23 PiCes symposium: effects of Climate Change on the world’s oceans Gijon, spain www.pices.int/meetings/international_symposia/2008/symposia
may 21-24 interactions between social, economic, and ecological objectives of inland Commercial and recreational Fisheries and aquaculture antalya, Turkey www.fao.org/fi/eifac.htm
Jun 1-5 thirteenth international symposium on Fish Nutrition and Feeding florianopolis, sc, brazil www.isfnf2008.com.br
Jun 2-13 diseases of warmwater Fish, ruskin and st. augustine, florida http://conference.ifas.ufl.edu/ame/wwf/index.html

Fisheries • vol 33 no 2 • february 2008 • www.fisheries.org 89
CAlEndAR:FiSHerieS eventS
Jul 7-11 11th international Coral reef symposium
fort lauderdale www.nova.edu/ncri/11icrs
Jul 13-17 Conference for society for Conservation biologists
chattanooga, Tennessee www.utc.edu/academic/conferenceforsocietyofconservationbiologists
Jul 14-18 HydroVision 2008
sacramento, california www.hcipub.com/hydrovision/abstracts.asp, [email protected]
Jul 21-25 Fisheries society of the british isles annual international symposium
cardiff, united Kingdom www.fsbi.org.uk/2008
Jul 22-25 asian wetland symposium 2008
Hanoi, Viet Nam www.aws2008.net
Jul 23-28 american society of ichthyologists and Herpetologists Conference
Montreal, canada www.asih.org/annualmeetings
Jul 25-27 seventh international Conference on recirculating aquaculture
roanoke, Virginia www.cpe.vt.edu/aquaculture/
Terry rakestraw, [email protected]/aquaculture/, 540/231-6805
aug 17-21 american Fisheries society 138th annual meeting
ottawa, ontario, canada www.fisheries.org
aug 25-29 Fourth international symposium on FisH-gis/spatial analysis
rio de Janeiro, brazil www.esl.co.jp/sympo/4th/index.htm
sep 28-oct 2 Pathways to success 2008 Conference: integrating Human dimensions into Fisheries and wildlife management
increasing Human Capacity for global Human-wildlife Coexistence
estes park, co www.warnercnr.colostate.edu/nrt/hdfw/partners.html
oct 11-15 Fourth National Conference on Coastal and estuarine Habitat restoration,
providence, rhode Island www.estuaries.org/?id=4
oct 19-24 international aquarium Congress 2008
shanghai, china http://www.iac2008.cn
oct 20-24 Fifth world Fisheries Congress 2008
pacifico Yokohama, Japan www.5thwfc2008.com, [email protected], +81-3-3219-3541
Nov 10-13 Fifth world recreational Fishing Conference
dania beach, florida www.igfa.org, 954/927-2628.
2 0 0 9
aug 30-sep 3 american Fisheries society 139th annual meeting
Nashville, Tennessee www.fisheries.org,

90 Fisheries • vol 33 no 2 • february 2008 • www.fisheries.org
COlumn:StudentS' AngLe
Michael r. donaldson and Melissa r. Wuellnerdonaldson is a m.sc. candidate in the Fish ecology and Conservation Physiology Laboratory at Carleton University, ottawa, and serves as the co-chair of the student activities subcommittee on the aFs arrangements Committee. He can be contacted at [email protected]. melissa wuellner is a Ph.d. student in wildlife and Fisheries sciences at south dakota state University, brookings, and serves as president of the aFs student subsection of the education section and as a committee member of the student activities subcommittee on the aFs arrangements Committee. she can be contacted at [email protected].
education, networking, and Fun: A preview of student activities at the 2008 AFS Annual Meeting in ottawa
the aFs annual meeting has always been a great opportunity for students to learn, share ideas, develop connections, and most of all, to have fun. education, networking, and fun are the three predomi-nant themes that we wish to highlight for the exciting student activi-ties that are planned for the aFs annual meeting in ottawa, ontario, Canada, 17–21 august 2008. the meeting will provide students with the opportunity to deliver and observe conference presentations, participate in student activities, and best of all, socialize and enjoy the great entertainment that ottawa has to offer. this column aims to highlight these opportunities and to provide a “sneak peek” into the fun and exciting student activities that are planned for aFs ottawa 2008 and to provide information to ensure a smooth travel experience.
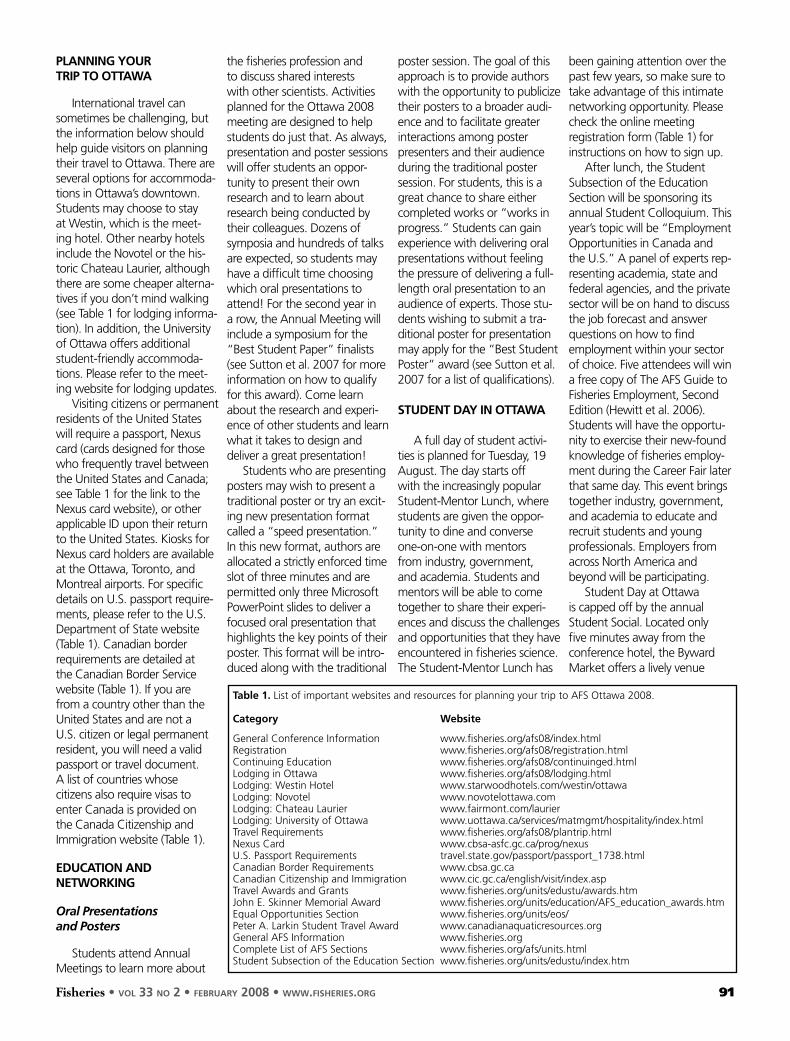
Fisheries • vol 33 no 2 • february 2008 • www.fisheries.org 91
PLaNNiNg yoUr triP to ottawa
International travel can sometimes be challenging, but the information below should help guide visitors on planning their travel to ottawa. There are several options for accommoda-tions in ottawa’s downtown. students may choose to stay at Westin, which is the meet-ing hotel. other nearby hotels include the Novotel or the his-toric chateau laurier, although there are some cheaper alterna-tives if you don’t mind walking (see Table 1 for lodging informa-tion). In addition, the university of ottawa offers additional student-friendly accommoda-tions. please refer to the meet-ing website for lodging updates.
Visiting citizens or permanent residents of the united states will require a passport, Nexus card (cards designed for those who frequently travel between the united states and canada; see Table 1 for the link to the Nexus card website), or other applicable Id upon their return to the united states. Kiosks for Nexus card holders are available at the ottawa, Toronto, and Montreal airports. for specific details on u.s. passport require-ments, please refer to the u.s. department of state website (Table 1). canadian border requirements are detailed at the canadian border service website (Table 1). If you are from a country other than the united states and are not a u.s. citizen or legal permanent resident, you will need a valid passport or travel document. a list of countries whose citizens also require visas to enter canada is provided on the canada citizenship and Immigration website (Table 1).
edUCatioN aNd NetworkiNg
Oral Presentations and Posters
students attend annual Meetings to learn more about
the fisheries profession and to discuss shared interests with other scientists. activities planned for the ottawa 2008 meeting are designed to help students do just that. as always, presentation and poster sessions will offer students an oppor-tunity to present their own research and to learn about research being conducted by their colleagues. dozens of symposia and hundreds of talks are expected, so students may have a difficult time choosing which oral presentations to attend! for the second year in a row, the annual Meeting will include a symposium for the “best student paper” finalists (see sutton et al. 2007 for more information on how to qualify for this award). come learn about the research and experi-ence of other students and learn what it takes to design and deliver a great presentation!
students who are presenting posters may wish to present a traditional poster or try an excit-ing new presentation format called a “speed presentation.” In this new format, authors are allocated a strictly enforced time slot of three minutes and are permitted only three Microsoft powerpoint slides to deliver a focused oral presentation that highlights the key points of their poster. This format will be intro-duced along with the traditional
poster session. The goal of this approach is to provide authors with the opportunity to publicize their posters to a broader audi-ence and to facilitate greater interactions among poster presenters and their audience during the traditional poster session. for students, this is a great chance to share either completed works or “works in progress.” students can gain experience with delivering oral presentations without feeling the pressure of delivering a full-length oral presentation to an audience of experts. Those stu-dents wishing to submit a tra-ditional poster for presentation may apply for the “best student poster” award (see sutton et al. 2007 for a list of qualifications).
stUdeNt day iN ottawa
a full day of student activi-ties is planned for Tuesday, 19 august. The day starts off with the increasingly popular student-Mentor lunch, where students are given the oppor-tunity to dine and converse one-on-one with mentors from industry, government, and academia. students and mentors will be able to come together to share their experi-ences and discuss the challenges and opportunities that they have encountered in fisheries science. The student-Mentor lunch has
been gaining attention over the past few years, so make sure to take advantage of this intimate networking opportunity. please check the online meeting registration form (Table 1) for instructions on how to sign up.
after lunch, the student subsection of the education section will be sponsoring its annual student colloquium. This year’s topic will be “employment opportunities in canada and the u.s.” a panel of experts rep-resenting academia, state and federal agencies, and the private sector will be on hand to discuss the job forecast and answer questions on how to find employment within your sector of choice. five attendees will win a free copy of The afs Guide to fisheries employment, second edition (Hewitt et al. 2006). students will have the opportu-nity to exercise their new-found knowledge of fisheries employ-ment during the career fair later that same day. This event brings together industry, government, and academia to educate and recruit students and young professionals. employers from across North america and beyond will be participating.
student day at ottawa is capped off by the annual student social. located only five minutes away from the conference hotel, the byward Market offers a lively venue
table 1. list of important websites and resources for planning your trip to afs ottawa 2008.
Category website
General conference Information www.fisheries.org/afs08/index.htmlregistration www.fisheries.org/afs08/registration.htmlcontinuing education www.fisheries.org/afs08/continuinged.htmllodging in ottawa www.fisheries.org/afs08/lodging.htmllodging: Westin Hotel www.starwoodhotels.com/westin/ottawalodging: Novotel www.novotelottawa.comlodging: chateau laurier www.fairmont.com/laurierlodging: university of ottawa www.uottawa.ca/services/matmgmt/hospitality/index.htmlTravel requirements www.fisheries.org/afs08/plantrip.htmlNexus card www.cbsa-asfc.gc.ca/prog/nexusu.s. passport requirements travel.state.gov/passport/passport_1738.htmlcanadian border requirements www.cbsa.gc.cacanadian citizenship and Immigration www.cic.gc.ca/english/visit/index.aspTravel awards and Grants www.fisheries.org/units/edustu/awards.htmJohn e. skinner Memorial award www.fisheries.org/units/education/afs_education_awards.htmequal opportunities section www.fisheries.org/units/eos/peter a. larkin student Travel award www.canadianaquaticresources.orgGeneral afs Information www.fisheries.orgcomplete list of afs sections www.fisheries.org/afs/units.htmlstudent subsection of the education section www.fisheries.org/units/edustu/index.htm

92 Fisheries • vol 33 no 2 • february 2008 • www.fisheries.org
for great live music, tasty food, cold beverages (age of major-ity is 19 in ontario), and lively conversation. We have booked an entire nightclub and a fun band to keep things hop-ping. Not only is this event a fun way to catch up with old friends and meet new ones, but academics will be on hand to recruit students for gradu-ate school. as the night draws to a close, students will have the option to peruse (aka “bar hop”) around the other great establishments in the market.
otHer edUCatioNaL aNd NetworkiNg PLatForms
The afs annual Meeting offers countless opportuni-ties for students to learn more about the profession and afs. students may choose to learn new research technol-ogy or refine their skills at one of the continuing education Workshops (see Table 1 under “General conference Information”). opportunities to learn more about and become involved in afs can be found at the many section meetings (see Table 1 under “General afs Information”). and, of course, students are highly encour-aged to attend the student subsection (Table 1) meeting to provide input on how afs can better assist students. Workshops and section meet-ings often recharge students to become better professionals when they return back to their respective campuses at the con-clusion of the annual Meeting.
oPPortUNities For more FUN iN ottawa
The downtown core of ottawa, called the byward Market, is situated between the scenic ottawa river and the historic rideau canal, recently designated as a World Heritage site. The geography of ottawa lends itself to some unique opportunities for students to take advantage of outside of the meeting. With plenty of access to these waterways from downtown by foot, bike, or bus, countless sight-seeing, boat tours and angling opportuni-ties (muskellunge, smallmouth bass) abound. Many fun events are being coordinated by afs, including the always popular “spawning run.” Keep an eye on the meeting web site for details and registration informa-tion for this and other great activities. affordable bike rentals can be conveniently made near the conference hotel, allow-ing students to tour the city of ottawa, cross the ottawa river to explore the city of Hull, and explore the scenic Gatineau park in the province of Québec. ottawa is home to many of canada’s national museums and galleries, most of which are located within walking distance from the conference hotel. renowned for its multicultural-ism, byward Market is home to a melange of exotic restaurants and traditional pubs that offer fantastic food and drink options at student-friendly prices. In fact, since ottawa is home to two universities, much of the down-town area has a distinct student-
friendly atmosphere. for evening socializing, the market has dozens of bustling clubs, pubs, and bars to fit everyone’s tastes.
How CaN i aFFord aLL oF tHis? i’m JUst a Poor stUdeNt….
often students miss out on afs annual Meetings due to higher travel costs and lower student incomes. However, there are numerous ways in which students can offset or entirely cover their expenses. Many sections of afs offer monetary awards for outstand-ing students; a complete list of offerings can be found on the “awards” page of the student subsection website (see Table 1 under “Travel awards and Grants”). The skinner award and the equal opportunities section Travel award are two such sought-after prizes (Table 1). canadian students should consider applying for the peter a. larkin student Travel award from the canadian aquatic resources section (Table 1). students can also work at the annual Meeting for pay. student assistance with a/V-issues and on-site registration is always appreciated and pays up to $10/hour of work--details will be posted on the meet-ing web site soon. students who are looking for persons to share hotel or other travel costs can post their inquiries on the afs student listserv ([email protected]). With all of these possibilities to offset your ottawa meeting
costs, you really can’t afford to miss out on the meeting!
CoNCLUsioN
The afs annual Meeting in ottawa is sure to be an event that students will not want to miss. presentations, student-cen-tered activities, workshops, and meetings will provide students a plethora of educational and networking opportunities. and the amenities of ottawa are great sources for fun! for more information on this excit-ing event, please see the afs ottawa 2008 web site (Table 1) or contact Michael donaldson ([email protected]) or Melissa Wuellner ([email protected]). a
aCkNowLedgmeNts
The authors would like to thank steve chipps (south dakota state university, brookings), steve cooke (carleton university, ottawa), and Tom Kwak (North carolina state university, raleigh) for their comments on early drafts of this piece.
reFereNCes
Hewitt, d. a., w. e. Pine, iii, and a. V. Zale. 2006. The afs guide to fisher-ies employment. american fisheries society, bethesda.
sutton, t. m., d. L. Parrish, and J. r. Jackson. 2007. Time for a change: revision of the process for judging student presentations at the annual Meeting. fisheries 32(1):42-43.
emperor aquatiacs, Inc.
Fisheries • vol 33 no 2 • february 2008 • www.fisheries.org 93
once the muskellunge reached the appropriate size and density, the advanced rearing units were finally removed for fish to occupy the full tank. early and advanced rearing units were constructed from industrial plastic barrels cut in half lengthwise with six windows cut out and covered in specific sized mesh to allow for water circulation. rearing units were kept afloat in the main tanks by attaching strips of styrofoam to the sides.
The muskellunge were fed with pellets from swim-up and converted to live feed one to two weeks prior to stocking at the fall fingerling stage. pellets were presented to the swim-up fry through the use of clock feeders placed on top of floating mounts directly in early and advanced rearing units. To stimulate feeding, one-inch air stones were placed underneath the clocks to create water flow. This put pellets in motion as they dropped into the water column, mimicking the aquatic organisms that muskel-lunge feed on. This was the basis of feeding throughout the early rearing to advanced rearing stages. clock feeders were eventually changed to 12-hour belt feeders when the muskellunge were released into the full rearing tank. aerators, also acting as bio-filters, were placed directly under belt feeders to create water flow. again, this gave the pellets some action as they dropped into the water, stimulating the predatory ambush instincts of the mus-kellunge, as they look for movement in their food. The fry started on a 0.3 mm pellet and eventually moved on to 2.5 mm before they were introduced to live feed.
at the early and advanced rearing stages, densi-ties were kept high to stimulate pellet feeding. This was also meant to increase the mimicking behaviors fish display during the feeding process. This proved to be a very successful method in rearing the muskel-lunge to grow-out stages. as part of the process, strict daily observations were made throughout each stage of the rearing period due to the carnivorous nature and high risks of cannibalism among muskellunge. any fish displaying cannibalistic behavior were removed imme-diately and transferred to tanks designated as “can-nibal tanks” for a second chance at pellet feeding.
When converted to live feed, referred to as the naturalization process, substrate was added to the rear-ing tanks acting as natural cover for the muskellunge to further stimulate predatory instincts. live feed was then added using a ration of three to four minnows per muskellunge per day, size graded to a ratio of four to one (i.e., a four-inch muskellunge can consume a one-inch minnow). outdoor ponds on the fleming campus that support a self-sustaining population of fathead minnows (Pimphales promelas) were used for feeding during the naturalization process. These minnows were harvested as necessary through a variety of netting and trapping methods, mainly seining and clover traps.
after the one to two week naturalization process, the muskellunge were tagged with coded wire tags (cWTs). They were then transported and released the same day or given a recovery period, being held in the facility for another week before stocking. considering
the recreational value of these fish, the cWTs will be treated as a presence or absence mark by use of a metal detector if encountered in the field dur-ing fisheries assessment and management projects.
after a very successful pilot year, producing close to 3,000 fish, and to date stocking approximately 1,600 fall fingerlings averaging 7–10 inches, the ssfc facility will continue in its 5-year venture with all the associated organizations. In the near future, the college will hope-fully incorporate the cool water fish culture practices being developed into the fish and Wildlife Technician and Technologist programs and other aquaculture-based courses. It is anticipated, with continued success, that this hatchery will develop into a research facility with the capabilities of exploring the many aspects of muskellunge and cool water culture and education in canada. a once waning interest in aquaculture is now barely evident at the college, with the newly developing muskellunge hatchery and directly next door, a cold water facility rearing salmon for the lake ontario atlantic salmon restoration program. Interest is very high as fish and wildlife students and many other students that attend ssfc for a variety of programs related to the environment and natural resources line up for involvement, or at least to take a look at the fish.
presently the college facility is nearing the end of its first cycle but is now exploring uncharted ter-ritory, holding 100 pellet-fed fall fingerlings to the yearling stage for release in the spring of 2008. a
Continued from page 58

94 Fisheries • vol 33 no 2 • february 2008 • www.fisheries.org
Howard paul clemens died on 20 November 2007 at the age of 84 in his home in Norman, oklahoma. He was born on 31 May 1923 in arthur, ontario. He earned a b.s. and M.s from the university of Western ontario and received his ph.d. from ohio state university. In 1949, he joined the Zoology department of the university of oklahoma, where he had a long and distin-guished career as a researcher and teacher. His research centered on reproductive physiology in fishes, specifically the characterization of the role of the pituitary gland in spawning. He applied this basic knowledge to management and artificial propagation of commer-cially important fishes, such as the channel catfish. Testing these practical methods, he collabo-rated with federal biologists at the National fish Hatchery, Tishomingo, oklahoma. clemens was one of the first researchers to investigate steroid-induced sex reversal in tilapia, which has developed into an important requisite for com-mercial global tilapia production.
clemens (Howie to his friends) will also be remembered, appreci-ated, and widely identified for his role as a dedicated mentor for many peace corps volunteers in fish culture. His unique tutorial training modality applied to this program directly influenced many developing fish culturists and subsequently a multitude of fish farmers in devel-oping countries around the world. His first peace corps group in 1966 included 12 trainees who subse-quently went to Togo, West africa. He continued to mentor increasing numbers of volunteers through 1982, when the “fish doc” retired from the university, but not from other passions such as begonia and chrysanthemum horticulture and antique clock collection and repair.
The peace corps Training program which he initiated at ou continued for several more years, essentially maintaining the socratic model that he developed, with the last trainee leaving Norman in 1986. over the period from 1966 through 1987, a total of nearly 900 volunteers trained in oklahoma and served in 29 different countries.
clemens was not one to suffer idle time—during the 1960s he developed a catfish farm and oper-ated this in his “spare time” for several years. He was the second president of catfish farmers of america. When the work load of the peace corps training increased in the late 1960s, he set the farm aside to devote his attention to the training program. for many years, he was active as a leader in the boy scouts, where he developed some of his ideas on experiential learning.
clemens was a truly unique individual; his drive and dedi-cation to excel in whatever engaged his evolving interests was inspiring. He will be missed by his colleagues and friends.
—Charles C. Carpenter and William L. Shelton
integrate the goals and objec-tives on the national system;
• Giving additional weight applications within the national system applying for financial and technical assistance through resource conservation and management programs; and
• creating a visual identity and outreach program for the national system to promote recognition of sites within national systems
The final set of recommendations focused on regional approaches to planning and coordination of Mpas. The committee recommended that the primary responsibility for leading regional coordination should be identified early in the process, followed by identification of all stakeholders. once this is completed (using case studies of existing Mpas as an example), the following recom-mendations should be implemented in order to coordinate Mpas regionally:
• accomplish regional coordina-tion using various case studies;
• use the effective coordination char-acteristics found in case studies; and
• use the coordination tools and techniques identified in case studies as being good tem-plates for coordination.
These recommendations comprise the final work of the original Marine protected areas federal advisory committee, which first met in 2003. The next meeting of the Marine protected areas federal advisory committee is scheduled for 21–24 april 2008 in Washington, dc a.
Continued from page 62
ObITuARy:HoWArd CLeMenS
Professor emeritus, university of oklahoma
onset
Fisheries • vol 33 no 2 • february 2008 • www.fisheries.org 95
1-866-460-8979
dataloggers
onset®
Burbot populations are threatened or have been extirpated in many waters in their southern range in North America, and in many states they are a species of special concern. The status of burbot is in question in some European countries, or they have been extirpated in others.
Among other topics, this volume explores differences in mitochrondrial DNA frequencies of burbot in the Pacifi c Northwest, how temperature changes due to regulated discharge from a dam and climatic changes may be affecting burbot abundance, status of burbot in the Great Lakes, and burbot culture.270 pagesList price: $69.00AFS Member price: $48.00Item Number: 540.59PPublished February 2008
TO ORDER:Online: www.fi sheries.org and click on “Bookstore”American Fisheries Societyc/o Books InternationalP.O. Box 605Herndon, VA 20172Phone: 703-661-1570Fax: 703-996-1010

96 Fisheries • vol 33 no 2 • february 2008 • www.fisheries.org
title
Destination Ottawa— A Capital Idea
Ottawa is a city of about 800,000 located on the banks of the Ottawa River at the junction with the Rideau River, between Toronto and Montreal. As Canada’s capital city, Ottawa is home to a wealth of museums, galleries, and other cultural attractions. The city and surrounding countryside also offer a myriad of opportunities to get out and enjoy the natural beauty of the area—hiking, bicycling, canoeing and whitewater rafting. For those just interested in a quiet stroll, the downtown loca-tion of our meeting hotels and the Congress Centre means that you are within easy walking distance of the Parliament Buildings, ByWard Market, Rideau Canal, and the Ottawa River. You’ll want to plan your visit to allow a few days before or after the AFS Annual Meeting to be able to enjoy all that the Ottawa has to offer.
Capital Attractions: Ottawa is blessed with an abundance of interesting sites to visit, many within easy walking dis-tance of meeting hotels, as a result of being the seat of the Canadian govern-ment: the Parliament Buildings, Rideau Hall—home to Canada’s Governor General, the Supreme Court of Canada, the Royal Canadian Mint, and embas-sies from countries around the world.
Museums and Historical Attractions: In addition to the Museum of Civilization, which will be the venue for our Wednesday night social event, Ottawa boasts an array of museums that cover just about every subject you could think of: the Museum of Nature, the Museum of Science and Technology, the Canadian War Museum, the Agriculture Museum, and the Aviation Museum.
Historical attractions: include the Rideau Canal, a UNESCO World Heritage Site, which runs past the Congress Centre and meeting hotels;
the Diefenbunker, a once-secret 100,000 sq. ft. bomb shelter built to protect the Canadian government in the event of a nuclear war, where visitors experi-ence a Cold War time warp; and the Chelsea-Wakefield steam train, where you can enjoy the scenic beauty of the Gatineau Hills on one of Canada’s few remaining operating steam trains.
Cultural Attractions: The National Gallery of Canada and the Canadian Museum of Contemporary Photography are just a short walk from the Congress Centre and meeting hotels. The National
royal canadian Mounted police guard the parliment building.
plan time to relax and rent a bike by the rideau canal; white water raft in the ontario river; or ride a steam train in the Gatineau Hills.

Fisheries • vol 33 no 2 • february 2008 • www.fisheries.org 97
Gallery is the largest visual arts museum in Canada. Although the focus of the collection is on Canadian artists and indigenous artwork, the gallery also holds significant collections by European mas-ters and contemporary American artists.
Outdoor Adventures: Ottawa features one of North America’s most exten-sive networks of recreational paths for cycling, jogging, or walking. Bicycle rent-als are conveniently located by the Rideau Canal, just outside the Congress Centre. Across the Ottawa River on the Quebec
side, Gatineau Park has miles of hiking and mountain bike trails meandering through the Gatineau Hills. For the more adventurous, there are a number of com-panies that offer whitewater rafting trips on the Ottawa River, west of Ottawa.
Dining: If you love good food, Ottawa is for you. From classic French cuisine to casual pub fare, as well as an incredible array of international foods, Ottawa restaurants offer some-thing for every palate and budget.
Festivals and Special Events: No matter what the season, there always seems to be a festival or special event going on in Ottawa and August 2008 will be no exception. On the weekend just before the AFS Annual Meeting begins, you could participate in either the Ottawa Folk Festival or Caribe-Expo, the Ottawa Caribbean carnival. After the AFS meeting you have the opportunity to attend the SuperEX, the annual Central Ontario Exhibition or Greekfest, Ottawa’s annual celebration of Greek food, music, and culture. •
aFs 2008 annual meeting For more information on all that you can see and do
during your visit to Ottawa, check out the Ottawa Tourism website at www.ottawatourism.ca.
explore the parliment building, the National Gallery of canada, and the Museum of civilization.
see the lift locks where rideau Canal. meets the ontario river.
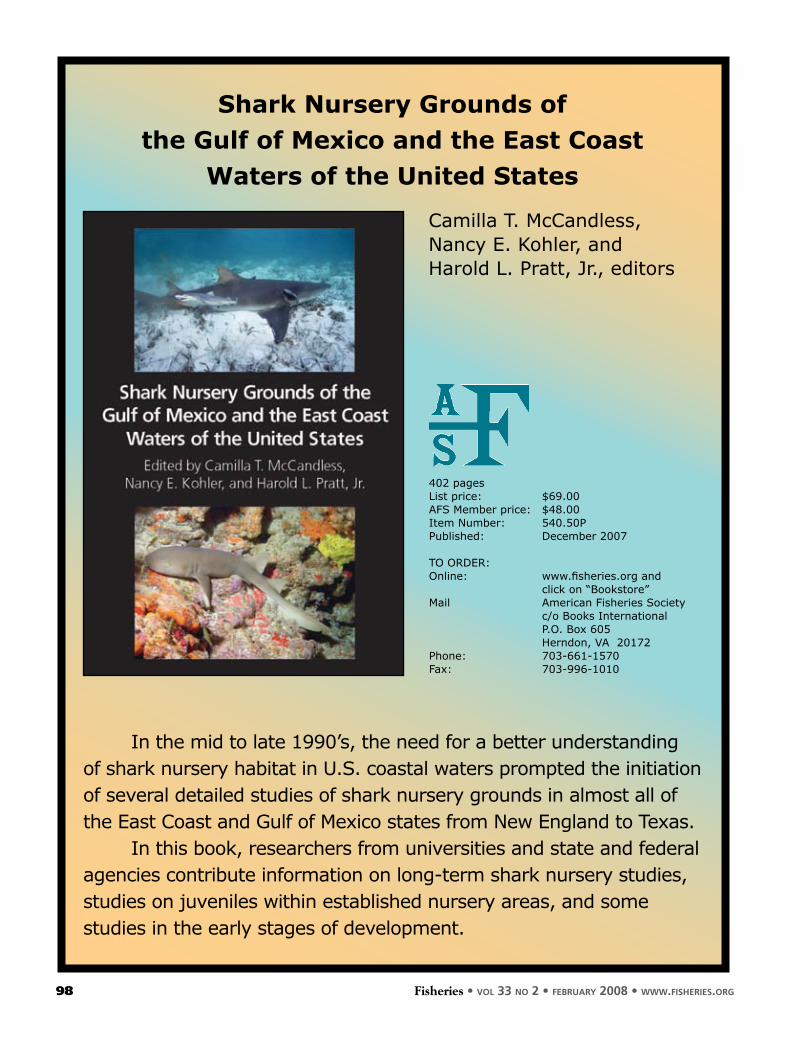
98 Fisheries • vol 33 no 2 • february 2008 • www.fisheries.org
Shark Nursery Grounds of the Gulf of Mexico and the East Coast
Waters of the United States
Camilla T. McCandless, Nancy E. Kohler, and Harold L. Pratt, Jr., editors
In the mid to late 1990’s, the need for a better understanding of shark nursery habitat in U.S. coastal waters prompted the initiation of several detailed studies of shark nursery grounds in almost all of the East Coast and Gulf of Mexico states from New England to Texas. In this book, researchers from universities and state and federal agencies contribute information on long-term shark nursery studies, studies on juveniles within established nursery areas, and some studies in the early stages of development.
402 pagesList price: $69.00AFS Member price: $48.00Item Number: 540.50PPublished: December 2007
TO ORDER:Online: www.fisheries.org and click on “Bookstore” Mail American Fisheries Society c/o Books International P.O. Box 605 Herndon, VA 20172Phone: 703-661-1570Fax: 703-996-1010

National conservation leadership Institute
Fisheries • vol 33 no 2 • february 2008 • www.fisheries.org 99
assistant Professor (tenure-track), (Wildlife and ecological restoration concentration), department of applied biological sciences, arizona state university at the polytechnic campus, school of arts and applied sciences.responsibilities: Teach and conduct research in the fi eld of wildlife biology with specifi c emphasis on habitat management. Teaching responsibilities may include introductory courses in biology and wildlife management. develop undergraduate and graduate course work related to their area of expertise. establish and conduct a vigorous extramurally funded research program. Qualifi cations: required—must at the time of appointment have a ph.d. in wildlife biology or related fi eld with evidence of teaching and research experience. applied research in the fi elds of fi sheries, herpetology, or ornithology, as related to riparian ecology and demonstrated knowledge and
experience in working with management agencies is highly desirable. commitment to providing undergraduate and graduate students and education emphasizing applications of the biological sciences and advancing knowledge in chosen fi elds of study. commitment to teaching through practical experience, including substantial laboratory, and fi eld experience, with the result being extensive hands-on interaction between faculty and students. start date: august 2008.Closing date: 29 february 2008, or weekly thereafter until search closes. Contact: send a cover letter, curriculum vita, names and contact information of three references to Wildlife biologist search committee, department of applied biological sciences, asu polytechnic, 7001 east Williams field road, Mesa, aZ 85212. e-mail applications will not be considered. a background check is required for employment. aa/eoe.
Ph.d. assistantship, purdue university, West lafayette, Indiana. responsibilities: conduct research related to themes in lab, including, but not limited to, evaluating/modeling stream ecosystem responses to landscape change, evaluating stream conservation success, elucidating mechanisms underlying the displacement of native aquatic species by introduced aquatic nuisance species, and evaluating the ecology and life history of native freshwater mussels. Qualifi cations: M.s. degree, Gpa >3.3, and upper 50th percentile Gre scores. extensive fi eld, laboratory, and writing skills necessary. Closing date: 1 March 2008. Contact: send a letter or e-mail of intent, including statement of research/career interests, resume, names/addresses of 3 references, Gre scores, and transcripts to reuben Goforth, department of forestry and Natural resources, 195 Marstellar street, purdue university, West lafayette, IN 47907; 765-494-0009; [email protected]. see www.fnr.purdue.edu/faculty/goforth/index.shtml. ea/eo/aaep.
Professor of aquatic ecology (tenure-track), department of Wildlife and fisheries sciences, south dakota state university, brookings.responsibilities: Teach, advise, research, and fulfi ll
AnnOunCEmEnTS:Job Center
to see more job listings go to www.fi sheries.organd click Job Postings.
emPLoyers: to list a job opening on the aFs online Job Center submit a position description, job title, agency/company, city, state, responsibilities, qualifi cations, salary, closing date, and contact information (maximum 150 words) to jobs@fi sheries.org. online job announcements will be billed at $350 for 150 word increments. Please send billing information. Listings are free (150 words or less) for organizations with associate, offi cial, and sustaining memberships, and for individual members, who are faculty members, hiring graduate assistants. if space is available, jobs may also be printed in Fisheries magazine, free of additional charge.
www.conservationleadership.org
Become part of the extraordinary!
Fellowship applications accepted through May 31, 2008.
NationalConservation
LeadershipInstitute

100 Fisheries • vol 33 no 2 • february 2008 • www.fisheries.org
service responsibilities. contribute to an applied research program but also obtain competitive funding to address basic ecological questions.Qualifications: completed ph.d. in aquatic ecology or closely related area by application deadline. strong research background in stream ecology, with an emphasis in conservation biology of fishes and/or landscape ecology. participation in institutional governance/service, professional service, and outreach activities. demonstrated record of research and scholarly activity. appropriate oral, written, and interpersonal communications skills. salary: commensurate with experience.Closing date: 7 March 2008.Contact: for further information see http://wfs.sdstate.edu/. To apply see http://Yourfuture.sdbor.edu, search for the position, and follow the electronic application process. for questions on the electronic employment process, contact sdsu Human resources at 605/688-4128. aa/eeo employer.
Fishery biologist, Gulf of Mexico fishery Management council, Tampa, florida.responsibilities: assists in preparation, review, and coordination of fishery management documents. responsible plan amendment development, analysis, review, and monitoring. presents analyses to various groups. compiles and analyzes biological and other data. Qualifications: b.s. with major study in biology, fishery science, or related studies and at least seven years of experience or a M.s. and at least three years experience. professional experience is desirable in the preparation of technical publications. preference will be given for knowledge of population dynamics, technical writing, Gulf fisheries, and the Magnuson-stevens act.salary: $63,417-75,414 year, negotiable. Closing date: 7 March 2008.Contact: send a complete resume, references, and writing examples related to the subjects enumerated above to Wayne swingle, Gulf of Mexico fishery Management council, 2203 North lois avenue, suite 1100, Tampa, florida 33607.
seasonal Fisheries technician, university of Wyoming, based out of landerg.
responsibilities: assist on a project studying abundance and diversity of burbot population in lakes and reservoirs. field methods will include trammel netting, habitat assessment, and data collection.
Qualifications: a student who is pursuing or has completed a degree in fisheries or biological field. a desire to work with unique native fish, willingness to work in adverse weather, experience with boat operation and trailering a necessity, and ability to carry 50 lbs. of equipment. a valid driver’s license and clean driving record.
salary: $10.50 per hour, plus free housing.
Closing date: 12 March 2007.
end date: May 11–18, 2008.
Contact: send or e-mail a cover letter, resume with 3 professional references, and contact information to Matt abrahamse, Wyoming cooperative research unit, dept. 3166 1000 e. university ave.biological science, room 419, laramie, Wyoming 82071; 509-209-4047; [email protected].
Post-doctoral researcher—Fish ecologist/ecological modeler, ohio state university’s aquatic ecology laboratory.
responsibilities: develop and apply models to help understand how hypoxia affects coastal food webs/fisheries, and use modeling and field data to compare ecological responses to hypoxia in chesapeake bay, the northern Gulf of Mexico, and lake erie.
Qualifications: ph.d. in ecology, fisheries science, or related field, and strong quantitative and written skills. Modeling experience is highly desired.
salary: $37,500-$42,000 per year for 2 years of support.
Closing date: 15 March 2008.
Contact: apply at the university’s career website, www.jobsatosu.com/, job posting #335591—post doctoral researcher. In addition to the osu employment application, submit a cover letter, cV (resume), college transcripts, and names/contact information 3 references to stuart ludsin, [email protected], the aquatic ecology laboratory, room 232 research center, 1314 Kinnear road, columbus, ohio 43212.
m.s. graduate assistantship in Fish ecology, central Michigan university, Mount pleasant.

rutgers university
Memorial university of Newfoundland
Fisheries • vol 33 no 2 • february 2008 • www.fisheries.org 101
responsibilities: Investigate native fish egg deposition patterns in northern lake Michigan. duties will include field sampling, laboratory analysis, and writing final reports. start date: July 2008.Qualifications: bachelor's degree in biology, ecology, fisheries or natural resources. preferred Gpa > 3.2, combined Gre >1200. for department requirements see www.bio.cmich.edu/grad_app_admiss.htm. salary: full stipend $16800 annually and tuition waiver for two years.Closing date: March 24 or until filled. Contact: Tracy Galarowicz, department of biology, central Michigan university, 217 brooks Hall, Mt. pleasant, Michigan 48859; [email protected]; www.cst.cmich.edu/users/galar1tl/. submit a cover letter outlining experience and interests, c.V., transcripts, Gre
scores, and contact information for three references. applications review starts 28 february 2008.
Postdoctoral research associate—aquaculture and Fisheries genomics, North carolina state university, raleigh. responsibilities: utilize ~500 microsatellite dNa markers and dNa samples from performance-tested reference families to create the first genetic linkage map for the striped bass and its relatives. Qualifications: ph.d. degree in biology, zoology, fisheries science, aquaculture, genetics, biochemistry, or related biological discipline with research experience and publication in molecular biology or genomic science. prior laboratory experience with microsatellite dNa marker development and genotyping is highly desirable.
FACULTY POSITION IN MARINE SCIENCE (AQUACULTURE)
The Ocean Sciences Centre (OSC; www.osc.mun.ca) of Memorial University is building on its strengths in marine science, and invites applications for a tenure-track or tenured faculty position to be appointed at assistant, associate, or full professor. The successful candidate will possess a Ph.D. and post-doctoral or equivalent experience, and be expected to develop an internationally competitive research program in fish or invertebrate biology. Further, they will be expected to conduct research with applications to marine aquaculture, to take a lead role in research at the OSC’s Dr. Joe Brown Aquatic Research Building, to contribute to teaching in marine aquaculture, and to liaise with government agencies and the developing aquaculture industry.
To apply, send an application (including a statement of research/teaching interests, a CV, and the names of 3 referees) by March 31, 2008, to: Dr. Ian Fleming, Director, Ocean Sciences Centre, Memorial University of Newfoundland, St. John's, NL, Canada, A1C 5S7 (e-mail [email protected], phone 709-737-2767). Memorial University is committed to employment equity and encourages applications from qualified women and men, visible minorities, aboriginal people, and persons with disabilities. Canadian citizens, permanent residents, candidates eligible for NSERC Faculty Awards, and foreign nationals are all encouraged to apply. However, Canadian citizens and permanent residents will be given priority. Please quote the position number VPA-OSC-2006-002 in your application.
ASSISTANT PROFESSOR IN FISHERIES OCEANOGRAPHY
The School of Environmental and Biological Sciences, New JerseyAgricultural Experiment Station, and the Department of Marine and CoastalSciences at Rutgers University are seeking a Fisheries Oceanographer tojoin an existing faculty of forty spanning biological, chemical, geological andphysical oceanography. This is a state-funded, tenure-track position in theDepartment of Marine and Coastal Sciences and carries full faculty benefits.Salary level will be commensurate with experience.
The Fisheries Oceanographer shall have a Ph.D. and a proven record ofresearch and leadership in fisheries science, and experience with advancedtechnologies such as active and passive acoustics, molecular populationgenetics, ecosystem/population dynamics modeling, otolith biogeochemistry,or gear technology. Preference will be given to applicants whose researchcrosses traditional disciplinary lines and who look forward to interactingbroadly with existing faculty, collaborating with an emerging cluster offisheries scientists, and with the fishing industry, as well as federal and statepartners. The successful applicant will be expected to establish a strong,externally funded research and extension program designed to engage local,state, regional and national communities in areas relevant to those interestsfrom varied sources such as NSF, NOAA, foundations and corporations.He/she will be expected to advise graduate students and to advise and assistthe fishing industry in scientific components of the management system.The successful applicant is expected to make full use of Rutgers' coastal fieldstations.A list of current IMCS research groups and projects can be foundat http://marine.rutgers.edu.Applications will be accepted until January 31,2008 or until a suitable candidate is found.
To apply, please submit an electronic copy of curriculum vitae, a statementof research interests, and the names of three references to:
Dr. Ken Able, Chair, Fisheries Oceanography Search CommitteeRutgers University Marine Field Station
800 c/o 132 Great Bay Blvd • Tuckerton, New Jersey 08087E-mail: [email protected]
Rutgers is an Affirmative Action/Equal Opportunity Employer.Employment verification is required.

102 Fisheries • vol 33 no 2 • february 2008 • www.fisheries.org
salary: range $32,000–38,000 plus benefits. package including health insurance. Closing date: 1 May 2008. Contact: submit a cV, publication list, statement of research interests, and the names of 3 references with contact information to craig V. sullivan, department of Zoology, 127 david clark laboratories, North carolina state university, box 7617, raleigh, North carolina 27695; 919/515-7186; [email protected].
Postdoctoral research assistantship—aquaculture and Fisheries genomics, North carolina state university, raleigh.responsibilities: utilize ~500 microsatellite dNa markers and dNa samples from performance-tested reference families to create the first genetic linkage map for the striped bass and its relatives.
Qualifications: bachelor's degree in biology, zoology, fisheries science, aquaculture, genetics, biochemistry, or related biological discipline with training appropriate for entry into the ph.d. program, www.cals.ncsu.edu/zoology/graduate.html. prior research experience in molecular biology, genetics, or genomic science is preferred.
salary: stipend of $24,000 per year plus tuition, health insurance and research support.
Closing date: 1 May 2008. Interested applicants should submit a brief resume, statement of research interests and goals, informal transcripts and Gre scores, and the names of 3 references with contact information.
Contact: craig V. sullivan, department of Zoology, 127 david clark laboratories, North carolina state university, box 7617, raleigh, Nc 27695 (919-515-7186; [email protected].
2008 membership Application
american fisheries society • 5410 Grosvenor lane • suite 110 • bethesda, Md 20814-2199301/897-8616 x203 or 218 • fax 301/897-8096 • www.fisheries.org
Name Please provide (for afs use only) employer address phone Industry fax academia e-mail federal gov't. city state/province recruited by an afs member? yes__ no__ state/provincial gov't. Zip/postal code country Name other membersHiP tyPe (includes print Fisheries and online Membership directory) North america/dues other duesdeveloping countries I (includes online Fisheries only) N/a $ 5 developing countries II N/a $25 regular $76 $88 student (includes online journals) $19 $22 Young professional (year graduated) $38 $44 retired (regular members upon retirement at age 65 or older) $38 $44 life (Fisheries and 1 journal) $1,737 $1,737 life (Fisheries only, 2 installments, payable over 2 years) $1,200 $1,200 life (Fisheries only, 2 installments, payable over 1 year) $1,000 $1,000 JoUrNaL sUbsCriPtioNs (optional) North america otherJournal name Print Online Print OnlineTransactions of the American Fisheries Society $43 $25 $48 $25 North American Journal of Fisheries Management $43 $25 $48 $25 North American Journal of Aquaculture $38 $25 $41 $25 Journal of Aquatic Animal Health $38 $25 $41 $25 Fisheries Infobase $25 $25 PaymeNt please make checks payable to american fisheries society in u.s. currency drawn on a u.s. bank or pay by VIsa or Mastercard. check p.o. number Visa Mastercard account # exp. date signature
all memberships are for a calendar year. New member applications received January 1 through august 31 are processed for full membership that calendar year (back issues are sent). Those received september 1 or later are processed for full membership beginning January 1 of the following year.
Fisheries, Vol. 33 No. 2, feb 2008
Paid:
advanced Telemetry systems, Inc.
Fisheries • vol 33 no 2 • february 2008 • www.fisheries.org 103

104 Fisheries • vol 33 no 2 • february 2008 • www.fisheries.org
396 pagesList price: $69.00AFS member price: $48.00Item number: 540.60PPublished: December 2007
TO ORDER
Online: www.fisheries.org and click on “Bookstore” Mail: American Fisheries Society c/o Books International P.O. Box 605 Herndon, VA 20172Phone: 703/661-1570Fax: 703/996-1010
Red snapper is among the most ecologically and economically important reef fishes in the northern Gulf of Mexico.
Fisheries management for the species also happens to be among the most controversial in the U.S. Gulf red snapper has been estimated to be overfished and undergoing overfishing since at least the late 1980s. Few other species or assemblages have had as many financial resources contributed to improve knowledge of basic population biology, engineer solutions to management issues such as shrimp trawl bycatch, develop state-of-the-art assessment techniques, and implement novel management approaches as has Gulf red snapper. This volume provides the state of knowledge for research on red snapper ecology and fisheries.