fitzpatricks report
TRANSCRIPT

FITZPATRICKS REPORT
fitzpatricks.com.au
18TH EDITIONFINANCIAL YEAR 2018


Inside
Property at a glance ............................................2
Population, affordability and finance ........3
Residential market
Houses ....................................................................4-5
Units ..........................................................................6-7
Land ...............................................................................8
Residential investment .......................................9
Commercial and industrial ...................10-11
Wagga Wagga lifestyle ...................................12
Financial Year 2018the fitzpatricks report
Definition: The median is the “middle number” (in a sorted list of numbers). Half the numbers in the list will be less, and half the numbers will be greater. The mean is the average of a set of data.
© fitzpatricks.com.au 01

the fitzpatricks reportfinancial year 2018
at a glancePROPERTY
The Directors hope you enjoy reading the 2018 Fitzpatricks Report, our 18th edition. We produce the Report each year to:
• provide you with the latest market data
• provide the professional real estate staff at Fitzpatricks Real Estate with accurate information to pass on to our clients
• to highlight growth, predict trends and to provide sound information for real estate investors
2017/18 saw an 8.8% increase in the volume of house sales, bouncing back from the slight drop of the year before. Investors continued to strongly support the residential sector of this market. There has been a large growth in the volume of unit sales, with a 19% increase. This follows on from a comparable decrease the year before.
For the last financial year, Wagga’s median unit price was $274,000 and the median house price was $354,500. The median unit and house prices in Wagga compare favourably with Sydney’s median unit and house prices for the June quarter of $737,080 and $1,144,217. The median house price increase in Wagga of 4.26% reveals the underlying strength of regional properties, compared to 4.5% decrease of the median house price in Sydney. It is very likely this outcome could be repeated in the coming year.
There has been a large decrease in the number of vacant land sales in Wagga. The volume decrease of 20.2% is a drop of 62 lots. Coupled with the 343 residential building approvals for new houses, the supply/demand ratio is clearly out of balance.
There are constraints restricting the supply side of land and it is important Council addresses these matters or Wagga will witness serious upward pressure on price and its housing affordability. Land sales in Lloyd and particularly the northern estates of Boorooma and Gobbagombalin continue to be strong.
Residential vacancy factors continue to be low, a trend we have witnessed for many years now. Fitzpatricks Real Estate’s vacancy rate averaged 2.28%. Minor fluctuations occurred to rental values, however, should sales to investors tighten up, it is likely rental values will increase. Wagga’s houses and units at $328 and $240 per week, highlight the city’s affordability when compared to Sydney City’s medians of $810 and $650 per week (June 2018 quarter).
Building approvals rose by 66 new homes, an increase of 23.8%. This is an encouraging sign for the economy and growth of Wagga, driven to a large extent by the year on year estimated population growth of 2,550 people. Wagga’s current estimated population of 66,635 is expected to grow at a rate of 1.18% per annum, now predicted to reach 80,984 by 2036.
Commercial sale numbers were virtually identical to last year. Once again, retail and leasing has been strong during the year and current enquiry levels indicate this is likely to continue. Industrial land sales have increased which is a good sign for commercial development within the city.
Large public investment and infrastructure projects are under way and new projects are being announced, suggesting a strong economic boost to the city’s economy over the next few years.
Property at a glance
02

Population
• Wagga Wagga’s community has an estimated resident population of 66,635.5
• The population is expected to increase to 80,984 by 2036, at an average annual growth rate of 1.18% per annum.5
• There are 23,564 occupied private dwellings in Wagga Wagga.6
• The average household size of Wagga Wagga residents is 2.49.6
• Persons aged 35-49 years of age represent 18.2% of the population.6
Finance• The Reserve Bank of Australia left the official cash rate
unchanged at 1.5% within the last financial year. 1
• The inflation rate as of June 2018 was 2.1%, an increase of 0.2% from June 2017.12
Affordability
Wagga Wagga continues to provide very affordable housing options.
• The average mortgage repayment in Wagga Wagga equates to 25.85% of the average household income, compared to an average of 30.84% across New South Wales.1
• For the June 2018 quarter, Wagga Wagga’s unemployment rate was 6.05%. Regional NSW was at 5.61% while the New South Wales unemployment rate was 4.9%. In comparison, Greater Sydney was 4.47% and Australia 5.4%.7
66,635
25.85%
2.49
6.05%
35-49
1.5%
1.18%
2.1%
Estimated Wagga resident population
Of household income spent on mortgages in Wagga
Average household size
Unemployment rate compared to NSW at 4.9%
Represent 18.2% of the population
Cash rate
Population growth projection on average per annum
Inflation rate
and financePOPULATION
fitzpatricks.com.au 03©
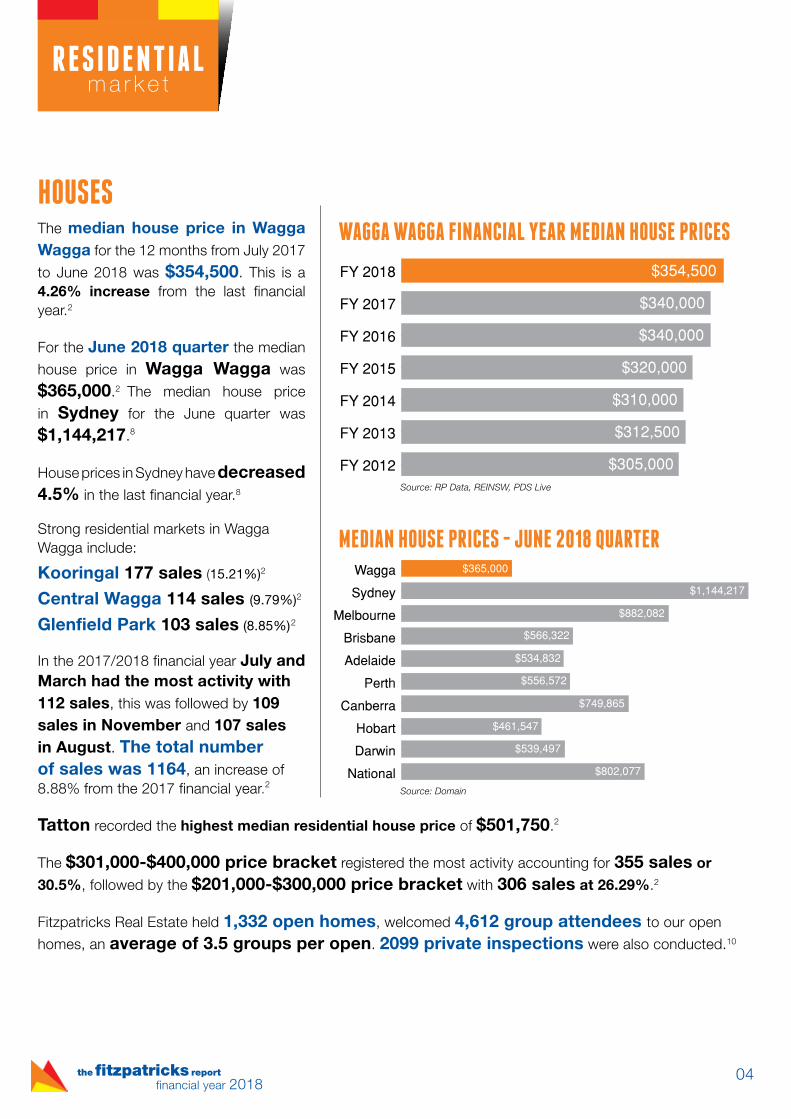
The median house price in Wagga Wagga for the 12 months from July 2017
to June 2018 was $354,500. This is a 4.26% increase from the last financial year.2
For the June 2018 quarter the median
house price in Wagga Wagga was
$365,000.2 The median house price
in Sydney for the June quarter was
$1,144,217.8
House prices in Sydney have decreased 4.5% in the last financial year.8
Strong residential markets in Wagga Wagga include:
Kooringal 177 sales (15.21%)2
Central Wagga 114 sales (9.79%)2
Glenfield Park 103 sales (8.85%)2
In the 2017/2018 financial year July and March had the most activity with 112 sales, this was followed by 109 sales in November and 107 sales in August. The total number of sales was 1164, an increase of 8.88% from the 2017 financial year.2
Tatton recorded the highest median residential house price of $501,750.2
The $301,000-$400,000 price bracket registered the most activity accounting for 355 sales or
30.5%, followed by the $201,000-$300,000 price bracket with 306 sales at 26.29%.2
Fitzpatricks Real Estate held 1,332 open homes, welcomed 4,612 group attendees to our open
homes, an average of 3.5 groups per open. 2099 private inspections were also conducted.10
HOUSES
m a r k e tRESIDENTIAL
the fitzpatricks reportfinancial year 2018
WAGGA WAGGA FINANCIAL YEAR MEDIAN HOUSE PRICES
MEDIAN HOUSE PRICES - JUNE 2018 QUARTER
National
Darwin
Hobart
Canberra
Perth
Adelaide
Brisbane
Melbourne
Sydney
Wagga $365,000
$1,144,217
$882,082
$566,322
$534,832
$556,572
$749,865
$461,547
$539,497
$802,077
FY 2012
FY 2013
FY 2014
FY 2015
FY 2016
FY 2017
FY 2018 $354,500
$340,000
$340,000
$320,000
$310,000
$312,500
$305,000Source: RP Data, REINSW, PDS Live
Source: Domain
04

TURVEY PARKmedian house price
$360,000total number of sales
86fitzpatricks sales
24.42%
CENTRALmedian house price
$419,500total number of sales
114fitzpatricks sales
18.42%
KOORINGALmedian house price
$317,000total number of sales
177fitzpatricks sales
22.6%
TATTONmedian house price
$501,750total number of sales
48fitzpatricks sales
31.25%
BOURKELANDSmedian house price
$430,000total number of sales
55fitzpatricks sales
27.27%
LLOYDmedian house price
$425,000total number of sales
35fitzpatricks sales
22.86%
BOOROOMAmedian house price
$440,000total number of sales
37fitzpatricks sales
35.14%
ESTELLAmedian house price
$370,000total number of sales
39fitzpatricks sales
15.38%
GOBBAGOMBALINmedian house price
$424,500total number of sales
50fitzpatricks sales
14%
LAKE ALBERTmedian house price
$359,300total number of sales
98fitzpatricks sales
19.39%
ASHMONTmedian house price
$217,000total number of sales
63fitzpatricks sales
11.11%
GLENFIELD PARKmedian house price
$330,000total number of sales
103fitzpatricks sales
25.24%
TOLLANDmedian house price
$272,500total number of sales
60fitzpatricks sales
28.33%
MOUNT AUSTINmedian house price
$240,000total number of sales
81fitzpatricks sales
23.46%
fitzpatricks.com.au 05©

The median unit price in Wagga Wagga for the 12 months from July
2017 to June 2018 was $274,000. This is an increase of 1.49% from last financial year.2
For the June 2018 quarter the median
unit price in Wagga Wagga was
$253,000.2 The median unit price in Sydney for the June 2018 quarter was
$737,080.8
Unit prices in Sydney have decreased 3.5% in the last financial year.8
There was a total of 192 unit sales in Wagga Wagga for the last financial year. This is up from the previous years 161 sales, an increase of 19.25%.2
The strongest suburb for sales was
Central Wagga with 64 sales, 33.33% of all unit sales.2
The highest unit sale was $674,000 for a 2 bedroom, 2 bathroom unit in Central Wagga Wagga.2
The price bracket of $201,000 - $300,000 registered the most activity
with 70 sales, being 36.46% of the market.2
There were 7 multi unit blocks sold in the last financial year, the highest being a 6 unit complex in Kooringal
for $760,000.2
With the Staunton Park development now underway as well as other new developments, we expect to see some growth in the Central Wagga median.
UNITS
the fitzpatricks reportfinancial year 2018
m a r k e tRESIDENTIAL
WAGGA WAGGA FINANCIAL YEAR MEDIAN UNIT PRICES
MEDIAN UNIT PRICES - JUNE 2018 QUARTER
National
Darwin
Hobart
Canberra
Perth
Adelaide
Brisbane
Melbourne
Sydney
Wagga $253,000
$737,080
$496,021
$379,186
$312,992
$379,038
$415,414
$370,085
$326,126
$554,504
FY 2012
FY 2013
FY 2014
FY 2015
FY 2016
FY 2017
FY 2018 $274,000
$270,000
$270,000
$250,000
$223,000
$232,500
$252,000Source: RP Data, REINSW
Source: Domain
06
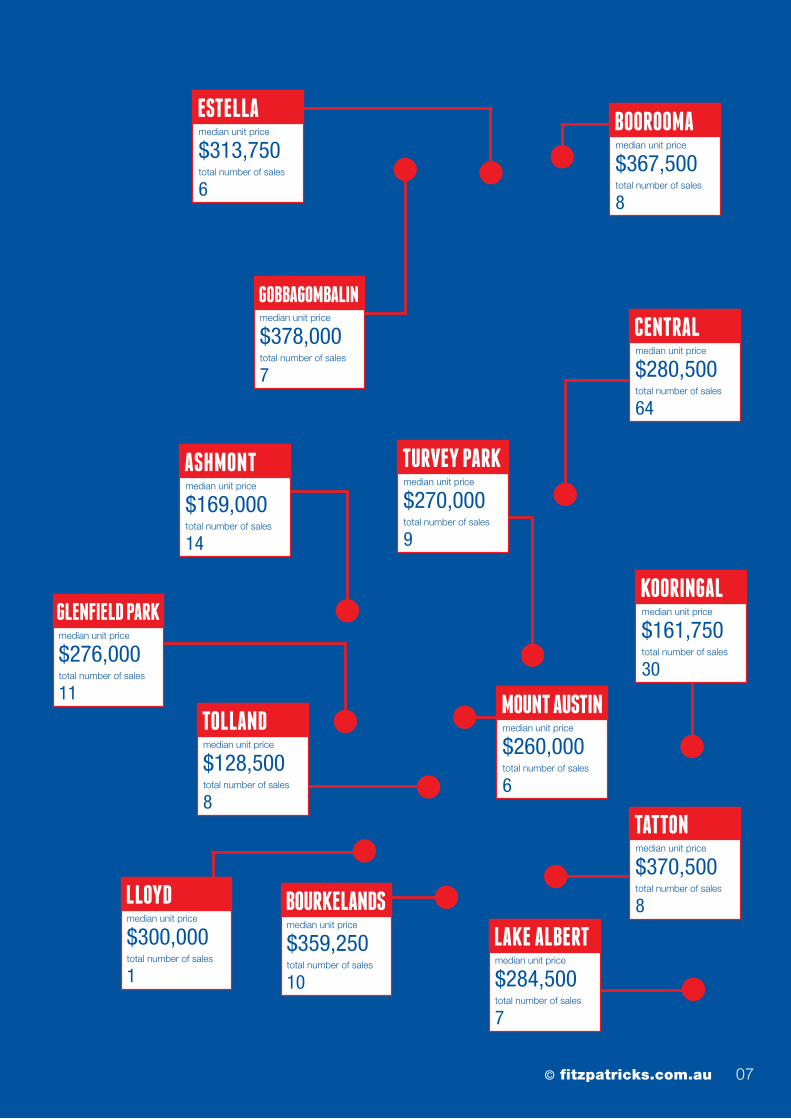
TURVEY PARKmedian unit price
$270,000total number of sales
9
CENTRALmedian unit price
$280,500total number of sales
64
KOORINGALmedian unit price
$161,750total number of sales
30
TATTONmedian unit price
$370,500total number of sales
8BOURKELANDSmedian unit price
$359,250total number of sales
10
LLOYDmedian unit price
$300,000total number of sales
1
BOOROOMAmedian unit price
$367,500total number of sales
8
ESTELLAmedian unit price
$313,750total number of sales
6
GOBBAGOMBALINmedian unit price
$378,000total number of sales
7
LAKE ALBERTmedian unit price
$284,500total number of sales
7
ASHMONTmedian unit price
$169,000total number of sales
14
GLENFIELD PARKmedian unit price
$276,000total number of sales
11
TOLLANDmedian unit price
$128,500total number of sales
8
MOUNT AUSTINmedian unit price
$260,000total number of sales
6
fitzpatricks.com.au 07©

245 residential blocks were sold in Wagga Wagga in 2017-18 financial year, a decrease of 20.2%.2
The median land price was
$145,000 which is an increase of 7.4%2. We expect the median to continue to rise gradually.
In the Wagga Wagga LGA, there were
343 residential building approvals for new houses in the financial year 2017-18.11
The highest land sale was in
Central for $1,000,000 with a land size of 1012 square metres.2 This was a redevelopment site.
The month of September registered the most activity, with
37 land sales.2
Springvale registered the highest median land price of $300,000.2
Most popular suburbs for land sales in Wagga Wagga include:
Boorooma 74 sales (30.2%)2
Lloyd 59 sales (24.08%)2
Gobbagombalin (Estella Rise) 47 sales (19.18%)2
The land supply of 2017/2018 has not met demand. Bourkelands is now sold out. Lloyd has experienced a strong uptake in both of it’s estates over the last 12 months, whilst the northern suburbs continue to provide the bulk of the land sold.There are a number of constraints on the release of subdivisional land at the moment, if not corrected soon, this will cause under supply, which will put upwards pressure on price and Wagga’s comparable affordability.Lifestyle allotments continue to sell at a premium, as supply has dwindled.
FIRST HOME OWNER GRANTSThe total number of Grants paid in the 2017/18 financial year was 41,648 totalling of $583,311,261.
In Wagga Wagga 534 grants were paid totalling $5,028,834.3
LAND
m a r k e tRESIDENTIAL
the fitzpatricks reportfinancial year 2018
WAGGA WAGGA FINANCIAL YEAR MEDIAN LAND PRICES
NUMBER OF LAND SALES IN WAGGA
FY 2012
FY 2013
FY 2014
FY 2015
FY 2016
FY 2017
FY 2018 245
307
325
273
181
216
122
FY 2012
FY 2013
FY 2014
FY 2015
FY 2016
FY 2017
FY 2018 $145,000
$135,000
$132,500
$125,000
$125,000
$125,000
$122,500Source: RP Data
Source: RP Data
08
fitzpatricks.com.au 07
i n v e s t m e n tRESIDENTIAL
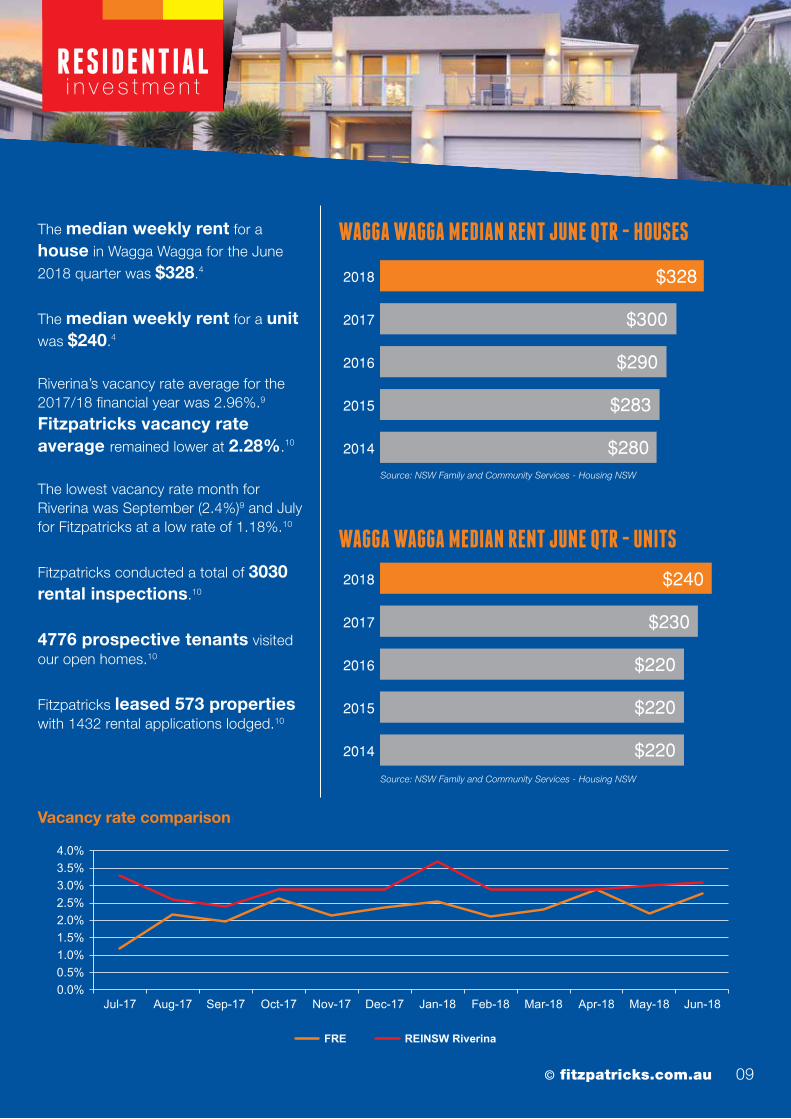
RESIDENTIAL RENTALSThe median weekly rent for a
house in Wagga Wagga for the June
2018 quarter was $328.4
The median weekly rent for a unit was $240.4
Riverina’s vacancy rate average for the 2017/18 financial year was 2.96%.9
Fitzpatricks vacancy rate average remained lower at 2.28%.10
The lowest vacancy rate month for Riverina was September (2.4%)9 and July for Fitzpatricks at a low rate of 1.18%.10
Fitzpatricks conducted a total of 3030 rental inspections.10
4776 prospective tenants visited our open homes.10
Fitzpatricks leased 573 properties with 1432 rental applications lodged.10
0.0%0.5%1.0%1.5%2.0%2.5%3.0%3.5%4.0%
Jul-17 Aug-17 Sep-17 Oct-17 Nov-17 Dec-17 Jan-18 Feb-18 Mar-18 Apr-18 May-18 Jun-18
FRE REINSW Riverina
©
Vacancy rate comparison
fitzpatricks.com.au 09
WAGGA WAGGA MEDIAN RENT JUNE QTR - HOUSES
WAGGA WAGGA MEDIAN RENT JUNE QTR - UNITS
FY 2014
FY 2015
FY 2016
FY 2017
FY 2018 $240
$230
$220
$220
$220
FY 2014
FY 2015
FY 2016
FY 2017
FY 2018 $328
$300
$290
$283
$280Source: NSW Family and Community Services - Housing NSW
Source: NSW Family and Community Services - Housing NSW
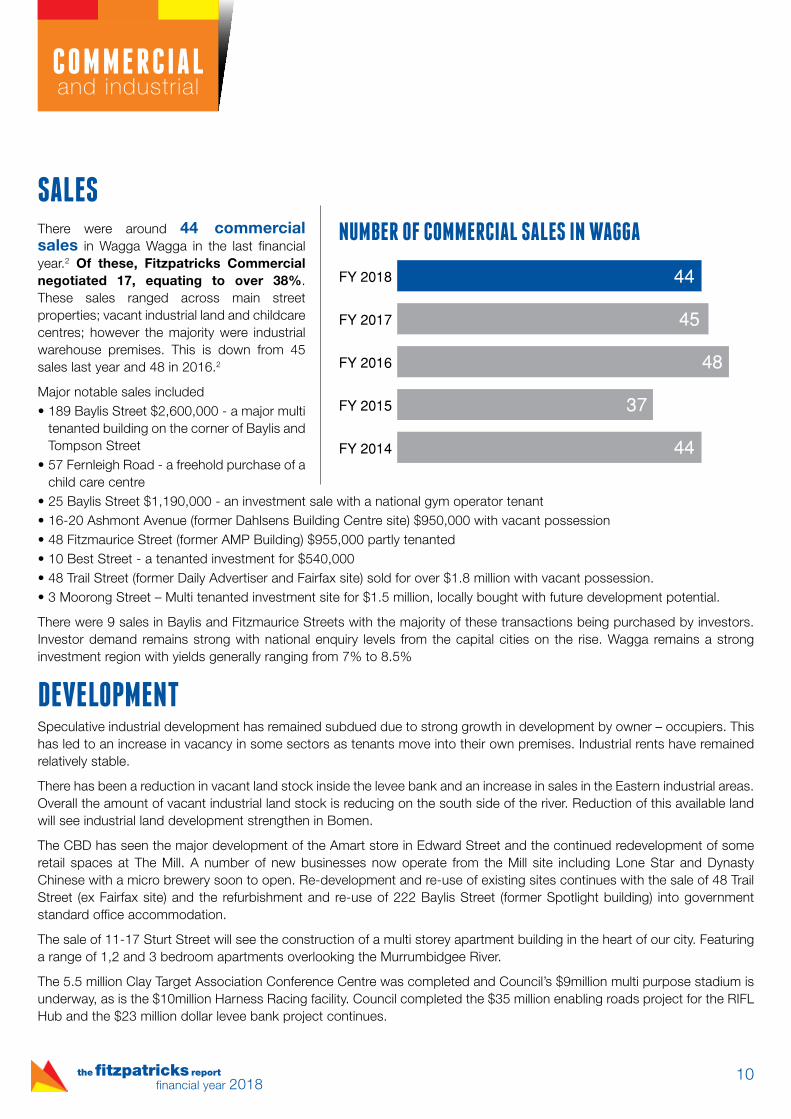
There were around 44 commercial sales in Wagga Wagga in the last financial year.2 Of these, Fitzpatricks Commercial negotiated 17, equating to over 38%. These sales ranged across main street properties; vacant industrial land and childcare centres; however the majority were industrial warehouse premises. This is down from 45 sales last year and 48 in 2016.2
Major notable sales included• 189 Baylis Street $2,600,000 - a major multi
tenanted building on the corner of Baylis and Tompson Street
• 57 Fernleigh Road - a freehold purchase of a child care centre
• 25 Baylis Street $1,190,000 - an investment sale with a national gym operator tenant• 16-20 Ashmont Avenue (former Dahlsens Building Centre site) $950,000 with vacant possession• 48 Fitzmaurice Street (former AMP Building) $955,000 partly tenanted• 10 Best Street - a tenanted investment for $540,000• 48 Trail Street (former Daily Advertiser and Fairfax site) sold for over $1.8 million with vacant possession.• 3 Moorong Street – Multi tenanted investment site for $1.5 million, locally bought with future development potential.
There were 9 sales in Baylis and Fitzmaurice Streets with the majority of these transactions being purchased by investors. Investor demand remains strong with national enquiry levels from the capital cities on the rise. Wagga remains a strong investment region with yields generally ranging from 7% to 8.5%
DEVELOPMENTSpeculative industrial development has remained subdued due to strong growth in development by owner – occupiers. This has led to an increase in vacancy in some sectors as tenants move into their own premises. Industrial rents have remained relatively stable.
There has been a reduction in vacant land stock inside the levee bank and an increase in sales in the Eastern industrial areas. Overall the amount of vacant industrial land stock is reducing on the south side of the river. Reduction of this available land will see industrial land development strengthen in Bomen.
The CBD has seen the major development of the Amart store in Edward Street and the continued redevelopment of some retail spaces at The Mill. A number of new businesses now operate from the Mill site including Lone Star and Dynasty Chinese with a micro brewery soon to open. Re-development and re-use of existing sites continues with the sale of 48 Trail Street (ex Fairfax site) and the refurbishment and re-use of 222 Baylis Street (former Spotlight building) into government standard office accommodation.
The sale of 11-17 Sturt Street will see the construction of a multi storey apartment building in the heart of our city. Featuring a range of 1,2 and 3 bedroom apartments overlooking the Murrumbidgee River.
The 5.5 million Clay Target Association Conference Centre was completed and Council’s $9million multi purpose stadium is underway, as is the $10million Harness Racing facility. Council completed the $35 million enabling roads project for the RIFL Hub and the $23 million dollar levee bank project continues.
SALES
COMMERCIALand industrial
+29.72% from 2015
the fitzpatricks reportfinancial year 2018
NUMBER OF COMMERCIAL SALES IN WAGGA
FY 2014
FY 2015
FY 2016
FY 2017
FY 2018 44
45
48
37
44
10

Fitzpatricks PCI Commercial leased over 150 properties. This is up from
last years’ 98.10
Our team sold 17 commercial properties representing approximately
38% of the total commercial sales in Wagga Wagga in the last financial
year.2
LEASINGDuring the financial year Fitzpatricks leased over 150 commercial properties. These included a large number of storage sheds which came on line. Once again, office, community services and small to medium industrial leasing are the submarkets experiencing the most activity. Retail leasing within the CBD remains challenging, with vacancies persisting in the Northern and Southern blocks. The central two blocks with the Sturt Mall and Marketplace currently have 2 and 3 shop vacancies respectively and the retail market remains fluid with a number of vacancies also remaining within the malls. Leases were negotiated by our office at:
• 49 Best Street to Marymead (office / community service)
• 158 Baylis Street to Ishka (retail)
• 200 Baylis Street to Calvary care (health)
• 179 Baylis Street to Oticon (service/health)
• 2/19 Peter Street to Murrumbidgee Health (large office/health)
• 64 Baylis Street to NSW Parliament (office/service)
• 8 Baylis Street to Job Centre (community service)
• 3/91 Copland Street to Heatcraft (medium industrial)
• 2/209 Baylis Street to Australian Electoral Commission (government service)
• 2 Baylis Street to Greek on Baylis (Food)
• 14 Dobney Avenue to Riverina Mowerworld (industrial retail)
• 116 Fitzmaurice Street to Albury Wodonga Community College (Education/service)
• 70 Chaston Street to Fast Lane coffee shop (food)
• 209 Edward Street to The Drug Detection Agency (community service)
Whilst some sectors experience some structure issues (such as retail) the city continues to perform well compared to other large regional centres.
A strong attraction for industry, services and retail for the City is the demographic that approximately 50% of the community is aged under 35 years, which coupled with strong regional influence, makes the local market relatively secure compared to other centres.
IN THE LAST FINANCIAL YEAR
COMMERCIALand industrial
©
Fitzpatricks 38%
Other agencies and private sales
COMMERCIAL SALES IN WAGGA LAST FINANCIAL YEAR
fitzpatricks.com.au 11
38%

• Over 1.3 million people visit Wagga Wagga each year.
• There are 220,000 annual passengers with over 140 regular weekly passenger transport flights (Sydney and Melbourne).
• In 2017, overnight visitors increased by 36% to 1.476 million visitor nights.
• Overnight visitors to Wagga Wagga spend approximately $355 per day and stay an average of three nights.
• On average over 860,000 day visitors come to Wagga Wagga spending approximately $168 per day trip.
• Wagga Wagga hosts over 650 sporting, cultural, business and music events each year.
The city has: • 100+ medical specialists• 1401 midwifery, nursing and medical practitioners• 93 playgrounds• 110 developed parks• 65 sporting facilities• 13 community centres• 34 club and meeting facilities• 68 educational facilities including 2 tertiary, 9 high schools, 23 primary schools and 34 pre-schools
• Wagga Wagga has a total labour force of over 32,000 people with 65% of employees having a certificate level qualification or higher.
• 64% of residents in Wagga Wagga work full time with over 80% of the workforce performing 25 hours or more of paid work per week.
• There are 5525 registered businesses in Wagga Wagga with public administration and safety being the largest industry.
• Wagga Wagga is the largest retail, commercial, administrative and population centre in the Riverina region and provides a wide range of services and infrastructure, servicing a retail catchment area of approximately 190,000 people. The city has a strong retail sector, representing a significant component of the economy with nine shopping districts employing over 3700 people.
This data was sourced from the Wagga Wagga CIty Council Economic Snapshot 2018
VISITORS, EVENTS, WORKFORCE, BUSINESS & INDUSTRY
l i festy leWAGGA WAGGA
the fitzpatricks reportfinancial year 2018
12

Fitzpatricks Real Estate believes the information contained within this publication is accurate and reliable. However, no warranty of accuracy is given and no responsibility is accepted by Fitzpatricks Real Estate.
Opinions and editorial comment should not be relied upon to make financial decisions. We are not financial advisors and you should conduct your own research to ascertain financial suitability before purchasing or selling.
Information used in this publication was collected from the Reserve Bank of Australia, RP Data, Office of State Revenue, NSW Family and Community Services, Forecast id, Profile id, Economy id, Domain and Fitzpatricks Real Estate.
This publication is produced annually by Fitzpatricks Real Estate Marketing Department.
A subscription service is available. Any enquiries regarding this publication should be directed to:
Fitzpatricks Real Estate 138 Baylis StreetWagga Wagga NSW 2650
Ph: 02 6921 1555Email: [email protected]: fitzpatricks.com.au
Sources:1 The Reserve Bank of Australia2 RP Data3 Revenue NSW4 NSW Family and Community Services - Housing NSW5 Forecast.id6 Profile.id7 Economy.id8 Domain9 REINSW10 Fitzpatricks Real Estate11 Australian Bureau of Statistics12 Trading Economics
© fitzpatricks.com.au 13
138 Baylis Street Wagga Wagga NSW 2650
Ph: 02 6921 1555
find us on
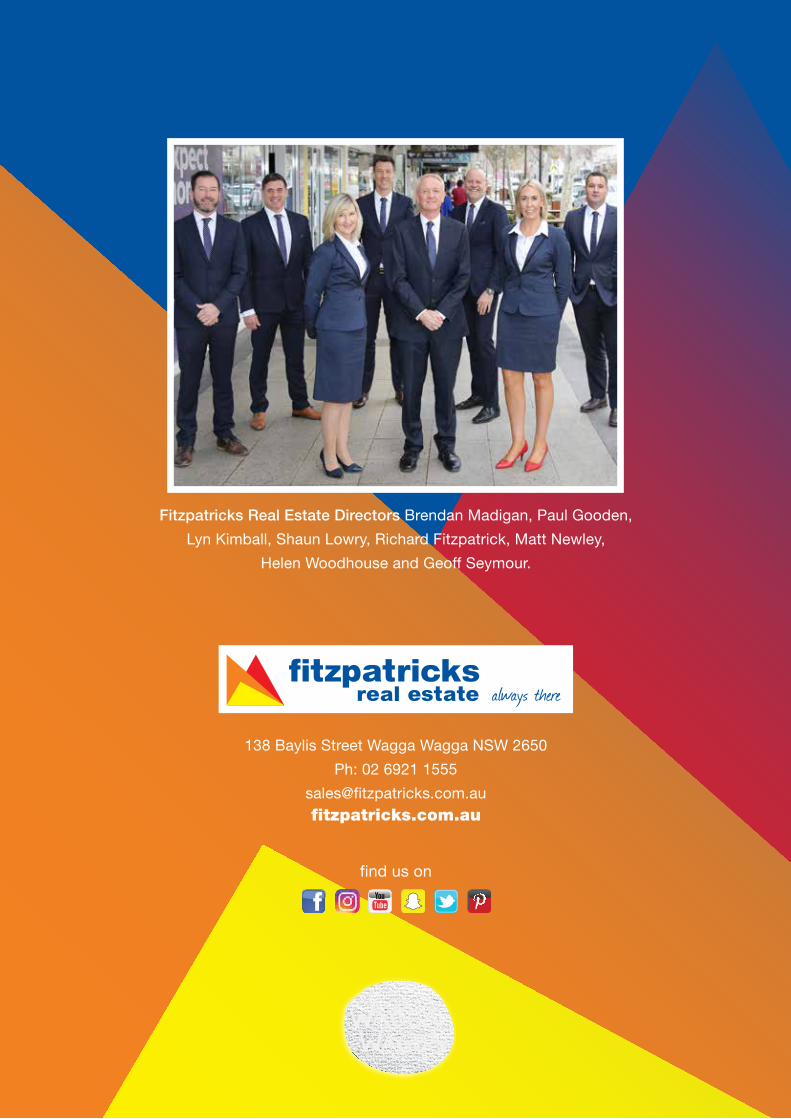
Fitzpatricks Real Estate Directors Brendan Madigan, Paul Gooden,
Lyn Kimball, Shaun Lowry, Richard Fitzpatrick, Matt Newley,
Helen Woodhouse and Geoff Seymour.
fitzpatricks.com.au