five year financial · pdf fileoprfhs page 2 five year financial projections background and...
TRANSCRIPT

OPRFHS Page 1
Oak Park and River Forest High School
District 200
“Those Things That Are Best”
Five Year Financial Projections
Educational Fund
Operations and Maintenance Fund
Transportation Fund
Municipal Retirement/Social Security Fund
Life Safety Fund
Capital Projects Fund
Working Cash Fund Tort Fund
September 2012

OPRFHS Page 2
Five Year Financial Projections
Background and Overview The District maintains a financial projection model based on various assumptions
concerning future revenue and expenditure expectations. These assumptions are based on
historical data, analysis of legislative changes, future enrollment trends and required
staffing levels, estimated Consumer Price Index (CPI) increases, estimated future
property values, and Board of Education approved goals and objectives.
Actual data from previous years and future projections are incorporated into the model
after reported to and approved by the Board of Education. The model currently includes
updated information for the FY 2011 actual results, the FY 2012 Amended Budget, the
FY 2013 Original Budget, the Ehlers December 2011 Demographic Trends and
Enrollment Projections, the 2011 final levy, the 2012 proposed levy, and the September
2012 budgeted staffing levels.
During FY 2008, the District began to manage its own cash and investments. As a part of
the process to withdraw from the authority of the Cicero Township Treasurer‟s Office,
the District established separate bank accounts and contracted with PMA Financial
Network, Inc. (PMA) for investment advice and cash flow analysis. PMA also provides
services related to long-term projections. In the fall of 2009, the District converted
historical data and future projections from the District projection model to the PMA
projection model. The District has continued to use the PMA projection model software
since that time.
The Board of Education commissioned a Finance Advisory Committee (FAC) to review
the present budgeting and long range planning processes, and to recommend to the Board
a cost containment methodology and process. In the fall of 2011, the Finance Advisory
Leadership Team reviewed the long range projection model and made several
recommendations to the Superintendent. Those recommendations included:
Reducing the health insurance trend from 10% to 7%
Incorporation of the Ehler‟s demographics projections
Annual cost containment parameters
Calculation of expenditures per pupil as a measurement due to projected increased
enrollments.
All of these recommendations have been incorporated into the September 2012
projections.
Some line items vary between this current plan and the September 2011 Five Year
Financial Projections. The District reached a two year agreement with the Faculty
Senate resulting in significant savings compared to the September 2011 projections and
the District also reached an agreement with the Village of Oak Park concerning the
Downtown TIF. The results of these two events are included in the projections and offer
a favorable result compared to the September 2011 projections. At the present level of
spending and programing, the District will begin to experience annual deficit spending in
the Education Fund in FY 2018. Deficit spending will accelerate through FY 2023.

OPRFHS Page 3
Although annual expenditures in the Education Fund are expected to exceed CPI, the
expenditures per pupil are planned to be below the anticipated increase in CPI. This is an
important measure as student enrollment increases.
New Illinois Program Accounting Manual (IPAM) changes have been implemented and
the Capital Projects Fund has been added to the projection model beginning in FY 2011.
Annual transfers from the O & M Fund to the Capital Projects Fund will provide monies
for construction projects.
Revenue The most complex and most critical area of the OPRF Five Year Financial Projections is
the estimate of property tax revenue. Property taxes are the District‟s largest revenue
source (82.95% for FY 2013), and the calculation process is quite cumbersome.
Variables that must be analyzed include Equalized Assessed Valuation (EAV), new
property additions, and CPI. Additionally, because the District‟s fiscal year ends on June
30, each fiscal year represents the collection of one installment from each of two tax levy
years. The Property Tax Extension Limitation Law (PTELL or “tax cap”) limits the
annual increase to the lesser of 5% or CPI. Due to the structural imbalance in Illinois
public education funding, and the limited access to new property EAV value in Oak Park
and River Forest due to multiple TIF Districts, it is necessary for the District to
eventually request a referendum, as the majority of costs related to public education
exceed CPI.
The total Equalized Assessed Value of property in Oak Park and River Forest for the
2011 levy was 15.1% less than the 2010 levy. This phenomenon caused the actual levy
rate to increase from 2.53 per $100 of EAV to 3.05. However, the total levy dollar
amount only increased by 1.9%. This is due to the PTELL limit in the increase in the
total levy dollar amount to the lesser of CPI or 5%.
The 2005 levy reflected the final year of the phase-in option for the 2002 referendum.
The Board of Education approved a partial phase-in of $4.5 million dollars,
approximately ½ the amount permitted by the rate increase factor law, increasing the total
extension of capped funds to approximately $50 million dollars.
Although, the property tax is a fairly consistent tax, the District experiences unanticipated
fluctuations in property tax collections due to reassessments and uncollected amounts.
Therefore, the District estimates property tax collection at 97%.
The Village of Oak Park contains several Tax Increment Finance (TIF) districts. There
are three TIF districts in Oak Park. The River Forest Town Center TIF district expired
effective December 31, 2010. TIF districts divert property taxes to village-controlled
funds for the purposes of economic development. Over time, incremental EAV has
accumulated in the all of these TIF districts. OPRFHS has been able to secure
agreements for distribution of funds in two of the districts. These revenue streams for
surplus distributions have been added to the projection model in the appropriate years.
The River Forest TIF expired in tax levy year 2010, and the Oak Park Downtown TIF

OPRFHS Page 4
will expire in tax levy year 2019. The large increase in EAV for the 2010 levy was due
to the expiration of the River Forest TIF.
The District is currently estimating taxes per fund by calculating the total maximum
allowed under the cap. The model estimates the maximum allowable rate for the Life
Safety and Working Cash funds and then estimates Tort obligations, IMRF obligations, O
& M obligations, and Transportation obligations. The Decennial Life Safety obligations
will be completed in summer 2013 and thereafter the levy will be reduced to the amount
due for debt service only. The amount required for each of these funds is compared to
the maximum levy rate, and the maximum amount or required amount - whichever is
lower - is established as the levy amount. The remainder is levied in the Education Fund.
The following is a table of the maximum allowable rate per fund.
Levy Description Maximum Rate
Educational 3.50
Operations & Maintenance .55
Transportation As needed
Special Education .40
Life Safety .10
Working Cash .05
Tort As needed
IMRF As needed
EAV is projected to increase at the historical trend of 9% at the triennium reassessments,
followed by a decrease of 1%, and then an increase of 1%. CPI is 1.5% for the 2011
levy and 3.0% for 2012. Following is an historical analysis of actual CPI and EAV and
the future estimates incorporated into the five-year projections.

OPRFHS Page 5
Levy
Year CPI EAV
%
Increase
1995 2.20% $ 807,929,036 0.55% Actual
1996 2.50% $ 882,475,609 9.23% Actual
1997 3.30% $ 876,602,437 -0.67% Actual
1998 1.70% $ 888,191,638 1.32% Actual
1999 1.60% $ 1,014,461,583 14.22% Actual
2000 2.70% $ 997,025,802 -1.72% Actual
2001 3.00% $ 1,049,586,419 5.27% Actual
2002 2.50% $ 1,513,988,694 44.25% Actual
2003 2.40% $ 1,507,098,940 -0.46% Actual
2004 1.90% $ 1,551,572,998 2.95% Actual
2005 3.30% $ 1,970,385,120 26.99% Actual
2006 3.40% $ 1,953,712,946 -0.85% Actual
2007 2.50% $ 2,053,605,186 5.11% Actual
2008 4.10% $ 2,337,528,355 13.83% Actual
2009 0.10% $ 2,485,435,195 6.33% Actual
2010 2.70% $ 2,554,919,343 2.80% Actual
2011 1.50% $ 2,170,008,263 -15.07% Actual
2012 3.00% $ 2,149,808,180 -0.93% Projected
2013 2.00% $ 2,172,806,262 1.07% Projected
2014 2.00% $ 2,369,858,826 9.07% Projected
2015 2.00% $ 2,347,660,238 -0.94% Projected
2016 2.00% $ 2,372,636,840 1.06% Projected
Additional information regarding EAV and other levy assumptions is presented on pages
29 and 30.
The District‟s State revenues are comprised of both restricted and unrestricted grants.
State revenue is approximately 5.0% of the total revenue received by the District.
General State Aid (GSA) is a function of the State‟s total education appropriation
(Foundation Level), the District‟s Average Daily Attendance (ADA), and EAV.
Enrollment projections are used to estimate general state aid based on projected per pupil
Foundation Level less “available local resources.” The remaining state aid is primarily
special education categorical reimbursements. Historically, the largest component of
state aid has been general state aid. OPRFHS is an Alternate Grant district.
Historically, the District has received a small amount of federal aid, the majority of which
is special education reimbursement through Medicaid and IDEA. For FY 2013, Federal
Sources will be 2.4% of total revenue compared to 2.2% in FY 2012. Because of the
political uncertainty of funding from Springfield and Washington D.C., state and federal
aid is difficult to project beyond the current year. The District assumes the status quo in
funding unless there is information to the contrary.
OPRFHS Page 6
Corporate Personal Property Replacement Tax (CPPRT) revenue is generated based on
the taxpayer‟s profitability. This tax is very vulnerable to economic downturns and,
therefore, fluctuates greatly from year to year. The District recognizes CPPRT revenue
in the O & M, Capital Projects and IMRF funds. Due to the recent economic downturn,
the District reduced the CPPRT revenue 25% for FY 2010 and 2011. For FY 2012 and
2013 we assume the status quo.
Interest income for FY 2013 has been estimated at a total of 0.25%, as advised by PMA.
Future interest rates are estimated at 0.25% through FY 2018. The District investments
are fully collateralized and/or FDIC insured as required by Illinois School Code. In
addition, the District closely monitors the investments to ensure compliance with the
District Investment Policy.
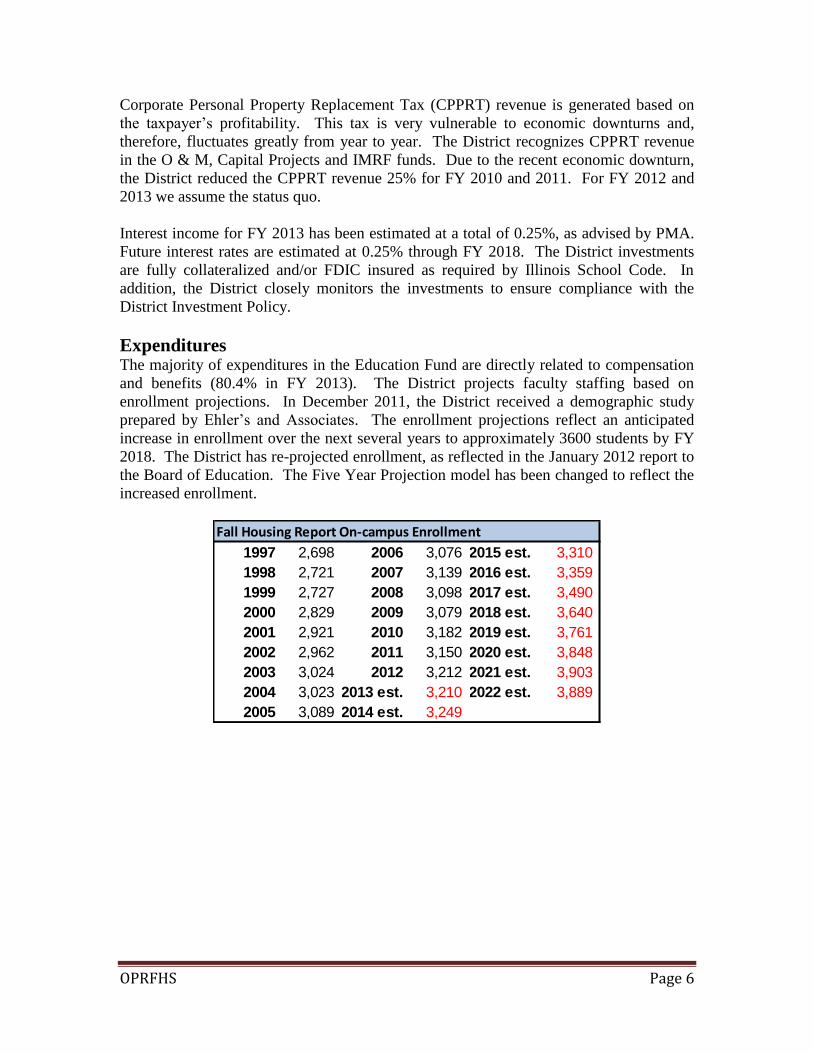
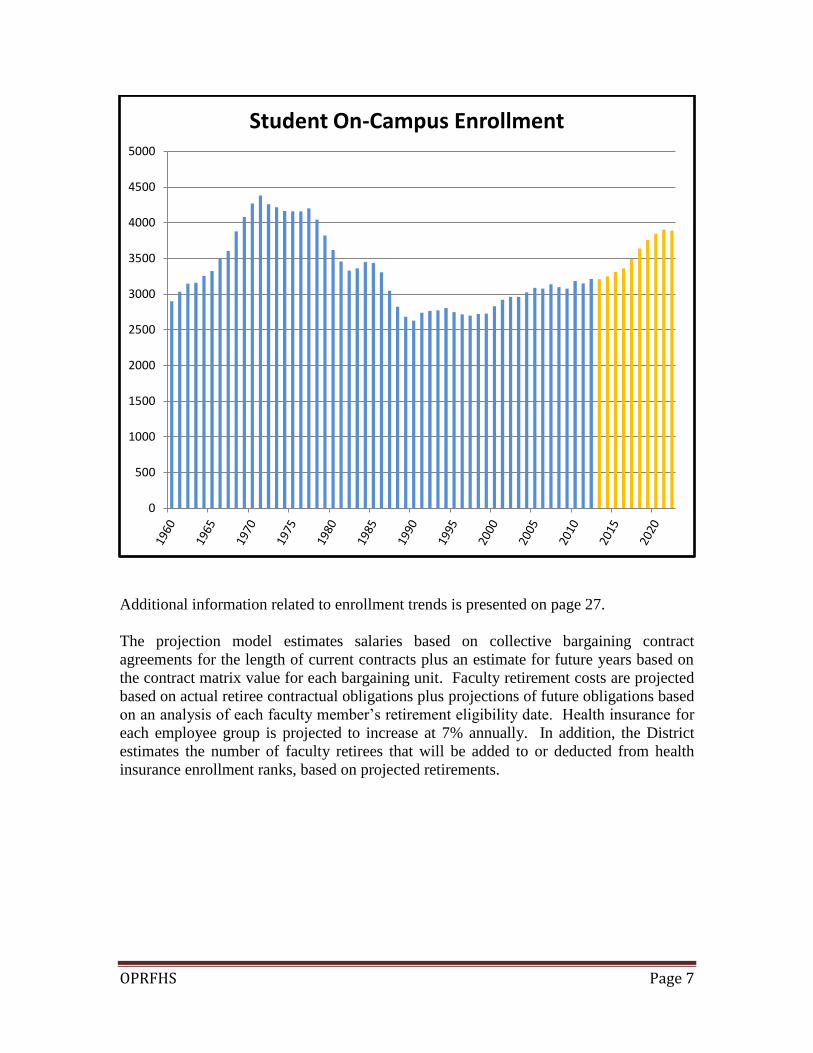
Expenditures The majority of expenditures in the Education Fund are directly related to compensation
and benefits (80.4% in FY 2013). The District projects faculty staffing based on
enrollment projections. In December 2011, the District received a demographic study
prepared by Ehler‟s and Associates. The enrollment projections reflect an anticipated
increase in enrollment over the next several years to approximately 3600 students by FY
2018. The District has re-projected enrollment, as reflected in the January 2012 report to
the Board of Education. The Five Year Projection model has been changed to reflect the
increased enrollment.
Fall Housing Report On-campus Enrollment
1997 2,698 2006 3,076 2015 est. 3,310
1998 2,721 2007 3,139 2016 est. 3,359
1999 2,727 2008 3,098 2017 est. 3,490
2000 2,829 2009 3,079 2018 est. 3,640
2001 2,921 2010 3,182 2019 est. 3,761
2002 2,962 2011 3,150 2020 est. 3,848
2003 3,024 2012 3,212 2021 est. 3,903
2004 3,023 2013 est. 3,210 2022 est. 3,889
2005 3,089 2014 est. 3,249
OPRFHS Page 7
Additional information related to enrollment trends is presented on page 27.
The projection model estimates salaries based on collective bargaining contract
agreements for the length of current contracts plus an estimate for future years based on
the contract matrix value for each bargaining unit. Faculty retirement costs are projected
based on actual retiree contractual obligations plus projections of future obligations based
on an analysis of each faculty member‟s retirement eligibility date. Health insurance for
each employee group is projected to increase at 7% annually. In addition, the District
estimates the number of faculty retirees that will be added to or deducted from health
insurance enrollment ranks, based on projected retirements.
0
500
1000
1500
2000
2500
3000
3500
4000
4500
5000
Student On-Campus Enrollment

OPRFHS Page 8
Contract Salary Increases and Length of Contract
Following is a chart of the certified staff, which includes classroom teachers, counselors,
special education program managers, and other certified faculty. Division heads and
administrative staff are omitted from this table. These estimates are based on an
assumption that class size will remain the same; that the average number of courses taken
per student will remain the same, and that the number of special education students will
remain stable at the current rate of total student population. Of course, a change in any
component of this analysis will affect the estimated staff required, particularly special
education staffing requirements. Therefore, these estimates are a guideline only and will
fluctuate to meet student needs.
Certified Staff (FTE)
2011 2012 2013 2014 2015 2016
Classroom Teacher 199.9 196.5 198.5 200.9 204.7 207.7
Behavior Interventionist 1.0 1.0 1.0 1.0 1.0 1.0
Deans 4.0 4.0 1.0 0.0 0.0 0.0
Counselors 12.0 12.0 12.0 12.0 12.0 12.0
Spoken Word 1.0 1.0 1.0 1.0 1.0 1.0
Title I 0.4 0.4 0.4 0.4 0.4 0.4
Faculty Senate 0.2 0.2 0.2 0.2 0.2 0.2
Librarian 3.0 3.0 2.0 2.0 2.0 2.0
Program Chair 4.0 4.0 3.0 3.0 3.0 3.0
Psychologists 2.0 2.0 2.0 2.0 2.0 2.0
Social Work 2.0 2.0 2.0 2.0 2.0 2.0
Speech Therapist 2.0 2.0 1.0 1.0 1.0 1.0
Total FTE: 231.5 228.1 224.1 225.5 229.3 232.3
FY 2008 FY 2009 FY 2010 FY 2011 FY 2012 FY 2013
Faculty 1 7.05% 7.05% 6.55% 6.15% 6.15% 0.00%
5
Classified Personnel 5.50%1
5.50%1
4.00%4
4.00%4
4.00%4
4.00%4
Buildings & Ground 2.00% 0%** 1.50% 1.50% 1.50% TBD
Non-Affiliated 4.50% 4.50% 1.50% 3.00% 1.50% 2.00%
Safety & Support 4.00% 4.00% 2.00% 2.00% 2.00% 2.00%
Administration 5.00% 5.00% 1.50% 4.50%2
1.50%3
2.00%6
6 Building administrators received a 2.0% increase to the base salary. District administators received a one-time 2% performance pay not added to the base
salary.
** Union members received a bridge payment to move from the pre-pay manual system of payroll to the post pay electronic system. Each member will receive two week pay
(40 hours) at straight time.
1 Salary increases indicated include the value of step increases.
2 Average increase, overall salaries for administrative positions declined by over $222,000 due to retirements, other vacancies and a reduction of 1.0 FTE.
3 Increases for administrators were based on a market analysis and changes in responsibilities. Changes by individual were more than/less than CPI. There
was a decrease of $71,000 in the total costs overall. 4 Steps have been eliminated
5 Teachers will receive no salary increase and will not move a step on the salary matrix (commonly referred to as a hard freeze). However they will receive
1.75% increae on the 403 (b) match

OPRFHS Page 9
In FY 2013, it appears that the number of certified staff decreased by 4.0 FTE. However,
three Dean‟s positions were reclassified as Student Interventionists and moved to
administrative roles and one Program Chair returned to the classroom and the new
position of assistant Director of Special Education was created. The total number of non-
certified staff will increase by 10.75 FTE. The increase in non-certified staff is for an
increase in safety and support, custodial support and teaching assistants in the Special
Education program.
Additional information regarding certified staff assumptions is presented on page 28.
The total cost of benefits has declined significantly over the past several years. This is
due to the sunset of several retirement benefits; the early retirement annuity and ERO
penalty payment plan, the 20% bumps in final years and the health insurance benefit.
The District„s current retirement benefit includes 6% increases in the last five years of
employment and the certified staff will now take advantage of the State TRIP health plan
rather than the District health plan.
Other expenditures in the Education Fund are estimated to increase at the following rates:
supplies at estimated CPI;
capital outlay at estimated CPI;
tuition at 2 times CPI; and
other objects at estimated CPI.

OPRFHS Page 10
Discussion by Fund

OPRFHS Page 11
Educational Fund The Educational Fund accounts for most of the instructional and administrative aspects of
the District‟s day-to-day operations. It also includes the Food Service Fund and the
Bookstore Fund in order to be consistent with the ISBE budget document format. The
majority of expenditures relate to salaries and benefits for faculty, administrators,
teaching assistants, safety and support staff, clerical and non-affiliated directors and
supervisors. The staffing levels for faculty and teaching assistants fluctuate based on the
number of on-campus regular education students and students with special needs. Other
salary and benefit cost considerations relate to the number of retirees receiving benefits;
and health, dental, and life insurance benefits paid by the District. The PMA projection
model incorporates a detailed estimate of the cost of new faculty salaries and reductions
due to faculty retirements.
The most significant differences between the September 2011 Five Year Projections and
the September 2012 Five Year Projections is Other Local Sources of Revenue. This is
due to the new settlement agreement with the Village of Oak Park for the Downtown TIF
District. The agreement provides annual surplus distributions which are recorded as
Other Local Resources of revenue.
Expenditures are less than previously projected for salaries and benefits due to the two
year agreement with Faculty Senate providing salary freezes and the health insurance
renewal of 3.2% rather than 7%. The anticipated surplus for FY 2013 will be
approximately $5.8 million. The Education Fund is projected to experience deficit
spending of approximately $2.5 million in FY 2018. The deficit spending is projected to
steadily increase thereafter.
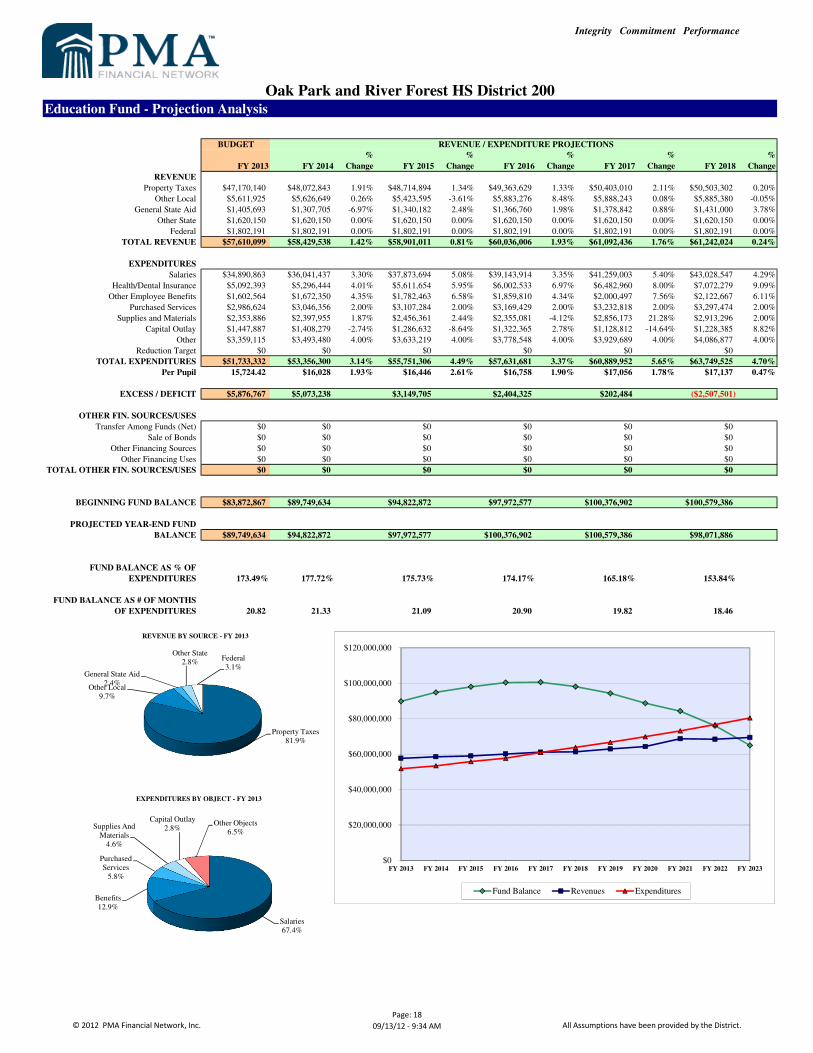
The chart provided on page 18 with the Educational Fund – Projection Analysis
illustrates the revenue and expenditure levels compared to the fund balance until the next
projected referendum, currently anticipated in the spring of 2020. In FY 2018,
expenditures are anticipated to be greater than revenue, thereby causing deficit spending.
The fund balance will diminish over time until the eventual need for another referendum.
It is important to ensure through prudent fiscal management that fund balances
accumulate in advance of FY 2018 in order to defer the eventual need for a referendum
increase until the spring of 2020. This cycle of fund balance accumulation followed by
its depletion is typical under tax cap law in Illinois for districts heavily dependent on
local property taxes. Fiscal year 2018 is significant to the District because the Oak Park
Downtown TIF District will expire and a significant amount of incremental EAV will be
released for levy purposes. In addition, by FY 2019, the District will have repaid the
majority of its current outstanding debt.
Other expenditures, primarily related to off-campus tuition, have increased. The District
continues to seek opportunities to meet the needs of more students on campus. The
model anticipates that the number of students placed off-campus will remain at the FY
2013 levels.
OPRFHS Page 12
The District replaces the Drivers Education automobiles every fifth year. In FY 2013 the
District will replace four vehicles.
Purchased services and supplies have increased in relation to the District technology
plans and the new staff development model. The projections anticipate sustaining these
investments going forward on an annual basis.
Operations and Maintenance Fund (O&M) The Operations and Maintenance Fund accounts for the day-to-day operations and
cleaning of the vintage building totaling approximately 1,000,000 square feet and the
District grounds. The majority of expenditures relate to the compensation and benefits of
custodial and maintenance employees (61% in FY 2013).
The District is continuing to reestablish the fund balance in order to maintain the vintage
building and to set aside funds for capital improvements. The projections assume that the
District will increase the levy rate from the previous cap of $.25 per $100 of EAV in
order to meet O & M obligations; however, the District does not currently anticipate the
need to levy at the new maximum rate of $.55 per $100 of EAV.
The Restricted Building Fund has now been combined with the O & M Fund in this
projection model which is consistent with the ISBE annual report and with the
Comprehensive Annual Financial Report. Expenditures relating to construction projects,
which were previously recorded in the Restricted Building Fund, were expended from the
combined O & M Fund and the Life Safety Funds in FY 2010. In FY 2011, the District
was required to establish the Capital Projects Fund. Beginning in FY 2011 there will be
an annual transfer from the O & M Fund to the Capital Project Fund for construction
projects. During FY 2012 a new Long Term Facility Planning Committee was formed
and the group has been discussing facility needs and priorities. The projection model will
change as these plans unfold, and actual dollar amounts may vary from year-to-year
based on the priorities determined by the Committees and approved by the Board.
The District has also conducted a facility capacity and utilization study and has
determined that the projected increase in student enrollment can be accommodated if the
District alters the building utilization from its present form. The group will study the
impact during FY 2013.
The District‟s utility costs have been reduced due to improvements related to boiler
replacements, window replacements, HVAC upgrades, light replacements, and the
installation of air lock doors. As a result of these positive improvements, costs related to
utilities are significantly less than the Summer 2010 Five Year Financial Projections but
are estimated to increase at twice the rate of CPI.
The District will maintain a budget that reflects a decrease in surplus each year while
deferred maintenance projects are completed.
OPRFHS Page 13
Transportation Fund The Transportation Fund accounts for activities relating to student transportation to and
from school for students with special needs. This fund also accounts for transportation
related to field trips, activities, and athletic events. The District owns two mini-buses and
two eight-passenger vans for the transport of small groups of students for activities and
athletic events. In addition, the District owns two mini-buses equipped with wheelchair
accessibility in order to transport students with special needs on life skills outings in the
community. These vehicles will be replaced on a 7- to 15-year rotating cycle. The costs
related to replacing these vehicles are reflected in the projections. The District will
replace one vehicle during FY 2013.
The District increased the costs of transportation after re-bidding the contract in the
spring of 2012. Due to student safety concerns the District accepted a contract with the
previous contractor, Grand Prairie. This resulted in increased costs, which are included
in the projections going forward.
IMRF/Social Security Fund The IMRF Fund accounts for the District‟s portion of pension contribution to the Illinois
Municipal Retirement Fund and for Social Security benefits for non-certified employees.
IMRF determines the District‟s contribution to the fund based on future pension
obligations. The IMRF rates escalated over the period of 2004 through 2007 and then
declined slightly; however, due to the 2008 financial market decline, IMRF notified all
districts that the IMRF rate would be increasing over several years at approximately 20%
per year until the rate reached 16.32%. Since the initial notice, there has been a modest
market improvement. The September 2013 projections reflect a slight change in
expectation. We have adjusted the maximum expected rate down to 13.52%. The actual
January 1, 2013 rate will be 13.52%, which is lower than originally projected by IMRF.

OPRFHS Page 14
IMRF Historical Rates
Fiscal Year Rate
2004 .0737
2005 .0859
2006 .0939
2007 .0961
2008 .0890
2009 .0860
2010 .0953
2011 .1048
2012 .1229
2013 .1352
2014 .1352
Working Cash Fund The Working Cash Fund accounts for financial resources held by the District that may be
temporarily loaned to other funds. The Working Cash Fund is provided from local
property taxes. Tax caps limit the levy amount. The legal maximum allowable rate is
$.05 per $100 of EAV. The fund balance had been depleted in the past in order to help
support the Education Fund in advance of the 2002 referendum. The District receives the
majority of total revenue from local property taxes, which are paid twice per year;
therefore, the District needs to maintain adequate resources to sustain operations for the
period of March through December, the time period between the first and second tax
installments.
Tort Fund The Tort Fund accounts for the legal and insurance needs of the District. There is no tax
rate cap on the Tort Fund; however, the Tort Fund is under the extension cap and,
therefore, affects the amount that can be levied into other funds.
Insurance and legal expenses are projected to increase at CPI. Property and casualty
insurance is expected to increase annually at 10%. The Tort Fund maintains a fund
balance for unexpected legal, potential safety issues, or increases in liability insurance
due to claims experience. The District is part of a self-funded Collective Liability
Insurance Cooperative (CLIC) for property, liability, and workers‟ compensation
insurance along with approximately 150 other Illinois public school districts. Increases
in premium are heavily dependent on claims experience.
The District has a standing Safety Committee which reviews claims history, safety
concerns, and compliance with safety inspections and improvements in order to reduce
claims experience.

OPRFHS Page 15
Life Safety Fund The Life Safety Fund accounts for State approved fire prevention and safety construction
projects. The Life Safety levy will be used over the next 20 years to pay-off the debt
secured in FY 2004 and FY 2005 for roof projects and to fund other Life Safety projects
relating to asbestos removal, air handling, and fire and electrical safety. The Life Safety
levy amount will be limited to the amount required to meet these obligations. The Life
Safety Fund is under the tax cap and, therefore, ultimately affects the amount levied into
the Education Fund.
Wight and Company, the previous architectural firm, prepared a Decennial Life Safety
plan which the District is presently implementing. The projects outlined in the plan will
be completed by summer 2013 and the levy will be reduced at that time. Other
construction projects will be recorded in the Capital Projects Fund.
Capital Projects Fund The Capital Projects Fund will receive a transfer of monies from the O & M fund on an
annual basis to cover construction projects.
The District facility is a vintage building in the Frank Lloyd Wright Historic District. The
building is surrounded by residential properties. The communities of Oak Park and River
Forest are fully developed with no undeveloped property available. The District intends
to maintain the District buildings and grounds in a proactive manner, not deferring or
delaying needed maintenance, so that the current building may be in service and in good
condition far into the future. The District intends to maintain the historical value and use
energy efficient and sustainable products, when refurbishing or redesigning areas. The
safety of students and staff is of the utmost importance.
During FY 2012 a Long Term Facility Planning Committee was formed. The Committee
will be assessing the building functionality for address teaching and learning needs in the
21st century along with capacity and utilization for increased enrollment.
This projection model anticipates spending of approximately $5,000,000 per year for
construction projects related to maintenance and replacement of infrastructure such as
HVAC, plumbing and electrical.
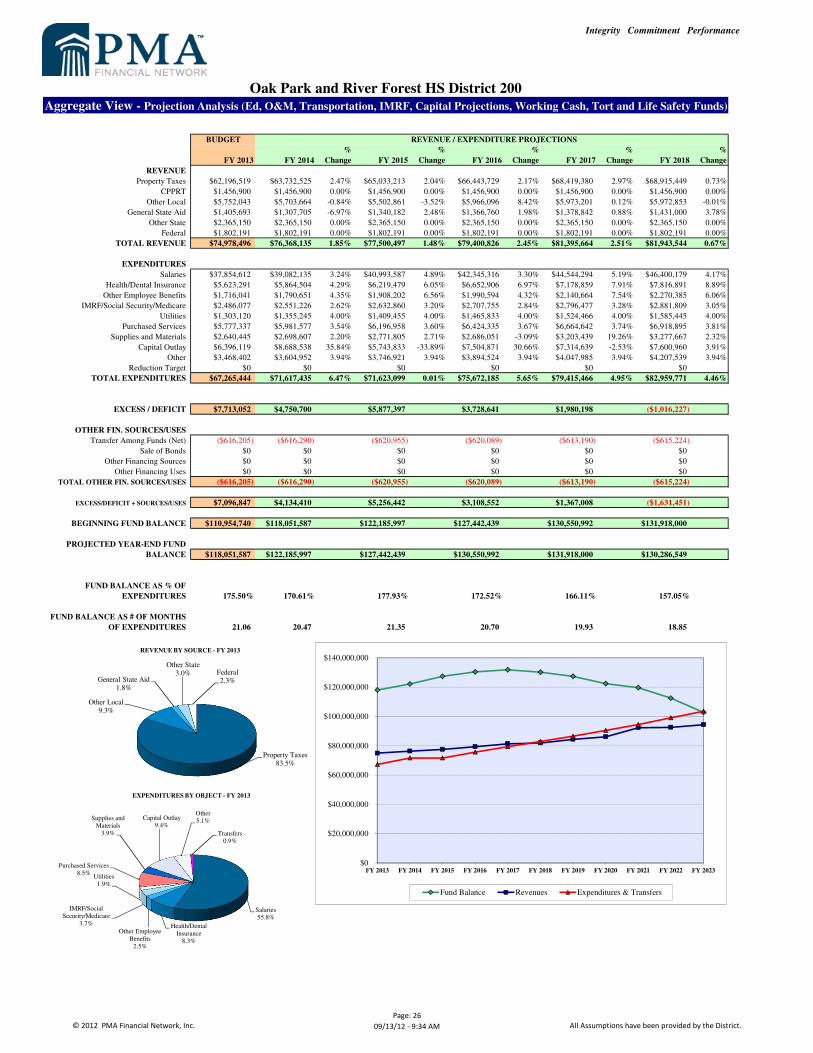
Aggregate View The Aggregate View-Projection Analysis is a compilation of all District funds. The
analysis is for informational purposes only. Each fund maintains a separate fund balance
which can only be used for the purposes of the particular fund. There are limitations on
fund transfers. The District presently transfers funds for debt payments from the Life
Safety Fund to the Bond and Interest Fund and from the O & M Fund to the Capital
Projects Fund for construction projects. Each of these transfers is permitted by law and
approved by the Board of Education.

OPRFHS Page 16
As discussed in the Educational Fund section of this document, the District will
experience an increase in total fund balance over the next several years and then a
depletion of those balances in advance of an eventual referendum in the spring of 2020.
The structural imbalance in the Illinois model of school district financing, which limits
increases in tax revenue to the lesser of CPI or 5%, has the effect of requiring school
districts to eventually seek a referendum increase in funding in order to maintain
programs. The CPI is not an adequate measure to forecast annual increases for school
districts because the vast majority of expenditures relate to salaries and benefits of staff
members (for OPRFHS over 80% of the Education Fund‟s annual expenditures). The
costs related to salaries and benefits increase annually at an amount greater than CPI.
This imbalance creates the need for a referendum.
Another complication of Illinois school funding is the heavy reliance on property taxes,
which are remitted to school districts in two installments, one in the spring and the other
in the fall. For Cook County, Illinois, the fall payment is generally paid sometime
between September and December. Therefore, on June 30 of each year, the District must
have cash on hand to pay bills until December.
The District has been a careful steward of school spending. Since the passage of the
referendum in 2002, the District has completely restructured its financial operations,
hiring a Chief Financial Officer with extensive private and public financial expertise, as
well as seeking additional outside professional financial planning assistance;
implemented a zero-based budgeting model resulting in substantive and enduring cost
cuts and cost savings measures; constructed a realistic five year plan that extends the life
of a referendum under current parameters to 2020, and built back formerly depleted funds
vital to school operations, such as the Life Safety, Operation and Maintenance, and
Working Cash funds. After the abolition of the Cicero Township Treasurer‟s Office, the
District has assumed management of its own investments with an annual savings of
$100,000 and increased interest income results. The District now maintains a credit
rating of AAA.
Cost containment measures have included significant reductions in the retirement costs
for faculty and staff; significant changes and cost reductions in the health insurance
benefit; a reduction of students placed off-campus thereby saving transportation and
tuition costs; reduction in utility costs due to boiler replacement, window replacement
and installation of airlock doors; redesign of student transportation; redesign of the
childcare program; redesign of the summer school program; redesign of the attendance
office; elimination of the Cicero Township Treasurer‟s fees; reduced contract services
for audit and accounting work, and reduced contract services for computer software
support. The District has also implemented an extensive bidding and purchase order
process, an employee management and tracking system, a fixed asset recording and
monitoring system, a time and attendance recording system and has improved internal
controls thereby eliminating unplanned and unbudgeted expenditures.
Beginning with the fiscal 2012 – 2013 budget planning process, the District implemented
a new financial planning model. The new model includes working groups, quality review

OPRFHS Page 17
committees and a Finance Advisory Leadership Team. The new model will introduce
shared leadership, cost consciousness amongst all employee groups, greater community
input and increased transparency. The ALT will review the financial projection model on
an annual basis and make recommendations to the Superintendent.
Beginning in FY 2013 the District will begin a Strategic Planning process. The Strategic
Plan will provide a strategic direction for the next five years. The work of the Long Term
Facility Planning Committee will be intertwined with the work of the Strategic Planning
Committee.
Integrity Commitment Performance
BUDGET
FY 2013 FY 2014
%
Change FY 2015
%
Change FY 2016
%
Change FY 2017
%
Change FY 2018
%
Change
REVENUE
Property Taxes $47,170,140 $48,072,843 1.91% $48,714,894 1.34% $49,363,629 1.33% $50,403,010 2.11% $50,503,302 0.20%
Other Local $5,611,925 $5,626,649 0.26% $5,423,595 -3.61% $5,883,276 8.48% $5,888,243 0.08% $5,885,380 -0.05%
General State Aid $1,405,693 $1,307,705 -6.97% $1,340,182 2.48% $1,366,760 1.98% $1,378,842 0.88% $1,431,000 3.78%
Other State $1,620,150 $1,620,150 0.00% $1,620,150 0.00% $1,620,150 0.00% $1,620,150 0.00% $1,620,150 0.00%
Federal $1,802,191 $1,802,191 0.00% $1,802,191 0.00% $1,802,191 0.00% $1,802,191 0.00% $1,802,191 0.00%
TOTAL REVENUE $57,610,099 $58,429,538 1.42% $58,901,011 0.81% $60,036,006 1.93% $61,092,436 1.76% $61,242,024 0.24%
EXPENDITURES
Salaries $34,890,863 $36,041,437 3.30% $37,873,694 5.08% $39,143,914 3.35% $41,259,003 5.40% $43,028,547 4.29%
Health/Dental Insurance $5,092,393 $5,296,444 4.01% $5,611,654 5.95% $6,002,533 6.97% $6,482,960 8.00% $7,072,279 9.09%
Other Employee Benefits $1,602,564 $1,672,350 4.35% $1,782,463 6.58% $1,859,810 4.34% $2,000,497 7.56% $2,122,667 6.11%
Purchased Services $2,986,624 $3,046,356 2.00% $3,107,284 2.00% $3,169,429 2.00% $3,232,818 2.00% $3,297,474 2.00%
Supplies and Materials $2,353,886 $2,397,955 1.87% $2,456,361 2.44% $2,355,081 -4.12% $2,856,173 21.28% $2,913,296 2.00%
Capital Outlay $1,447,887 $1,408,279 -2.74% $1,286,632 -8.64% $1,322,365 2.78% $1,128,812 -14.64% $1,228,385 8.82%
Other $3,359,115 $3,493,480 4.00% $3,633,219 4.00% $3,778,548 4.00% $3,929,689 4.00% $4,086,877 4.00%
Reduction Target $0 $0 $0 $0 $0 $0
TOTAL EXPENDITURES $51,733,332 $53,356,300 3.14% $55,751,306 4.49% $57,631,681 3.37% $60,889,952 5.65% $63,749,525 4.70%
Per Pupil 15,724.42 $16,028 1.93% $16,446 2.61% $16,758 1.90% $17,056 1.78% $17,137 0.47%
EXCESS / DEFICIT $5,876,767 $5,073,238 $3,149,705 $2,404,325 $202,484 ($2,507,501)
OTHER FIN. SOURCES/USES
Transfer Among Funds (Net) $0 $0 $0 $0 $0 $0
Sale of Bonds $0 $0 $0 $0 $0 $0
Other Financing Sources $0 $0 $0 $0 $0 $0
Other Financing Uses $0 $0 $0 $0 $0 $0
TOTAL OTHER FIN. SOURCES/USES $0 $0 $0 $0 $0 $0
BEGINNING FUND BALANCE $83,872,867 $89,749,634 $94,822,872 $97,972,577 $100,376,902 $100,579,386
PROJECTED YEAR-END FUND
BALANCE $89,749,634 $94,822,872 $97,972,577 $100,376,902 $100,579,386 $98,071,886
FUND BALANCE AS % OF
EXPENDITURES 173.49% 177.72% 175.73% 174.17% 165.18% 153.84%
FUND BALANCE AS # OF MONTHS
OF EXPENDITURES 20.82 21.33 21.09 20.90 19.82 18.46
Education Fund - Projection Analysis
REVENUE / EXPENDITURE PROJECTIONS
Oak Park and River Forest HS District 200
Property Taxes81.9%
Other Local9.7%
General State Aid2.4%
Other State2.8%
Federal3.1%
REVENUE BY SOURCE - FY 2013
Salaries67.4%
Benefits12.9%
Purchased Services
5.8%
Supplies And Materials
4.6%
Capital Outlay2.8%
Other Objects6.5%
EXPENDITURES BY OBJECT - FY 2013
$0
$20,000,000
$40,000,000
$60,000,000
$80,000,000
$100,000,000
$120,000,000
FY 2013 FY 2014 FY 2015 FY 2016 FY 2017 FY 2018 FY 2019 FY 2020 FY 2021 FY 2022 FY 2023
Fund Balance Revenues Expenditures
© 2012 PMA Financial Network, Inc.
Page: 18
09/13/12 - 9:34 AM All Assumptions have been provided by the District.

Integrity Commitment Performance
BUDGET
FY 2013 FY 2014
%
Change FY 2015
%
Change FY 2016
%
Change FY 2017
%
Change FY 2018
%
Change
REVENUE
Property Taxes $7,275,613 $8,557,949 17.63% $9,791,057 14.41% $10,383,916 6.06% $11,066,108 6.57% $11,436,386 3.35%
CPPRT $930,000 $1,080,000 16.13% $1,080,000 0.00% $1,080,000 0.00% $1,080,000 0.00% $1,080,000 0.00%
Other Local $47,387 $27,034 -42.95% $25,543 -5.52% $25,934 1.53% $25,257 -2.61% $24,911 -1.37%
TOTAL REVENUE $8,253,000 $9,664,983 17.11% $10,896,599 12.74% $11,489,850 5.44% $12,171,365 5.93% $12,541,298 3.04%
EXPENDITURES
Salaries $2,963,749 $3,040,698 2.60% $3,119,893 2.60% $3,201,402 2.61% $3,285,291 2.62% $3,371,632 2.63%
Health/Dental Insurance $530,898 $568,061 7.00% $607,825 7.00% $650,373 7.00% $695,899 7.00% $744,612 7.00%
Other Employee Benefits $113,477 $118,301 4.25% $125,739 6.29% $130,783 4.01% $140,167 7.18% $147,718 5.39%
Utilities $1,303,120 $1,355,245 4.00% $1,409,455 4.00% $1,465,833 4.00% $1,524,466 4.00% $1,585,445 4.00%
Purchased Services $602,802 $617,872 2.50% $633,319 2.50% $649,152 2.50% $665,381 2.50% $682,015 2.50%
Supplies and Materials $277,559 $291,437 5.00% $306,009 5.00% $321,309 5.00% $337,375 5.00% $354,243 5.00%
Capital Outlay $121,524 $123,954 2.00% $158,534 27.90% $129,604 -18.25% $132,196 2.00% $169,363 28.11%
Other $4,787 $4,883 2.00% $4,980 2.00% $5,080 2.00% $5,182 2.00% $5,285 2.00%
TOTAL EXPENDITURES $5,917,916 $6,120,451 3.42% $6,365,754 4.01% $6,553,536 2.95% $6,785,957 3.55% $7,060,314 4.04%
$8,451,802 $11,901,363 $10,082,848 $11,906,307 $12,277,797 $12,694,700
EXCESS / DEFICIT $2,335,084 $3,544,532 $4,530,846 $4,936,313 $5,385,408 $5,480,984
OTHER FIN. SOURCES/USES
Transfer Among Funds (Net) ($2,533,886) ($5,780,912) ($3,717,094) ($5,352,771) ($5,491,840) ($5,634,386)
Sale of Bonds $0 $0 $0 $0 $0 $0
Other Financing Sources $0 $0 $0 $0 $0 $0
Other Financing Uses $0 $0 $0 $0 $0 $0
TOTAL OTHER FIN. SOURCES/USES ($2,533,886) ($5,780,912) ($3,717,094) ($5,352,771) ($5,491,840) ($5,634,386)
BEGINNING FUND BALANCE $8,390,383 $8,191,581 $5,955,201 $6,768,953 $6,352,495 $6,246,063
PROJECTED YEAR-END FUND
BALANCE $8,191,581 $5,955,201 $6,768,953 $6,352,495 $6,246,063 $6,092,661
FUND BALANCE AS % OF
EXPENDITURES 138.42% 97.30% 106.33% 96.93% 92.04% 86.29%
FUND BALANCE AS # OF MONTHS
OF EXPENDITURES 16.61 11.68 12.76 11.63 11.05 10.36
Operations & Maintenance Fund - Projection Analysis
REVENUE / EXPENDITURE PROJECTIONS
Oak Park and River Forest HS District 200
Property Taxes88.2%
Other Local11.8%
REVENUE BY SOURCE - FY 2013
Salaries50.1%
Benefits10.9%
Purchased Services10.2%
Supplies And Materials
4.7%
Capital Outlay2.1%
Other Objects0.1%
Utilities22.0%
EXPENDITURES BY OBJECT - FY 2013
$0
$2,000,000
$4,000,000
$6,000,000
$8,000,000
$10,000,000
$12,000,000
$14,000,000
$16,000,000
FY 2013 FY 2014 FY 2015 FY 2016 FY 2017 FY 2018 FY 2019 FY 2020 FY 2021 FY 2022 FY 2023
Fund Balance Revenues Expenditures & Transfers
© 2011 PMA Financial Network, Inc.
Page: 19
09/13/12 - 9:34 AM All Assumptions have been provided by the District.

Integrity Commitment Performance
BUDGET
FY 2013 FY 2014
%
Change FY 2015
%
Change FY 2016
%
Change FY 2017
%
Change FY 2018
%
Change
REVENUE
Property Taxes $865,341 $864,684 -0.08% $864,455 -0.03% $865,325 0.10% $872,934 0.88% $856,600 -1.87%
Other Local $14,716 $8,488 -42.32% $8,737 2.93% $8,676 -0.69% $8,462 -2.47% $8,281 -2.13%
Other State $745,000 $745,000 0.00% $745,000 0.00% $745,000 0.00% $745,000 0.00% $745,000 0.00%
TOTAL REVENUE $1,625,057 $1,618,172 -0.42% $1,618,192 0.00% $1,619,001 0.05% $1,626,395 0.46% $1,609,882 -1.02%
EXPENDITURES
Salaries $0 $0 $0 $0 $0 $0
Purchased Services $1,405,893 $1,462,129 4.00% $1,520,614 4.00% $1,581,438 4.00% $1,644,696 4.00% $1,710,484 4.00%
Supplies and Materials $7,000 $7,175 2.50% $7,354 2.50% $7,538 2.50% $7,727 2.50% $7,920 2.50%
Capital Outlay $50,000 $0 -100.00% $33,443 $145,238 334.29% $0 -100.00% $0
Other $4,500 $4,590 2.00% $4,682 2.00% $4,775 2.00% $4,871 2.00% $4,968 2.00%
TOTAL EXPENDITURES $1,467,393 $1,473,894 0.44% $1,566,093 6.26% $1,738,990 11.04% $1,657,294 -4.70% $1,723,372 3.99%
EXCESS / DEFICIT $157,664 $144,279 $52,099 ($119,989) ($30,898) ($113,490)
OTHER FIN. SOURCES/USES
Transfer Among Funds (Net) $0 $0 $0 $0 $0 $0
Sale of Bonds $0 $0 $0 $0 $0 $0
Other Financing Sources $0 $0 $0 $0 $0 $0
Other Financing Uses $0 $0 $0 $0 $0 $0
TOTAL OTHER FIN. SOURCES/USES $0 $0 $0 $0 $0 $0
BEGINNING FUND BALANCE $3,103,766 $3,261,430 $3,405,709 $3,457,807 $3,337,818 $3,306,920
PROJECTED YEAR-END FUND
BALANCE $3,261,430 $3,405,709 $3,457,807 $3,337,818 $3,306,920 $3,193,430
FUND BALANCE AS % OF
EXPENDITURES 222.26% 231.07% 220.79% 191.94% 199.54% 185.30%
FUND BALANCE AS # OF MONTHS
OF EXPENDITURES 26.67 27.73 26.50 23.03 23.94 22.24
Transportation Fund - Projection Analysis
REVENUE / EXPENDITURE PROJECTIONS
Oak Park and River Forest HS District 200
Property Taxes53.2%
Other Local0.9%
Other State45.8%
REVENUE BY SOURCE - FY 2013
Purchased Services95.8%
Supplies And Materials
0.5%
Capital Outlay3.4%
Other Objects0.3%
EXPENDITURES BY OBJECT - FY 2013
$0
$500,000
$1,000,000
$1,500,000
$2,000,000
$2,500,000
$3,000,000
$3,500,000
$4,000,000
FY 2013 FY 2014 FY 2015 FY 2016 FY 2017 FY 2018 FY 2019 FY 2020 FY 2021 FY 2022 FY 2023
Fund Balance Revenues Expenditures
© 2011 PMA Financial Network, Inc.
Page: 20
09/13/12 - 9:34 AM All Assumptions have been provided by the District.

Integrity Commitment Performance
BUDGET
FY 2013 FY 2014
%
Change FY 2015
%
Change FY 2016
%
Change FY 2017
%
Change FY 2018
%
Change
REVENUE
Property Taxes $2,569,793 $2,664,974 3.70% $2,761,303 3.61% $2,810,760 1.79% $2,835,474 0.88% $2,731,837 -3.66%
CPPRT $116,900 $116,900 0.00% $116,900 0.00% $116,900 0.00% $116,900 0.00% $116,900 0.00%
Other Local $13,203 $7,965 -39.67% $8,583 7.75% $9,205 7.25% $9,665 5.00% $9,826 1.66%
TOTAL REVENUE $2,699,896 $2,789,839 3.33% $2,886,786 3.47% $2,936,865 1.73% $2,962,039 0.86% $2,858,563 -3.49%
$130,103
EXPENDITURES
Other Employee Benefits $2,486,077 $2,551,226 2.62% $2,632,860 3.20% $2,707,755 2.84% $2,796,477 3.28% $2,881,809 3.05%
TOTAL EXPENDITURES $2,486,077 $2,551,226 2.62% $2,632,860 3.20% $2,707,755 2.84% $2,796,477 3.28% $2,881,809 3.05%
EXCESS / DEFICIT $213,819 $238,614 $253,926 $229,110 $165,562 ($23,246)
OTHER FIN. SOURCES/USES
Transfer Among Funds (Net) $0 $0 $0 $0 $0 $0
Sale of Bonds $0 $0 $0 $0 $0 $0
Other Financing Sources $0 $0 $0 $0 $0 $0
Other Financing Uses $0 $0 $0 $0 $0 $0
TOTAL OTHER FIN. SOURCES/USES $0 $0 $0 $0 $0 $0
BEGINNING FUND BALANCE $2,856,284 $3,070,103 $3,308,717 $3,562,643 $3,791,753 $3,957,315
PROJECTED YEAR-END FUND
BALANCE $3,070,103 $3,308,717 $3,562,643 $3,791,753 $3,957,315 $3,934,069
FUND BALANCE AS % OF
EXPENDITURES 123.49% 129.69% 135.31% 140.03% 141.51% 136.51%
FUND BALANCE AS # OF MONTHS
OF EXPENDITURES 14.82 15.56 16.24 16.80 16.98 16.38
IMRF Fund - Projection Analysis
REVENUE / EXPENDITURE PROJECTIONS
Oak Park and River Forest HS District 200
Property Taxes95.2%
Other Local4.8%
REVENUE BY SOURCE - FY 2013
$0
$500,000
$1,000,000
$1,500,000
$2,000,000
$2,500,000
$3,000,000
$3,500,000
$4,000,000
$4,500,000
FY 2013 FY 2014 FY 2015 FY 2016 FY 2017 FY 2018 FY 2019 FY 2020 FY 2021 FY 2022 FY 2022
Fund Balance Revenues Expenditures
© 2011 PMA Financial Network, Inc.
Page: 21
09/13/12 - 9:34 AM All Assumptions have been provided by the District.

Integrity Commitment Performance
BUDGET
FY 2013 FY 2014
%
Change FY 2015
%
Change FY 2016
%
Change FY 2017
%
Change FY 2018
%
Change
REVENUE
CPPRT $260,000 $260,000 0.00% $260,000 0.00% $260,000 0.00% $260,000 0.00% $260,000 0.00%
TOTAL REVENUE $266,000 $260,000 -2.26% $260,000 0.00% $260,000 0.00% $260,000 0.00% $260,000 0.00%
$2,793,886 $6,040,912 $3,977,094 $5,612,771 $5,751,840 $5,894,386
EXPENDITURES
Purchased Services $50,000 $50,000 0.00% $50,000 0.00% $50,000 0.00% $50,000 0.00% $50,000 0.00%
Capital Outlay $2,749,886 $5,990,912 117.86% $3,927,094 -34.45% $5,562,771 41.65% $5,701,840 2.50% $5,844,386 2.50%
TOTAL EXPENDITURES $2,799,886 $6,040,912 115.76% $3,977,094 -34.16% $5,612,771 41.13% $5,751,840 2.48% $5,894,386 2.48%
EXCESS / DEFICIT ($2,533,886) ($5,780,912) ($3,717,094) ($5,352,771) ($5,491,840) ($5,634,386)
OTHER FIN. SOURCES/USES
Transfer Among Funds (Net) $2,533,886 $5,780,912 $3,717,094 $5,352,771 $5,491,840 $5,634,386
Sale of Bonds $0 $0 $0 $0 $0 $0
Other Financing Sources $0 $0 $0 $0 $0 $0
Other Financing Uses $0 $0 $0 $0 $0 $0
TOTAL OTHER FIN. SOURCES/USES $2,533,886 $5,780,912 $3,717,094 $5,352,771 $5,491,840 $5,634,386
BEGINNING FUND BALANCE $636,519 $636,519 $636,519 $636,519 $636,519 $636,519
PROJECTED YEAR-END FUND
BALANCE $636,519 $636,519 $636,519 $636,519 $636,519 $636,519
FUND BALANCE AS % OF
EXPENDITURES 22.73% 10.54% 16.00% 11.34% 11.07% 10.80%
FUND BALANCE AS # OF MONTHS
OF EXPENDITURES 2.73 1.26 1.92 1.36 1.33 1.30
Capital Projects Fund - Projection Analysis
REVENUE / EXPENDITURE PROJECTIONS
Oak Park and River Forest HS District 200
Other Local100%
REVENUE BY SOURCE - FY 2013
Purchased Services
1.8%
Capital Outlay98.2%
EXPENDITURES BY OBJECT - FY 2013
$0
$1,000,000
$2,000,000
$3,000,000
$4,000,000
$5,000,000
$6,000,000
$7,000,000
FY 2013 FY 2014 FY 2015 FY 2016 FY 2017 FY 2018 FY 2019 FY 2020 FY 2021 FY 2022 FY 2023
Fund Balance Revenues Expenditures
© 2011 PMA Financial Network, Inc.
Page: 22
09/13/12 - 9:34 AM All Assumptions have been provided by the District.

Integrity Commitment Performance
BUDGET
FY 2013 FY 2014
%
Change FY 2015
%
Change FY 2016
%
Change FY 2017
%
Change FY 2018
%
Change
REVENUE
Property Taxes $1,048,566 $1,043,433 -0.49% $1,049,299 0.56% $1,099,486 4.78% $1,150,303 4.62% $1,142,463 -0.68%
Other Local $46,730 $26,663 -42.94% $29,354 10.09% $32,206 9.71% $35,000 8.68% $37,956 8.44%
TOTAL REVENUE $1,095,296 $1,070,095 -2.30% $1,078,653 0.80% $1,131,692 4.92% $1,185,303 4.74% $1,180,418 -0.41%
EXPENDITURES
TOTAL EXPENDITURES $0 $0 $0 $0 $0 $0
EXCESS / DEFICIT $1,095,296 $1,070,095 $1,078,653 $1,131,692 $1,185,303 $1,180,418
OTHER FIN. SOURCES/USES
Transfer Among Funds (Net) $0 $0 $0 $0 $0 $0
Sale of Bonds $0 $0 $0 $0 $0 $0
Other Financing Sources $0 $0 $0 $0 $0 $0
Other Financing Uses $0 $0 $0 $0 $0 $0
TOTAL OTHER FIN. SOURCES/USES $0 $0 $0 $0 $0 $0
BEGINNING FUND BALANCE $9,012,832 $10,108,128 $11,178,223 $12,256,876 $13,388,568 $14,573,871
PROJECTED YEAR-END FUND
BALANCE $10,108,128 $11,178,223 $12,256,876 $13,388,568 $14,573,871 $15,754,289
Working Cash Fund - Projection Analysis
REVENUE / EXPENDITURE PROJECTIONS
Oak Park and River Forest HS District 200
$0
$5,000,000
$10,000,000
$15,000,000
$20,000,000
$25,000,000
FY 2013 FY 2014 FY 2015 FY 2016 FY 2017 FY 2018 FY 2019 FY 2020 FY 2021 FY 2022 FY 2023
Fund Balance
© 2011 PMA Financial Network, Inc.
Page: 23
09/13/12 - 9:34 AM All Assumptions have been provided by the District.

Integrity Commitment Performance
BUDGET
FY 2013 FY 2014
%
Change FY 2015
%
Change FY 2016
%
Change FY 2017
%
Change FY 2018
%
Change
REVENUE
Property Taxes $1,169,933 $1,197,990 2.40% $1,221,631 1.97% $1,299,503 6.37% $1,474,386 13.46% $1,639,243 11.18%
Other Local $11,487 $6,323 -44.95% $6,145 -2.81% $5,877 -4.36% $5,646 -3.93% $5,576 -1.24%
TOTAL REVENUE $1,181,420 $1,204,313 1.94% $1,227,777 1.95% $1,305,380 6.32% $1,480,032 13.38% $1,644,819 11.13%
EXPENDITURES
Purchased Services $732,018 $805,220 10.00% $885,742 10.00% $974,316 10.00% $1,071,748 10.00% $1,178,922 10.00%
Supplies and Materials $2,000 $2,040 2.00% $2,081 2.00% $2,122 2.00% $2,165 2.00% $2,208 2.00%
Capital Outlay $325,000 $331,500 2.00% $338,130 2.00% $344,893 2.00% $351,790 2.00% $358,826 2.00%
Other $100,000 $102,000 2.00% $104,040 2.00% $106,121 2.00% $108,243 2.00% $110,408 2.00%
TOTAL EXPENDITURES $1,159,018 $1,240,760 7.05% $1,329,993 7.19% $1,427,452 7.33% $1,533,946 7.46% $1,650,365 7.59%
EXCESS / DEFICIT $22,402 ($36,447) ($102,216) ($122,072) ($53,915) ($5,545)
OTHER FIN. SOURCES/USES
Transfer Among Funds (Net) $0 $0 $0 $0 $0 $0
Sale of Bonds $0 $0 $0 $0 $0 $0
Other Financing Sources $0 $0 $0 $0 $0 $0
Other Financing Uses $0 $0 $0 $0 $0 $0
TOTAL OTHER FIN. SOURCES/USES $0 $0 $0 $0 $0 $0
BEGINNING FUND BALANCE $2,534,089 $2,556,491 $2,520,044 $2,417,828 $2,295,756 $2,241,842
PROJECTED YEAR-END FUND
BALANCE $2,556,491 $2,520,044 $2,417,828 $2,295,756 $2,241,842 $2,236,296
FUND BALANCE AS % OF
EXPENDITURES 220.57% 203.10% 181.79% 160.83% 146.15% 135.50%
FUND BALANCE AS # OF MONTHS
OF EXPENDITURES 26.47 24.37 21.82 19.30 17.54 16.26
Tort Fund - Projection Analysis
REVENUE / EXPENDITURE PROJECTIONS
Oak Park and River Forest HS District 200
Property Taxes99.0%
Other Local1.0%
REVENUE BY SOURCE - FY 2013
Purchased Services63.2%
Supplies and Materials
0.2%
Capital Outlay28.0%
Other8.6%
EXPENDITURES BY OBJECT - FY 2013
$0
$500,000
$1,000,000
$1,500,000
$2,000,000
$2,500,000
$3,000,000
FY 2013 FY 2014 FY 2015 FY 2016 FY 2017 FY 2018 FY 2019 FY 2020 FY 2021 FY 2022 FY 2022
Fund Balance Revenues Expenditures
© 2011 PMA Financial Network, Inc.
Page: 24
09/13/12 - 9:34 AM All Assumptions have been provided by the District.

Integrity Commitment Performance
BUDGET
FY 2013 FY 2014
%
Change FY 2015
%
Change FY 2016
%
Change FY 2017
%
Change FY 2018
%
Change
REVENUE
Property Taxes $2,097,133 $1,330,653 -36.55% $630,573 -52.61% $621,110 -1.50% $617,166 -0.64% $605,618 -1.87%
CPPRT $150,000 $0 $0 $0 $0 $0
Other Local $595 $541 -9.03% $905 67.25% $922 1.83% $929 0.73% $923 -0.63%
TOTAL REVENUE $2,247,728 $1,331,194 -40.78% $631,479 -52.56% $622,032 -1.50% $618,094 -0.63% $606,540 -1.87%
$150,595
EXPENDITURES
Purchased Services $0 $0 $0 $0 $0 $0
Supplies and Materials $0 $0 $0 $0 $0 $0
Capital Outlay $1,701,822 $833,893 -51.00% $0 $0 $0 $0
Other $0 $0 $0 $0 $0 $0
TOTAL EXPENDITURES $1,701,822 $833,893 -51.00% $0 $0 $0 $0
$2,318,027 $1,450,183 $620,955 $620,089 $613,190 $615,224
EXCESS / DEFICIT $545,906 $497,301 $631,479 $622,032 $618,094 $606,540
Transfers
OTHER FIN. SOURCES/USES $616,205
Transfer Among Funds (Net) ($616,205) ($616,290) ($620,955) ($620,089) ($613,190) ($615,224)
Sale of Bonds $0 $0 $0 $0 $0 $0
Other Financing Sources $0 $0 $0 $0 $0 $0
Other Financing Uses $0 $0 $0 $0 $0 $0
TOTAL OTHER FIN. SOURCES/USES ($616,205) ($616,290) ($620,955) ($620,089) ($613,190) ($615,224)
BEGINNING FUND BALANCE $548,000 $477,701 $358,712 $369,236 $371,179 $376,083
PROJECTED YEAR-END FUND
BALANCE $477,701 $358,712 $369,236 $371,179 $376,083 $367,400
FUND BALANCE AS % OF
EXPENDITURES 28.07% 43.02%
FUND BALANCE AS # OF MONTHS
OF EXPENDITURES 3.37 5.16
Life Safety Fund - Projection Analysis
REVENUE / EXPENDITURE PROJECTIONS
Oak Park and River Forest HS District 200
Property Taxes93.3%
Other Local6.7%
REVENUE BY SOURCE - FY 2013
Capital Outlay73.4%
Transfers26.6%
EXPENDITURES BY OBJECT - FY 2013
$0
$500,000
$1,000,000
$1,500,000
$2,000,000
$2,500,000
FY 2013 FY 2014 FY 2015 FY 2016 FY 2017 FY 2018 FY 2019 FY 2020 FY 2021 FY 2022 FY 2023
Fund Balance Revenues Expenditures & Transfers
© 2011 PMA Financial Network, Inc.
Page: 25
09/13/12 - 9:34 AM All Assumptions have been provided by the District.
Integrity Commitment Performance
BUDGET
FY 2013 FY 2014
%
Change FY 2015
%
Change FY 2016
%
Change FY 2017
%
Change FY 2018
%
Change
REVENUE
Property Taxes $62,196,519 $63,732,525 2.47% $65,033,213 2.04% $66,443,729 2.17% $68,419,380 2.97% $68,915,449 0.73%
CPPRT $1,456,900 $1,456,900 0.00% $1,456,900 0.00% $1,456,900 0.00% $1,456,900 0.00% $1,456,900 0.00%
Other Local $5,752,043 $5,703,664 -0.84% $5,502,861 -3.52% $5,966,096 8.42% $5,973,201 0.12% $5,972,853 -0.01%
General State Aid $1,405,693 $1,307,705 -6.97% $1,340,182 2.48% $1,366,760 1.98% $1,378,842 0.88% $1,431,000 3.78%
Other State $2,365,150 $2,365,150 0.00% $2,365,150 0.00% $2,365,150 0.00% $2,365,150 0.00% $2,365,150 0.00%
Federal $1,802,191 $1,802,191 0.00% $1,802,191 0.00% $1,802,191 0.00% $1,802,191 0.00% $1,802,191 0.00%
TOTAL REVENUE $74,978,496 $76,368,135 1.85% $77,500,497 1.48% $79,400,826 2.45% $81,395,664 2.51% $81,943,544 0.67%
EXPENDITURES
Salaries $37,854,612 $39,082,135 3.24% $40,993,587 4.89% $42,345,316 3.30% $44,544,294 5.19% $46,400,179 4.17%
Health/Dental Insurance $5,623,291 $5,864,504 4.29% $6,219,479 6.05% $6,652,906 6.97% $7,178,859 7.91% $7,816,891 8.89%
Other Employee Benefits $1,716,041 $1,790,651 4.35% $1,908,202 6.56% $1,990,594 4.32% $2,140,664 7.54% $2,270,385 6.06%
IMRF/Social Security/Medicare $2,486,077 $2,551,226 2.62% $2,632,860 3.20% $2,707,755 2.84% $2,796,477 3.28% $2,881,809 3.05%
Utilities $1,303,120 $1,355,245 4.00% $1,409,455 4.00% $1,465,833 4.00% $1,524,466 4.00% $1,585,445 4.00%
Purchased Services $5,777,337 $5,981,577 3.54% $6,196,958 3.60% $6,424,335 3.67% $6,664,642 3.74% $6,918,895 3.81%
Supplies and Materials $2,640,445 $2,698,607 2.20% $2,771,805 2.71% $2,686,051 -3.09% $3,203,439 19.26% $3,277,667 2.32%
Capital Outlay $6,396,119 $8,688,538 35.84% $5,743,833 -33.89% $7,504,871 30.66% $7,314,639 -2.53% $7,600,960 3.91%
Other $3,468,402 $3,604,952 3.94% $3,746,921 3.94% $3,894,524 3.94% $4,047,985 3.94% $4,207,539 3.94%
Reduction Target $0 $0 $0 $0 $0 $0
TOTAL EXPENDITURES $67,265,444 $71,617,435 6.47% $71,623,099 0.01% $75,672,185 5.65% $79,415,466 4.95% $82,959,771 4.46%
$67,881,649 $72,233,725 $72,244,054 $76,292,274 $80,028,656 $83,574,995
EXCESS / DEFICIT $7,713,052 $4,750,700 $5,877,397 $3,728,641 $1,980,198 ($1,016,227)
Transfers
OTHER FIN. SOURCES/USES $616,205
Transfer Among Funds (Net) ($616,205) ($616,290) ($620,955) ($620,089) ($613,190) ($615,224)
Sale of Bonds $0 $0 $0 $0 $0 $0
Other Financing Sources $0 $0 $0 $0 $0 $0
Other Financing Uses $0 $0 $0 $0 $0 $0
TOTAL OTHER FIN. SOURCES/USES ($616,205) ($616,290) ($620,955) ($620,089) ($613,190) ($615,224)
EXCESS/DEFICIT + SOURCES/USES $7,096,847 $4,134,410 $5,256,442 $3,108,552 $1,367,008 ($1,631,451)
BEGINNING FUND BALANCE $110,954,740 $118,051,587 $122,185,997 $127,442,439 $130,550,992 $131,918,000
PROJECTED YEAR-END FUND
BALANCE $118,051,587 $122,185,997 $127,442,439 $130,550,992 $131,918,000 $130,286,549
FUND BALANCE AS % OF
EXPENDITURES 175.50% 170.61% 177.93% 172.52% 166.11% 157.05%
FUND BALANCE AS # OF MONTHS
OF EXPENDITURES 21.06 20.47 21.35 20.70 19.93 18.85
REVENUE / EXPENDITURE PROJECTIONS
Oak Park and River Forest HS District 200Aggregate View - Projection Analysis (Ed, O&M, Transportation, IMRF, Capital Projections, Working Cash, Tort and Life Safety Funds)
Property Taxes83.5%
Other Local9.3%
General State Aid1.8%
Other State3.0% Federal
2.3%
REVENUE BY SOURCE - FY 2013
Salaries55.8%
Health/Dental Insurance
8.3%
Other Employee Benefits
2.5%
IMRF/Social Security/Medicare
3.7%
Utilities1.9%
Purchased Services8.5%
Supplies and Materials
3.9%
Capital Outlay9.4%
Other5.1%
Transfers0.9%
EXPENDITURES BY OBJECT - FY 2013
$0
$20,000,000
$40,000,000
$60,000,000
$80,000,000
$100,000,000
$120,000,000
$140,000,000
FY 2013 FY 2014 FY 2015 FY 2016 FY 2017 FY 2018 FY 2019 FY 2020 FY 2021 FY 2022 FY 2023
Fund Balance Revenues Expenditures & Transfers
© 2012 PMA Financial Network, Inc.
Page: 26
09/13/12 - 9:34 AM All Assumptions have been provided by the District.

Integrity Commitment Performance
2008 2009 2010 2011 2012 2013 2014 2015 2016 2017 2018
9-12: 3,098 3,076 3,182 3,150 3,268 3,210 3,249 3,310 3,359 3,490 3,640
SPED Out-of-District 78 87 75 75 75 80 80 80 80 80 80
TOTAL ENROLLMENT: 3,176 3,163 3,257 3,225 3,343 3,290 3,329 3,390 3,439 3,570 3,720
ANNUAL CHANGE: -13 94 -32 118 -53 39 61 49 131 150
ADA: 3,132 3,169 3,227 3,273 3,398 3,541
Oak Park and River Forest HS District 200Enrollment Analysis
ACTUAL ENROLLMENT PROJECTED ENROLLMENT
3,176 3,163 3,257 3,225
3,343 3,290 3,329 3,390 3,439 3,570
3,720
0
500
1,000
1,500
2,000
2,500
3,000
3,500
4,000
2008 2009 2010 2011 2012 2013 2014 2015 2016 2017 2018
ENROLLMENT HISTORY AND PROJECTIONS
Actual Projected
(13)
94
(32)
118
(53)
39
61 49
131
150
(100)
(50)
0
50
100
150
200
2009 2010 2011 2012 2013 2014 2015 2016 2017 2018
ENROLLMENT CHANGE
Actual Projected
© 2011 PMA Financial Network, Inc.
Page: 27
09/13/12 - 9:34 AM All Assumptions have been provided by the District.

Integrity Commitment Performance
2013 2014 2015 2016 2017 2018 2013 2014 2015 2016 2017 2018
9-12: 198.5 200.9 204.7 207.7 215.8 225.1 16.17 16.17 16.17 16.17 16.17 16.17
Behavior Interventionist 1.0 1.0 1.0 1.0 1.0 1.0
Deans 1.0 0.0 0.0 0.0 0.0 0.0
Counselors 12.0 12.0 12.0 12.0 12.0 12.0
Spoken Word 1.0 1.0 1.0 1.0 1.0 1.0
Title I 0.4 0.4 0.4 0.4 0.4 0.4
Faculty Senate 0.2 0.2 0.2 0.2 0.2 0.2
Librarian 2.0 2.0 2.0 2.0 2.0 2.0
Program Chair 3.0 3.0 3.0 3.0 3.0 3.0
Psychologists 2.0 2.0 2.0 2.0 2.0 2.0
Social Work 2.0 2.0 2.0 2.0 2.0 2.0
Speech Therapist 1.0 1.0 1.0 1.0 1.0 1.0
Total FTE: 224.1 225.5 229.3 232.3 240.4 249.7 Average
Staffing Ratio:14.68 14.76 14.78 14.80 14.85 14.90
2014 2015 2016 2017 2018
9-12: 2.4 3.8 3.0 8.1 9.3
Behavior Interventionist 0.0 0.0 0.0 0.0 0.0
Deans -1.0 0.0 0.0 0.0 0.0
Counselors 0.0 0.0 0.0 0.0 0.0
Spoken Word 0.0 0.0 0.0 0.0 0.0
Title I 0.0 0.0 0.0 0.0 0.0
Faculty Senate 0.0 0.0 0.0 0.0 0.0
Librarian 0.0 0.0 0.0 0.0 0.0
Program Chair 0.0 0.0 0.0 0.0 0.0
Psychologists 0.0 0.0 0.0 0.0 0.0
Social Work 0.0 0.0 0.0 0.0 0.0
Speech Therapist 0.0 0.0 0.0 0.0 0.0
FTE change: 1.4 3.8 3.0 8.1 9.3
Certified Staff Changes (FTE) - Projections
Certified Staff Assumptions
Oak Park and River Forest HS District 200
Certified Staff (FTE) Staffing Ratios
224.1 225.5 229.3 232.3 240.4 249.7
0.0
50.0
100.0
150.0
200.0
250.0
300.0
2013 2014 2015 2016 2017 2018
FACULTY SENATE FTE
Actual Projected
© 2011 PMA Financial Network, Inc.
Page: 28
09/13/12 - 9:34 AM All Assumptions have been provided by the District.

Integrity Commitment Performance
Levy Year 2008 2009 2010 2011 2012 2013 2014 2015 2016 2017
CONSUMER PRICE INDEX 4.10% 0.10% 2.70% 1.50% 3.00% 2.00% 2.00% 2.00% 2.00% 2.00%
EQUALIZED ASSESSED VALUATION $2,337,528,355 $2,485,435,195 $2,554,919,343 $2,170,008,263 $2,149,808,180 $2,172,806,262 $2,369,858,826 $2,347,660,238 $2,372,636,840 $2,615,445,962
% CHANGE 6.33% 2.80% -15.07% -0.93% 1.07% 9.07% -0.94% 1.06% 10.23%
NEW GROWTH $15,787,182 $3,644,262 $66,483,192 $19,865,065 $1,500,000 $1,500,000 $1,500,000 $1,500,000 $1,500,000 $29,271,806
% OF TOTAL EAV 0.68% 0.15% 2.60% 0.92% 0.07% 0.07% 0.06% 0.06% 0.06% 1.12%
EXISTING PROPERTIES $144,262,578 $3,000,956 ($404,776,145) ($21,700,083) $21,498,082 $195,552,564 ($23,698,588) $23,476,602 $213,537,316
% OF TOTAL EAV-1YEAR 6.17% 0.12% -15.84% -1.00% 1.00% 9.00% -1.00% 1.00% 9.00%
Oak Park and River Forest HS District 200Equalized Assessed Valuation Analysis
$2,338 $2,485 $2,555
$2,170 $2,150 $2,173 $2,370 $2,348 $2,373
$2,615
$0
$500
$1,000
$1,500
$2,000
$2,500
$3,000
2008 2009 2010 2011 2012 2013 2014 2015 2016 2017
Total EAV Analysis (In Millions)
Actual Projected
6.3%
2.8%
-15.1%
-0.9%
1.1%
9.1%
-0.9%
1.1%
10.2%
-20%
-15%
-10%
-5%
0%
5%
10%
15%
2009 2010 2011 2012 2013 2014 2015 2016 2017
Total EAV % Change
Actual Projected
6.2%
0.1%
-15.8%
-1.0%
1.0%
9.0%
-1.0%
1.0%
9.0%
-20%
-15%
-10%
-5%
0%
5%
10%
15%
2009 2010 2011 2012 2013 2014 2015 2016 2017
Existing EAV % Change
Actual Projected
$15.8
$3.6
$66.5
$19.9
$1.5 $1.5 $1.5 $1.5 $1.5
$29.3
$0.0
$10.0
$20.0
$30.0
$40.0
$50.0
$60.0
$70.0
2008 2009 2010 2011 2012 2013 2014 2015 2016 2017
New Growth (In Millions)
Actual Projected
© 2011 PMA Financial Network, Inc.
Page: 29
09/13/12 - 9:34 AM All Assumptions have been provided by the District.

Integrity Commitment Performance
2012 2013 2014 2015 2016 2017
Extension Rate Extension Rate Extension Rate Extension Rate Extension Rate Extension Rate Extension Rate
Education Fund 47,256,832 2.1777 48,488,275 2.2555 49,208,287 2.2647 49,841,221 2.1031 50,443,838 2.1487 51,069,531 2.1524 52,567,689 2.0099
Special Education 678,714 0.0313 678,707 0.0316 678,707 0.0312 678,707 0.0286 678,707 0.0289 678,707 0.0286 678,707 0.0259
Operation & Maintenance Fund 7,181,169 0.3309 7,781,097 0.3619 9,781,097 0.4502 10,381,097 0.4380 10,981,097 0.4677 11,581,097 0.4881 12,181,097 0.4657
Bond & Interest Fund 3,092,439 0.1425 2,570,655 0.1196 2,619,692 0.1206 2,657,792 0.1121 2,541,047 0.1082 1,054,418 0.0444 - -
Transportation Fund 891,096 0.0411 891,087 0.0414 891,087 0.0410 891,087 0.0376 891,087 0.0380 891,087 0.0376 891,087 0.0341
IMRF & Social Security Fund 1,397,214 0.0644 1,497,220 0.0696 1,597,220 0.0735 1,697,220 0.0716 1,697,220 0.0723 1,697,220 0.0715 1,597,220 0.0611
Social Security/Medicare-Only 1,197,212 0.0552 1,197,220 0.0557 1,197,220 0.0551 1,197,220 0.0505 1,197,220 0.0510 1,197,220 0.0505 1,197,220 0.0458
Working Cash Fund 1,085,004 0.0500 1,074,904 0.0500 1,075,654 0.0495 1,087,153 0.0459 1,173,830 0.0500 1,174,580 0.0495 1,200,954 0.0459
Tort Fund 1,186,308 0.0547 1,221,885 0.0568 1,246,322 0.0574 1,271,249 0.0536 1,400,000 0.0596 1,600,000 0.0674 1,800,000 0.0688
Fire Prevention and Safety Fund 2,170,008 0.1000 2,149,808 0.1000 650,000 0.0299 650,000 0.0274 630,000 0.0268 630,000 0.0266 630,000 0.0241
TOTALS 66,135,996 3.0477 67,550,857 3.1422 68,945,287 3.1731 70,352,746 2.9686 71,634,046 3.0513 71,573,860 3.0166 72,743,974 2.7813
TAX-CAPPED TOTAL 63,043,557 2.9052 64,980,203 3.0226 66,325,595 3.0525 67,694,954 2.8565 69,092,999 2.9431 70,519,442 2.9722 72,743,974 2.7813
2011
Oak Park and River Forest HS District 200Extension Analysis and Consumer Price Index Assumptions
4.1%
0.1%
2.7%
1.5%
3.0%
2.0% 2.0% 2.0% 2.0% 2.0%
0.0%
0.5%
1.0%
1.5%
2.0%
2.5%
3.0%
3.5%
4.0%
4.5%
5.0%
2008 2009 2010 2011 2012 2013 2014 2015 2016 2017
Consumer Price Index (CPI) - by Levy Year
Actual Projected
2.62%2.47% 2.53%
3.05%3.14% 3.17%
2.97% 3.05% 3.02%
2.78%
0.0%
0.5%
1.0%
1.5%
2.0%
2.5%
3.0%
3.5%
2008 2009 2010 2011 2012 2013 2014 2015 2016 2017
Total Tax Rate (incl. Bonds)
Actual Projected
© 2011 PMA Financial Network, Inc.
Page: 30
09/13/12 - 9:34 AM All Assumptions have been provided by the District.
Integrity Commitment Performance
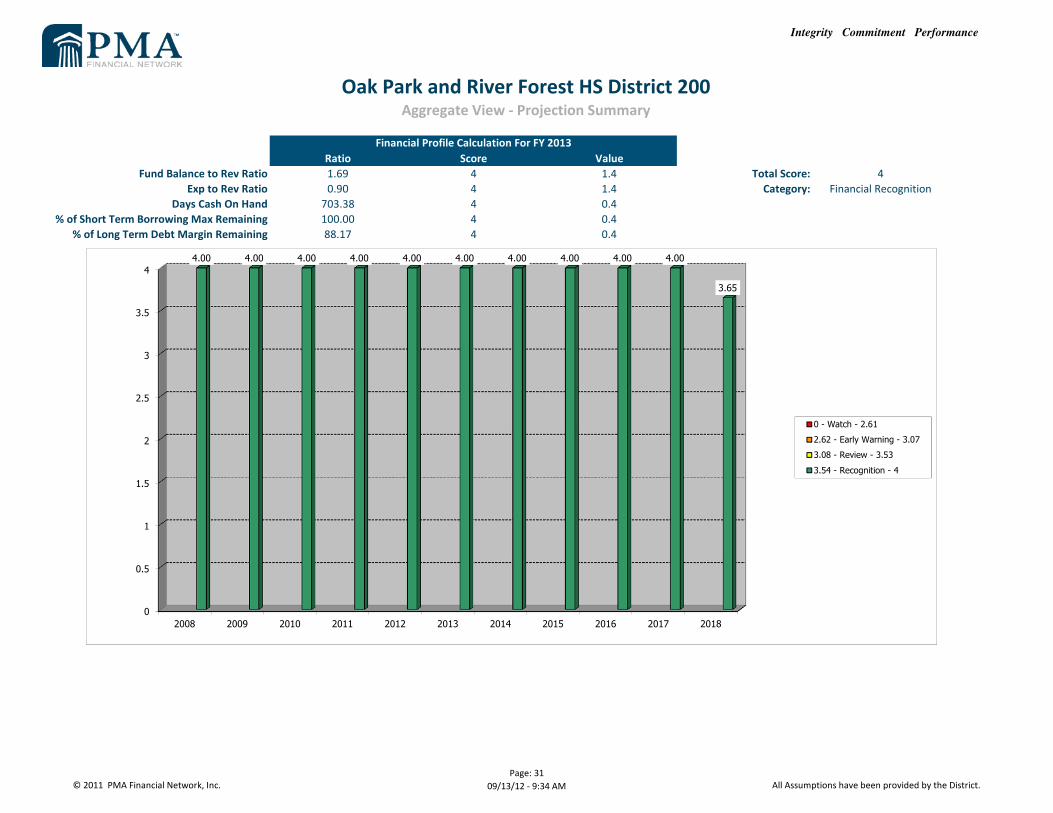
Ratio Score Value
Fund Balance to Rev Ratio 1.69 4 1.4 Total Score: 4
Exp to Rev Ratio 0.90 4 1.4 Category: Financial Recognition
Days Cash On Hand 703.38 4 0.4
% of Short Term Borrowing Max Remaining 100.00 4 0.4
% of Long Term Debt Margin Remaining 88.17 4 0.4
Oak Park and River Forest HS District 200Aggregate View - Projection Summary
Financial Profile Calculation For FY 2013
0
0.5
1
1.5
2
2.5
3
3.5
4
2008 2009 2010 2011 2012 2013 2014 2015 2016 2017 2018
4.00 4.00 4.00 4.00 4.00 4.00 4.00 4.00 4.00 4.00
3.65
0 - Watch - 2.61
2.62 - Early Warning - 3.07
3.08 - Review - 3.53
3.54 - Recognition - 4
© 2011 PMA Financial Network, Inc.
Page: 31
09/13/12 - 9:34 AM All Assumptions have been provided by the District.