fixed income investor presentation - tesco plc · alan stewart – cfo, shubhi rao – group...
TRANSCRIPT
14 April 2016
Preliminary Results – Fixed Income Investor Call Alan Stewart – CFO, Shubhi Rao – Group Treasurer
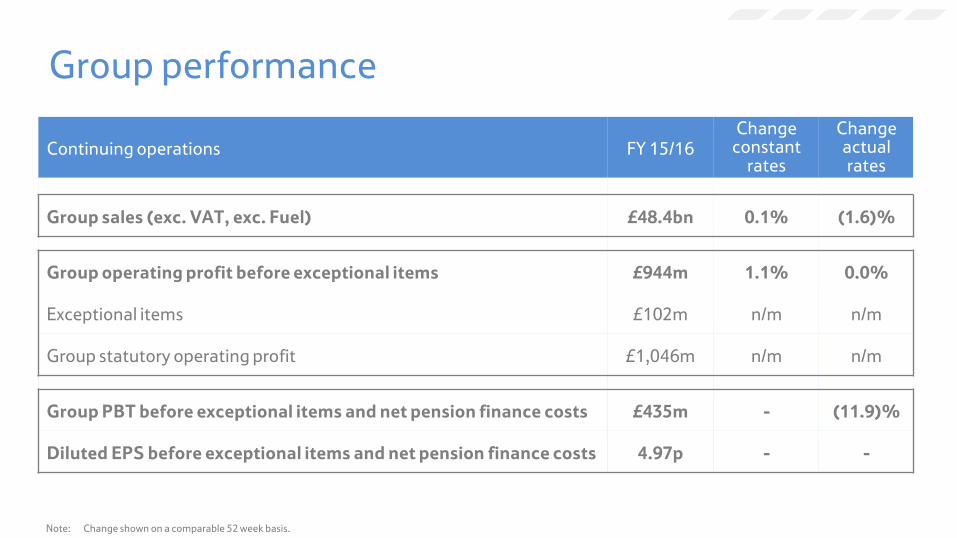
Group performance
Continuing operations FY 15/16 Change
constant rates
Change actual rates
Group sales (exc. VAT, exc. Fuel) £48.4bn 0.1% (1.6)%
Group operating profit before exceptional items £944m 1.1% 0.0%
Exceptional items £102m n/m n/m
Group statutory operating profit £1,046m n/m n/m
Group PBT before exceptional items and net pension finance costs £435m - (11.9)%
Diluted EPS before exceptional items and net pension finance costs 4.97p - -
Note: Change shown on a comparable 52 week basis.
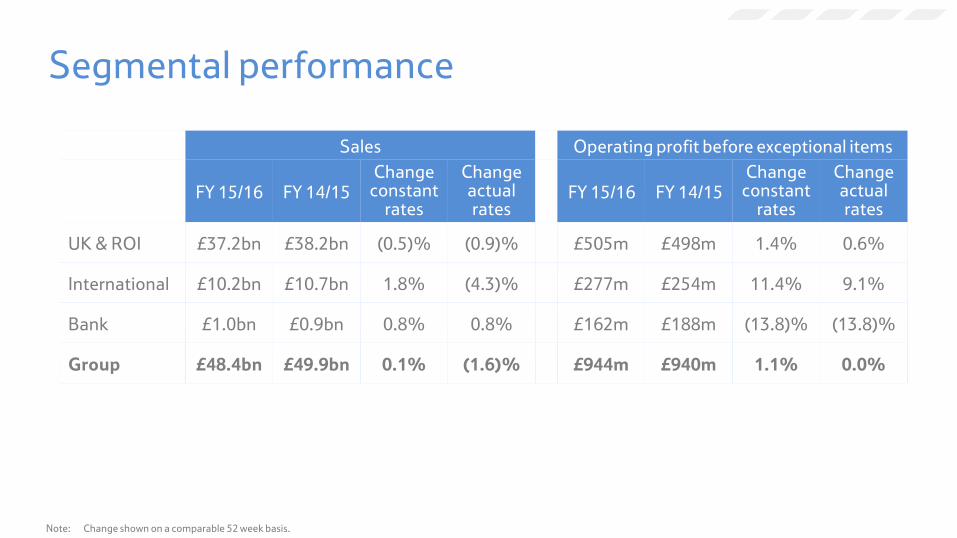
Segmental performance
Sales Operating profit before exceptional items
FY 15/16 FY 14/15 Change
constant rates
Change actual rates
FY 15/16 FY 14/15 Change
constantrates
Change actual rates
UK & ROI £37.2bn £38.2bn (0.5)% (0.9)% £505m £498m 1.4% 0.6%
International £10.2bn £10.7bn 1.8% (4.3)% £277m £254m 11.4% 9.1%
Bank £1.0bn £0.9bn 0.8% 0.8% £162m £188m (13.8)% (13.8)%
Group £48.4bn £49.9bn 0.1% (1.6)% £944m £940m 1.1% 0.0%
Note: Change shown on a comparable 52 week basis.
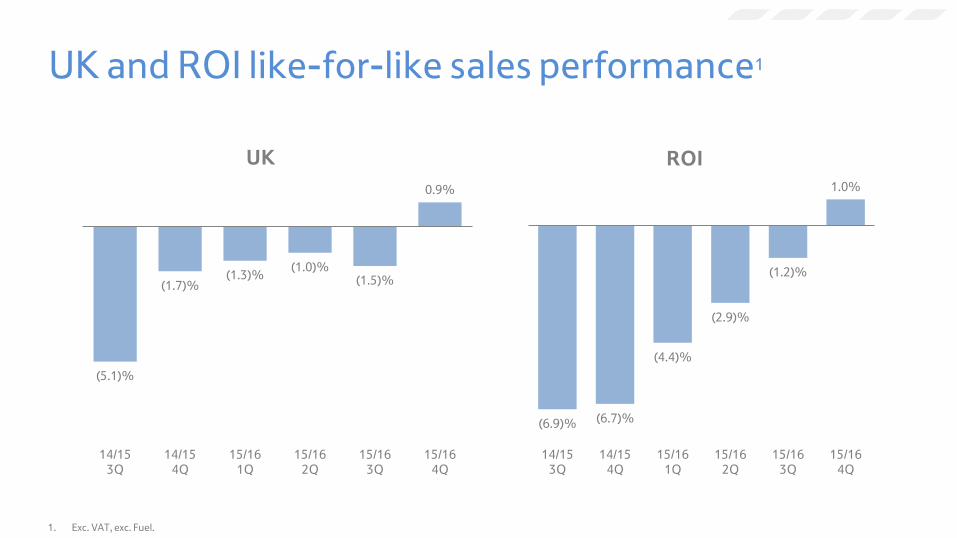
(5.1)%
(1.7)% (1.3)%
(1.0)% (1.5)%
0.9%
(8.0)%
(6.0)%
(4.0)%
(2.0)%
0.0%
14/15
3Q
14/15
4Q
15/16
1Q
15/16
2Q
15/16
3Q
15/16
4Q
UK
UK and ROI like-for-like sales performance1
(6.9)% (6.7)%
(4.4)%
(2.9)%
(1.2)%
1.0%
(8.0)%
(6.0)%
(4.0)%
(2.0)%
0.0%
14/15
3Q
14/15
4Q
15/16
1Q
15/16
2Q
15/16
3Q
15/16
4Q
ROI
1. Exc. VAT, exc. Fuel.

UK like-for-like sales performance
Online FY 15/16: Grocery 8.8% General Merchandise (2.1)% Clothing 6.7%
(6.3)%
(2.2)% (2.4)%
(1.1)%
(3.2)%
(0.3)%
14/15
3Q
14/15
4Q
15/16
1Q
15/16
2Q
15/16
3Q
15/16
4Q
Extra
(6.1)%
(2.5)%
(3.4)%
(2.3)%
(3.2)%
(0.7)%
14/15
3Q
14/15
4Q
15/16
1Q
15/16
2Q
15/16
3Q
15/16
4Q
Superstore
(5.1)%
(1.8)%
(0.2)% (0.2)%
(1.7)% (1.4)%
14/15
3Q
14/15
4Q
15/16
1Q
15/16
2Q
15/16
3Q
15/16
4Q
Metro
2.1%
4.5% 4.4% 4.1%
3.3% 3.0%
14/15
3Q
14/15
4Q
15/16
1Q
15/16
2Q
15/16
3Q
15/16
4Q
Express
1. UK like-for-like sales inc. VAT, exc. Fuel and statutory adjustments.

498
(409)
226
(345)
613
(78)
505
UK & ROI
FY 14/15
Lower
prices
Volume and
mix benefit
Investment in
customer offer
Net cost
savings
Other UK & ROI
FY 15/16
Rebuilding operating profit
£m
UK & ROI
FY 14/15
UK & ROI
FY 15/16

(45)
(226)
268
307
35 339
UK & ROI
H2 14/15
Lower
prices
Volume and
mix benefit
Net cost
savings
Other UK & ROI
H2 15/16
Rebuilding operating profit - 2H
UK & ROI
2H 14/15
UK & ROI
2H 15/16
£m
• Market share gains in 5 of 7 markets
• Strong volume growth
• Strong cash generation
– Operating cash up 87%
– Stock days reduced by 6 days
International performance

International like-for-like sales performance1
(6.2)%
(5.0)%
(3.4)%
0.1%
2.4%
3.5%
14/15
3Q
14/15
4Q
15/16
1Q
15/16
2Q
15/16
3Q
15/16
4Q
Asia
0.3%
3.1%
2.2%
4.0%
3.3%
4.1%
14/15
3Q
14/15
4Q
15/16
1Q
15/16
2Q
15/16
3Q
15/16
4Q
Europe
1. Exc. VAT, exc. Fuel.
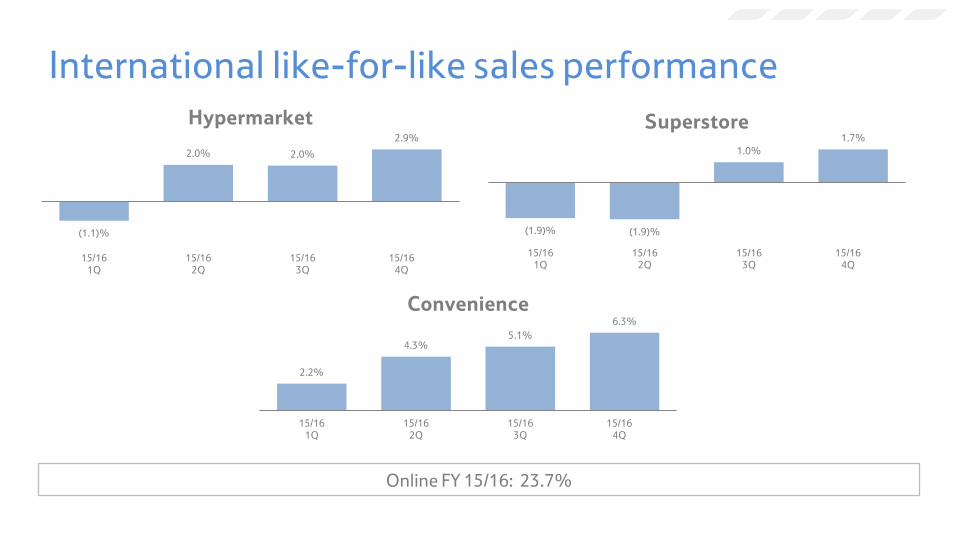
International like-for-like sales performance
Online FY 15/16: 23.7%
(1.1)%
2.0% 2.0%
2.9%
15/16
1Q
15/16
2Q
15/16
3Q
15/16
4Q
Hypermarket
(1.9)% (1.9)%
1.0%
1.7%
15/16
1Q
15/16
2Q
15/16
3Q
15/16
4Q
Superstore
2.2%
4.3% 5.1%
6.3%
15/16
1Q
15/16
2Q
15/16
3Q
15/16
4Q
Convenience
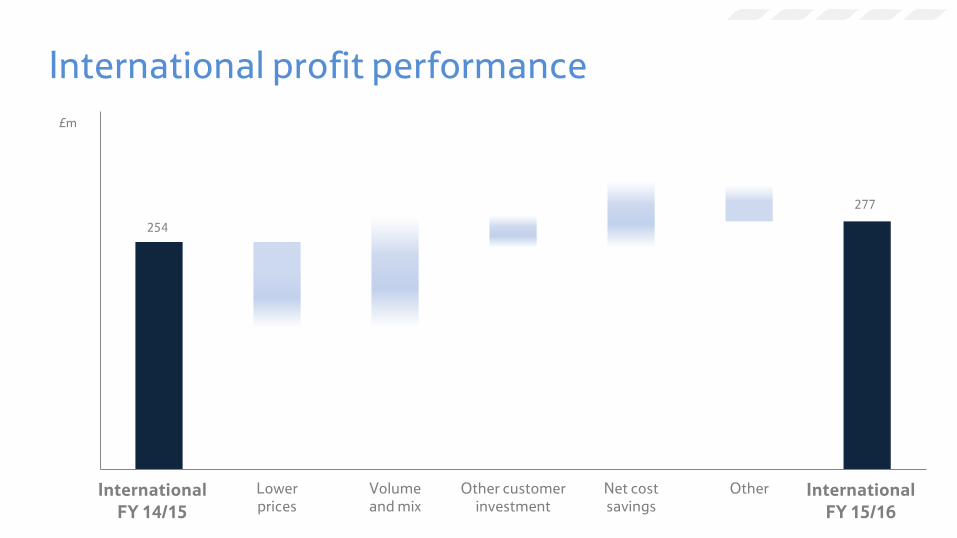
254
(95)
126
(37)
76
(47)
277
14/15 FY
Operating Profit
Lower
prices
Volume
and mix
Other customer
investment
Net cost
savings
Other 15/16 FY
Operating Profit
International profit performance
£m
International
FY 14/15
International
FY 15/16
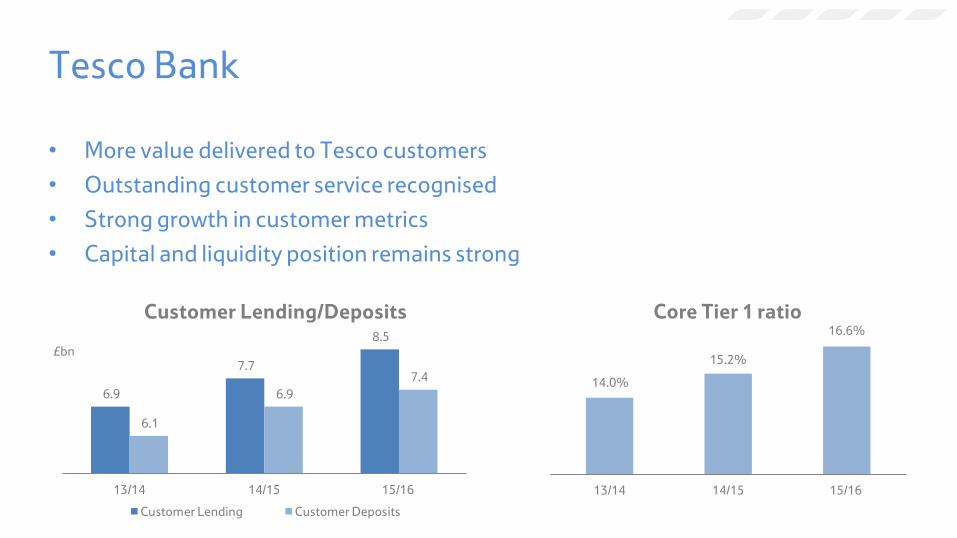
• More value delivered to Tesco customers
• Outstanding customer service recognised
• Strong growth in customer metrics
• Capital and liquidity position remains strong
Tesco Bank
6.9
7.7
8.5
6.1
6.9
7.4
13/14 14/15 15/16
Customer Lending/Deposits
Customer Lending Customer Deposits
£bn
14.0%
15.2%
16.6%
13/14 14/15 15/16
Core Tier 1 ratio
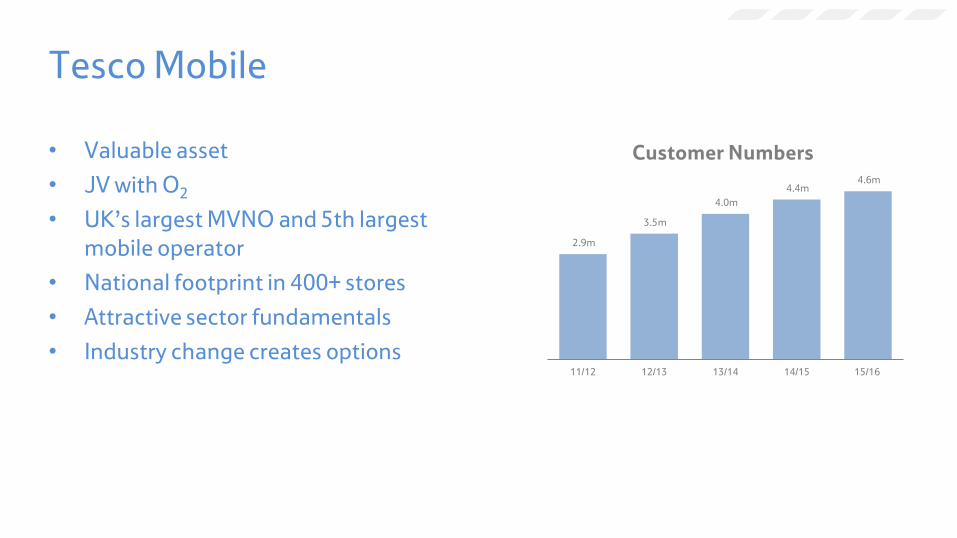
• Valuable asset
• JV with O2
• UK’s largest MVNO and 5th largest
mobile operator
• National footprint in 400+ stores
• Attractive sector fundamentals
• Industry change creates options
Tesco Mobile
2.9m
3.5m
4.0m
4.4m 4.6m
11/12 12/13 13/14 14/15 15/16
Customer Numbers

1. Statutory net finance costs include a £(220)m impact from FX losses on translation of sterling balances received from Korea disposal being held in a Euro subsidiary.
Finance income and costs
FY 15/16 FY 14/15
Interest payable £(504)m £(535)m
Capitalised interest £6m £44m
IAS 32 and 39 ‘Financial instruments’
– fair value measurements £(19)m £(26)m
IAS 19 net pension finance costs £(155)m £(134)m
Finance income £29m £80m
Net finance costs1 £(643)m £(571)m

• Effective tax rate affected by:
– Lower book value than tax value of properties disposed of in year
– Change in tax rate on deferred tax balances
– Unrecognised tax losses
Tax
Before
exceptional items Statutory
Profit before tax £280m £162m
Tax (charge) / credit £(8)m £54m
Effective tax rate 2.7% (33.2)%
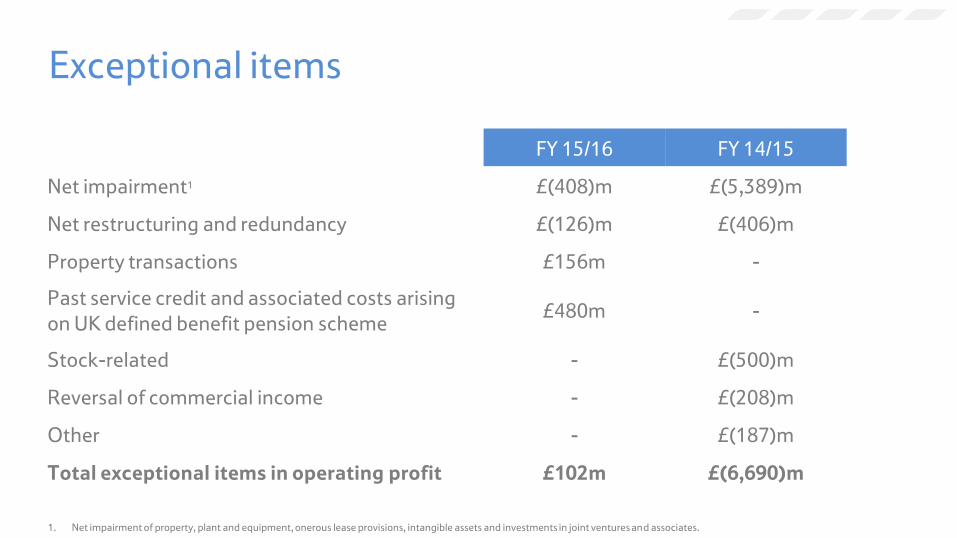
FY 15/16 FY 14/15
Net impairment1 £(408)m £(5,389)m
Net restructuring and redundancy £(126)m £(406)m
Property transactions £156m -
Past service credit and associated costs arising
on UK defined benefit pension scheme £480m -
Stock-related - £(500)m
Reversal of commercial income - £(208)m
Other - £(187)m
Total exceptional items in operating profit £102m £(6,690)m
Exceptional items
1. Net impairment of property, plant and equipment, onerous lease provisions, intangible assets and investments in joint ventures and associates.

Total indebtedness £m
18,532 (1,721) (232)
(1,234)
(4,117)
1,121
21,719
15,536
Opening total
indebtedness
FY 14/15
Change in
net debt
Change in
discounted
operating
leases
Change in
pension deficit
Total
indebtedness
before
Korea and
property
transactions
Korea Property
Transactions
Closing total
indebtedness
FY 15/16

Total indebtedness £m
21,719
15,536
Opening total
indebtedness
FY 14/15
Change in
net debt
Change in
discounted
operating
leases
Change in
pension deficit
Total
indebtedness
before
Korea and
property
transactions
Korea Property
Transactions
Closing total
indebtedness
FY 15/16
Pension deficit £2,612m
Discounted operating
leases £7,814m
Net debt £5,110m
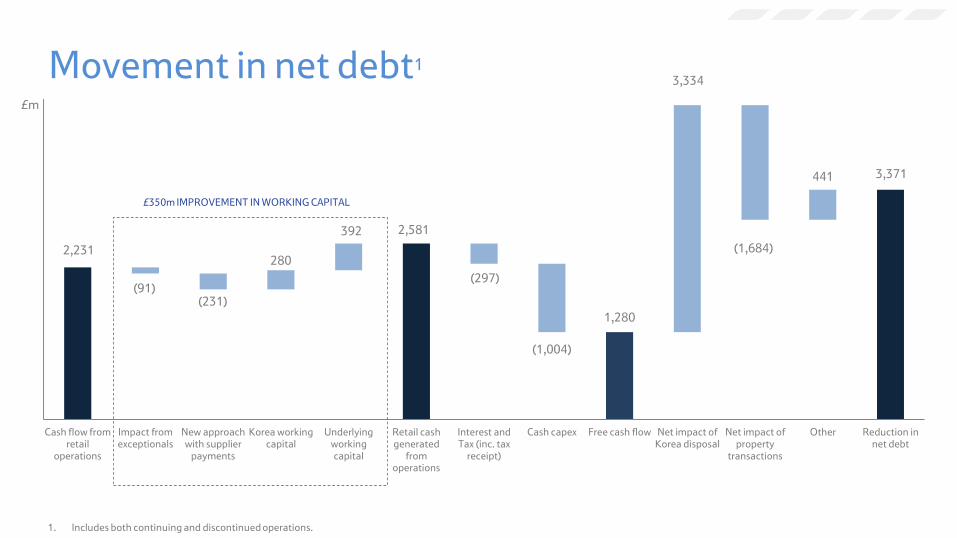
2,231
(91) (231)
280
2,581 392
(297)
(1,004)
1,280
3,334
(1,684)
441 3,371
Cash flow from
retail
operations
Impact from
exceptionals
New approach
with supplier
payments
Korea working
capital
Underlying
working
capital
Retail cash
generated
from
operations
Interest and
Tax (inc. tax
receipt)
Cash capex Free cash flow Net impact of
Korea disposal
Net impact of
property
transactions
Other Reduction in
net debt
Movement in net debt1
£m
£350m IMPROVEMENT IN WORKING CAPITAL
1. Includes both continuing and discontinued operations.
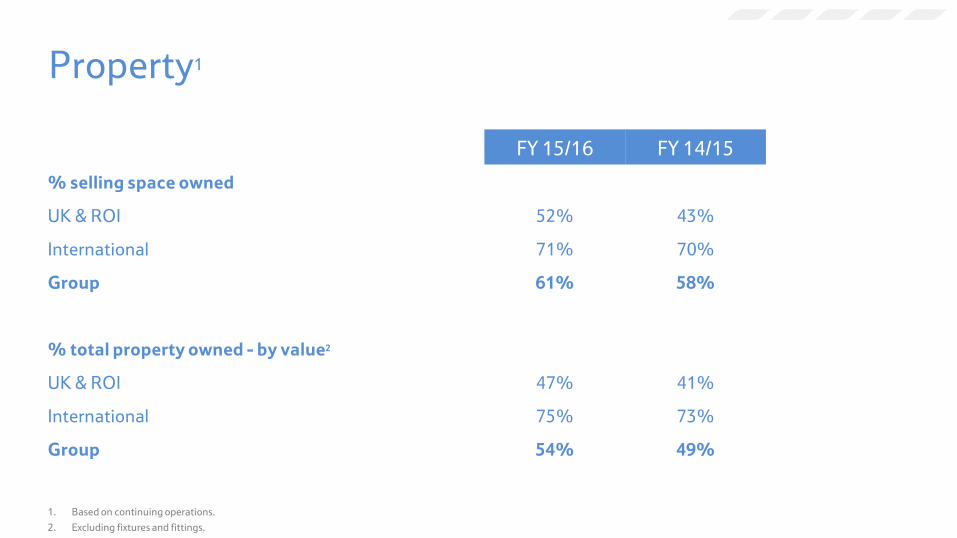
Property1
FY 15/16 FY 14/15
% selling space owned
UK & ROI 52% 43%
International 71% 70%
Group 61% 58%
% total property owned - by value2
UK & ROI 47% 41%
International 75% 73%
Group 54% 49%
1. Based on continuing operations.
2. Excluding fixtures and fittings.

• Significant progress made with pension scheme de-risking
– Defined benefit scheme replaced with defined contribution scheme
• £1.3bn reduction in deficit
– £480m exceptional actuarial credit resulting from RPI to CPI index change
– Part-year payment under £270m per annum funding plan
• Greater certainty on future cash contributions
Pensions

• £4.4bn available cash
• £5.0bn committed facilities in place
– £2.6bn RCF
– £2.4bn bilaterals
• Strong funding and liquidity profile
Strong liquidity
£bn
0.0
1.0
2.0 Debt Maturity Profile
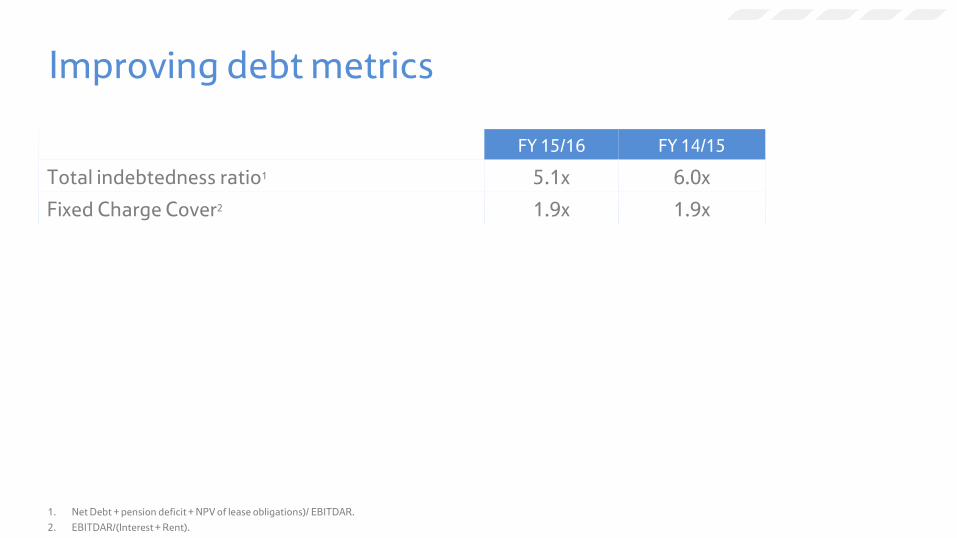
Improving debt metrics
FY 15/16 FY 14/15
Total indebtedness ratio1 5.1x 6.0x
Fixed Charge Cover2 1.9x 1.9x
1. Net Debt + pension deficit + NPV of lease obligations)/ EBITDAR.
2. EBITDAR/(Interest + Rent).
• Positive sales momentum across the Group
• Rebuilding profitability
• Improved cash generation
• Significant reduction in total indebtedness
• Strong liquidity
• Strengthening balance sheet
Financial summary
This document may contain forward-looking statements that may or may not prove accurate. For example, statements regarding expected revenue growth and operating margins, market trends and our product pipeline are forward-looking statements. Phrases such as "aim", "plan", "intend", "anticipate", "well-placed", "believe", "estimate", "expect", "target", "consider" and similar expressions are generally intended to identify forward-looking statements. Forward-looking statements involve known and unknown risks, uncertainties and other factors that could cause actual results to differ materially from what is expressed or implied by the statements. Any forward-looking statement is based on information available to Tesco as of the date of the statement. All written or oral forward-looking statements attributable to Tesco are qualified by this caution. Tesco does not undertake any obligation to update or revise any forward-looking statement to reflect any change in circumstances or in Tesco’s expectations.
Disclaimer