flexible carpooling: a compendium - trip …it is not clear why informal flexible carpooling has not...
TRANSCRIPT

2012
Paul Minett
Trip Convergence Ltd
Updated March 2012
Flexible Carpooling: A Compendium
FLEXIBLE CARPOOLING: A COMPENDIUM
Contents
1. Executive Summary .................................................................................................................................................................. 3 2. Introduction ............................................................................................................................................................................. 4 3. Defining Flexible Carpooling .................................................................................................................................................... 5 4. The Extent of Flexible Carpooling ............................................................................................................................................ 7
4.1. The Extent of Informal Flexible Carpooling ............................................................................................... 7
4.2. The Extent of Formal Flexible Carpooling .................................................................................................. 9 5. How Flexible Carpooling Operates ........................................................................................................................................... 9
5.1. How Informal Flexible Carpooling Operates .............................................................................................. 9
5.1.1. Carpool Formation ................................................................................................................................... 9
5.1.2. No Pre-Qualification ................................................................................................................................ 9
5.1.3. Safety ....................................................................................................................................................... 9
5.1.4. Gender ................................................................................................................................................... 10
5.1.5. Other Demographics .............................................................................................................................. 10
5.1.6. Frequency of Use ................................................................................................................................... 10
5.1.7. Drivers are Not Always Drivers .............................................................................................................. 10
5.1.8. Use of Other Modes ............................................................................................................................... 11
5.1.9. Reasons for using Casual Carpooling/Slugging ...................................................................................... 11
5.1.10. Conversation .......................................................................................................................................... 11
5.1.11. Radio Stations ........................................................................................................................................ 11
5.1.12. Numbers of Carpools Formed for a Single Route .................................................................................. 11
5.1.13. How Riders Access the Casual Carpooling Pick-up Location .................................................................. 12
5.1.14. San Francisco ......................................................................................................................................... 14
5.1.15. Northern Virginia/Washington, DC ........................................................................................................ 15
5.1.16. Houston, TX ............................................................................................................................................ 18
5.2. Explaining Why Informal Flexible Carpooling Works ............................................................................... 18
5.3. How Formal Flexible Carpooling Operates .............................................................................................. 19
5.3.1. Flexible Ridesharing in Marin County, California ................................................................................... 19
5.3.2. Trip Convergence, Auckland, New Zealand ........................................................................................... 22
5.3.3. WSDOT Flexible Carpooling Pilot, Seattle .............................................................................................. 23
5.3.4. Express Carpooling Pilot, Auckland, New Zealand ................................................................................. 24 6. The Impact of Flexible Carpooling .......................................................................................................................................... 24 7. The Outlook for Flexible Carpooling ...................................................................................................................................... 25 8. What is Not Known About Flexible Carpooling ...................................................................................................................... 25
8.1. Catalyzing a New Flexible Carpooling Route ........................................................................................... 25
8.2. Market Share and Physical Characteristics Required .............................................................................. 26
8.3. Customers Desired Outcomes ................................................................................................................. 26
8.4. Response to Shocks ................................................................................................................................. 26 9. References ............................................................................................................................................................................. 26 Appendix 1: Rules and Etiquettes of Casual Carpooling ................................................................................................................ 28
Updated: March 2012
Cover Picture: Casual Carpoolers at North Berkeley BART Station, Berkeley, CA

Page 3 of 28
1. EXECUTIVE SUMMARY Flexible carpooling is characterized by shared trips where there is no prearrangement to carpool, and carloads are
made up “on the fly” at dedicated meeting-places with dedicated destinations. The absence of a pre-arrangement
step sets flexible carpooling apart from all other carpool formation methods.
This compendium of information about flexible carpooling sets out what is known, and identifies what is not
known, about this unusual approach to carpool formation.
It describes three examples of informal flexible carpooling, arising spontaneously from local travel communities.
They are:
San Francisco (with about 2,500 3-person carpools daily – locally known as casual carpools);
Northern Virginia/Washington DC (with about 3,000 3-person carpools daily – locally known as the slug lines);
Houston TX (with about 300 3-person carpools daily – locally known as the slug lines)
In all three cases the system operates where there is an HOV3 facility. Carpools are formed for the benefit of using
the HOV3 lane. It is not clear why informal flexible carpooling has not arisen in other locations where there are
HOV3 lanes. It has been estimated that San Francisco gains in the order of $30 million per year in benefits from its
system.
It is also not clear why flexible carpooling has not been targeted as a method for reducing traffic at low cost in
every city of the world. However, there are no operational examples of formal flexible carpooling, (where it is part
of the formal transport system in a city, and has some form of registration and identification system for
participants).
Formal flexible carpooling was tested with limited success in Marin County in 1979/80 to provide back-up
transportation in case of a bus strike or non-availability of fuel. The project had about 1,400 participants, but
appears to have had a low utilization rate and it was closed down when its budget ran out.
More recently Trip Convergence Ltd attempted to catalyze a formal flexible carpooling service in Auckland, New
Zealand, but failed to attract enough participants to launch. At the same time the Washington State Department
of Transportation carried out a much better funded pilot project in Seattle to use an iPhone application to match
riders and drivers, and failed to launch for the same reason.
The existence of informal flexible carpooling, and that several thousand people use it each day, suggests that it
could be a mechanism for reducing traffic. There are 84 identifiable informal flexible carpooling routes, ranging in
size from one to 314 carpools formed. The origin of nine of these routes, the Horner Road VA parking lot, is
responsible for converting a full lane of traffic to just one third of a lane, with a full car departing every 6.5 seconds
during peak. The economic value to the transport system is immense.
This compendium begins by defining flexible carpooling, and ends by identifying what is not known: how to
catalyze a new flexible carpooling route; what market share to expect; what physical characteristics would favor
the system; what would motivate new users; and how resilient the system would be to shocks.
As we move into a new era of high oil prices in early 2012, many of the reasons for using carpooling to reduce
traffic are with us again. Flexible carpooling could be a valuable addition to the transportation system in your city.
You can learn more about it here.
Page 4 of 28
2. INTRODUCTION Ridesharing is known to be a very cost effective mode of transportation. Informal flexible carpooling (slug lines,
casual carpooling) is effective in some cities to get people to work; park-and-ride lots are sometimes full, limiting
growth in transit service; flexible carpooling to transit stations may be a solution to this problem.
In 2007 Trip Convergence successfully applied for funding under a program of the Washington State Department of
Transport (WSDOT), the Trip Reduction Performance Program (TRPP), to establish a pilot project for a formalized
flexible carpooling system. The intent of the project was to use a well-located park-and-ride facility near Seattle as
an origin-end park for 100 member participants to leave their cars, flexibly carpooling in 50 other members’ cars to
a major employment destination, without trip-by-trip pre-arrangement of specific driver-rider combinations. The
project did not proceed, in part because it was found that all well-located park-and-ride facilities had no spare
capacity that could be diverted to use by carpoolers. In fact it was found that vanpoolers already using such
facilities for forming vanpools were being negotiated out of the park-and-ride facilities into smaller adjacent lots in
order to enable greater use of the park-and-ride facilities by people who would then use the transit services.
Observing that growth of transit ridership was being constrained by a shortage of well placed park-and-ride
capacity, Trip Convergence proposed to explore flexible carpooling to transit stations as a means of increasing
transit ridership using existing park-and-ride infrastructure. With support from WSDOT, King County Metro, and
Sound Transit an application was made to Transit IDEA (a TRB funded program to test ‘Ideas Deserving of
Exploratory Analysis’). This paper, Flexible Carpooling: A Compendium, is the first output of the approved project,
T-61: Flexible Carpooling to Transit Stations. It is intended as a compilation of knowledge about flexible carpooling
for the purpose of informing development of a new service. Project funding from the National Academy of
Sciences, through the TRB and the Transit IDEA Program, is acknowledged.
In addition to reviewing what is known about flexible carpooling, in later phases the project will:
carry out a study of draw areas (catchment) and usage patterns of some popular Seattle-area transit park-
and-ride facilities;
identify potential origin locations for flexible carpooling routes to one or more of those stations; and
develop a project plan and budget for a field operating trial.
Funding for the field operating trial is not included in this project.
The following sections:
define flexible carpooling (including a proposed carpool classification system based on formation
typologies); (Section 2)
describe the extent of both informal and formal flexible carpooling; (Section 3)
explore the features of existing, former, and proposed flexible carpooling systems; (Section 4)
report estimates of the impact of flexible carpooling; (Section 5)
identify anticipated future developments of flexible carpooling; (Section 6) and
tabulate what is not yet known or understood about flexible carpooling (Section 7).
This report has been updated in March 2012.

Page 5 of 28
3. DEFINING FLEXIBLE CARPOOLING Jared leaves home shortly after 8 am. He walks a few blocks to the intersection of College and Claremont.
On the sidewalk near the Safeway store stands a line of people. The front of the line is next to a sign that
declares: ‘Car Pool Vehicles Load Here’. Jared joins the back of the line. A car pulls up and the two people
at the front of the line get into the car. The car leaves and the whole line shuffles forward. Another car
pulls up, two more people leave and the line shuffles forward again. Jared is about five from the front.
More people have joined the line behind him. A tall man approaches the line with a video camera. “Can I
interview you?” he asks various people in the line. Others say no, but Jared agrees. The man introduces
himself, “Paul”.
“Why do you do use the casual carpooling, Jared?” Paul asks. Jared thinks for a moment. This is a
question he has been asked before. Choosing his words carefully, he says: “because it’s efficient, it’s
comfortable, it’s cheap, and it’s good for society”. There are a few other questions, such as “how long
have you been doing this?”, and “could it be improved in any way?”, and then Paul moves on to interview
some other people, and Jared and the person next to him get into the next car.
Jared probably doesn’t know the other rider, nor does he know the driver, although they all might have seen each
other in the system previously. They will probably say “good morning” at the beginning of the journey, and then
possibly take the 20 mile trip into downtown San Francisco in silence, using the carpool lane on the 880 freeway,
bypassing the toll booth1 and the ramp meter before getting onto the double deck Bay Bridge. They will most
likely all three say ‘thanks’ when they are dropped off at the corner of Fremont and Mission Streets, just off the
freeway. They all say ‘thanks’ because they all feel they have gained: the driver for being able to use the fast lane
and not pay a toll, and the riders for having received a fast, free ride, saving the fare on the bus or train, or the cost
of driving and parking their own vehicle.
It is possible that ‘good morning’ and ‘thanks’ will be the extent of the conversation. A website that supports the
system suggests that ‘conversation is at the discretion of the driver’, as is the choice of radio station (RideNow,
2009).
Jared is one of an estimated 6,000 people each morning who get a ride in the casual carpooling system that
operates from about twenty-two pick-up points around the East Bay area including Alameda, Contra Costa and
Solano Counties into downtown San Francisco. According to a survey carried out in 1998, about 9% of these
people will line up to use the same system in reverse in the evening (Beroldo, 1999). The rest will use Bay Area
Rapid Transit (BART), or Alameda County Transit (AC Transit) for the return journey. For many years it was
believed that this system damaged AC Transit’s business, but more recently they have changed their opinion. In an
article in the Oakland Tribune, John Knox-White of the Alameda Transportation Commission explained that AC
Transit gets better efficiency from its bus fleet because the same assets that are used for school trips in the
morning and afternoon can be used in the evening to move the casual carpoolers back across the Bay Bridge
(Knox-White 2008).
The author classifies this system, where there is regular carpooling that involves no trip-by-trip pre-arrangement
between the participants, as flexible carpooling, see Figure 1. The term flexible is used to contrast with the more
1 On July 1 2010 the Bay Area Tolling Authority implemented tolls for carpoolers on the Bay Bridge. From that date
all carpoolers must use a transponder, and pay a discounted toll of $2.50. The full toll during peak hours is $6.00, and off peak it is $5.00. The casual carpooling system carries on.

Page 6 of 28
traditional form of carpooling in which participants make an arrangement in advance, whether for single use or for
regular, ongoing sharing of rides. It is observed that this flexibility allows participants to:
opt in or out of the system right up until getting into another participant’s car, or allowing another
participant to get into their car;
participate as a rider or a driver, and switch at will, each day, between riding and driving; and
arrive to use the system at different times from day to day;
all without any requirement to inform other participants. It is contrasted with the more recently available dynamic
(pre-arranged) carpooling in which single use carpools are formed sometimes only minutes in advance (though
often longer) using cell-phones or mobile internet devices and computer based matching algorithms. Such
arrangements are seen to become ‘inflexible’ as soon as they have been made.
Figure 1: Classification of Carpooling Based on Method of Formation
The casual carpooling described above is classified as informal flexible carpooling. The informality that is observed
is that there is no process by which the participants are screened or identified, as drivers or riders. There are no
entry criteria except for arriving and lining up, whether as a rider standing in the line, or as a driver waiting in the
line of cars. The term ‘casual’ is apt, though in two other locations the same system is referred to as ‘slug lines’, an
epithet that requires greater explanation that will be provided later.
A 1978/9 demonstration project in Marin County was probably the first (and as far as the author knows, the only)
implemented example of what is classified as formal flexible carpooling, where an effort was made to establish
membership and to use identification, and cause casual carpooling to operate in a slightly more formal manner. In
that project, riders and drivers signed up in-person at a recruiting desk and were issued with a placard that they
could use for identifying themselves and advertising their destination. Riders could line up at Marin County bus
stops (with the blessing of the Golden Gate Bridge and Highway District, who operated the bus services and in part
sponsored the project) and by holding out their placard request a ride with a participating driver, usually into
downtown San Francisco. Drivers wrote their destination on their placard and attached it to their sun visor where
it was visible to potential riders. (Dorosin, 1981).
The project explored the idea of setting a price on the rides provided, and went as far as to recommend amounts
that could change hands, but these arrangements were left to the discretion of the participants. By having
Carpooling
Pre-arranged Carpools
Traditional Carpooling
Workplace or database focus
Dynamic Ridesharing
Mobile internet devices and databases
Social Network Carpooling
Affinity group focus
Flexible Carpools
Informal Flexible Carpooling (Slugging)
Flexible schedule from meeting
places
Formalized Flexible
Carpooling
As above plus pre-screening
and technology
Page 7 of 28
registered participants the project managers were able to have an ongoing conversation with them, and used
telephone interviews and focus group sessions to gather information about the use and operation of the system.
In the mid 2000s Trip Convergence, a company from Auckland, New Zealand, described and patented a
membership-based system of formal flexible carpooling that would involve no trip-by-trip pre-arrangement of
rides, that would provide convergence-point parking for riders to leave their cars in ‘park-and-pool’ stations, and
that would use modern technologies for identification, tracking participation, and sharing benefits. Sign-up would
be on-line (a term that would not have had much meaning in 1978 in Marin County despite its proximity to Silicon
Valley), applicants would be screened, and the technology for identification would be collected rather than mailed,
enabling confirmation of identity.
4. THE EXTENT OF FLEXIBLE CARPOOLING Carpooling, or sharing of rides in private cars, is also known as car-sharing in the United Kingdom, and ridesharing
in some jurisdictions. It is a somewhat invisible transport solution, in that a car from a distance looks the same
regardless of how many people are inside it. Public transport systems such as buses and trains often count their
riders so that they can report their successes and access funding; however there has been no such need for
reporting of the occupancy of private vehicles. Statistics regarding average vehicle occupancy are based on short-
term observations of vehicles at intersections or on roadways. Other key sources of such statistics are the census
and surveys such as the American Community Survey, which ask questions about ‘mode of transport to work’, but
not about transport used for other activities. While ‘carpool’ may be an available answer for ‘mode to work’,
together with indicating how many people are in the carpool, there is no optional answer that would reveal how
the carpool was formed.
4.1. THE EXTENT OF INFORMAL FLEXIBLE CARPOOLING
Research reveals three sizable informal flexible carpooling systems: San Francisco, CA; Northern
Virginia/Washington, DC; and Houston, TX. There are occasional references to other locations where similar
activity is reported to occur, including Los Angeles, Pittsburgh, and Seattle, though in the case of the latter three
the author has been unable to find any reports that suggest the activity is occurring on a regular basis, or research
that identifies pick-up points and routes. Even in the sizable systems (San Francisco, Washington DC, and Houston)
there is no mechanism for regularly tracking the number of participants. However for various reasons there have
been surveys carried out in each of these locations that provide some information about how much informal
flexible carpooling is occurring.
The Transit Cooperative Research Program, Report 95, Chapter 2: HOV Facilities, Traveller Response to
Transportation System Changes, sponsored by the Federal Transit Administration, includes an excellent review of
casual carpooling (TRB, 2006).
The most recent counts are as follows (see Figure 2):
San Francisco, CA, (1998), 6,000 riders and 3,000 drivers for 9,000 participants in total each morning, and about 9%
as many in the evening, from a survey by Rides for Bay Area Commuters. The riders get picked up from
approximately 22 locations, and dropped off in one downtown location (Beroldo, 1999). Counts occurred in 2010
and 2011 and on a like-for-like basis 2010 was down on 1998 by about 13%, and 2011 was down on 1998 by about
21% (511 Rideshare, 2010; and Deakin et al., 2011). In the year following imposition of tolls for carpoolers on the
Bay Bridge, on a like-for-like basis the total casual carpools formed was down 9% from 1,910 to 1,731 (reporting

Page 8 of 28
counts at 13 of (now) 24 morning locations). Neither of the 2010 and 2011 reports estimated the total number in
the way the 1998 report had done. It is likely that had they done so, the 2011 estimate would be that there are
about 5,000 riders and 2,500 drivers for 7,500 participants.
Washington, DC, (2006), 6,459 riders and 3,229 drivers for 9,688 participants in total each morning, with no
statistics about the evening, from a survey by Vanasse Hangen Brustlin, Inc, on behalf of the Virginia Department
of Transportation (VDOT). A 1998 count at the evening end found 2,200 evening slugs (VDOT, 2006). The riders
get picked up from approximately 21 origin locations and dropped off in multiple destination locations. The largest
of these destinations is the Pentagon, the destination of 2,151 slugs (and about 1,075 drivers). Anecdotal evidence
suggests that many of the riders catch Metro at the Pentagon stop to carry on to more distant destinations.
Houston, TX, (2006 report of 2003 data), 578 riders and 289 drivers for 867 participants in total each morning, with
13% using it for the return journey, from a survey by the Texas Transportation Institute. The riders were picked up
from three convergence-point locations (Burris & Winn, 2006).
Figure 2: Counts of Informal Flexible Carpooling by Location
It seems most likely that additional informal flexible carpooling is occurring, but without the consistency or volume
that would attract studies. The author has often spoken with people (often transportation professionals) who will
divulge that they take or give rides in a manner similar to that described above, in other cities, usually in order to
take advantage of an HOV facility, and usually forming the fuller car at or adjacent to a bus stop. The driver pulls
up and asks waiting bus riders if they would like a ride. Information about the extent of this activity is not being
captured.
In November 2009 the City of Los Angeles and the Southern California Association of Governments announced that
it had completed a study of ‘Maximizing Mobility Options in Los Angeles: First and Last Mile Strategies’ in which 13
potential strategies were evaluated before choosing a final six for further development and investigation. The first
item on the list of the final six: casual carpooling. The report summarizes the benefits of casual carpooling as: 1)
maximizing travel flexibility and requiring minimal advance planning; 2) accommodating occasional and
unscheduled trips; and 3) eliminating barriers to traditional carpooling (City of Los Angeles, 2009).
0
2,000
4,000
6,000
8,000
10,000
12,000
San Francisco (1998) Washington DC (2006) Houston (2003)
Daily Morning Informal Flexible Carpooling Participants
Riders Drivers
Page 9 of 28
4.2. THE EXTENT OF FORMAL FLEXIBLE CARPOOLING
There are no existing examples of formal flexible carpooling. However in 1979/80 the 16 month Commuter
Connection Ridesharing Demonstration Project in the Golden Gate Commute Corridor, Marin County, CA, involved
a total of 1,433 members. In a survey in July 1980 a sample of 247 members revealed 68% were users, of whom
79% had been successful forming fuller cars, mainly for the morning commute. The 79% figure was a big increase
over a similar survey a year earlier at the very beginning of the project when only 16.7% reported success. The
report doesn’t give a very clear picture of the daily use of the system, though at one point it refers to observing
three of the morning ‘match points’ and 45 rider-members successfully getting rides (Dorosin, 1981).
5. HOW FLEXIBLE CARPOOLING OPERATES The essence of flexible carpooling is the absence of need for pre-arrangement on a trip-by-trip basis. Participants
arrive at a meeting place and form fuller cars in order of arrival. In the informal systems (San Francisco CA,
Washington DC, and Houston TX) rides are provided to anyone by anyone with no identification process, and no
money changes hands (TRB 2006). In the tested formal system an identification process was used and cost sharing
was explored (Dorosin 1981). The following subsections detail how each works.
5.1. HOW INFORMAL FLEXIBLE CARPOOLING OPERATES
This section describes how the casual carpooling and slug-lines operate. The first thirteen subsections describe
features in common between all locations, and the final three subsections describe each city’s system’s unique
features.
5.1.1. CARPOOL FORMATION
Potential riders wait in a line, or potential drivers wait in a line, and the front drivers and front riders form fuller
cars. The system can be likened to a taxi stand (Minett & Pearce, 2009). There are some small variations in the
method by which the destinations are identified for each line (see city-specific sections below).
5.1.2. NO PRE-QUALIFICATION
The system has been described as ‘egalitarian’ (TRB 2006). Anyone can participate and anyone rides with anyone.
The author can attest to having participated without any pre-qualification, both as a rider and a driver. The
‘etiquettes and rules’ postings on the websites suggest that either party (driver or rider) can decline to share, such
as a female not getting into a two seat car with a male, or a tall person waiting for a larger car (RideNow, 2009).
Discussion boards provide feedback and raise community awareness such that a vehicle or driver perceived as
unsafe might be boycotted in the future. (The effectiveness of this feedback mechanism in terms of awareness-
raising has not, to our knowledge, been evaluated).
5.1.3. SAFETY
The question of safety is important and of great interest to people when they first hear about informal flexible
carpooling. The author rode in San Francisco with a young woman driver from the Mid-West, who said that “I
don’t tell the folks back home that I do this, because they wouldn’t understand.” There is no safety system beyond
the eyes and ears and brains of the participants. Reports suggest that casual carpoolers look out for each other,
and the general requirement for three riders, usually three people who do not know each other, seems to provide

Page 10 of 28
a sense of ‘safety in numbers’ (Shirgaokar & Deakin, 2005). An accumulated record of almost forty years of
operation without the sort of incidents that people imagine would happen (no reports have been found of rapes or
assaults associated with casual carpooling) seems to reinforce an understanding of safety among the participants
(RideNow, 2009). The gender split of users of the informal flexible carpooling systems (see next section) would
lead to a conclusion that the systems are perceived by users as a safe form of transport. Clearly the system is
sufficiently safe or people would not continue to use it.
5.1.4. GENDER
The author’s own observations included counting the gender of riders at College and Claremont in Oakland, where
the split was exactly 50/50 male/female. Other surveys have found different splits, but no reliable pattern to
suggest that it is preferred by women or men. In the most recent counts: San Francisco (1998) didn’t count for a
gender statistic; the 1998 Northern Virginia study counted for gender and found that some origin points were male
dominated and some female dominated, with an overall average of two thirds male, and one third female; the
2003 data from Houston, reported in 2006, found that the gender split of riders was 50/50 (VDOT 2006). A 2008
study of slugs found that they were as likely to be male as female (Oliphant, 2008).
5.1.5. OTHER DEMOGRAPHICS
The San Francisco (1998) study didn’t explore demographics. The Houston study (2006 report of 2003 data) found
some distinctions between ‘average’ commuters and casual carpoolers, though no extremely striking differences
(Burris & Winn, 2006):
ages 25-34 were more frequent in the casual carpooling sample than in ‘all commuters’ while ages 55+
were less frequent. Other age groups were in average proportions.
income levels below $100,000 per year were more frequent in the casual carpooling sample than in ‘all
commuters, while income levels above $100,000 per year were less frequent. Casual carpoolers existed in
all income bands.
The VDOT study didn’t explore demographics. However a study by Oliphant, (2008) surveyed 300 Northern
Virginia slugs and found that an average slug:
Is educated to the level of a bachelor’s degree or higher.
Has a household income of over $100,000.
Works for the Federal Government.
Is between 35-54 years of age.
Has a household size of 2-4 persons.
5.1.6. FREQUENCY OF USE
All three studies found that most casual carpoolers or slugs use the mode most days of the week:
San Francisco (1998) 4-5 days per week: 84% (Beroldo, 1999) and 83% (511 Rideshare, 2010)
Houston (2003) every day: 52%, 3-4 days per week: 24% (Burris & Winn, 2006)
Northern Virginia (2008) every day: 79% (Oliphant, 2008)
5.1.7. DRIVERS ARE NOT ALWAYS DRIVERS
The San Francisco study asked participants if they normally drive, normally ride, or do a little of both.
Drivers (22%), Riders (67%), Both (11%) (2010 data: Drivers 27%, Riders 64%, Both 9%).

Page 11 of 28
5.1.8. USE OF OTHER MODES
All three studies found that casual carpool riders were high users of public transport:
San Francisco (1998): PT before casual carpooling: 63%, PT most likely alternative to casual carpooling:
87% (Beroldo, 1999)
Houston (2003): Modes for similar trips, Ride the Bus: 92% (Burris & Winn, 2006)
Northern Virginia (2008): PT most likely alternative to slugging: 55% (Oliphant, 2008)
5.1.9. REASONS FOR USING CASUAL CARPOOLING/SLUGGING
The main reasons for using casual carpooling or slugging are savings of time and money. The proportions differ
between drivers and riders and the structure of the survey:
San Francisco (1998): Riders save time (23%) and money (36%) as main reason for casual carpooling, while
drivers save time (58%) and money (15%) as the main reason. (Beroldo, 1999)
Houston (2003): Riders only, 79% slug to save time and 63% slug to save money. Respondents were
allowed to ‘tick all that apply’ (Burris & Winn, 2006).
Northern Virginia (2008): Combined riders and drivers: 26% like the gas savings most, and more than half
save more than $10 per day in total costs, while 27% like the time savings best, and more than half save
over 30 minutes per day (Oliphant, 2008).
5.1.10. CONVERSATION
Once in a casual carpool conversation can be as little as ‘good morning’ at the start and ‘thank you’ at the end, or it
can involve an extensive interview (as carried out by the author on a trip into San Francisco, and another in
Northern Virginia). People in casual carpools report a wide variety of experiences. Some participate for the
conversation. Others have found that the drivers get grouchy when someone talks to them. A rider in Northern
Virginia said that they have ridden along with people from the embassies (in Washington DC) who use the ride as
an opportunity to practice their English. A rider in San Francisco gave his reason for being a casual carpooler as
‘meet interesting people’. This rider had been a casual carpooler for almost 30 years and estimated he met an
interesting person ‘about three times a week’. This could not happen without conversation (Minett, 2005).
5.1.11. RADIO STATIONS
Often the radio is playing. Etiquette postings suggest that it is the choice of the driver whether to have the radio
on and to decide to which station it is tuned (RideNow, 2009). Some pick-up locations are known for the likely
radio station choices of their drivers, as in ‘that is an NPR location’, meaning that it would be expected that the
National Public Radio would be playing in cars from that location (Minett, 2005).
5.1.12. NUMBERS OF CARPOOLS FORMED FOR A SINGLE ROUTE
The VDOT (2006) and Beroldo (1999) reports were analysed to find out how many carpools are formed at any one
informal carpooling location to a single destination. The answer ranges from as low as one to as high as 314.
Figure 3 shows the sizes and frequencies. For example, 18 routes had between 51 and 100 carpools formed during
the survey. 20 routes exceeded 100 carpools. For a route to have 100 three-person carpools, two hundred people
will be observed at that one location lining up and getting rides.

Page 12 of 28
Figure 3: Frequency of Route Size in Informal Flexible Carpooling Systems
Routes from some Northern Virginia meeting-places were observed to involve as few as a single carpool. It was
noted however that from each such meeting-place there would be other destinations nearby that a rider could go
to with a relatively small effort to get to their own destination, if there was no trip available to exactly where they
wanted to go. Note that drivers call out their destination and riders can decide if they want that destination. One
can imagine that riders would be weighing up the benefit of getting a trip right away to somewhere near their
actual destination, compared to the potential time-cost of waiting for a trip that exactly met the rider’s need.
5.1.13. HOW RIDERS ACCESS THE CASUAL CARPOOLING PICK-UP LOCATION
The San Francisco report explored the modes by which riders arrived at the casual carpooling pick-up point. The
answers ranged across all alternatives and the mix between alternatives varied according to the type of pick-up
location. The two tables in Figure 4 are copied from the San Francisco report.
Figure 4: Rider Mode to Casual Carpool Locations, and Mode by Location
At the pick-up point at College and Claremont, at which about 100 carpools are formed each day at a curbside pick-
up with no parking facility, about two-thirds of the riders arrive on foot, while one-sixth drive and park in nearby
residential streets. At the other end of the scale at a pick-up point within an existing park-and-ride at Curtola,
almost no riders arrive on foot. Note that ‘drop off’ is a common mode.
The study also asked how far riders and drivers are traveling. The usefulness of the analysis is limited because of
the two very different types of pick-up location. Figure 5 shows the range of distances reported.
Figure 5: Distance from Home to Casual Carpool Locations
0
5
10
15
20
25
1 - 10 11 - 20 21 - 50 51 - 100 101 - 314
Fre
qu
en
cy O
bse
rve
d
Number of Carpools Formed
Frequency of Route Size by Number of Carpools,(San Francisco, 1998, and Northern Virginia, 2006)
(n=84)

Page 13 of 28
The raw data from the 1988 study has been lost. However it has been suggested that the distance BART customers
walk to the BART station might be a useful proxy. The 2008 BART Station Profile Study found that customers who
walked, walked a mean distance of 0.52 miles to BART stations, and observation of the station maps found that the
range of distances walked was up to one mile. (Corey et al, 2008) The map shown in Figure 6 is the North Berkeley
BART catchment, to which people walk an average of 0.58 miles, and drive an average of 1.38 miles.
Figure 6: Catchment for North Berkeley BART showing Mode
The remainder of this section describes aspects of the systems that are unique to each city.

Page 14 of 28
5.1.14. SAN FRANCISCO
Figure 7: East Bays Pick-Up Points and the Main Downtown Destination
The San Francisco system works from 22 commuter parking lots and curbsides in the East Bays area (See Figure 7),
and the curbside pick-ups are both next to BART stations and in other locations. There has traditionally been a
single destination for the Bay Area casual carpoolers: at or near the corner of Fremont and Mission Streets, just off
the freeway into downtown, adjacent to the Transbay Terminal. More recently a second destination has started:
there is a small line at North Berkeley BART that runs to the Civic Center in downtown San Francisco (Minett,
2009).
In all cases in the East Bays system, the riders form a single line and the front people get into the front car. Two
riders get into each car, unless there are already two people in the car. The occupancy requirement for the I-80
HOV lane is HOV 3, and except when the line of riders is very long all drivers will form carpools of three people. As
seen in the ‘etiquette’ extract from the RideNow website, (Appendix 1), taking more than the minimum number of
riders would be seen as inappropriate: there need to be enough riders to go around all the drivers who would like
to participate. When the line of riders is very long the riders will ask the driver if he or she minds taking three,
such that the wait time for riders can be reduced.
Figure 8: North Berkeley BART Pick-Up Point (Photo by P Minett)
At the North Berkeley BART pick-up point there are two lines: one for downtown and one for the Civic Center.
(The addition of the second line is a relatively recent development, and the second line is small: in one hour in
January 2009 the author observed 92 carpools form for downtown while 24 carpools formed for the Civic Center).
There is a newspaper dispenser on the footpath. The line for downtown riders forms closest to the curb, while the
line for Civic Center riders forms on the BART side of the footpath (see Figure 8). Cars picking up people for

Page 15 of 28
downtown line-up from the newspaper dispenser backwards, and those picking up people for the Civic Center line
up from the newspaper dispenser forwards. While this involves cars for Civic Center pulling in and reversing to get
to the pick-up position, it has the benefit of carpools for both destinations being formed at virtually the same
location, such that a shortage of riders for either destination could be made up by riders for the other (the actual
destinations are about two miles apart in the downtown zone and riders could easily use transit to their final
destination).
Figure 9: Signage on Beale St, San Francisco, for Returning Casual Carpoolers (Photo by P Minett)
In the evening there is a string of pick-up points along Beale Street, between Folsom and Howard Streets (See
Figure 9). Each of these is signposted for an origin location. There is a high level of activity to the further-away
origins such as Hercules and Vallejo, and much less activity to the closer-in origins such as Oakland and Berkeley
where BART and AC Transit services might be easier or less costly for riders to access, and where there are fewer
benefits for drivers of being HOV on the return journey (the toll on the Bay Bridge is only charged east to west, not
west to east, and there are currently no carpool-lane advantages getting onto the Bay Bridge). The author
observed lines of riders waiting for the further-away origins, and waited a long time for a second rider and then a
driver to make the trip to relatively near-by College and Claremont. 187 evening carpools were observed being
formed on Beale Street as part of the 1998 study (2010: 358; 2011: 296), predominantly destined for Vallejo and
Hercules (Beroldo 1999). Survey responses suggested that about 9% of riders usually use the system in the
evening (2010: 16%).
5.1.15. NORTHERN VIRGINIA/WASHINGTON, DC
Figure 10: Washington DC/Northern Virginia Pick-up and Destination Points

Page 16 of 28
The Northern Virginia/Washington DC system works from 21 pick-up locations mainly along the Shirley Highway in
the I-95/395 corridor (where there is a reversible HOV3+ lane) to at least nine different destinations in or near
Washington DC (See Figure 10). Having multiple destinations from several of the pick-up points has resulted in a
slightly different process for filling cars than is used in San Francisco.
Some pick-up locations have one line for riders, some have two, one has three, and one has four (VDOT 2006).
Each line can be dedicated to more than one destination. The mechanism for forming fuller cars is that the driver
pulls up to the front of the line, rolls down the passenger-side window, and calls out his or her destination (or
alternatively the destination is shown on a written placard on the dash). The rider at the front of the line at that
moment calls out the destination so that others in the line can hear. The first two people in the line wanting that
destination leave the line and get into the car.
The busiest pick-up location in a recent count (2006) was Horner Road Park and Ride. This lot has capacity for
almost 2,400 vehicles, and a total of 1,566 ‘slugs’ were observed catching rides from four lines in this location, to
nine different destinations. Figure 11 shows the counts of slugs (riders) in 15 minute increments from this location
on the 3rd
of May 2006 and provides a sense of the magnitude of the activity, including the maximum length of
lines of people or cars in each time period (VDOT, 2006).
Figure 11: Horner Road Slugging Activity, May 2006.
Because the cars are mainly HOV 3, there will have been approximately 783 carpools (1,566 riders) departing this
location during the three hours of this tally. The greatest activity was between 7:00 and 7:15 am when 417 people
arrived and 139 carpools (278 riders) departed, an average departing rate of 9.27 per minute, or a full car
departing every 6.5 seconds. This is the equivalent of almost a full lane of traffic arriving (417 arriving in 15
minutes is a rate of 1,668 per hour, and a full lane carries between 1,600 and 2,500 vehicles per hour depending
on design and conditions), and a third of a lane departing (139 departing in 15 minutes is a rate of 556 per hour).
Page 17 of 28
Unlike San Francisco which has a single destination for almost all its casual carpooling, the Northern
Virginia/Washington, DC system has at least nine destinations, of which the most prominent is the Pentagon, the
destination of one third of the informal flexible carpools. Conversations with participants reveal that many catch
Metro at the Pentagon stop and use transit to access their eventual destination.
Routes from some Northern Virginia meeting-places were observed to involve as few as a single carpool. It was
noted however that from each such meeting-place there would be other destinations nearby that a rider could go
to with a relatively small effort to get to their own destination, if there was no trip available to exactly where they
wanted to go. Note that drivers call out their destination and riders decide if they want that destination. One can
imagine that riders would be weighing up the benefit of getting a trip right away, compared to the potential time-
cost of waiting for a trip that exactly met the rider’s need.
The informal flexible carpool riders in Northern Virginia/Washington DC are referred to as ‘slugs’, and their drivers
as ‘body snatchers’. The term ‘slugging’ is recorded in Wikipedia as referring to the forming of ad hoc carpools
(Wikipedia, 2009). The term ‘slug’ in this context is reputed to have been conferred by bus drivers who grouped
the people who would line up at a bus stop and then take a free ride in a car together with the fake quarters (25
cent coin), also referred to as a ‘slug’, that some people would attempt to use to pay for bus rides. Either way, the
bus driver felt the rider was getting a free ride. The provenance of the term ‘body-snatchers’ is unknown.
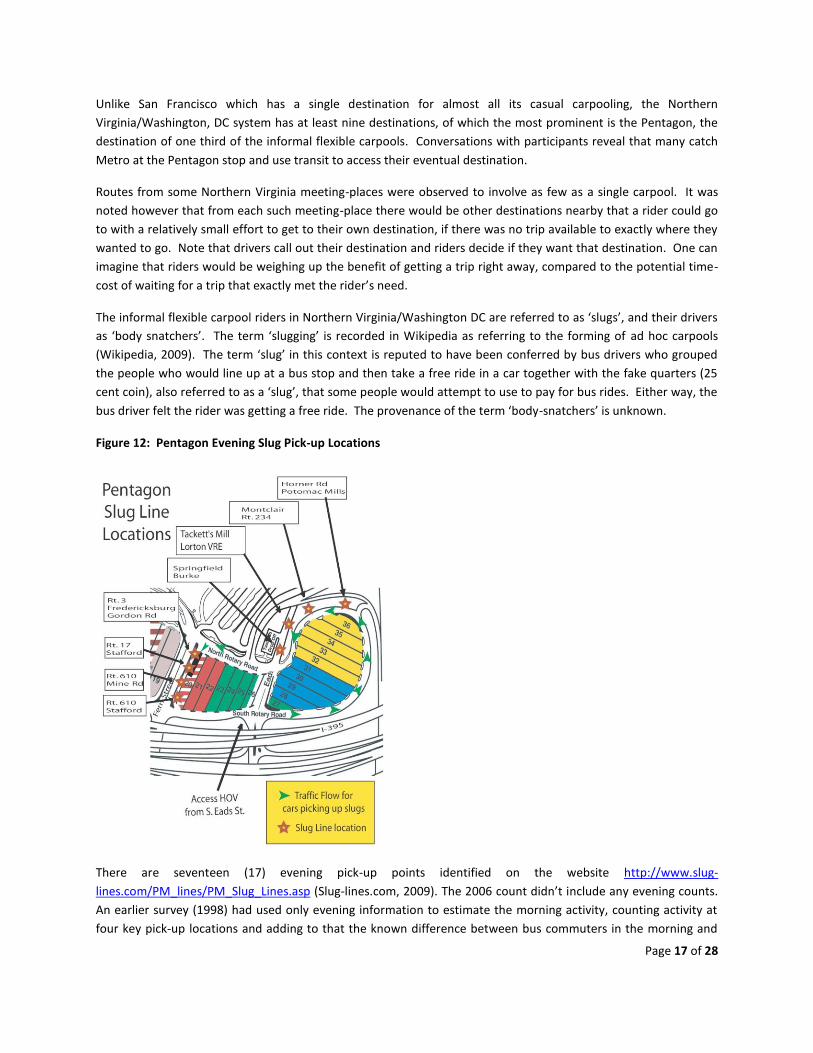
Figure 12: Pentagon Evening Slug Pick-up Locations
There are seventeen (17) evening pick-up points identified on the website http://www.slug-
lines.com/PM_lines/PM_Slug_Lines.asp (Slug-lines.com, 2009). The 2006 count didn’t include any evening counts.
An earlier survey (1998) had used only evening information to estimate the morning activity, counting activity at
four key pick-up locations and adding to that the known difference between bus commuters in the morning and
Page 18 of 28
bus commuters in the afternoon along the corridor. 2,200 slugs were counted at afternoon pick-up points, and a
further 900 were inferred from transit for a then estimate of 3,100 in total (VDOT, 2006). If the same proportion
was applied against the 2006 survey volume, it could be suggested that as many as 4,500 are currently using the
system for the return journey.
The evening pick-up points each cater to a range of origins. The most complex is the Pentagon where 18 origins
are served from 8 different lines, as shown in Figure 12 (Slug-lines.com, 2009). The system for forming carpools in
the evening is the same as the morning, with drivers and riders calling out destinations.
5.1.16. HOUSTON, TX
The Houston, TX system occurs at three locations that feed downtown Houston, at park and ride locations on the I-
10 and US-290 that have direct access to HOV lanes. The lanes concerned are also High Occupancy or Toll (HOT)
lanes for some of the peak period, switching from “free HOV2+” to “tolled HOV2, free HOV3+” at 6:45 am and 5
pm. The toll is $2.00 for HOV2 (Burris & Winn, 2006). Unlike San Francisco and Northern Virginia/Washington, DC,
the casual carpooling activity happens during the period when the HOV requirement is HOV2, with drivers
collecting single riders. However a much greater volume occurs when the occupancy requirement rises to HOV3+.
Operating to a single destination makes the Houston example more similar to San Francisco than Northern
Virginia/Washington, DC.
The TTI report about the Houston system (written in 2006 describing data from 2003) found that while 65% of the
casual carpool passengers had not previously met their travel companions; about a third had met them once or
twice, indicating that there is a small community that uses the mode consistently. More than 75% use the system
at least three times per week. They use the system to save time and money, and because of slow bus service.
More than half had been using casual carpooling for over a year. 91% would use the bus for similar trips, while
26% might also drive-alone some times, and 19% sometimes ride in a more formal carpool. 13% said that they
used casual carpooling for the evening return trip (Burris & Winn, 2006). The study didn’t dig any further into the
evening journey.
5.2. EXPLAINING WHY INFORMAL FLEXIBLE CARPOOLING WORKS
One has to wonder why, when they have the option of transit, or the myriad regional rideshare database or smart-
phone apps or similar systems available to them to get into the carpool lane, so many people choose to do what
appears to be an unsafe activity and share rides with ‘strangers’. Why is this form of carpool formation more
successful than any other, especially considering that it specifically excludes features that appear to be basic
requirements for all other carpool formation tools?
Reasons given in earlier research reports don’t seem to get to the core of why casual carpooling works. The
reports suggested: (TRB 2006)
It works because there is access to the HOV lanes
It works because drivers avoid paying the toll over the Bay Bridge
It works because it saves drivers time (up to an hour some days)
It works because the riders get a free, comfortable, fast ride
It works because there is a bus service in the other direction to get people back
It works because people know where the meeting places are
It works because there are usually three strangers in each vehicle and there is safety in numbers

Page 19 of 28
None of these reasons is really an explanation for why casual carpooling works when compared with other
mechanisms that people could use for forming carpools. Access to HOV lanes, avoiding the toll, and saving time
are all available to people by using one of the other mechanisms for forming carpools. The bus in the other
direction, the knowledge of the meeting places, and safety in numbers are all factors that facilitate this method for
forming carpools, but they are not explanations for why people would use this method.
Clearly people feel sufficiently safe, or they would not do it. The ‘safety in numbers’ argument sounds reasonable,
except that people sometimes share in a two-seater vehicle, and sometimes either a rider gets into a vehicle that
already has two people in it, or two riders traveling together get into a vehicle together. Even in these situations
the system continues to operate.
The idea of a free, fast, comfortable ride for riders suggests a possible trade-off between ‘costs/benefit’ and
concerns about safety. The idea of time and cost saving for drivers suggests a similar trade-off. By assembling at a
meeting-place rather than incurring the overhead of pre-arranging the trip (with the attendant effort of finding the
person or car, and the risks of failure) the ‘cost’ for both riders and drivers (in terms of effort) can be seen to be
reduced, improving the benefit/cost equation for both, and therefore expanding the number of people for whom
the solution makes economic sense (elasticity).
Following this train of thought, it is suggested that if considerations of safety and benefit/cost can be adequately
resolved, and if sufficient numbers of people participate, meeting-place based carpool formation, without any trip-
by-trip pre-arrangement, would likely attract more potential carpoolers than any other system. The key insight is
that the essence of casual carpooling (when compared with other carpool formation methods) is the absence of
trip-by-trip pre-arrangement.
5.3. HOW FORMAL FLEXIBLE CARPOOLING OPERATES
We now turn our attention to formalized flexible carpooling. The key distinction between informal and formal
systems is the use of membership and identification systems, and the official sanction of the flexible carpooling as
part of the transport system. The only example of operation of a formal flexible carpooling system is the
Commuter Connection demonstration project from 1979/80. This section will outline the features of that system,
then an overview of the system proposed by Trip Convergence of New Zealand, and the results of a pilot project
initiated by Trip Convergence in Auckland, New Zealand.
5.3.1. FLEXIBLE RIDESHARING IN MARIN COUNTY, CALIFORNIA
This sixteen month (1979/80) trial was designed to test the feasibility of ‘flexible registered ridesharing’ as a
method for increasing auto occupancy, reducing travel times and costs for riders and drivers, and reducing air
pollution and conserving energy by helping those who normally drove alone to share rides. The grant application
had suggested that commuters are discouraged from carpooling because of the fixed times involved in catching a
ride. The project was focused on the communities of Mill Valley and Novato in Marin County, both adjacent to the
US Highway 101, the major traffic corridor for commuters to San Francisco, over the Golden Gate Bridge. HOV’s of
three or more at the time avoided paying the $1.00 toll to cross the bridge, and there was 3.7 miles of HOV lane
leading to the bridge. Existing bus services were at or nearing capacity (Dorosin, 1981).
The project opening coincided with the 1979 energy crisis. Fuel costs had risen 53% in one year and commuters
were only able to purchase fuel on odd or even days depending on their license-plate number. There was
excellent coverage of the project in the media.

Page 20 of 28
However, part way through the project the board of the operating entity, Commuter Connection, determined that
the two target communities were not yielding sufficient registrations and decided, against the views of their
executive director, (who was also the project manager), to shift to a more region-wide focus. It was the view of
the final report that this shift reduced the effectiveness and impact of the project.
The operation involved an in-person registration process, “designed to serve as a screening process that would
assure members that all other pass-holding members were verified, authentic members”. To register, a
prospective member had to complete an application form and have a Polaroid photo taken (in duplicate).
Residence and work-place details were obtained and “on occasion, project staff verified work place by calling the
noted employer”. A packet of ‘boarding pass’ and instructions was mailed to the member, with one photo
attached to the member’s boarding pass and the duplicate attached to the application form and filed. Initially
membership was limited to adults, but in March 1980 it was extended to include students. A $2.00 membership
fee was charged, and a no-fare policy adopted. The commute mode was promoted as a back-up to the bus service.
In-person registration was accomplished by putting up a table in a shopping center or at the Golden Gate Bridge
toll plaza, or at bus stops or special events, and engaging the public in conversation. Registration activity was
supported by a variety of other media activities to raise overall awareness. 1,433 member applications were
received, all approved, 61% male, planning to use the system as driver (31%), rider (24%), or both (45%). 37% of
members identified themselves as Solo Auto drivers upon joining the system. Of eventual users of the system,
14% said they joined as a back-up (in case of bus strike or gas shortage), while for eventual non-users of the system
this proportion was 30%.
The operational concept was that riders would wait at designated meeting places (called ‘Match Points’) located
either at major intersections or in the vicinity of bus stops and hold out their boarding pass showing the code for
their intended destination. Drivers would fasten their passport to the car’s visor on the passenger side, visible
from the outside. Drivers could pick up ID’d riders to help them move towards their more desired route. Riders
were to show their ID before getting into the car. The system was intended to work in both directions: with match
points identified for getting into San Francisco in the morning and downtown match points for getting back in the
evening.
Usage of the system was not recorded from day to day, so could only be determined by surveying members, which
was enabled because member contact details were on file. Membership numbers grew throughout the project as
shown in Figure 13. Four surveys were carried out. Key questions asked if members had tried to use the system,
and whether or not they had been successful. The results of these key indicators across the four surveys are
shown in Figure 14.
It is interesting to note that in the survey to determine success, in July 1980 success included forming fuller cars
with both members and non-members, and it included success in morning and evening commutes. Additionally
only a third of successful driver-members displayed their Passport, while 97% of successful rider-members
displayed theirs.
During the later months of the project, based on customer feedback, several changes were made to the design of
the project. One key change was the provision of a ‘fare card’ and a recommendation that fares be paid by riders
to drivers. In the final survey of the project it was found that 13% of successful driver-members had received a
fare or some money towards bridge tolls, and that 40% of rider-members had paid a fare.

Page 21 of 28
Figure 13: Enrollment in Commuter Connection Figure 14: Usage in Commuter Connection
During a focus group in October 1979 (about halfway through the project) with participants drawn from members,
both users, non-users, and successful users, the following key findings were summarised:
1. “There is a strong sense of community among members: references to self help, grass roots, mutual help
and save gas.
2. The attending members were enthusiastic about the CC concept, wishing to help and to see it succeed.
3. There is some confusion about how CC integrates with or is related to the Golden Gate Bus Transit System.
4. The registration process—member verification and photo—is an important security measure. It makes
Commuter Connection considerably safer and more attractive than regular hitchhiking.
5. There is concern about enrolling more members, and about reliability and the return trip home.
6. The pass is viewed very positively; it symbolises an authentic member, legalized or sanctioned hitchhiking.
There were numerous suggestions for modifying the design.
7. Members attending suggested community meetings, and monthly newsletters”.
What is not clear from the report about this project is the extent of actual usage. In estimating the average cost
per trip, the report makes the following calculation:
Given: 1433 members x success rate (1) x frequency (2) = # of trips.
1433 x 34% x 2.5 = 1218 trips.
Then: project budget (3) / 1218 trips = cost per trip
$300,000 / 1218 = $246 per trip
Where: (1) Success rate derived by average success of 806 users’ responses from 4 surveys.
(2) Frequency estimate from responses to surveys.
(3) Approximate dollar amount expended by the project.
The information contained in the report doesn’t show how the estimate of 2.5 trips per successful user was
determined. An average per successful user of only 2.5 trips across the whole year would suggest an incredibly
Page 22 of 28
low level of usage that is not consistent with the tone of the report. We can only speculate almost 30 years later
whether this calculation, suggesting an average of about 1.3 carpools per day over the 16 months, was correct. It
is not consistent with the reference on page 76 of the report to project staff observing 45 rider-members
successfully matching for a ride, apparently on a single day at three morning match points. This latter information
would suggest total trips well in excess of the 1,218 derived in the above calculation.
5.3.2. TRIP CONVERGENCE, AUCKLAND, NEW ZEALAND
In the proposal to Transit IDEA, Trip Convergence set out the following description of its proposed method for
implementing flexible carpooling to transit stations (notes in bold have been added subsequently for clarity):
1. Introduce a pick-up point in a residential area where no casual carpooling or slug line exists (in the Puget
Sound Region), with appropriate signage and a ‘no parking – rideshare stop’ area by the kerbside. (To the
best of our knowledge no organisation has ever initiated this style of carpooling before, and it doesn’t exist
in the Puget Sound Region. The existing ones (San Francisco and Northern Virginia) grew out of bus
strikes, or were started by individuals and grew of their own accord.)
2. Create a flexible carpooling route to a transit station that has a park and ride facility, including arranging
dedicated flexible carpool parking spaces at the park and ride, and an evening pick-up point for forming
flexible carpools back to the residential area.
3. Use technology to capture trip records, including:
a. a biometric infrared membership card (can be activated only by the person to whom it is issued), that
each member will activate as he or she gets into another member’s car as part of a flexible carpool;
b. a combination infrared/radio-frequency-ID transceiver for the drivers’ cars, that will capture and store
member ID information captured when the membership card is activated;
c. a trigger and receiver pack (with RFID and cell phone capability) at the origin end (installed high on a
lamp post) that will trigger ‘RFID send’ from the transceiver in the car and capture trip records, and
then send them by SMS (text message) to the server;
d. a trigger and receiver pack at the park-and-ride to record the details of arrival and provide
management information about the use of parking areas dedicated to arriving carpools, and to
capture details of evening carpool formation.
4. Have an application and screening process that ensures members have safe driving records and are not
violent criminals or petty thieves [NB Although informal flexible carpooling has operated for many years
without the type of safety issues that would be expected, in all cases discussions with transportation
authorities have centered on this issue and the potential for liability should anyone be hurt using the
system. In addition to the screening process, operators should purchase appropriate liability insurance].
5. Use a ride-credit system to reward system use, based on the trip record, by transferring a ride credit from
each rider to the driver, in the members’ on-line accounts. These ride credits can be
a. earned by giving rides, or purchased from the market, online, and
b. used by taking rides, or sold to the market, online.
The market (being all the members in a bid-ask environment) sets the price. Members who always ride
will pay cash to the system in the value of the ride credits that they buy. Members who always drive will
be able to extract cash from sale of ride credits online. Incentives for participation (paid from the project
budget) will be paid directly into members’ accounts. [NB It is expected that the incentives and the value
of ride-credits sold will be below the thresholds for taxation, insurance, and commercial vehicle
licensing].
6. In other respects the system will operate in the same manner as the casual carpooling/slug lines.

Page 23 of 28
7. Using this flexible carpooling to get people to the park-and-ride at the transit station in the morning, and
(optionally) back to the residential area in the evening. There will be no requirement to use flexible
carpooling to return to the residential area, however we will encourage people to use the system in both
directions where possible. In the event that a rider needs to get back to their residential area during the
day (a day time emergency) they will be provided with access to a local ‘guaranteed ride home’ service or
equivalent.
5.3.3. WSDOT FLEXIBLE CARPOOLING PILOT, SEATTLE
In April 2009 the Washington State Legislature passed its transportation budget for the 2009 to 2011 period,
incorporating the following provision:
“(4) $400,000 of the multimodal transportation account—state appropriation is provided solely for a grant for a
flexible carpooling pilot project program to be administered and monitored by the department. Funds are
appropriated for one time only. The pilot project program must: Test and implement at least one flexible
carpooling system in a high-volume commuter area that enables carpooling without prearrangement; utilize
technologies that, among other things, allow for transfer of ride credits between participants; and be a
membership system that involves pre-screening to ensure safety of the participants. The program must include a
pilot project that targets commuter traffic on the state route number 520 bridge. The department shall submit to
the legislature by December 2010 a report on the program results and any recommendations for additional flexible
carpooling programs.” (WS Legislature, 2009).
In May 2010 WSDOT selected Avego, a dynamic ridesharing service provider from Ireland, as the supplier for this
project. The format chosen for the project was the use of location aware iPhones and other smart phones, and
Avego’s ride-matching system (see www.avego.com). The project targeted recruitment of 250 drivers and 750
riders. The project did not test flexible carpooling as it has been defined in this report, nor as was called for in the
legislation. However there are valuable lessons for flexible carpooling in the results of the project.
The project succeeded in attracting almost 900 registrants. Analysis showed that these came from all over the
Puget Sound Region. They had almost no routes in common. The eventual route that was chosen had very little
relevance to the vast majority of those who initially expressed interest.
The screening process required by WSDOT based on the legislation was perceived by the project managers as a
major barrier. 75% of potential participants refused to provide the information requested for screening. The
other 25% were not concerned. This was seen as a generational distinction.
About 10% of those who completed applications were found to not qualify based on the results of the screening,
showing that the application process itself did not deter those who do not qualify from attempting to ‘get in’.
The project succeeded in having eight fully approved members in its first WSDOT supported phase, and did not
launch. Avego subsequently carried out a non-WSDOT supported phase during which it relaxed the screening rules
and provided van-back-up services in order to guarantee riders that they would get a ride in a reasonable time.
This second phase launched and operated for a few months before being suspended because of the cost of
operating the vans. Data about participant volumes during the second phase is not available.

Page 24 of 28
5.3.4. EXPRESS CARPOOLING PILOT, AUCKLAND, NEW ZEALAND
In late 2010, early 2011, Trip Convergence attempted to introduce a system as described in the previous paragraph
from the Hibiscus Coast, Auckland, New Zealand to the Albany, Auckland, NZ bus park-and-ride, a convergent
distance of 15 km (9 miles). While the system was specified to work exactly as set out above, the technology
solution was replaced with the use of ordinary mobile phones, with riders using SMS text messages to inform the
system of which member they are riding with. At launch it was decided to go with the term ‘express carpooling’
rather than ‘flexible carpooling’.
The catalyst for the project was the decision to allocate up to 86 spaces at the Albany Park and Ride (out of 550)
for arriving carpoolers as a pilot project. The Albany Park and Ride was already very well used with no spaces
available after about 7:30 am each day. The pilot project to assign some of the spaces to arriving carpoolers was
established to increase the number of bus passengers for each parking space. Trip Convergence saw the
opportunity to ensure the carpool parking spaces would be well used.
The express carpooling project was promoted in Hibiscus Coast using billboards, radio, letterbox drop, newspaper
advertising, radio advertising, and a table in a shopping center.
The project failed to attract sufficient participants to provide a reliable service, and after some delays the launch
was postponed indefinitely. About 20 people were fully signed up for the service.
Evaluation of the pilot led to the following list of potential reasons for its failure to launch:
Insufficient marketing budget (<$30,000), and very limited ability to pay incentives (Trip Convergence
attempted to carry out the pilot using only its own funds);
Failure to engage and partner with Auckland Transport, the governing body for transport in Auckland;
Failure to establish a sufficient conversation with people in the Hibiscus Coast community;
While there are known to be in the order of 1,700 people making the journey towards Auckland travelling
past the Albany Bus Station, it was overlooked that a high proportion of these people drive ‘company cars’
and
o are not concerned about the cost of their transportation
o are not likely to take the bus as an alternative
o are not likely to become passengers some of the time
o have rules that might prevent them from carrying passengers
While there was a good level of initial registration (to enter a draw for an iPad), the people who entered
were not dominantly people who would travel to Auckland
The pilot helped to clarify the extent of the challenge of bringing about reduced traffic through sharing vehicles. At
the Park and Ride the number of arriving carpools rose from about 20 to about 40, none of which were express
carpools.
6. THE IMPACT OF FLEXIBLE CARPOOLING A study by the Energy Efficiency Center at University of California, Davis, Flexible Carpooling: Exploratory Analysis,
June 2009, quantified the potential impact of flexible carpooling on energy consumption by both the participants
and the rest of the traffic. These were quantified in a theoretical model as amounting to over 50,000 gallons of
gasoline equivalent per year for a single flexible carpooling route of 10 km (6 miles) involving 150 participants
where 50 drive and 100 are passengers, compared with the same people driving alone, depending on the

Page 25 of 28
circumstances of speed and existing levels of traffic congestion. The study also considered the impact of flexible
carpooling on existing public transport services (it found that it depends on the quality of those services), and
issues related to liability for operators of a flexible carpooling system (it recommended that such operators carry
insurance) (Dorinson et al, 2009).
In a study to estimate the energy consumption impact of casual carpooling, Minett and Pearce (2009) estimated
savings in the order of 900,000 gallons of gasoline equivalent for San Francisco, for the morning commute alone.
They also estimated that the full extent of savings for San Francisco could be in the order of $30 million per year
when time, energy, running costs, and foregone transit operating costs were taken into account. They estimated
that the savings far exceeded the loss of transit revenue that Bay Area operators (AC Transit and BART) would be
suffering (Minett & Pearce, 2009).
The author has been unable to source any estimates of the broad impact (beyond participant counts) of the slug-
lines in Washington DC or Houston, however extrapolating the San Francisco study results and adjusting for a
greater level of afternoon activity in Washington DC, the author has estimated the energy savings at 2 million
gallons of gasoline equivalent per year for Washington DC.
7. THE OUTLOOK FOR FLEXIBLE CARPOOLING The Los Angeles pilot program under its First Mile Last Mile Strategies has yet to be announced.
A workshop at the TRB annual meeting in January 2010 incorporated knowledge about informal flexible carpooling
into development of strategies to ‘Reinvent Carpooling’ (TRB, 2009). Subsequent workshops in 2011 and 2012
further explored possibilities.
A presentation at the 2011 TRB annual meeting recommended casual carpooling as a strategy for reforming urban
transportation systems with peripheral parking lots and express-ways for buses and carpools.
The formation of the Ridesharing Institute to promote ridesharing through applied research might lead to
opportunities in the future.
8. WHAT IS NOT KNOWN ABOUT FLEXIBLE CARPOOLING In a compendium of existing knowledge it can be useful to identify what is not yet known. This provides focus for
future research. The design of the Trip Convergence solution suggests hypotheses for answers to these questions.
These need to be tested.
8.1. CATALYZING A NEW FLEXIBLE CARPOOLING ROUTE
The examples of informal flexible carpooling have been in operation for many years, and it is known that they were
not the result of a planned implementation. For San Francisco the imposition of tolls on the Bay Bridge has been
suggested as a catalyst, as has an earthquake and a bus strike. In Washington DC the requirement for HOV4+ for
the HOV lane on the Shirley Highway is believed to have been a catalyst, with the subsequent reversion to HOV3+
causing no damage to the system. The attempt in Marin County to catalyze a more formal system found some
success but it was not sustained. A newspaper story from Houston suggests the effort of an individual with a sign
was what started the slug-lines in that city (Wall, 2002).

Page 26 of 28
It seems likely that a new route will not succeed if it is not quite rapidly operating with enough participants that
waiting times are minimal. The method for getting from zero to sufficient participation is a key unknown, and
should be a focus of any proposed implementation.
8.2. MARKET SHARE AND PHYSICAL CHARACTERISTICS REQUIRED
The proportion of the convergent traffic that would become participants in a flexible carpooling system (market
share), is a key unknown. It is also not known how much of a role distance, presence of HOV facilities, and the
extent of congestion on the route will play in predicting market share.
8.3. CUSTOMERS DESIRED OUTCOMES
No research has been done into the psychographic characteristics of flexible carpoolers. While the Houston study
looked at demographics (age, income, gender, job, etc) it didn’t involve questions that would help understand the
motivations of participants. The extent to which participants are motivated by concerns for the environment, their
own economic well-being, the community, their availability and use of time, their need for control, and their
tolerance for unsafe situations, are examples of factors that might work together to predict who would be
potential flexible carpoolers.
8.4. RESPONSE TO SHOCKS
There is no day by day tracking of activity within the informal flexible carpooling systems. When oil prices were
high in 2008, the author’s own counts of casual carpoolers in San Francisco suggested that driver numbers were
down and average vehicle occupancy was up. This was based on comparison of counts done in June 2008 with
counts done at the same location in January 2007. Fewer drivers came, and the line of riders was longer. What is
not known is whether this was a normal June pattern, compared with January, or if it was due to the price of oil.
Similarly, should an event occur in which a participant was subject to assault or other incident, there is no
knowledge of the likely impact on the system. Having daily records in a formalized system should provide some
answers in the unfortunate event that such an incident occurs.
9. REFERENCES 511 Rideshare, 2010. Casual Carpool Survey Results / July 2010.
Beroldo, S., 1999. Casual Carpooling 1998 Update (January, 1999). RIDES for Bay Area Commuters, Inc.
Burris, M.W., Winn, J R., 2006. Slugging in Houston—Casual Carpool Passenger Characteristics. Journal of Public
Transportation, Vol. 9, No. 5, 2006
City of Los Angeles, 2009. Maximising Mobility Options in Los Angeles: First and Last Mile Strategies. November
12, 2009 presentation of a draft report compiled by City of Los Angeles, Southern California Association of
Governments, Nelson Nygaard, CalStart, Alta Planning and Design, and Intrago.
Corey, Canapary & Galanis Research, and BART Marketing and Research Department, 2008. 2008 BART Station
Profile Study, (and associated maps and spreadsheets), BART Marketing and Research Department.
Deakin, E., Frick, K., Cervero, R., Skabardonis, A., Barnes, I., Kingsley, K., Rubin, J., Murakami, J., Amaro, J., and
Jensen, E., 2011. Bay Bridge Toll Evaluation: Final Report, Global Metropolitan Studies, University of
California Berkeley.
Dorinson, D., Gay, D., Minett, P., Shaheen, S., 2009. Flexible Carpooling: Exploratory Study, UC Davis Energy
Efficiency Center.

Page 27 of 28
Dorosin, E, 1981. Commuter Connection: Flexible Ridesharing in Marin County, California, Final Report December
1981
Knox-White, J., 2008. Casual Carpooling and the Environment. Oakland Tribune, October 23, 2008. Downloaded
from: http://findarticles.com/p/articles/mi_qn4176/is_20081023/ai_n30949479
Minett, P., 2005. Personal observations and interviews.
Minett, P., 2009. Personal observations and interviews.
Minett, P., and Pearce, J., 2009. Estimating the Energy Consumption Impact of Casual Carpooling. Paper accepted
for poster session at TRB annual meeting 2010.
Oliphant, M., 2008. The Native Slugs of Northern Virginia: A Profile of Slugging in the Washington DC Region.
Major Paper for Master of Sciences in Urban and Regional Planning.
Ridenow, 2008. Website www.ridenow.org/carpool . Accessed in August 2009.
Shirgaokar, M., Deakin, E., 2005. Study of Park-and-Ride Facilities and Their Use in the San Francisco Bay Area of
California. Transportation Research Record: Journal of the Transportation Research Board, No. 1927,
Transportation Research Board of the National Academies, Washington, D.C., 2005, pp. 46–54.
Slug-lines.com, 2009. www.slug-lines.com. Accessed August 2009.
TRB, 2006. Transit Cooperative Research Program, Report 95, HOV Facilities. Traveler Response to Transportation
System Changes, Transportation Research Board, 2006.
TRB, 2009. Program for the 89th
Annual General Meeting, January 2010. Workshop: Reinventing Carpooling – to
Help Meet Transportation’s Greatest Challenges.
VDOT, 2006. Dynamic Ridesharing (Slugging) Data. Prepared for Virginia Department of Transport, June 15, 2006.
Final Report. Prepared by Vanasse Hangen Brustlin, Inc.
Wall, L., 2002. Impatient Commuters Form Impromptu Car Pools. Houston Chronicle, December 2, 2002
Wikipedia, 2009. Definition of slugging extracted from Wikipedia at http://en.wikipedia.org/wiki/Slugging,
November 2009.
WS Legislature, 2009. Washington State Transportation Budget, April 2009.

Page 28 of 28
APPENDIX 1: RULES AND ETIQUETTES OF CASUAL CARPOOLING The following extracted from www.ridenow.org/carpool/what.htm, August 2009.
"Rules" and Etiquette
Casual car pools are not "run" by any organization or authority. They have worked well for over 20 years based on a
few simple rules that have evolved among drivers and passengers.
Regular car pools on the Bay Bridge and I-80 are required to have three or more people in a car. An exception is
made for cars and trucks that have only two seats. Such vehicles may use the car pool lanes when there are two
people in the vehicle. (Note: most pick-ups do not count as two-seat vehicles. The number of seats/seat-belts the
vehicle was manufactured with - including jump seats - is the official "count.")
There is no exchange of money involved. It's a mutual benefit operation: drivers save time and a toll; riders enable
the drivers to do that.
People are usually careful to form as many car pools as possible. This means no more than three people per car. In
the afternoon in San Francisco, however, if there is still a substantial line of passengers after 6 pm, drivers are urged
to take as many people as their vehicles can hold so as many passengers as possible can get rides home.
People are quite mindful of the "first-come, first-served" aspect of the lines. Avoid the ire of your fellow
commuters: don't "line-jump."
On the other hand, riders and drivers are free to wait for another driver/rider. For example, a woman may not
want to get into a two-seat car with a male driver, or a woman driver may prefer to wait for a female rider. As far as
we've seen, such choices are respected without comment or disapproval.
Food. Passengers should assume that food and drink are not allowed in driver's cars.
Music. Drivers should be considerate of passengers when listening to music, news or talk radio. Rear speakers and
subwoofers produce much more sound than side door speakers, so please keep your volume in check.
Drive cautiously. Drivers are encouraged to drive extra cautiously when commuting with passengers, particularly
when it comes to lane changes to and from the diamond lane, and also with regard to cell-phone use (especially
without a hands-free set). There have been more than a few accidents involving casual carpool vehicles. Passengers
notice and even gossip about the wild drivers. This may cost you time waiting in line if passengers skip your
vehicle.
Seatbelts. Passengers should put on their seatbelts. It's the law, and the driver could get a ticket if you don't.
Please be mindful of business and residential neighbors. Drivers should avoid blocking driveways and side streets
while waiting for passengers. Never stop in a bus zone. The fine is now more than $250!
As far as anyone seems to know, over the history of East Bay casual carpooling, there have been no untoward
incidents. The "three-per-car" requirement has helped. A little caution and common sense also have helped.
Passengers can always decline a ride. For example, female passengers have been known to decline rides in two-seat
cars. They simply let another passenger go first, and wait for a larger vehicle.
Talking. Drivers generally should be the ones to initiate any conversation. Passengers should keep in mind that
some drivers need or prefer to keep their minds focused on the road rather than chat.
Passengers are encouraged to be considerate of other passengers who might have tall or large bodies which more
comfortably fit in front seats than back.
In the afternoon, if you are a passenger in a vehicle which crosses a toll bridge after 7 pm, you are urged to offer
enough to cover more than your share of the toll (for example, $2 per passenger instead of $1 in a 3-person carpool).
This will encourage drivers to continue picking up passengers later into the evening, plus it's still a great deal for the
passenger.
In the morning, drivers are encouraged to offer an approximate final destination in San Francisco (for example,
Civic Center, South of Market, Financial District or cross streets). Passengers greatly appreciate riding for a few
extra blocks if your commute routes partially overlap. You might even meet a permanent carpool passenger!
Enjoy the ride!