floodplain modeling due to dam break using...
TRANSCRIPT
FLOODPLAIN MODELING DUE TO DAM BREAK USING CCHE2D_FLOOD
NURUL ATIQAH BINTI OMAR
A project report submitted in partial fulfilment of the
requirements for the award of the degree of
Master of Engineering (Civil – Hydraulics and Hydrology)
Faculty of Civil Engineering
Universiti Teknologi Malaysia
JANUARY 2013

iii
To my beloved family:
Father, Omar Bin Othman
Mother, Shakinah Bt. Ya’acob
Siblings; Nurul Aswa, Muhammad Syafiq, Nurul Athirah,
Muhammad Syamil & Muhammad Syarafi

iv
ACKNOWLEDGEMENT
Alhamdulillah, grateful to Allah s. w. t for guiding and helping me in
completion of this dissertation within the time given.
First of all, I would like to express my heartiest gratitude and
acknowledgment to my supervisor, Pn. Zainab Mohamed Yusof for her contribution,
guidance, and patience during meeting and discussion throughout the process for
completing this project.
Besides, I would like to extend my gratitude to my parent and siblings who
have provided the opportunity to attempt this project through their support of my
educations and their sacrifices and understanding throughout its creation. Without
their support and tolerance, it would never have been possible.
Finally, to those direct or indirectly involved in making this collaboration of
ideas into reality, thanks once again.
v
ABSTRACT
The prediction of floodplains caused by dam break is very important to
discuss for future planning and decision making concerning to dam safety,
controlling downstream developments, contingency evacuation planning and real
time flood forecasting. The objectives of this study are (1) to determine the
propagation of flood in the study area, in terms of water depth and velocity
magnitude, and (2) to identify the potential area of high risk of flooding. The
comparison of results using one point source input flood discharge (total discharge)
and flood hydrograph have been carried out. The floodplain simulation in this study
using software is called as CCHE2D_FLOOD model. The study area is at Durian
Tunggal Dam, located in Melaka. The dam has been classified as a significant hazard
dam with a catchment area of 41.4 km2, impounded area of 5.8 km
2 and a storage
volume of 32.6 Mm3. A flood hydrograph due to dam break, observed by Rahimah
(2009) is used as a model parameters input to simulate the propagation of flood in the
surrounding areas of Durian Tunggal river. The results of water depth, velocity
distribution, and time required to flooding are the parameters that needed to be
analysed.

vi
ABSTRAK
Ramalan dataran banjir yang disebabkan oleh pecahan empangan adalah
sangat penting untuk membincangkan bagi perancangan masa depan dan membuat
keputusan mengenai keselamatan empangan, mengawal perkembangan hiliran,
perancangan pemindahan di luaar jangkaan dan ramalan masa sebenar berlakunya
banjir. Objektif kajian ini adalah (1) untuk menentukan penyebaran banjir di
kawasan kajian, dari segi kedalaman air dan halaju magnitud, dan (2) untuk
mengenal pasti kawasan yang berpotensi menghadapi banjir yang berisiko tinggi.
Perbandingan keputusan dengan menggunakan input satu titik sumber pelepasan
banjir (jumlah pelepasan) dan hidrograf banjir telah dijalankan. Simulasi dataran
banjir dalam kajian ini menggunakan perisian yang dikenali sebagai
CCHE2D_FLOOD model. Kawasan kajian adalah di Empangan Durian Tunggal,
yang terletak di Melaka. Empangan telah diklasifikasikan sebagai empangan bahaya
yang ketara dengan kawasan tadahan 41.4 km2, kawasan takungan sebanyak 5.8 km
2
dan jumlah penyimpanan sebanyak 32.6 Mm3. Satu hidrograf banjir yang disebabkan
kepada pecahan empangan, diperhatikan oleh Rahimah (2009) digunakan sebagai
input parameter model untuk simulasi penyebaran banjir di sekitar kawasan sungai
Tunggal Durian. Keputusan kedalaman air, pengagihan halaju, dan masa yang
diperlukan untuk banjir adalah parameter yang diperlukan untuk dianalisis.
vii
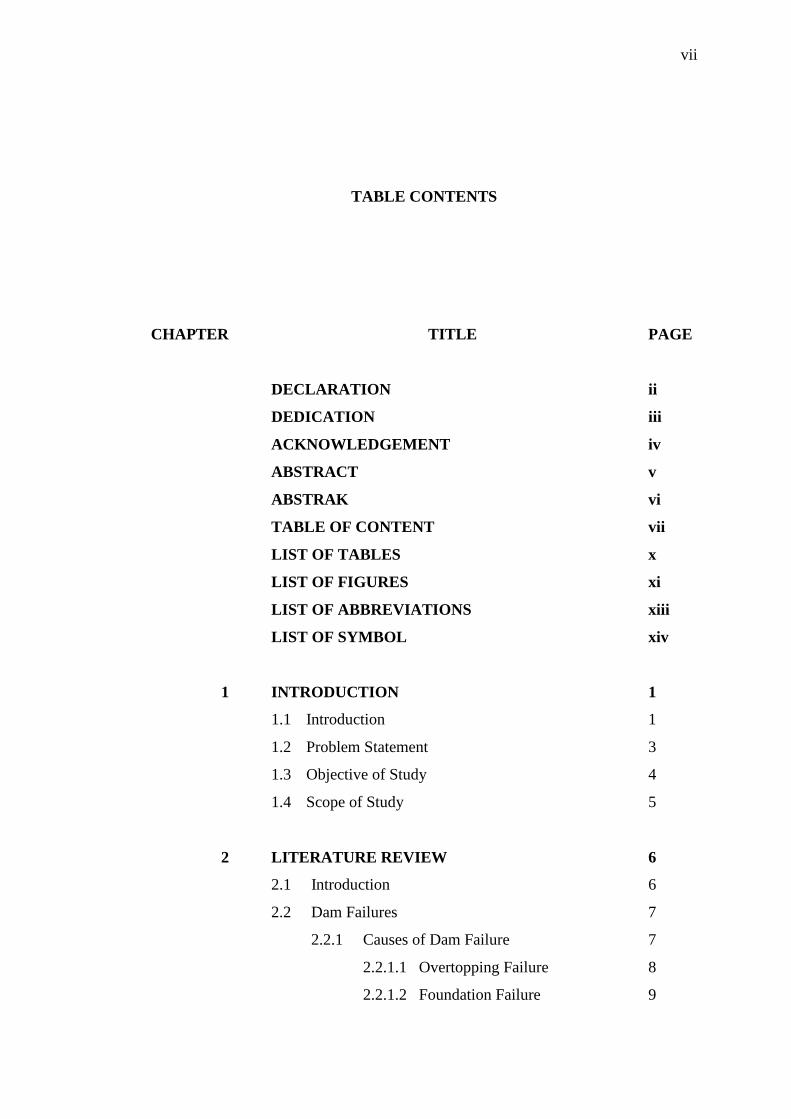
TABLE CONTENTS
CHAPTER
TITLE PAGE
DECLARATION
DEDICATION
ACKNOWLEDGEMENT
ABSTRACT
ABSTRAK
TABLE OF CONTENT
LIST OF TABLES
LIST OF FIGURES
LIST OF ABBREVIATIONS
LIST OF SYMBOL
ii
iii
iv
v
vi
vii
x
xi
xiii
xiv
1 INTRODUCTION
1.1 Introduction
1.2 Problem Statement
1.3 Objective of Study
1.4 Scope of Study
1
1
3
4
5
2 LITERATURE REVIEW
2.1 Introduction
2.2 Dam Failures
2.2.1 Causes of Dam Failure
2.2.1.1 Overtopping Failure
2.2.1.2 Foundation Failure
6
6
7
7
8
9

viii
3
2.2.1.3 Piping and Seepage Failure
2.3 Types of Flood
2.3.1 Overbank Flooding
2.3.2 Flash Flooding
2.4 Floodplains
2.5 Function of Floodplain
2.6 Flood Routing
2.6.1 Flood Hydrograph
2.7 Flood Modeling
2.7.1 Fundamental of Flood Modeling
2.7.2 Numerical Model
2.8 Model Simulation
2.8.1 Introduction
2.8.1.1 Overview of
CCHE2DD_FLOOD Model
2.8.1.2 Components of CCHE2D
Model
2.8.2 General Procedures of CCHE2D Model
2.8.2.1 Mesh Generation
2.8.2.2 Boundary Conditions
2.8.2.3 Parameter Setting
2.8.2.4 Simulation
2.8.2.5 Results Interpretation
2.8.3 Model Formulation
2.8.3.1 Governing Equation
2.8.3.2 Turbulence Models
2.8.3.4 Two-dimensional k -
Model
2.9 Summary
METHADOLOGY
3.1 Introduction
3.2 Site description
10
12
12
13
13
15
15
16
17
19
20
21
21
21
22
24
25
25
26
26
27
27
27
28
29
30
32
32
33

ix
4
5
3.2.1 Parameters of Durian Tunggal Dam
3.3 Simulation Data
3.4 Model Simulation
3.4.1 CCHE2D – Mesh Generator
3.4.2 CCHE2D GUI (Graphical User
Interface)
3.4.2.1 Flow initial condition
3.4.2.2 Bed Roughness
3.4.2.3 Flow Parameters
3.4.2.4 Boundary Conditions
3.4.2.5 Run Simulation
3.5 Summary
RESULTS AND DISCUSSIONS
4.1 Introduction
4.2 Simulation Results
4.2.2 Flood Depth
4.2.3 Velocity Magnitude
4.3 Flooded Area
4.4 Potential of High Risk Flooded Area
4.5 Summary
CONCLUSIONS AND RECOMMENDATIONS
5.1 Conclusion
5.2 Recommendation for Future
REFERENCES
35
36
37
37
39
39
40
41
42
46
46
48
48
49
49
52
56
57
59
60
60
61
63

x
LIST OF TABLES
TABLE NO. TITLE
PAGE
3.1
4.1
Information data of Durian Tunggal Dam
Percentage differences of flooded area from 1 hour to
6 hours duration for total discharge (Q = 670 m3/s)
and discharge hydrograph
35
55

xi
LIST OF FIGURES
FIGURE NO TITLE
PAGE
1.1
2.1
2.2
2.3
2.4
2.5
2.6
2.7
2.8
2.9
2.10
3.1
3.2
3.3
3.4
3.5
3.6
3.7
3.8
Flooding at town of Campos dos Goytacazes due
tothe dam failure
Causes of Dam Break
An example failure of Banqiao dam due to
overtopping
Failure of Hauser Dam due to foundation failure
An example St. Francis Dam failure
The floodplain with floodway
Flood routing concept
The numerical method of a cell centered grid.
The family package of CCHE2D_FLOOD model
An interface of CCHE2D Mesh Generator
An interface of CCHE2D_GUI
Location map of Durian Tunggal Dam
Location map of Durian Tunggal Dam by Google
earth
Interface of CCHE2D on digital elevation map
The flood hydrograph of Durian Tunggal dam break
event
Generating of block boundaries before interpolation
Mesh generation
Block boundaries after interpolation
Initial water surface setup
4
7
8
9
11
14
17
20
23
23
24
33
34
34
36
38
39
39
40

xii
3.9
3.10
3.11
3.12
3.13
3.14
4.1
4.2
4.3
4.4
4.5
Flow parameters input
Inlet boundary condition
Outlet boundary condition
Example of discharge hydrograph data in .dhg file
format
The discharge hydrograph data and the result of
plotting hydrograph
Simulation console window
Floodplain of water depths for total discharge input
Floodplain of water depths for discharge hydrograph
input
Velocity magnitude distribution for total discharge
input
Velocity magnitude distribution for discharge
hydrograph input
The potential areas of high risk flood due to dam
break are shown in red circles.
42
44
44
45
45
46
50
51
54
55
58

xiii
LIST OF ABBREVIATIONS
USACE
FEMA
GIS
NPDP
EFDC
PMF
HEC-RAS
-
-
-
-
-
-
-
U.S. Army Corp of Engineers
Federal Emergency Management Agency
Geographic Information system
National Performance of Dams Programs
Environmental Fluid Dynamics Code
Probable Maximum Flood
Hydrologic Engineering Centers River Analysis System

xiv
LIST OF SYMBOL
h - Water depth
- Sigma
- Stress
- Karman constant
- Turbulent energy
Axy - Adjustable coefficient of eddy viscosity
C - Chezy’s channel resistance coefficient
cf - Friction coefficient
fcor - Coriolis parameter
g - Gravitational acceleration
k - Turbulent kinetic energy
Q - Discharge (m3/s)
u - Velocity component in direction x
U* - Shear velocity
v - Velocity component in direction y
Z - Water level
ρ - Water density
- Partial differential

CHAPTER 1
INTRODUCTION
1.1 Introduction
Flood is a natural and recurring event for a river or stream. It is a result of
heavy or continuous rainfall exceeding the absorptive capacity of soil and the flow
capacity of rivers, stream, and coastal areas. This causes a watercourse to overflow
its banks onto adjacent lands. Based on Southwest Florida Water Management
District the flood occurs when natural or man-made bodies cannot sufficiently
transport or hold excess water generated by storm or other source. It is important to
note that flooding is a natural occurrence. Rivers, lakes, ditches, ocean and other
water bodies have always overflowed their normal beds to flood the nearby land.
Thus, flooding is a natural phenomenon due to improper planning and need to be
easily prevented.
2
The lands adjacent to these bodies of water, as well as low-lying areas that
cannot transport excess rainfall are called floodplains. A floodplain product of a
larger number of water which is inter-related processes that change over time in
response to external factors. These allocyclic factors such as climate change cause
variation in, for example runoff, biological communities, weathering rate and
sediment flux (Marriot and Alexander, 1999).
The probable flooding damage which may occur due to a dam failure is of
concern to many civil engineers and planners. Not only to provide a source of
information for insurance and flood control studies, but the actual planning process
for the construction of a dam site can be modified by the result of such a predictive
analysis. Dam break studies can be completed by either scaled hydraulic models or
by use computer simulation (Hromadka et al., 1985).
By definition, dams are water storage, control, or diversion structures that
impound water upstream in reservoir. Dam failure can take several forms, including
a collapse of, or breach in, the structures. Dam provide many benefits for our society
but floods resulting from the failure of dams also have produced some of most
devastating disasters of the last two centuries. When dam fails, property damage is
certain, but loss of life can vary dramatically with the extent of the inundation area,
the size of the population at risk, and the amount of warning time available (Wahl,
1998). In order to reduce the potential damage owing to dam breaches, several
hydraulic modeling programs have been developed so that simulate downstream
water levels can be simulated in response to a dam breach (Hoogestraat, 2011).

3
1.2 Problem Statement
The 4th
January 2012, Brazilian authorities are trying to evacuate at least
20,000 people after a dam break in northern Rio de Janeiro state. This indicates an
estimated 66 towns and cities in Minas Gerais state have declared a state of
emergency which is on red alert. Heavy rains caused the dam to burst in Campos dos
Goytacazes, Brazil. Water broke through the dam protecting the town of Campos
dos Goytacazes, opening up a big crater in a highway. Rio and other part of south-
eastern Brazil have been battered by floods and landslides, with several people
killed. A dam protecting Campos dos Goytacazes ruptured, sending floodwater from
the River Muriae toward the small community of Tres Vendas some 30 km away.
Many roads have been blocked, making it difficult to get help and supplies to
affected areas. Last year more than 800 people died due to serve flooding in Rio de
Janerio. Figure 1.1 shows the town of Campos dos Goytacazes due to the dam
failure.
In Malaysia, there is about seventy four dam and most of the dam areas are
located at the upstream of residential areas (Hassan, 2002). When dam break is
occurred, it will contribute to affect the economic activities and surrounding
environment. Based on USACE criteria, the Durian Tunggal Dam has been
classified as a significant hazard dam. The consequences of a failure resulted on
potential loss of life, damage and destruction of property, forcing evacuation people
and vital resources. It is also caused the interruption of traffic by bridge and
highway inundation, damage or destruction.
To be noted, a dam failure may involve the volume of water release to
downstream, particularly where a large dam is involved. The amount of washout is
so great that it overwhelms existing flood control or river control structures
downstream of dam. The mere presence of floodwaters will certainly cause water
related to damage in many area, and the high velocity of flow that will likely

4
accompany such a flood event may also cause structural or erosion related damage
(Jeff et al., 2006).
Figure 1.1: Flooding at town of Campos dos Goytacazes due tothe dam failure.
1.3 Objectives of Study
The main objectives of this study are:
1. to determine the propagation of flood in terms of water depth and velocity
flow.
2. to compare the floodplain results using (a) total discharge input (b) flood
hydrograph.
3. to identify the potential area of high risk flood.

5
1.4 Scope of Study
The scopes of this study are:
1. The study area covers the downstream of Durian Tunggal dam,
including Sungai Durian Tunggal and its surrounding areas.
2. The simulation is carried out using CCHE2D_FLOOD model to
predict profile of hydrodynamic flow and floodplain inundation.
3. The length of the Durian Tunggal river is about 5 km
4. The turbulence model used to simulate unsteady flow is k- model.
5. The maximum simulation time to predict the flood is within 6 hours
(total discharge input) and 17 hours (flood hydrograph) of simulation.

63
REFERENCES
A. Martin, P. (2007). Floodplains. Retrieved April 6, 2012, from Center for Earth
and Enviromental Science:
http://www.cees.iupui.edu/education/Information_Resources/floodplains.htm.
Chen, C.-J., & Jaw, S.-Y. (1998). Fundamentals of Turbulence Modeling. UK:
Taylor & Francis.
Abdullah, R. (2009). Dam Break Analysis. Malaysia: Syarikat Air Melaka Berhad.
Baharudin, A. & Zorkeflee, A. H. (2011). Flood Map of Tupai River Using
Combined 1D and 2D Modeling. Penang, Malaysia, 3th International Conference on
Managing Rivers in the 21th Century: Sustainable Solutions for Global Crisis of
Flooding, Pollution and Water Scarcity.
Doswell, C. A. (2003). Flooding. Encyclopedia of Atmospheric Sciences , article MS-
151.
Federal Emergency Management Agency (FEMA). Floods and Floodplain
Management. http://www.fema.gov.
France, P. (1992). Fluid Flow Modelling. A Runge-Kutta Approach for Reservior
Flood Routing Analysis , 601-607.
Geographic, N. (1996). Floods. Environment,
http://environment.nationalgeographic.com/environment/natural-disasters/floods-
profile/.
Hawker & Patrick. (2007). A Review of the Role of Dams and Flood Management.

64
Hoogestraat, G. K. (2011). Flood Hydrology and Dam-Breach Hydraulic Analyses of
Four Reservoirs in the Black Hills, South Dakota. U.S: U.S. Geological Survey.
Hromadka, T. V., Berenbrock, C. E., Frecklenton, J. R., & Guymon, G. L. (1985). A
two-dimensional dam-break flood plain model. Adv. Water Resources , 8, 7-14.
International, P. (2008). How Dams Fail. http://www.uclm.es.
Ismail, I. K. (2004). Dam Break studies. Universiti Teknologi Malaysia.
Jeff, J., Ying, X., & Wardlaw, W. (2006). Two-Dimensional Modeling of Dam
Breach Flooding. US-CHINA Workshop on Advanced Computational Modelling in
Hydroscience & Engineering , 19-21.
Marriot, S. B., & Alexander, J. (1999). Floodplains: interdisciplinary approaches.
London: The Geological Society.
National Performance of Dams Programs (NPDP). (2007). The Dam Performance
Report is a quarterly publication of the National Performance of Dams Program.
Retrieved April 7, 2009. http://www. npdp.stanford.edu.
River, F. o. (2007, Mac 15). About us: Friend of River. Retrieved Mac 27, 2012,
from Friend of River Web site: http://www.friendsoftheriver.org.
Southwest Florida Water Management District (n.d.). Understanding. Retrieved Mac
23, 2012, from
http://www.swfwmd.state.fl.us/publications/files/understanding_flooding.pdf.
Sabri, H. (2002). Dam Safety Surveillance-DID Perspectibe. Bangi: Paper presented
at National Training Course on Use of Isotopes as Alternative Techniques in Dam
Safety and Dam Sustainability, Malaysian Institute for Nuclear Technology Research
(MINT).
Simon, A. L., & Scott, K. F. (1997). Hydraulics (Fourth ed.). United States: Prentice
Hall.
(NPDP), N. P. (2007). The Dam Performance Report is a quarterly publication of the
National Performance of Dams Program. Retrieved April 7, 2009. http://www.
npdp.stanford.edu.

65
Ismail, I.K. (2004). Dam Break studies. Universiti Teknologi Malaysia.
Jeff, J., Ying, X., & Wardlaw, W. (2006). Two-Dimensional Modeling of Dam
Breach Flooding. US-CHINA Workshop on Advanced Computational Modelling in
Hydroscience & Engineering , 19-21.
Marriot, S. B., & Alexander, J. (1999). Floodplains: interdisciplinary approaches.
London: The Geological Society.
McLaughlin, J. D. (2004). Flood Plain Modeling/Mapping . San Diego: I
International User Conference.
Friend of River. (2007, Mac 15). About us: Friend of River. Retrieved Mac 27, 2012,
from Friend of River Web site: http://www.friendsoftheriver.org
Southwest Florida Water Management District (n.d.). Understanding. A Guide to
Protecting Lives and Property From Flooding , p.
http://www.swfwmd.state.fl.us/publications/files/understanding_flooding.pdf.
Sabri, H. (2002). Dam Safety Surveillance-DID Perspectibe. Bangi: Paper presented
at National Training Course on Use of Isotopes as Alternative Techniques in Dam
Safety and Dam Sustainability, Malaysian Institute for Nuclear Technology Research
(MINT).
Simon, A. L., & Scott, K. F. (1997). Hydraulics (Fourth ed.). United States: Prentice
Hall.
Syme, B. (2007). TUFLOW. Retrieved 10 27, 2012, from Flood and Coastal
Simulation Sofware: http://www.tuflow.com
Wahl, T. L. (1998). Prediction of Embankment Dam Breach Parameters. U.S:
Bureau of Reclamation, Water Resources Research Laboratory.
Ying, X., & Wang, S. S. (2004). Modeling Flood Inundation Due To Dam And
Levee Breach. Advanced omputational Modelling in Hydro-Science and
Engineering. USA: Oxford, Mississippi.
66
Ying, X., & Wang, S. S. (2004). Two-Dimensional Numerical Simulations of
Malpasset Dam-Break Wave Propagation. USA: Advanced in Hydro-Science and
Engineering.
Ying, X., Wang, S. S., & Khan, A. A. (2003). Numerical Simulation of Flood
Inundation Due To Dam and Levee Breach . USA: Proceeding of ASCE World
Water & Environmental Resources Congree 2003 (CDROM), Philadelphia.
Yuan, Y., & Qaiser, K. (2011). Floodplain Modeling in the Kansas River Basin
Using Hydrologic Engineering Center (HEC) Models. Washington: U.S.
Environmental Protection Agency.
Zhang, Y. (2006). CCHE-GUI – Graphical Users Interface for NCCHE Model
User’s Manual– Version 3.0. United States: The University of Mississippi.
Zhang, Y., & Jia, Y. (2009). CCHE-MESH: 2D Structured Mesh Generator. The
University of Mississippi. United States: Technical Report No. NCCHE-TR-2009-
01.
Zorkeflee, A. H., Aminuddin, A. G., & Nor Azizi, Z. (2007). Application of 2-D
Modelling for Muda River Using CCHE2D. Malaysia: 2nd International Conference
on Managing River in the 21th Century.