i water reticulation model for taman maju, parit...
TRANSCRIPT

i
WATER RETICULATION MODEL FOR TAMAN MAJU, PARIT RAJA
OTMAN MOHAMED O. ELOJALI
This thesis is presented as to fulfill part of the requirement for the award of the
Master of Civil Engineering
Faculty of Civil and Environmental Engineering
Universiti Tun Hussein Onn Malaysia
MAY, 2011

v
ABSTRAK
Satu model numerikal telah dihasilkan untuk menilai kuantiti kehilangan turus tenaga
dalam jaringan pengagihan air di Taman Maju, Parit Raja, Johor. Sebuah pengiraan
numerikal mempunyai kelebihan berbanding sebuah pengiraan manual apabila
menganalisa sebuah jaringan pengagihan yang kompleks. Bahasa pengaturcaraan
yang digunakan dalam kajian ini ialah Microsoft Visual Basic 6.0. Kaedah Hardy-
Cross dipilih untuk mengira jumlah kehilangan turus tenaga yang berlaku dalam
jaringan pengagihan air gelung Taman Maju. Jenis paip yang digunapakai dalam
jaringan pengagihan air Taman Maju ialah jenis unplasticised polyvinyl chloride
(uPVC) dengan pemalar kekasaran k = 0.0015 mm. Oleh kerana Taman Maju
meliputi perumahan teres, permintaan air ialah 1360 liter/unit/hari. Tiga gelung
rangkaian telah dipertimbangkan, iaitu gelung A, B dan C untuk sistem retikulasi
Taman Maju. Kadar alir akhir dalam setiap paip telah diperolehi. Model ini berguna
untuk mengurangkan tempoh masa yang digunakan dalam pengiraan kadar alir yang
telah didapati berada dalam keperluan rekabentuk. Jika perbandingan dibuat di antara
pengiraan manual, akan terdapat sedikit perbezaan. Hasil akhir adalah berbeza
kerana bilangan tempat perpuluhan yang ditetapkan dalam pengiraan manual dan
model adalah berbeza.

vi
ABSTRACT
A numerical model is developed to quantify energy head losses occurred in the water
distribution network of Taman Maju, Parit Raja, Johor. A numerical computation has
the advantage over a manual computation when analyzing a complex distribution
network. The programming language used in this study is the Microsoft Visual Basic
6.0. Hardy-Cross method is selected to calculate the total energy head loss incurred
in the looped water distribution network of Taman Maju. The type of pipe used in the
water distribution network of Taman Maju is the unplasticised polyvinyl chloride
(uPVC) type with the roughness coefficient k = 0.0015 mm. Since Taman Maju
consists of terrace houses, the water demand is 1360 litres/unit/day. Three loop
networks are considered, namely loop A, B and C for Taman Maju reticulation
system. The final flow rate in each pipe has been obtained. This model is helpful in
reducing the period of time to calculate the flow rate which is found to be within the
piping system design requirement. If comparison is made between the manual
calculation, it will definitely shows some difference. The final result will be different
because the decimal places fixed are different in manual and model.

vii
CONTENTS
TITLE i
CONFESSION ii
DEDICATION iii
ACKNOWLEDGMENT iv
ABSTRAK v
ABSTRACT vi
CONTENTS vii
LIST OF SYMBOLS AND ABBREVIATIONS x
LIST OF TABLES xi
LIST OF FIGURES xii
CHAPTER I INTRODUCTION 1
1.1 Research Background 1
1.2 Problem Statement 3
1.3 Objectives of Study 4
1.4 Scopes of Work 4
CHAPTER II LITERATURE REVIEW
2.1 History of Water Supply and Distribution 7
2.2 Water Supply in Malaysia 12
2.3 Water Supply in Johor 16
2.4 Water Distribution System 16
2.5 Water Reticulation System 18
2.6 Water Demand 22
2.6.1 Industries 22

viii
2.6.2 Residential 23
2.7 Types of Waterworks Pipe 24
2.8 Design Velocity and Hydraulic Gradient 29
2.9 Head Losses in Pipe 29
2.9.1 Friction Loss in Pipe 30
2.9.1.1 Friction Factor f 32
2.9.2 Minor Losses in Pipe 34
2.9.2.1 Loss of Energy Heat at Entrance 35
2.9.2.2 Loss of Energy Heat at Submerged 35
Discharge
2.9.2.3 Loss of Energy Head due to Pipe 36
Contraction
2.9.2.4 Loss of Energy Head due to Pipe 37
Expansion
2.9.2.5 Loss of Energy Head due to Pipe 38
Fittings
2.9.2.6 Loss of Energy Head in Bends and 39
Elbows
2.10 Flow Estimation 40
2.10.1 Hardy-Cross Method 40
2.11 Microsoft Visual Basic 6.0 41
2.11.1 Command Button Control 43
2.11.2 Label Control 44
2.11.3 Text Box Control 44
2.11.4 Option Control Button 45
2.11.5 Frame Control 46
2.11.6 Combo Box Control 46
CHAPTER III METHODOLOGY 47
3.1 Study Methodology 47
3.2 Microsoft Visual Basic Environment 50
3.2.1 Design Mode 51
3.3 Hardy-Cross Analysis Method 57

ix
3.3.1 Principles of Hardy-Cross Analysis Method 57
3.3.2 Balancing Pressure and Flow Rate 58
3.3.3 Reynolds Number Re 59
3.3.4 Pipe Friction Coefficient 59
3.3.5 Friction Loss hf 60
3.3.6 Head Losses 61
CHAPTER IV RESULTS AND DISCUSSIONS 62
4.1 Study Area 62
4.2 Initial Data for Case Study 65
4.2.1 Flow in Pipes 65
4.2.2 Decision Analysis of Darcy-Weisbach 73
4.2.3 Decision Analysis of Hazen-Williams 86
4.3 Result Interface 91
CHAPTER V CONCLUSIONS AND RECOMMENDATIONS 92
5.1 Summary of Study 92
5.2 Conclusions 93
5.3 Recommendations 93
5.3.1 Improving and Upgrading Model 93
5.3.2 Developing New Model 94
REFERENCES 95

x
LIST OF SYMBOLS AND ABBREVIATIONS
a acceleration of fluid flow
A cross-sectional area of fluid flow
C Hazen-Williams coefficient
D diameter of pipe
Q correction for assumed flow rate
e surface roughness of pipe
f friction factor
F inertial force
g gravitational acceleration
hf frictional head loss
K Hardy Cross coefficient or head loss coefficient
L length of pipe
m mass of fluid
υ kinematic viscosity of fluid
Q flow rate
Qa assumed flow rate
Q corrected flow rate
Re Reynolds number
ρ density of fluid
V velocity of flow

xi
LIST OF TABLES
2.1 General timeline of water supply and its distribution 7
2.2 History of Malaysia water supply system 12
2.3 Advantages and disadvantages of types of water supply distribution 18
system
2.4 Industrial water demand guideline by the Malaysian Water Association 23
2.5 Residential water demand by the Malaysian Water Association 23
2.6 Advantages and disadvantages of water supply pipe materials 24
2.7 Hazen-Williams roughness coefficient for pipes 31
2.8 Roughness e of pipe in mm 34
2.9 Loss coefficients due to sudden contraction of pipe 36
2.10 Values of loss factors for pipe fittings 39
2.11 The equivalent Visual Basic constants for combo box controller 46
4.1 Analyses for loop (A) 67
4.2 Case study data for loop (B) 69
4.3 Case study data for loop (C) 73
4.4 Analysis result for loop (A) 85
4.5 Analysis result for loop (B) 85
4.6 Analysis result for loop (C) 86
4.7 Analysis result for loop (A) 89
4.8 Analysis result for loop (B) 89
4.9 Analysis result for loop (C) 90

xii
LIST OF FIGURES
1.1 Head losses incurred in the distribution pipeline reduces the 2
pressure in the system
1.2 Layout of water reticulation system of Taman Maju, Parit Raja 6
2.1 Malaysian water authorities 15
2.2 Three types of water supply distribution systems 17
2.3 Distribution system feeds: (a)-(b) single main feed, and (c) use of ring 20
main
2.4 Moody chart 32
2.5 Loss coefficient K due to flow entrance into pipe 35
2.6 Loss of energy head when pipe discharges fluid into filled reservoir 35
2.7 Pipe contraction 36
2.8 Flow expansion 37
2.9 Values of K can be obtained for various cone angle 38
2.10 Loss coefficient K due to bends and elbows 39
2.11 Controller at operating box (toolbox) 45
3.1 Methodology of the development of water distribution network numerical 48
model for Taman Maju, Parit Raja, Johor
3.2 Plan of studies for the head loss model of water distribution for Taman 49
Maju, Parit Raja using Visual Basic 6.0
3.3 The main window 52
3.4 The form window 53
3.5 Properties of the form and output screen can be set on the properties form 54
3.6 Form layout window 55
3.7 Project window 55

xiii
3.8 Application of the control button 56
4.1 Location of Taman Maju (also known as Taman Maju Baru), Parit Raja 62
4.2 The water distribution layout for Taman Maju, Parit Raja 64
4.3 User interface developed for Taman Maju water reticulation system 91

CHAPTER 1
INTRODUCTION
1.0 Research Background
Renewable sources of fresh water on the earth’s surface are limited and irregularly
distributed in space and time. There are about 1360 million km3 of water on the surface
of the earth. More than 97% of this volume comes from the oceans or seas. The
remainder of about 37 million km3 is fresh water (Eisenberg and Kauzmann, 1969).
However, most of the fresh water on the earth is of little use because it is in the forms of
ice-caps and glaciers. Approximately 8 million km3 of the water is stored in relatively
inaccessible groundwater and about 0.126 million km3 are contained in lakes, reservoirs
and streams (Franks, 1972). In recent years, the ever-increasing growth in the population
of urban areas and the desire for security and a higher standard of living have attracted
the attention on problems related to water economy. Such attention brought and will
continue to bring about a surge in water-management work on a global scale. Thus,
engineers, agriculturists, environmentalists, irrigation specialists, meteorologists, and
hydrologists will have unparalleled opportunities to put their knowledge and skill to
work for humanity.
Humans have contained water supply in one location by collecting it and creating
a more reliable and constant supply despite its natural variation. Reservoirs are
replenished by many sources including streamflow, groundwater, snow, and/or rainfall.
They are diminished by multiple losses including consumption and friction losses. Water

2
storage is designed to meet multiple objectives such as hydropower, irrigation, potable
supplies, fishing and recreation, and to reduce the risk of floods and droughts
(UNESCO, 2006).
Figure 1.1: Head losses incurred in the distribution pipeline reduces the pressure in the
System.
In hydraulic engineering practices, it is often necessary to estimate the head loss
incurred by fluid as it flows through a pipeline and it is one of the most important
problems in water distribution system. Friction loss refers to the difference in pressure
needed to overcome the pressure drop during flow through pipe. Friction loss occurs as a
result of dynamic movement caused by flow. Therefore, the pressure difference
associated with this process is referred to as the dynamic differential pressure. Friction
losses can only occur when flow actually takes place. Once a fluid begins to flow
through a pipe it will therefore be necessary to overcome the extra difference in pressure
(a) plan view
(b) cross sectional view

3
caused by friction losses. This will have to be provided by the pump, in addition to it
overcoming the stationary differential pressure. The pump’s differential pressure will
always be made up of the sum total of the stationary and dynamic differences in
pressure.
Loss of head is incurred by fluid mixing which occurs at fittings such as bends or
valves, and by frictional resistance at the pipe wall. Where there are numerous fittings
and the pipe is short, the major part of the head loss will be due to the local mixing near
the fittings. For a long pipeline, on the other hand, skin friction at the pipe wall will
predominate.
Head losses are generally the result of two mechanisms, friction along the pipe
walls and the turbulence due to changes in streamlines is through fittings and
appurtenances. Head losses along the pipe wall are called friction losses or head losses
due to friction, while losses due to turbulence within the bulk fluid are called minor
losses (Ibrahim, 2005). Estimation of head losses due to friction in pipes is an important
task in optimization studies and hydraulic analysis of pipelines and water distribution
systems.
Using a distribution system model, we can have a better view of the flow in the
water supply system and it is convenient to study for friction loss. Such numerical
simulations save a lot of time and can be performed without actually doing the
laboratory experiment.
1.2 Problem Statement
A water supply system is considered successful if it could supply water at the required
quantity and quality with minor loss. In order to supply water to meet the demand, the
water pressure has to adequate at all locations.
There is no network of pipes that is able to deliver water in fully accordance to the
designed system. It is important for the engineers to maximize the delivery of adequate
water supplies while reducing the head loss in the pipe network. Other than the loss due

4
to water leakage or theft, head loss in water supply is also due to the friction loss in the
piping system (Donald, Bruce and Theodore, 2000).
Complex network of pipes that has a lot of connections will increase head loss in
the water distribution system. This factor has to be accounted for while analyzing the
head loss in the flow. Manual method is not only time consuming, but may cause errors
in analysis. Therefore, a pipe network model will be developed using the Microsoft
Visual Basic to obtain an accurate and faster computations.
1.3 Objectives of Study
The objectives of this study are:
1. To develop a numerical model to calculate the head loss occurs in water distribution
pipe system due to frictional resistance and other minor losses,
2. To determine the required head needed to supply water to Taman Maju, Parit Raja,
Johor, and
3. To determine the total head losses involved in the water distribution system of
Taman Maju, Parit Raja, Johor. This requires identification of the sources of head
losses and its quantification.
1.4 Scopes of Work
The water distribution network system to be studied is of the residential area of Taman
Maju, Parit Raja, Johor as shown in Figure 1.2. The pipe network layout and the
characteristics such as the length, diameter, type of pipe as well as the number of
consumers (or demand) are obtained from the Syarikat Air Johor Holdings (SAJH)
Malaysia. The details are also available on the layout.

5
In this study, the head losses considered are due to friction, valve and pipe fittings.
Hardy-Cross method is used to determine the total head loss in the pipe distribution
network. The head loss due to friction is determined using Darcy-Weisbach equation
along with the tabulated Moody chart. The advantage of Darcy-Weisbach method is that
it can be used to calculate frictional losses for all types of fluids.
The programming language used in the study is the Microsoft Visual Basic 6.0.
Microsoft Visual Basic 6.0 is chosen as the programming language as it is user-friendly
and it is known for its graphical interface. The result of analysis can be projected on its
form. Even the Microsoft Office programs utilize Visual Basic in their system
development.

6
Taman Maju or Taman Maju Baru
Figure 1.2: Layout of water reticulation system of Taman Maju, Parit Raja
CHAPTER 2
LITERATURE REVIEW
2.1 History of Water Supply and Distribution
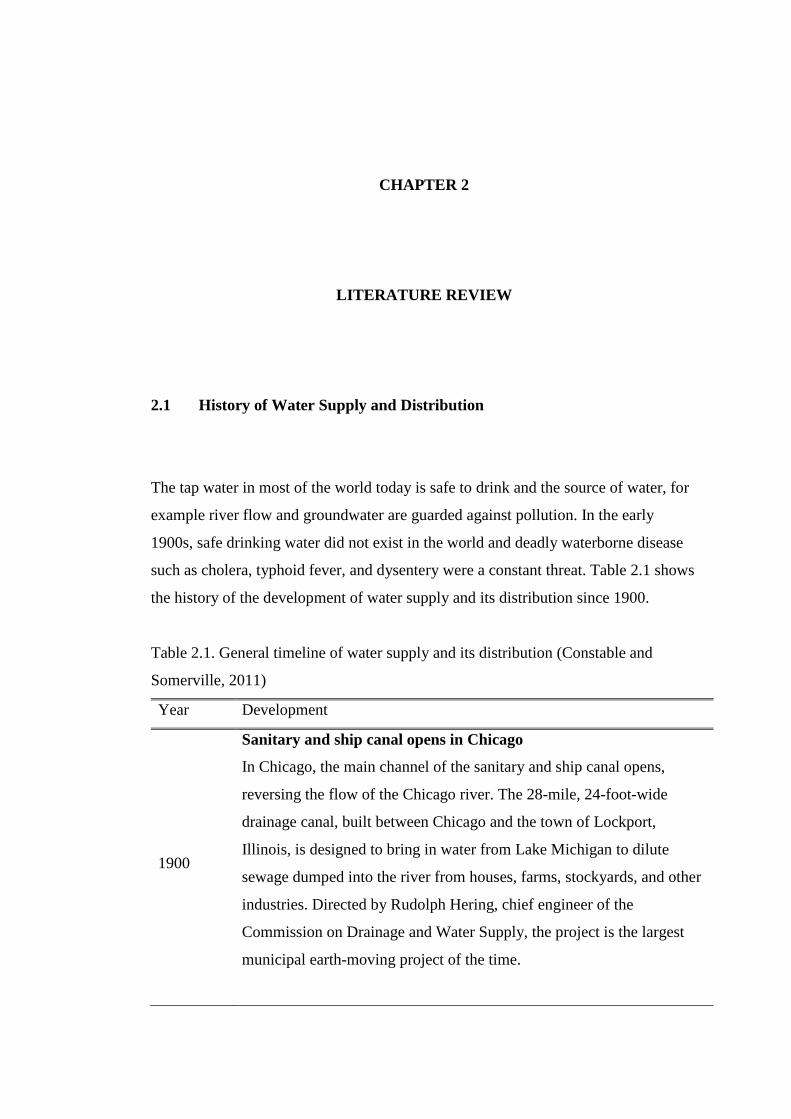
The tap water in most of the world today is safe to drink and the source of water, for
example river flow and groundwater are guarded against pollution. In the early
1900s, safe drinking water did not exist in the world and deadly waterborne disease
such as cholera, typhoid fever, and dysentery were a constant threat. Table 2.1 shows
the history of the development of water supply and its distribution since 1900.
Table 2.1. General timeline of water supply and its distribution (Constable and
Somerville, 2011)
Year Development
1900
Sanitary and ship canal opens in Chicago
In Chicago, the main channel of the sanitary and ship canal opens,
reversing the flow of the Chicago river. The 28-mile, 24-foot-wide
drainage canal, built between Chicago and the town of Lockport,
Illinois, is designed to bring in water from Lake Michigan to dilute
sewage dumped into the river from houses, farms, stockyards, and other
industries. Directed by Rudolph Hering, chief engineer of the
Commission on Drainage and Water Supply, the project is the largest
municipal earth-moving project of the time.

8
1913
Los Angeles-Owens River Aqueduct
The Los Angeles-Owens River Aqueduct is completed, bringing water
238 miles from the Owens Valley of the Sierra Nevada Mountains into
the Los Angeles basin. The project was proposed and designed by
William Mulholland, an immigrant from Ireland who taught himself
geology, hydraulics, and mathematics and worked his way up from a
ditch tender on the Los Angeles River to become the superintendent of
the Los Angeles Water Department. Mulholland devised a system to
transport the water entirely by gravity flow and supervised 5000
construction workers over 5 years to deliver the aqueduct within
original time and cost estimates.
1913
Activated sludge process
In Birmingham, England, chemists experiment with the biosolids in
sewage sludge by bubbling air through wastewater and then letting the
mixture settle; once solids had settled out, the water was purified. Three
years later, in 1916, this activated sludge process is put into operation in
Worcester, England, and in 1923 construction begins on the world’s
first large-scale activated sludge plant, at Jones Island, on the shore of
Lake Michigan.
1914
Sewerage Practice, Volume I: Design of Sewers
Boston engineers Leonard Metcalf and Harrison P. Eddy publish
American Sewerage Practice, Volume I: Design of Sewers, which
declares that working for “the best interests of the public health” is the
key professional obligation of sanitary engineers. The book becomes a
standard reference in the field for decades.
1915
New Catskill Aqueduct is completed
In December, the new Catskill Aqueduct is completed. The 92-mile
long aqueduct joins the Old Croton Aqueduct system and brings
mountain water from west of the Hudson River to the water distribution
system of Manhattan. Flowing at a speed of 4 feet per second, it delivers
500 million gallons of water daily.

9
1919
Formula for the chlorination of urban water
Civil engineer Abel Wolman and chemist Linn H. Enslow of the
Maryland Department of Health in Baltimore develop a rigorous
scientific formula for the chlorination of urban water supplies. In 1908
Jersey City Water Works, New Jersey, became the first facility to
chlorinate, using sodium hypochlorite, but there was uncertainty as to
the amount of chlorine to add and no regulation of standards. To
determine the correct dose, Wolman and Enslow analyze the bacteria,
acidity, and factors related to taste and purity. Wolman overcomes
strong opposition to convince local governments that adding the correct
amounts of otherwise poisonous chemicals to the water supply is
beneficial – and crucial – to public health. By the 1930s chlorination
and filtration of public water supplies eliminates waterborne diseases
such as cholera, typhoid, hepatitis A, and dysentery. The formula is still
used today by water treatment plants around the world.
1930
Hardy Cross method
Hardy Cross, civil and structural engineer and educator, develops a
method for the analysis and design of water flow in simple pipe
distribution systems, ensuring consistent water pressure. Cross employs
the same principles for the water system problem that he devised for the
“Hardy Cross method” of structural analysis, a technique that enables
engineers – without benefit of computers – to make the thousands of
mathematical calculations necessary to distribute loads and moments in
building complex structures such as multi-bent highway bridges and
multistorey buildings.
1935
Hoover Dam
In September, President Franklin D. Roosevelt speaks at the dedication
of Hoover dam, which sits astride the Colorado river in Black Canyon,
Nevada. Five years in construction, the dam ends destructive flooding in
the lower canyon; provides water for irrigation and municipal water
supplies for Nevada, Arizona, and California; and generates electricity
for Las Vegas and most of Southern California.

10
1937
Delaware Aqueduct System
Construction begins on the 115 mile long Delaware Aqueduct System.
Water for the system is impounded in three upstate reservoir systems,
including 19 reservoirs and three controlled lakes with a total storage
capacity of approximately 580 billion gallons. The deep, gravity flow
construction of the aqueduct allows water to flow from Roundout
Reservoir in Sullivan County into New York City’s water system at
Hillview Reservoir in Westchester County, supplying more than half the
city’s water. Approximately 95 percent of the total water supply is
delivered by gravity with about 5 percent pumped to maintain the
desired pressure. As a result, operating costs are relatively insensitive to
fluctuations in the cost of power.
1938-1957
Colorado-Big Thompson Project
The Colorado-Big Thompson Project (C-BT), the first trans-mountain
diversion of water in Colorado, is undertaken during a period of drought
and economic depression. The C-BT brings water through the 13 mile
Alva B. Adams Tunnel, under the Continental Divide, from a series of
reservoirs on the Western Slope of the Rocky Mountains to the East
Slope, delivering 230000 acre-feet of water annually to help irrigate
more than 600000 acres of farmland in northeastern Colorado and to
provide municipal water supplies and generate electricity for Colorado’s
Front Range.
1951
First hard rock tunnel-boring machine built
Mining engineer James S. Robbins builds the first hard rock tunnel-
boring machine (TBM). Robbins discovers that if a sharp-edged metal
wheel is pressed on a rock surface with the correct amount of pressure,
the rock shatters. If the wheel, or an array of wheels, continually rolls
around on the rock and the pressure is constant, the machine digs deeper
with each turn. The engineering industry is at first reluctant to switch
from the commonly used drill-and-blast method because Robbins’s
machine has a $10 million price tag. Today, TBMs are used to excavate
circular cross-section tunnels through a wide variety of geology, from
soils to hard rock.

11
1955
Ductile cast-iron pipe becomes the industry standard
Ductile cast-iron pipe, developed in 1948, is used in water distribution
systems. It becomes the industry standard for metal due to its superior
strength, durability, and reliability over cast iron. The pipe is used to
transport potable water, sewage, and fuel, and is also used in fire-
fighting systems.
1960s
Kuwait begins using seawater desalination technology
Kuwait is the first state in the Middle East to begin using seawater
desalination technology, providing the dual benefits of fresh water and
electric power. Kuwait produces fresh water from seawater with the
technology known as multistage flash (MSF) evaporation. The MSF
process begins with heating saltwater, which occurs as a byproduct of
producing steam for generating electricity, and ends with condensing
potable water. Between the heater and condenser stages are multiple
evaporator-heat exchanger subunits, with heat supplied from the power
plant external heat source. During repeated distillation cycles cold
seawater is used as a heat sink in the condenser.
1970s
Aswan High Dam
The Aswan High Dam construction is completed, about 5 kilometers
upstream from the original Aswan Dam (1902). Known as Saad el Aali
in Arabic, it impounds the waters of the Nile to form Lake Nasser, the
world’s third largest reservoir, with a capacity of 5.97 trillion cubic feet.
The project requires the relocation of thousands of people and floods
some of Egypt’s monuments and temples, which are later raised. But the
new dam controls annual floods along the Nile, supplies water for
municipalities and irrigation, and provides Egypt with more than 10
billion kilowatt-hours of electric power every year.
1980s
Bardenpho process
James Barnard, a South African engineer, develops a wastewater
treatment process that removes nitrates and phosphates from wastewater

12
without the use of chemicals. Known as the Bardenpho process, it
converts nitrates in activated sludge into nitrogen gas, which is released
into the air, removing a high percentage of suspended solids and organic
material.
1996
UV Waterworks
Ashok Gadgil, a scientist at the Lawrence Berkeley National Laboratory
in California, invents an effective and inexpensive device for purifying
water. UV Waterworks, a portable, low-maintenance, energy-efficient
water purifier, uses ultraviolet light to render viruses and bacteria
harmless. Operating with hand-pumped or hand-poured water, a single
unit can disinfect 4 gallons of water a minute, enough to provide safe
drinking water for up to 1500 people, at a cost of only one cent for
every 60 gallons of water – making safe drinking water economically
feasible for populations in poor and rural areas all over the world.
2.2 Water Supply in Malaysia
Over the past 200 years, Malaysia has started to provide water supply to agriculture,
industries and homes. The foundation of piped water supply was laid down by the
British, once they arrived in Penang. Table 2.2 provides a glimpse of the history of
water supply system in Malaysia.
Table 2.2. History of Malaysia water supply system (Jabatan Bekalan Air, 2009)
Year Development
1804
First formal arrangement for a water supply system was drawn when
the population in Penang breached 10000. An aqueduct made of brick
was constructed to transport clear stream water from hills to town.
Earthen pipes were laid under the streets and water was transported
through tin pipes to homes.

13
1877
Bricks in the aqueduct were often dislodged and the aqueduct was
eventually replaced with a cast iron main. First water main in Malaysia
and traces of it can still be found in the Penang water supply network.
1887
Sarawak was the next British colony to have water mains in Kuching
to provide water to 8000 households. Kuala Lumpur was next to
receive the tap water services.
1889
Melaka was provided with water supply and followed by the rest of the
Federated Malay States. Piped water was soon available to urban
households and from standpipes throughout the country.
1900s
Water was treated before distribution to homes. This came as a result
of an International movement in developed nations that required the
treatment of drinking water to prevent the outbreak of water-borne
diseases such as chorela, typhoid, and dysentery. This paved the way
for water treatment engineers to design and construct filtration and
water treatment plants.
1906 Slow sand filter of Ampang intake was built for Kuala Lumpur.
1915
Disinfection technology using hypochlorite and later, gaseous chlorine
made its appearance.
1934
Rapid gravity filter was built in Ayer Hitam. It was Penang’s first
treatment plant and is still in service today.
1939
Households in major towns of Malaya were well-served with piped
water. Many water installations, however, deteriorated from neglect
during the war years of the Japanese Occupation (1941-45).
1950
Malaya had 100 treatment plants producing 195 million litres of water
per day to supply a population of 1.15 million.

14
1957
Demand for water increased sharply in the years after Independence,
especially in the capital city in Kuala Lumpur.
1959
Klang Gates dam and the Bukit Nanas treatment plant was
commissioned to cope with the rising demand, ending a long period of
water shortage and water rationing.
1976-
1980
During colonial period, focus was mainly on urban and suburban water
supplies. It was under the 3rd Malaysia Plan, that rural water supply
received much needed boost. The state of Sarawak received an
allocation of RM4139876.00 to convey piped water to remote areas.
1980s
There was a high demand for water when the country embarked on a
programme of industrialisation. Water demand for industrial and
domestic use rose from 0.8 billion cubic metres in 1980 to 3.5 billion
cubic metres in 2000. This is a 437% increase. In comparison, water
for irrigation remained the same at 7.4 billion cubic metres each year
throughout the 20-year period.
1990
The success of the water supply plan under the 3rd Malaysian plan was
reflected in the number of households in Peninsular Malaysia receiving
treated water in both urban and rural areas. The figure rose sharply
from 23% of all household in 1950 to 85% in 1990.
1990s
Interstate water transfers including the transfer from Sungai Muar,
Johor to the Durian Tunggal dam, Melaka.
1999
There were a total of 69 dams in operation in Malaysia. 35 dams were
developed for water supply, 16 are multi-purpose while the remaining
are for irrigation and hydro-power generation. The large dams include
the Temenggor dam in Perak, the Kenyir dam in Terengganu and the
Pedu dam in Kedah, whose combined storage capacity exceeds 20000
million cubic metres.

15
2001-
2005
The 8th Malaysia Plan projected water demand to increase by 5.4% per
annum from 2001 to 2005. To ensure there is ample water supply to
meet the nation’s needs, the Federal Government has allocated RM4
billion for water supply projects under the 8th Malaysia Plan, which is
double the allocation under the 7th Malaysia Plan.
Existing asbestos pipes will be replaced to reduce water loss which is
currently averaged at about 38% of production.
2006-
2010
According to the 9th Malaysia Plan, under the Ministry of Energy,
Water and Communications, a total of RM8.1 billion will be spent on
water supply related projects and of which RM2.7 billion will be
focused on new water projects.
In 1994, the Malaysian Water Association has published a MWA Design
Guidelines for Water Supply Systems which is an adaptation of the Public Works
Department (JKR) Design Criteria and Standards for Water Supply System
(Malaysian Water Association, 1994). The MWA design guidelines serve as a
reference to water engineers and professionals in the design of water supply systems.
Figure 2.1 shows the Malaysian water authorities hierarchy.
Figure 2.1: Malaysian water authorities
Ministry of Power, Green Technology
and Water (KeTTHA)
Ministry of Finance (MOF)
National Water Services Commission
(SPAN)Regulator
Water Asset Management Company
(WAMCO)SPAN's Representatives
Water Supply Services Sewerage Services
All States
IWK
Facilities Licensee
Perlis Kedah P. Pinang Perak Selangor Pahang
JKR SADA PBA LAP SYABAS JBA
Terengganu
SATU
N. Sembilan
SAINS
Melaka Johor
SAMB SAJ
Kelantan
AK
Design Guidelines
Service Licensee

16
2.3 Water Supply in Johor
In Malaysia, the design guidelines and standards are outlined by individual state
water authority. The general design guidelines and standards are outlined by
Malaysian Water Association (MWA).
Since 2000, a private company Ranhill Utilities via its subsidiary SAJ
Holdings has been responsible for the entire water supply services providing drinking
water needs to the 3.1 million population of Johor, Malaysia. SAJ Holdings is an
integrated water supply company involved in the full cycle of a drinking water
supply system from sourcing of raw water, treatment and distribution of treated water
to consumers, right up to billing and collection (Ranhill Berhad, 2011).
2.4 Water Distribution System
A water supply distribution system may be classified into three typical types:
i. gravity system,
ii. pumped system, and
iii. combined gravity and pumped system.
Figure 2.2 shows the difference between the three types of water supply
distribution system. The choice of type of water supply distribution system depends
on the topography, location and extent of the distribution area, elevation and site
conditions.

17
Figure 2.2: Three types of water supply distribution systems

18
The gravity system is the most preferred type of water distribution where
adequate elevation of the supply is available. Only when the gravity type is not
feasible, the combined gravity and pumped system is used. The pumped system is the
least preferred as it involved higher operation cost. Table 2.3 summarizes the
advantages and disadvantages of the three types of water supply distribution systems.
Table 2.3: Advantages and disadvantages of types of water supply distribution
system (Malaysian Water Association, 1994)
Distribution system Advantages Disadvantages
Gravity a. Most reliable
b. Low operational costs
Combined pumped
and gravity
a. Least cost option under
certain topographical
conditions
a. Problems associated with
operation and
maintenance of pumping
systems
Direct pumped a. Pressure and flow can be
easily regulated
b. Remedial action can be
speedily taken
a. Problems associated with
operation and
maintenance of pumping
systems
2.5 Water Reticulation System
The scopes of work in water reticulation system are:
i. Determination of the location of elevated water tank and suction tank,
ii. Propose the type of pipe for water reticulation and fire hydrant, and
iii. Propose the connection to existing pipe.

19
There are various types of systems used in water distribution network, such
as dead end system, the ring system, basic system, grid system and radial system.
i. Dead-end system or tree system
In this system, one main pipeline runs through the center of the populated area
and sub mains take off from this to both the sides. It is suitable for towns that
have one several road and by lanes without regularity. The main is a larger
diameter at the beginning and it becomes smaller as it goes further from the
sources of water supply. The pipe, which connects house within main pipe in
the streets, is known as services pipe having 100 to 200 mm or even 300 mm
diameter. Here less numbers of valves are required, but if there is case of
repairs to any sections, the supply of the branch has to be cut off giving
inconvenience to the majority. The discharge available for fire fighting in the
streets will be limited.
ii. Grid-iron system or reticulation system
If the dead ends of the precious system are inter-connected, water can be made
to circulate continuously through the whole of the distribution system. This
system is therefore also known as the interlaced system. Here, the main supply
pipe runs through the center of the rectangular area and sub mains take off from
these in perpendicular directions. This system is ideal for cities laid out on
rectangular plan. There is free circulation of water, without any stagnation. In
case of repairs, only very small area of distribution system is affected, but here
large numbers of cut off required. The systems require longer pipes lengths and
bigger diameters. The cost of laying water pipe is more.
iii. Circular system or ring system
This system is most suitable for the town or area having well planned streets
and roads. In this system, the supply main forms a ring around the distribution
district. In case of fire, a large quantity of water is available.
iv. Radial system
This system is just the reverse of the circular system. In this system, whole area
is divided in to a number of distribution districts. Each district has a centrally
located distribution reservoir from where distribution pipes run radials towards

20
the periphery of the distribution district. This system gives quick service,
without much loss of head.
The following are the characteristics and considerations for the planning and
design of water supply distribution and reticulation systems summarized from Twort
et al. (2000) and the Malaysian Water Association (1994):
i. The service reservoir shall be as near and central as possible to the water
demand area (Figure 2.3a). Because the service reservoir evens out the peak
demands for water, the further the service reservoir is from the distribution
area, the longer must be the lengths of main designed for peak hourly flow rates
of flow and, the more costly is the system. A service reservoir close to the
distribution area provides advantages when maintaining supplies under
emergency conditions and for fire-fighting. It also helps to reduce pressure
fluctuations in the distribution system and aids economic development of the
system. Nevertheless there are occasions where the configuration of the land
makes it impossible to comply with this arrangement (Figure 2.3b).
Figure 2.3: Distribution system feeds: (a)-(b) single main feed, and (c) use of ring
main
ii. Where the service reservoir cannot be sited close to the demand area, a twin
pipeline layout shall be considered. More than one pipeline connected together

21
at their extremities to form a ring main (Figure 2.3c) through the distribution
area will be able to cope more effectively with peak rates of flow but, in
addition, should a repair be necessary on one main, at least some flow can be
maintained to the distribution system.
iii. The reticulation pipes shall be laid so as to form a network system. Consistent
water quality must be maintained through the system by establishing discrete
hydraulic and source water quality areas. Wherever possible, dead ends, long
retention times, mixing of different waters within the distribution system, and
diurnal reversals of flow in the main pipe should be avoided.
iv. Minimum pressures at peak demand times on 24-hour supply systems need to
be not less than 15 to 20 m in the main pipe at the highest supply point a system
can serve. Higher pressures may be necessary in some areas where there are a
significant number of dwellings exceeding three-storey height, but high rise
blocks will normally be required to have their own booster.
v. Static pressures under low night-time demand should be as low as practicable
to minimise leakage. For flat areas, a maximum static pressure in the range of
40 to 50 m is desirable. For undulating areas, a higher static pressure may be
unavoidable. Where extreme topographical conditions prevail in demand areas,
such as greater than 40 metres difference in elevation, pressure zoning of
service areas according to ground elevations may be necessary. This can be
achieved by using pressure reducing valves or break pressure tanks. Pressure
reducing valves can be adopted to reduce pressures in low lying areas, but they
must be regularly maintained if they are to operate reliably. To guard against
mishaps, the low level system must be strong enough to resist the maximum
possible static pressure if the valve fails or needs to be by-passed for
operational reasons.
vi. Pipelines shall preferably be laid adjacent to roads so as to provide easy access
for maintenance.
v. In the United Kingdom, the ideal fire demand requirements range from 8 L/s
from a single hydrant in a one- or two-storey housing development to up to 75

22
L/s from pipework infrastructure to an industrial estate. This value also applies
in Malaysia. Owners of property requiring supplies for sprinklers or hydrants
on their premises may need to enter special arrangements with water supplier.
In the United States, higher fire flows are required.
vi. Spare flow capacity must exist in the system sufficient to meet foreseeable rises
of demand over the next few years.
2.6 Water Demand
There are different demand of water based on the type and purpose of buildings. The
daily demand varies slightly due to the weather and festive seasons. In most states in
Malaysia, daily water demand increases slightly in the months of January and
February. During festive seasons, experience (Malaysian Water Association, 1994)
has shown that in some urban areas, there is a change in demand due to shutting
down of factories while there is an increase in demand in rural areas and smaller
urban centres due to people leaving the big urban centres for their home towns or
villages.
2.6.1 Industries
Estimation of demand should be made of individual industries especially of heavy
industries such as breweries, soft drink manufacturers, paper mills and textile mills.
The following is a guideline provided by the Malaysian Water Association (1994) for
estimating industrial demand:

23
Table 2.4: Industrial water demand guideline by the Malaysian Water Association
(1994)
Type of industries Water demand (litres/hectare/day)
Light 22000
Heavy 45000
2.6.2 Residential
Water demand in residential area is based on the number and type of housing units
set out in the housing structural plan submitted by the housing developer. For
planning purposes, the following water demand (Table 2.5) has been provided by the
State Water Authorities in Malaysia.
Table 2.5: Residential water demand by the Malaysian Water Association (1994)
Types of building Water demand
Low cost houses 910 litres/unit/day
Single storey terrace houses 1360 litres/unit/day
Semi-detached / double storey terrace houses 1590 litres/unit/day
Shophouses (2 storey) 2730 litres/unit/day
Shophouses (3 storey) 4090 litres/unit/day
Shophouses (4 storey) 4550 litres/unit/day
Bungalows / shophouses (single storey) 2270 litres/unit/day
Light industrial workshop 1590 litres/unit/day
Schools 45 litres/head/day

24
2.7 Types of Waterworks Pipe
Pipes, lining materials and joints used in water supply system works must not cause a
water quality hazard. Types of pipes commonly used in waterworks are generally of
the following materials:
i. asbestos cement (A.C.)
ii. cast iron (C.I.) or grey iron pipes
iii. copper Cu
iv. ductile iron (D.I.)
v. glass fibre reinforced plastic (GRP)
vi. polyethylene (MDPE / HDPE)
vii. prestressed concrete (PSC)
viii. steel
ix. unplasticized polyvinyl chloride (uPVC)
Table 2.6 outline the advantages and disadvantages of each type of pipes.
Table 2.6: Advantages and disadvantages of water supply pipe materials
Pipe material Advantages Disadvantages
Asbestos cement
(no longer
produced)
a. Strength and rigidity
b. Corrosion resistant to most
soils and water
c. Ease of jointing
d. Flexible joints tolerate
some deflection
a. Susceptible to impact
damage
b. Low beam strength for
diameter < 200 mm
c. Susceptible to certain
organic contaminants when
dry
d. Relatively high number of
joints per unit length
e. Retrospective installation
of fittings / repair
complicated
f. Need for precautions
against asbestos dust risk
during machining

95
REFERENCES
Can, I. (2005). Simplified equations calculate head losses in commercial pipes. The
Journal of American Science, 1 (1).
Chin, D.A. (2007). Water Resources Engineering. U.S.: Prentice Hall.
Constable, G. and Somerville, B. (2011). Water supply and distribution. A Century of
Innovation, National Academy of Engineering.
Eisenberg, D. and Kauzmann, W. (1969). The Structure and Properties of Water,
Oxford University Press, New York.
Featherstone, R.E. and Nalluri, C. (1985). Civil Engineering Hydraulics: Essential
Theory with Worked Examples. London: ELBS/Collins Professional and
Technical Books.
Franks, F. (ed.) (1972). Water - A Comprehensive Treatise, Vol. 1, Plenum Press,
New York.
Haktanir, T. and Ardiclioglu, M. (2004). Numerical modeling of Darcy-Weisbach
friction factor and branching pipes problem. Advances in Engineering Sofware,
Vol. 35, No. 12, pp.: 773-779.
Jabatan Bekalan Air (2009). Water Supply Industry in Peninsular Malaysia.
Malaysian Water Association (1994). MWA Design Guidelines for Water Supply
Systems. The Malaysian Water Association, Malaysia.
Marsalek, J., Watt, W. E., Lefrancois, L., Boots, B. F., and Woods, S. (2004).
Municipal Water Supply and Urban Development. Environment Canada,
National Water Research Institute, Burlington, Ontario.
Microsoft Corporation (2010). Visual Studio 6.0 Programmers Guide.

96
Mohd. Noor, F., Jaffar Sidek, F. and Goh, G.K. (2000). Mekanik Bendalir untuk
Kejuruteraan Awam. Malaysia: Universiti Teknologi Malaysia.
Petrousos, E. (1998). Mastering Visual Basic 6.0. San Francisco: Sybex Inc.
Ranhill Berhad (2011). Johor Water Supply Privatisation Scheme: Environment.
Ranhill Berhad.
Rodenhuis, D., Bennett, K., Werner, A., Murdock, T., and Bronaugh, D. (2007).
Hydroclimatology and Future Climate impacts in British Columbia. Pacific
Climate Impacts Consortium, University of Victoria.
Streeter, V.L., Wylie, E.B. and Bedford, K.W. (1998). Fluid Mechanics. Singapore:
McGraw-Hill.
Trifunovic, N. (2002). Small Community Water Supplies/IRC Technical Paper Series
40. Smet, J. and van Wijk, C. (eds.) Chapter 20: Water Transmission, 21 p.
International Water and Research Centre (IRC), 585 p., Delft, The
Netherlands.
Twort, A.C., Ratnayaka, D.D. and Brandt, M.J. (2000). Water Supply. 5th ed. Arnold
Publishers and IWA Publishing, London.
UNESCO (2006). Water: A shared responsibility. The United Nations World Water
Development Report 2. United Nations Educational, Scientific and Cultural
Organization (UNESCO) and Berghahn books, New York, USA.
Whitfield, P. H., and Taylor, E. (2002). Apparent recent changes in hydrology and
climate of coastal british columbia. In: Y. Alila (ed.), Mountains to Sea:
Human Interaction with the Hydrologic Cycle. 51st Annual Canadian Water
Resources Conference: 22-29.

97
Young, D., Munson, B.R., Okiishi, T.H. and Huebsch, W.W. (2007). A Brief
Introduction to Fluid Mechanics. John Wiley & Sons.