florida college system vocational programs aggregated ... · florida college system vocational...
TRANSCRIPT

FLORIDA COLLEGE SYSTEM VOCATIONAL PROGRAMS AGGREGATED OUTCOME DATA
2011-12 AS DEGREE - COMPLETERSFETPIP FOLLOW-UP OUTCOMES
CURRENT PLACEMENT RATE = Total number training related divided by total "pool" count.
TOTAL FREQ = Total number of individuals reported for follow-up to FETPIP.
# FOUND EMPLOYED = The number of individuals with wages during the 4th qtr of 2012.
% FOUND EMPLOYED = Number found employed divided by total frequency.
# EMPLOYED FULL QTR = Total number of individuals employed and earning at least $3,988 (min. wage ($7.67) x 40 hours per week x 13).
% EMPLOYED FULL QTR = Number found employed full quarter divided by total frequency.
# IDENTIFIED JOB TRNG REL = Total number of individuals found employed with jobs related to training.
% IDENTIFIED AS JOB REL = Number found employed with jobs related to their training divided by number found employed.
FULL QTR AVG EARNINGS = Average quarterly earnings for those employed full quarter.
# CONT ED = Total number of individuals found enrolled in a post secondary institution.
% CONT ED = Number found continuing education divided by total frequency.
# IN MIL = Number found in military service. (Percent not provided due to small incidence rate)
TOTAL "POOL" COUNT = Total number of individuals found employed, continuing education, or in the military.
TOTAL # TRAINING RELATED = Total number of individuals found with employment related to training (This total may include individuals who are continuing their education or are in the military.)
PASCO-HERNANDO COMMUNITY COLLEGE
1/6/2014 Path/Program - Q:\Eval1112\FCS\AnnualReports\ByCollege\APPR\FCS1112 BY SCHL (APPR).rpt

0652 PASCO-HERNANDO COMMUNITY COLLEGE
PROGRAM Total Freq.Found Employed Employed Full Qtr. Full Qtr.
Avg. EarningsCont. Ed.
# In MilIdentified Job Rel Current
Placement Rate %
Total"Pool" Count
Total # Training Related
13.00# %# %# %# %
1317010200 Dental Hygiene
10 7 70% 7 4 0 8 870% $**,*** 100%40%7 100%1317020601 Emergency Medical Services
12 12 100% 10 3 0 9 783% $13,525 78%25%7 58%1317020900 Radiography
14 9 64% 8 2 0 9 757% $**,*** 78%14%6 67%1317040600 Human Services - Addiction Studies-Generalist
29 19 66% 5 20 0 25 2317% $**,*** 92%69%5 26%1318110100 Nursing RN
147 132 90% 120 39 0 132 12782% $13,031 96%27%117 89%1506040102 Business Administration
16 12 75% 3 10 0 14 1319% $**,*** 93%63%9 75%1506120106 IT Security
12 8 67% 6 3 0 6 450% $**,*** 67%25%3 38%1507030401 Networking Services Technology
11 7 64% 5 4 0 6 445% $**,*** 67%36%1 14%1507030500 Computer Programming and Analysis
**** 5 71% 3 2 0 5 443% $**,*** 80%29%2 40%1507039902 Internet Services Technology
**** 3 75% 2 2 0 3 350% $**,*** 100%50%1 33%1507060300 Office Administration
10 8 80% 5 4 0 9 750% $**,*** 78%40%6 75%1615020200 Drafting and Design Technology
**** 3 60% 1 2 0 4 220% $**,*** 50%40%0 0%1722010300 Paralegal (Legal Assisting)
29 18 62% 14 11 0 21 2048% $7,070 95%38%11 61%
Page 2

0652 PASCO-HERNANDO COMMUNITY COLLEGE
Total Freq.Found Employed Employed Full Qtr. Full Qtr.
Avg. EarningsCont. Ed.
# In MilIdentified Job Rel Current
Placement Rate %
Total"Pool" Count
Total # Training Related
13.00# %# % # % # %
Totals: 306 243 79% 189 62% 72%$11,477 106 35% 0 251 229 91%175
Page 3

FLORIDA COLLEGE SYSTEM VOCATIONAL PROGRAMS AGGREGATED OUTCOME DATA
2011-12 AS DEGREE - COMPLETERSFETPIP FOLLOW-UP OUTCOMES
CURRENT PLACEMENT RATE = Total number training related divided by total "pool" count.
TOTAL FREQ = Total number of individuals reported for follow-up to FETPIP.
# FOUND EMPLOYED = The number of individuals with wages during the 4th qtr of 2012.
% FOUND EMPLOYED = Number found employed divided by total frequency.
# EMPLOYED FULL QTR = Total number of individuals employed and earning at least $3,988 (min. wage ($7.67) x 40 hours per week x 13).
% EMPLOYED FULL QTR = Number found employed full quarter divided by total frequency.
# IDENTIFIED JOB TRNG REL = Total number of individuals found employed with jobs related to training.
% IDENTIFIED AS JOB REL = Number found employed with jobs related to their training divided by number found employed.
FULL QTR AVG EARNINGS = Average quarterly earnings for those employed full quarter.
# CONT ED = Total number of individuals found enrolled in a post secondary institution.
% CONT ED = Number found continuing education divided by total frequency.
# IN MIL = Number found in military service. (Percent not provided due to small incidence rate)
TOTAL "POOL" COUNT = Total number of individuals found employed, continuing education, or in the military.
TOTAL # TRAINING RELATED = Total number of individuals found with employment related to training (This total may include individuals who are continuing their education or are in the military.)
EASTERN FLORIDA STATE COLLEGE
1/6/2014 Path/Program - Q:\Eval1112\FCS\AnnualReports\ByCollege\APPR\FCS1112 BY SCHL (APPR).rpt

1470 EASTERN FLORIDA STATE COLLEGE
PROGRAM Total Freq.Found Employed Employed Full Qtr. Full Qtr.
Avg. EarningsCont. Ed.
# In MilIdentified Job Rel Current
Placement Rate %
Total"Pool" Count
Total # Training Related
23.00# %# %# %# %
1317010104 Dental Assisting Technology and Management
**** 2 100% 2 0 0 2 1100% $**,*** 50%0%1 50%1317010200 Dental Hygiene
11 9 82% 7 2 0 8 864% $**,*** 100%18%7 78%1317020601 Emergency Medical Services
11 11 100% 10 3 0 8 691% $12,824 75%27%3 27%1317020900 Radiography
21 15 71% 10 2 0 11 948% $9,112 82%10%7 47%1317030900 Medical Laboratory Technology
17 14 82% 13 3 0 14 1476% $10,377 100%18%13 93%1317051200 Veterinary Technology
**** 6 100% 6 1 0 6 5100% $**,*** 83%17%5 83%1318110100 Nursing RN
119 107 90% 101 22 0 106 10485% $12,004 98%18%103 96%1404050100 Interior Design Technology
**** 3 43% 1 1 0 3 214% $**,*** 67%14%1 33%1420020203 Early Childhood Education Associate Degree
23 13 57% 7 10 0 18 1430% $**,*** 78%43%9 69%1507030401 Networking Services Technology
24 14 58% 10 11 0 19 1542% $11,745 79%46%4 29%1507030500 Computer Programming and Analysis
16 7 44% 4 2 0 7 525% $**,*** 71%13%4 57%1507030600 Computer Information Technology
25 15 60% 12 9 0 15 1248% $10,841 80%36%6 40%1507039902 Internet Services Technology
**** 1 100% 0 0 0 0 00% $**,*** ***%0%0 0%
Page 2

1470 EASTERN FLORIDA STATE COLLEGE
PROGRAM Total Freq.Found Employed Employed Full Qtr. Full Qtr.
Avg. EarningsCont. Ed.
# In MilIdentified Job Rel Current
Placement Rate %
Total"Pool" Count
Total # Training Related
23.00# %# %# %# %
1507060300 Office Administration
18 10 56% 4 6 0 11 922% $**,*** 82%33%6 60%1610010212 Digital Television and Media Production
11 8 73% 2 6 0 8 718% $**,*** 88%55%2 25%1615000001 Engineering Technology
**** 2 67% 1 1 0 2 233% $**,*** 100%33%2 100%1615020200 Drafting and Design Technology
13 10 77% 6 4 0 12 546% $**,*** 42%31%1 10%1615080100 Aerospace Technology
**** 3 38% 2 3 0 5 425% $**,*** 80%38%1 33%1641030100 Chemical Technology
37 19 51% 7 30 0 34 3219% $**,*** 94%81%5 26%1650040200 Graphics Technology
12 8 67% 4 2 0 8 433% $**,*** 50%17%2 25%1722010300 Paralegal (Legal Assisting)
37 25 68% 18 14 0 25 1849% $7,011 72%38%7 28%1743010600 Crime Scene Technology
14 8 57% 4 5 0 8 529% $**,*** 63%36%0 0%1743020100 Fire Science Technology (feshe Model)
**** 7 100% 7 5 0 7 7100% $**,*** 100%71%7 100%
Total Freq.Found Employed Employed Full Qtr. Full Qtr.
Avg. EarningsCont. Ed.
# In MilIdentified Job Rel Current
Placement Rate %
Total"Pool" Count
Total # Training Related
23.00# %# % # % # %
Totals: 443 317 72% 238 54% 62%$10,642 142 32% 0 337 288 85%196
Page 3

FLORIDA COLLEGE SYSTEM VOCATIONAL PROGRAMS AGGREGATED OUTCOME DATA
2011-12 AS DEGREE - COMPLETERSFETPIP FOLLOW-UP OUTCOMES
CURRENT PLACEMENT RATE = Total number training related divided by total "pool" count.
TOTAL FREQ = Total number of individuals reported for follow-up to FETPIP.
# FOUND EMPLOYED = The number of individuals with wages during the 4th qtr of 2012.
% FOUND EMPLOYED = Number found employed divided by total frequency.
# EMPLOYED FULL QTR = Total number of individuals employed and earning at least $3,988 (min. wage ($7.67) x 40 hours per week x 13).
% EMPLOYED FULL QTR = Number found employed full quarter divided by total frequency.
# IDENTIFIED JOB TRNG REL = Total number of individuals found employed with jobs related to training.
% IDENTIFIED AS JOB REL = Number found employed with jobs related to their training divided by number found employed.
FULL QTR AVG EARNINGS = Average quarterly earnings for those employed full quarter.
# CONT ED = Total number of individuals found enrolled in a post secondary institution.
% CONT ED = Number found continuing education divided by total frequency.
# IN MIL = Number found in military service. (Percent not provided due to small incidence rate)
TOTAL "POOL" COUNT = Total number of individuals found employed, continuing education, or in the military.
TOTAL # TRAINING RELATED = Total number of individuals found with employment related to training (This total may include individuals who are continuing their education or are in the military.)
COLLEGE OF CENTRAL FLORIDA
1/6/2014 Path/Program - Q:\Eval1112\FCS\AnnualReports\ByCollege\APPR\FCS1112 BY SCHL (APPR).rpt

1471 COLLEGE OF CENTRAL FLORIDA
PROGRAM Total Freq.Found Employed Employed Full Qtr. Full Qtr.
Avg. EarningsCont. Ed.
# In MilIdentified Job Rel Current
Placement Rate %
Total"Pool" Count
Total # Training Related
19.00# %# %# %# %
1101010100 Agribusiness Management
**** 1 100% 1 0 0 1 0100% $**,*** 0%0%0 0%1101050700 Equine Studies
21 11 52% 8 11 0 16 1138% $**,*** 69%52%2 18%1317010104 Dental Assisting Technology and Management
**** 3 100% 3 2 0 3 3100% $**,*** 100%67%2 67%1317020601 Emergency Medical Services
29 24 83% 22 12 0 23 1776% $12,131 74%41%6 25%1317020900 Radiography
11 9 82% 7 5 0 11 1164% $**,*** 100%45%8 89%1317040600 Human Services - Addiction Studies-Generalist
**** 1 100% 1 1 0 1 1100% $**,*** 100%100%0 0%1317050600 Health Information Management
25 16 64% 13 6 0 15 1252% $6,847 80%24%6 38%1317081500 Physical Therapist Assistant
17 15 88% 15 2 0 12 1188% $11,873 92%12%9 60%1318110100 Nursing RN
84 40 48% 37 12 0 46 4544% $11,674 98%14%37 93%1420020203 Early Childhood Education Associate Degree
**** 3 75% 1 1 0 3 225% $**,*** 67%25%1 33%1506040102 Business Administration
21 13 62% 12 13 0 19 1857% $8,758 95%62%9 69%1507010100 Accounting Technology
**** 3 43% 0 2 0 5 40% $**,*** 80%29%2 67%1507030600 Computer Information Technology
27 19 70% 11 14 0 24 1541% $6,946 63%52%7 37%
Page 2

1471 COLLEGE OF CENTRAL FLORIDA
PROGRAM Total Freq.Found Employed Employed Full Qtr. Full Qtr.
Avg. EarningsCont. Ed.
# In MilIdentified Job Rel Current
Placement Rate %
Total"Pool" Count
Total # Training Related
19.00# %# %# %# %
1507060300 Office Administration
18 12 67% 7 12 0 15 1539% $**,*** 100%67%10 83%1615000001 Engineering Technology
**** 2 100% 2 1 0 2 2100% $**,*** 100%50%1 50%1615020200 Drafting and Design Technology
**** 5 56% 3 2 0 5 333% $**,*** 60%22%2 40%1722010300 Paralegal (Legal Assisting)
**** 4 67% 2 3 0 6 533% $**,*** 83%50%3 75%1743010300 Criminal Justice Technology
**** 9 100% 5 6 0 9 856% $**,*** 89%67%5 56%1743020100 Fire Science Technology (feshe Model)
**** 5 100% 5 1 0 5 5100% $**,*** 100%20%5 100%
Total Freq.Found Employed Employed Full Qtr. Full Qtr.
Avg. EarningsCont. Ed.
# In MilIdentified Job Rel Current
Placement Rate %
Total"Pool" Count
Total # Training Related
19.00# %# % # % # %
Totals: 300 195 65% 155 52% 59%$10,111 106 35% 0 221 188 85%115
Page 3

FLORIDA COLLEGE SYSTEM VOCATIONAL PROGRAMS AGGREGATED OUTCOME DATA
2011-12 AS DEGREE - COMPLETERSFETPIP FOLLOW-UP OUTCOMES
CURRENT PLACEMENT RATE = Total number training related divided by total "pool" count.
TOTAL FREQ = Total number of individuals reported for follow-up to FETPIP.
# FOUND EMPLOYED = The number of individuals with wages during the 4th qtr of 2012.
% FOUND EMPLOYED = Number found employed divided by total frequency.
# EMPLOYED FULL QTR = Total number of individuals employed and earning at least $3,988 (min. wage ($7.67) x 40 hours per week x 13).
% EMPLOYED FULL QTR = Number found employed full quarter divided by total frequency.
# IDENTIFIED JOB TRNG REL = Total number of individuals found employed with jobs related to training.
% IDENTIFIED AS JOB REL = Number found employed with jobs related to their training divided by number found employed.
FULL QTR AVG EARNINGS = Average quarterly earnings for those employed full quarter.
# CONT ED = Total number of individuals found enrolled in a post secondary institution.
% CONT ED = Number found continuing education divided by total frequency.
# IN MIL = Number found in military service. (Percent not provided due to small incidence rate)
TOTAL "POOL" COUNT = Total number of individuals found employed, continuing education, or in the military.
TOTAL # TRAINING RELATED = Total number of individuals found with employment related to training (This total may include individuals who are continuing their education or are in the military.)
CHIPOLA COLLEGE
1/6/2014 Path/Program - Q:\Eval1112\FCS\AnnualReports\ByCollege\APPR\FCS1112 BY SCHL (APPR).rpt

1472 CHIPOLA COLLEGE
PROGRAM Total Freq.Found Employed Employed Full Qtr. Full Qtr.
Avg. EarningsCont. Ed.
# In MilIdentified Job Rel Current
Placement Rate %
Total"Pool" Count
Total # Training Related
10.00# %# %# %# %
1318110100 Nursing RN
58 46 79% 46 12 0 47 4479% $10,931 94%21%42 91%1420020203 Early Childhood Education Associate Degree
**** 2 67% 0 0 0 2 20% $**,*** 100%0%2 100%1506040102 Business Administration
**** 1 100% 1 0 0 1 0100% $**,*** 0%0%0 0%1507030401 Networking Services Technology
**** 0 0% 0 0 0 0 00% $**,*** ***%0%0 ***%1507030600 Computer Information Technology
**** 0 0% 0 0 0 0 00% $**,*** ***%0%0 ***%1615030301 Electronics Engineering Technology
**** 1 100% 1 0 0 1 0100% $**,*** 0%0%0 0%1620040100 Culinary Management
**** 2 67% 0 0 0 2 10% $**,*** 50%0%1 50%1736019901 Recreation Technology
**** 0 0% 0 0 0 0 00% $**,*** ***%0%0 ***%1743010300 Criminal Justice Technology
**** 1 100% 1 1 0 1 1100% $**,*** 100%100%1 100%1743020100 Fire Science Technology (feshe Model)
**** 2 100% 2 1 0 2 2100% $**,*** 100%50%2 100%
Total Freq.Found Employed Employed Full Qtr. Full Qtr.
Avg. EarningsCont. Ed.
# In MilIdentified Job Rel Current
Placement Rate %
Total"Pool" Count
Total # Training Related
10.00# %# % # % # %
Totals: 81 55 68% 51 63% 87%$11,085 14 17% 0 56 50 89%48
Page 2

FLORIDA COLLEGE SYSTEM VOCATIONAL PROGRAMS AGGREGATED OUTCOME DATA
2011-12 AS DEGREE - COMPLETERSFETPIP FOLLOW-UP OUTCOMES
CURRENT PLACEMENT RATE = Total number training related divided by total "pool" count.
TOTAL FREQ = Total number of individuals reported for follow-up to FETPIP.
# FOUND EMPLOYED = The number of individuals with wages during the 4th qtr of 2012.
% FOUND EMPLOYED = Number found employed divided by total frequency.
# EMPLOYED FULL QTR = Total number of individuals employed and earning at least $3,988 (min. wage ($7.67) x 40 hours per week x 13).
% EMPLOYED FULL QTR = Number found employed full quarter divided by total frequency.
# IDENTIFIED JOB TRNG REL = Total number of individuals found employed with jobs related to training.
% IDENTIFIED AS JOB REL = Number found employed with jobs related to their training divided by number found employed.
FULL QTR AVG EARNINGS = Average quarterly earnings for those employed full quarter.
# CONT ED = Total number of individuals found enrolled in a post secondary institution.
% CONT ED = Number found continuing education divided by total frequency.
# IN MIL = Number found in military service. (Percent not provided due to small incidence rate)
TOTAL "POOL" COUNT = Total number of individuals found employed, continuing education, or in the military.
TOTAL # TRAINING RELATED = Total number of individuals found with employment related to training (This total may include individuals who are continuing their education or are in the military.)
DAYTONA STATE COLLEGE
1/6/2014 Path/Program - Q:\Eval1112\FCS\AnnualReports\ByCollege\APPR\FCS1112 BY SCHL (APPR).rpt

1475 DAYTONA STATE COLLEGE
PROGRAM Total Freq.Found Employed Employed Full Qtr. Full Qtr.
Avg. EarningsCont. Ed.
# In MilIdentified Job Rel Current
Placement Rate %
Total"Pool" Count
Total # Training Related
28.00# %# %# %# %
1206079900 Hospitality & Tourism Management
**** 5 83% 3 6 0 6 650% $**,*** 100%100%2 40%1317010200 Dental Hygiene
10 10 100% 10 2 0 10 9100% $10,877 90%20%9 90%1317020601 Emergency Medical Services
**** 8 100% 7 3 0 5 588% $**,*** 100%38%3 38%1317020900 Radiography
10 9 90% 8 1 0 7 780% $**,*** 100%10%7 78%1317040600 Human Services - Addiction Studies-Generalist
10 5 50% 2 5 0 8 820% $**,*** 100%50%3 60%1317080800 Occupational Therapy Assistant
**** 4 100% 3 1 0 3 275% $**,*** 67%25%2 50%1317081500 Physical Therapist Assistant
10 8 80% 6 1 0 6 660% $**,*** 100%10%6 75%1317081800 Respiratory Care
**** 1 33% 1 1 0 2 233% $**,*** 100%33%1 100%1318110100 Nursing RN
211 191 91% 181 71 0 188 18386% $11,901 97%34%172 90%1404050100 Interior Design Technology
**** 1 33% 1 1 0 2 233% $**,*** 100%33%1 100%1420020203 Early Childhood Education Associate Degree
17 13 76% 4 6 0 14 1024% $**,*** 71%35%6 46%1506040102 Business Administration
11 5 45% 5 6 0 8 745% $**,*** 88%55%4 80%1507010100 Accounting Technology
32 20 63% 17 16 0 23 1953% $6,637 83%50%10 50%
Page 2

1475 DAYTONA STATE COLLEGE
PROGRAM Total Freq.Found Employed Employed Full Qtr. Full Qtr.
Avg. EarningsCont. Ed.
# In MilIdentified Job Rel Current
Placement Rate %
Total"Pool" Count
Total # Training Related
28.00# %# %# %# %
1507030401 Networking Services Technology
33 24 73% 16 17 0 25 1948% $9,277 76%52%8 33%1507030500 Computer Programming and Analysis
**** 3 33% 3 5 0 8 733% $**,*** 88%56%2 67%1507030600 Computer Information Technology
**** 3 43% 3 4 0 5 543% $**,*** 100%57%2 67%1507039902 Internet Services Technology
**** 1 50% 0 0 0 1 10% $**,*** 100%0%1 100%1610010202 Digital Media/Multimedia Technology
**** 0 0% 0 1 0 1 10% $**,*** 100%33%0 ***%1610010300 Photographic Technology
59 34 58% 12 33 0 47 3720% $7,902 79%56%8 24%1615020200 Drafting and Design Technology
**** 1 100% 1 0 0 1 0100% $**,*** 0%0%0 0%1615030301 Electronics Engineering Technology
**** 8 100% 5 3 0 8 563% $**,*** 63%38%3 38%1615040200 Computer Engineering Technology
16 12 75% 8 8 0 15 950% $**,*** 60%50%3 25%1615080101 Simulation Technology
**** 6 86% 5 4 0 7 571% $**,*** 71%57%2 33%1620040100 Culinary Management
**** 6 100% 2 3 0 6 433% $**,*** 67%50%2 33%1650099900 Music Production Technology
22 16 73% 6 9 0 18 1227% $**,*** 67%41%4 25%1722010300 Paralegal (Legal Assisting)
10 6 60% 4 8 0 9 940% $**,*** 100%80%3 50%
Page 3

1475 DAYTONA STATE COLLEGE
PROGRAM Total Freq.Found Employed Employed Full Qtr. Full Qtr.
Avg. EarningsCont. Ed.
# In MilIdentified Job Rel Current
Placement Rate %
Total"Pool" Count
Total # Training Related
28.00# %# %# %# %
1743010300 Criminal Justice Technology
26 17 65% 17 19 0 24 2365% $12,567 96%73%13 76%1743020100 Fire Science Technology (feshe Model)
**** 2 100% 2 1 0 2 2100% $**,*** 100%50%2 100%
Total Freq.Found Employed Employed Full Qtr. Full Qtr.
Avg. EarningsCont. Ed.
# In MilIdentified Job Rel Current
Placement Rate %
Total"Pool" Count
Total # Training Related
28.00# %# % # % # %
Totals: 546 419 77% 332 61% 67%$10,572 235 43% 0 459 405 88%279
Page 4

FLORIDA COLLEGE SYSTEM VOCATIONAL PROGRAMS AGGREGATED OUTCOME DATA
2011-12 AS DEGREE - COMPLETERSFETPIP FOLLOW-UP OUTCOMES
CURRENT PLACEMENT RATE = Total number training related divided by total "pool" count.
TOTAL FREQ = Total number of individuals reported for follow-up to FETPIP.
# FOUND EMPLOYED = The number of individuals with wages during the 4th qtr of 2012.
% FOUND EMPLOYED = Number found employed divided by total frequency.
# EMPLOYED FULL QTR = Total number of individuals employed and earning at least $3,988 (min. wage ($7.67) x 40 hours per week x 13).
% EMPLOYED FULL QTR = Number found employed full quarter divided by total frequency.
# IDENTIFIED JOB TRNG REL = Total number of individuals found employed with jobs related to training.
% IDENTIFIED AS JOB REL = Number found employed with jobs related to their training divided by number found employed.
FULL QTR AVG EARNINGS = Average quarterly earnings for those employed full quarter.
# CONT ED = Total number of individuals found enrolled in a post secondary institution.
% CONT ED = Number found continuing education divided by total frequency.
# IN MIL = Number found in military service. (Percent not provided due to small incidence rate)
TOTAL "POOL" COUNT = Total number of individuals found employed, continuing education, or in the military.
TOTAL # TRAINING RELATED = Total number of individuals found with employment related to training (This total may include individuals who are continuing their education or are in the military.)
EDISON STATE COLLEGE
1/6/2014 Path/Program - Q:\Eval1112\FCS\AnnualReports\ByCollege\APPR\FCS1112 BY SCHL (APPR).rpt

1477 EDISON STATE COLLEGE
PROGRAM Total Freq.Found Employed Employed Full Qtr. Full Qtr.
Avg. EarningsCont. Ed.
# In MilIdentified Job Rel Current
Placement Rate %
Total"Pool" Count
Total # Training Related
19.00# %# %# %# %
1101060701 Golf Course Operations
**** 3 100% 3 0 0 2 2100% $**,*** 100%0%2 67%1317010200 Dental Hygiene
16 15 94% 13 3 0 13 1381% $10,183 100%19%13 87%1317020100 Cardiovascular/Cardiopulmonary Technology
13 12 92% 11 4 0 12 1285% $11,909 100%31%11 92%1317020601 Emergency Medical Services
29 26 90% 23 12 0 22 1879% $14,178 82%41%12 46%1317020900 Radiography
20 19 95% 19 2 0 19 1995% $11,640 100%10%19 100%1317050600 Health Information Management
14 10 71% 9 4 0 11 864% $**,*** 73%29%5 50%1317081800 Respiratory Care
30 30 100% 26 6 0 30 2887% $12,317 93%20%28 93%1318110100 Nursing RN
261 233 89% 220 75 0 226 21884% $12,666 96%29%208 89%1420020203 Early Childhood Education Associate Degree
10 9 90% 9 3 0 10 1090% $**,*** 100%30%9 100%1506040102 Business Administration
41 29 71% 23 17 0 32 2956% $9,428 91%41%17 59%1507010100 Accounting Technology
22 17 77% 12 9 0 17 1355% $7,065 76%41%9 53%1507030401 Networking Services Technology
32 26 81% 22 14 0 28 1669% $8,321 57%44%3 12%1507030500 Computer Programming and Analysis
**** 5 71% 5 4 1 7 571% $**,*** 71%57%0 0%
Page 2

1477 EDISON STATE COLLEGE
PROGRAM Total Freq.Found Employed Employed Full Qtr. Full Qtr.
Avg. EarningsCont. Ed.
# In MilIdentified Job Rel Current
Placement Rate %
Total"Pool" Count
Total # Training Related
19.00# %# %# %# %
1507039902 Internet Services Technology
**** 3 50% 2 2 0 3 233% $**,*** 67%33%1 33%1615020200 Drafting and Design Technology
16 9 56% 9 8 0 11 956% $**,*** 82%50%2 22%1722010300 Paralegal (Legal Assisting)
38 23 61% 14 20 0 32 2737% $8,052 84%53%11 48%1743010300 Criminal Justice Technology
65 48 74% 43 41 0 56 5166% $12,284 91%63%27 56%1743010600 Crime Scene Technology
15 12 80% 3 5 0 12 720% $**,*** 58%33%3 25%1743020100 Fire Science Technology (feshe Model)
13 12 92% 11 4 0 13 1285% $19,885 92%31%10 83%
Total Freq.Found Employed Employed Full Qtr. Full Qtr.
Avg. EarningsCont. Ed.
# In MilIdentified Job Rel Current
Placement Rate %
Total"Pool" Count
Total # Training Related
19.00# %# % # % # %
Totals: 651 541 83% 477 73% 72%$11,655 233 36% 1 556 499 90%390
Page 3

FLORIDA COLLEGE SYSTEM VOCATIONAL PROGRAMS AGGREGATED OUTCOME DATA
2011-12 AS DEGREE - COMPLETERSFETPIP FOLLOW-UP OUTCOMES
CURRENT PLACEMENT RATE = Total number training related divided by total "pool" count.
TOTAL FREQ = Total number of individuals reported for follow-up to FETPIP.
# FOUND EMPLOYED = The number of individuals with wages during the 4th qtr of 2012.
% FOUND EMPLOYED = Number found employed divided by total frequency.
# EMPLOYED FULL QTR = Total number of individuals employed and earning at least $3,988 (min. wage ($7.67) x 40 hours per week x 13).
% EMPLOYED FULL QTR = Number found employed full quarter divided by total frequency.
# IDENTIFIED JOB TRNG REL = Total number of individuals found employed with jobs related to training.
% IDENTIFIED AS JOB REL = Number found employed with jobs related to their training divided by number found employed.
FULL QTR AVG EARNINGS = Average quarterly earnings for those employed full quarter.
# CONT ED = Total number of individuals found enrolled in a post secondary institution.
% CONT ED = Number found continuing education divided by total frequency.
# IN MIL = Number found in military service. (Percent not provided due to small incidence rate)
TOTAL "POOL" COUNT = Total number of individuals found employed, continuing education, or in the military.
TOTAL # TRAINING RELATED = Total number of individuals found with employment related to training (This total may include individuals who are continuing their education or are in the military.)
FLORIDA STATE COLLEGE AT JACKSONVILLE
1/6/2014 Path/Program - Q:\Eval1112\FCS\AnnualReports\ByCollege\APPR\FCS1112 BY SCHL (APPR).rpt

1484 FLORIDA STATE COLLEGE AT JACKSONVILLE
PROGRAM Total Freq.Found Employed Employed Full Qtr. Full Qtr.
Avg. EarningsCont. Ed.
# In MilIdentified Job Rel Current
Placement Rate %
Total"Pool" Count
Total # Training Related
46.00# %# %# %# %
1206030100 Financial Services
**** 0 0% 0 0 0 0 00% $**,*** ***%0%0 ***%1206070400 Restaurant Management
**** 2 40% 2 1 0 3 240% $**,*** 67%20%1 50%1206079900 Hospitality & Tourism Management
**** 4 67% 2 3 0 5 433% $**,*** 80%50%3 75%1312030100 Funeral Services
**** 6 100% 4 0 0 4 367% $**,*** 75%0%3 50%1317010200 Dental Hygiene
20 16 80% 12 0 0 12 1260% $10,309 100%0%12 75%1317020601 Emergency Medical Services
**** 8 89% 7 5 0 9 778% $**,*** 78%56%6 75%1317020900 Radiography
36 26 72% 22 6 2 28 2461% $9,673 86%17%20 77%1317020901 Radiation Therapy
**** 3 33% 2 1 0 3 322% $**,*** 100%11%2 67%1317030800 Histologic Technology
21 16 76% 15 2 0 16 1471% $12,624 88%10%13 81%1317030900 Medical Laboratory Technology
20 15 75% 14 2 0 15 1370% $11,670 87%10%13 87%1317050600 Health Information Management
13 11 85% 10 3 0 11 777% $8,538 64%23%5 45%1317070101 Ophthalmic Technician
**** 4 67% 3 1 0 4 450% $**,*** 100%17%3 75%1317080800 Occupational Therapy Assistant
18 13 72% 10 0 0 13 1256% $10,871 92%0%12 92%
Page 2

1484 FLORIDA STATE COLLEGE AT JACKSONVILLE
PROGRAM Total Freq.Found Employed Employed Full Qtr. Full Qtr.
Avg. EarningsCont. Ed.
# In MilIdentified Job Rel Current
Placement Rate %
Total"Pool" Count
Total # Training Related
46.00# %# %# %# %
1317081500 Physical Therapist Assistant
27 24 89% 23 3 0 23 2285% $11,684 96%11%22 92%1317081800 Respiratory Care
27 22 81% 21 2 0 21 1378% $10,437 62%7%13 59%1318110100 Nursing RN
354 295 83% 282 82 0 297 26080% $12,205 88%23%236 80%1326061600 Biotechnology Laboratory Technology
**** 1 50% 0 1 0 1 10% $**,*** 100%50%0 0%1404050100 Interior Design Technology
12 9 75% 6 3 0 8 350% $**,*** 38%25%1 11%1420020300 Early Childhood Management
36 24 67% 19 21 0 29 2853% $7,417 97%58%16 67%1420040401 Dietetic Technician
**** 3 60% 2 1 1 5 540% $**,*** 100%20%3 100%1506040102 Business Administration
44 26 59% 19 31 1 38 3643% $10,845 95%70%18 69%1506120106 IT Security
**** 4 50% 4 3 0 6 650% $**,*** 100%38%4 100%1507010100 Accounting Technology
11 8 73% 8 5 0 8 873% $**,*** 100%45%7 88%1507030401 Networking Services Technology
62 39 63% 32 34 1 54 4152% $13,038 76%55%14 36%1507030500 Computer Programming and Analysis
**** 5 100% 4 3 0 5 480% $**,*** 80%60%2 40%1507030600 Computer Information Technology
45 29 64% 29 31 0 39 3564% $11,216 90%69%11 38%
Page 3

1484 FLORIDA STATE COLLEGE AT JACKSONVILLE
PROGRAM Total Freq.Found Employed Employed Full Qtr. Full Qtr.
Avg. EarningsCont. Ed.
# In MilIdentified Job Rel Current
Placement Rate %
Total"Pool" Count
Total # Training Related
46.00# %# %# %# %
1507030601 Database Technology
**** 2 100% 1 0 0 2 250% $**,*** 100%0%2 100%1507060300 Office Administration
14 6 43% 6 4 1 10 1043% $**,*** 100%29%6 100%1606200101 Industrial Management Technology
27 11 41% 11 7 10 23 2041% $10,998 87%26%6 55%1610010202 Digital Media/Multimedia Technology
23 13 57% 10 9 0 18 1343% $7,639 72%39%6 46%1615000001 Engineering Technology
11 3 27% 3 2 0 5 327% $**,*** 60%18%1 33%1615010100 Architectural Design & Construction Technology
**** 3 60% 2 1 0 3 140% $**,*** 33%20%0 0%1615040101 Biomedical Engineering Technology
12 9 75% 8 3 1 10 567% $**,*** 50%25%2 22%1615080300 Automotive Service Management Technology
**** 2 67% 2 0 0 2 167% $**,*** 50%0%1 50%1615100101 Building Construction Technology
**** 3 38% 3 3 0 5 438% $**,*** 80%38%2 67%1620040100 Culinary Management
25 19 76% 11 4 0 21 1744% $6,765 81%16%14 74%1649010200 Professional Pilot Technology
**** 3 75% 3 1 0 4 475% $**,*** 100%25%3 100%1649010400 Aviation Operations
76 47 62% 31 22 1 51 2941% $7,035 57%29%11 23%1649010401 Aviation Maintenance Management
**** 3 33% 3 1 0 3 233% $**,*** 67%11%2 67%
Page 4

1484 FLORIDA STATE COLLEGE AT JACKSONVILLE
PROGRAM Total Freq.Found Employed Employed Full Qtr. Full Qtr.
Avg. EarningsCont. Ed.
# In MilIdentified Job Rel Current
Placement Rate %
Total"Pool" Count
Total # Training Related
46.00# %# %# %# %
1650999901 Theater and Entertainment Technology
**** 2 67% 1 0 0 2 233% $**,*** 100%0%2 100%1652020900 Supply Chain Management
**** 4 67% 4 1 0 4 467% $**,*** 100%17%3 75%1713100301 Sign Language Interpretation
**** 6 86% 2 3 0 6 329% $**,*** 50%43%1 17%1715059901 Environmental Science Technology
**** 4 80% 3 3 0 4 360% $**,*** 75%60%0 0%1722010300 Paralegal (Legal Assisting)
41 33 80% 24 12 0 33 2459% $8,701 73%29%17 52%1743010300 Criminal Justice Technology
30 21 70% 18 18 1 26 2560% $9,085 96%60%13 62%1743020100 Fire Science Technology (feshe Model)
17 11 65% 9 9 1 14 1053% $**,*** 71%53%2 18%
Total Freq.Found Employed Employed Full Qtr. Full Qtr.
Avg. EarningsCont. Ed.
# In MilIdentified Job Rel Current
Placement Rate %
Total"Pool" Count
Total # Training Related
46.00# %# % # % # %
Totals: 1,136 818 72% 707 62% 65%$10,832 347 31% 20 903 749 83%534
Page 5

FLORIDA COLLEGE SYSTEM VOCATIONAL PROGRAMS AGGREGATED OUTCOME DATA
2011-12 AS DEGREE - COMPLETERSFETPIP FOLLOW-UP OUTCOMES
CURRENT PLACEMENT RATE = Total number training related divided by total "pool" count.
TOTAL FREQ = Total number of individuals reported for follow-up to FETPIP.
# FOUND EMPLOYED = The number of individuals with wages during the 4th qtr of 2012.
% FOUND EMPLOYED = Number found employed divided by total frequency.
# EMPLOYED FULL QTR = Total number of individuals employed and earning at least $3,988 (min. wage ($7.67) x 40 hours per week x 13).
% EMPLOYED FULL QTR = Number found employed full quarter divided by total frequency.
# IDENTIFIED JOB TRNG REL = Total number of individuals found employed with jobs related to training.
% IDENTIFIED AS JOB REL = Number found employed with jobs related to their training divided by number found employed.
FULL QTR AVG EARNINGS = Average quarterly earnings for those employed full quarter.
# CONT ED = Total number of individuals found enrolled in a post secondary institution.
% CONT ED = Number found continuing education divided by total frequency.
# IN MIL = Number found in military service. (Percent not provided due to small incidence rate)
TOTAL "POOL" COUNT = Total number of individuals found employed, continuing education, or in the military.
TOTAL # TRAINING RELATED = Total number of individuals found with employment related to training (This total may include individuals who are continuing their education or are in the military.)
FLORIDA KEYS COMMUNITY COLLEGE
1/6/2014 Path/Program - Q:\Eval1112\FCS\AnnualReports\ByCollege\APPR\FCS1112 BY SCHL (APPR).rpt

1485 FLORIDA KEYS COMMUNITY COLLEGE
PROGRAM Total Freq.Found Employed Employed Full Qtr. Full Qtr.
Avg. EarningsCont. Ed.
# In MilIdentified Job Rel Current
Placement Rate %
Total"Pool" Count
Total # Training Related
6.00# %# %# %# %
1103030100 Marine Environmental Technology
**** 1 50% 0 1 0 1 10% $**,*** 100%50%0 0%1231030100 Diving Business and Technology
**** 2 40% 0 1 0 2 20% $**,*** 100%20%2 100%1318110100 Nursing RN
58 46 79% 42 12 0 46 3872% $12,615 83%21%35 76%1507030500 Computer Programming and Analysis
**** 0 0% 0 0 0 0 00% $**,*** ***%0%0 ***%1507030600 Computer Information Technology
**** 1 50% 1 1 0 1 150% $**,*** 100%50%1 100%1615080400 Marine Engineering, Management & Seamanship
**** 2 40% 1 1 0 2 120% $**,*** 50%20%1 50%
Total Freq.Found Employed Employed Full Qtr. Full Qtr.
Avg. EarningsCont. Ed.
# In MilIdentified Job Rel Current
Placement Rate %
Total"Pool" Count
Total # Training Related
6.00# %# % # % # %
Totals: 73 52 71% 44 60% 75%$12,488 16 22% 0 52 43 83%39
Page 2

FLORIDA COLLEGE SYSTEM VOCATIONAL PROGRAMS AGGREGATED OUTCOME DATA
2011-12 AS DEGREE - COMPLETERSFETPIP FOLLOW-UP OUTCOMES
CURRENT PLACEMENT RATE = Total number training related divided by total "pool" count.
TOTAL FREQ = Total number of individuals reported for follow-up to FETPIP.
# FOUND EMPLOYED = The number of individuals with wages during the 4th qtr of 2012.
% FOUND EMPLOYED = Number found employed divided by total frequency.
# EMPLOYED FULL QTR = Total number of individuals employed and earning at least $3,988 (min. wage ($7.67) x 40 hours per week x 13).
% EMPLOYED FULL QTR = Number found employed full quarter divided by total frequency.
# IDENTIFIED JOB TRNG REL = Total number of individuals found employed with jobs related to training.
% IDENTIFIED AS JOB REL = Number found employed with jobs related to their training divided by number found employed.
FULL QTR AVG EARNINGS = Average quarterly earnings for those employed full quarter.
# CONT ED = Total number of individuals found enrolled in a post secondary institution.
% CONT ED = Number found continuing education divided by total frequency.
# IN MIL = Number found in military service. (Percent not provided due to small incidence rate)
TOTAL "POOL" COUNT = Total number of individuals found employed, continuing education, or in the military.
TOTAL # TRAINING RELATED = Total number of individuals found with employment related to training (This total may include individuals who are continuing their education or are in the military.)
GULF COAST STATE COLLEGE
1/6/2014 Path/Program - Q:\Eval1112\FCS\AnnualReports\ByCollege\APPR\FCS1112 BY SCHL (APPR).rpt

1490 GULF COAST STATE COLLEGE
PROGRAM Total Freq.Found Employed Employed Full Qtr. Full Qtr.
Avg. EarningsCont. Ed.
# In MilIdentified Job Rel Current
Placement Rate %
Total"Pool" Count
Total # Training Related
12.00# %# %# %# %
1317010200 Dental Hygiene
13 10 77% 7 8 0 10 1054% $**,*** 100%62%8 80%1317020601 Emergency Medical Services
**** 7 100% 6 3 0 7 586% $**,*** 71%43%2 29%1317081500 Physical Therapist Assistant
15 13 87% 12 0 0 12 1280% $11,389 100%0%12 92%1317081800 Respiratory Care
**** 0 0% 0 0 0 0 00% $**,*** ***%0%0 ***%1318110100 Nursing RN
102 92 90% 88 39 0 92 9086% $11,238 98%38%85 92%1506040102 Business Administration
**** 1 100% 1 0 0 0 0100% $**,*** ***%0%0 0%1507030401 Networking Services Technology
**** 1 100% 1 1 0 1 1100% $**,*** 100%100%1 100%1615030301 Electronics Engineering Technology
**** 0 0% 0 0 0 0 00% $**,*** ***%0%0 ***%1615100101 Building Construction Technology
**** 0 0% 0 0 0 0 00% $**,*** ***%0%0 ***%1650099900 Music Production Technology
**** 1 14% 0 3 0 4 30% $**,*** 75%43%0 0%1722010300 Paralegal (Legal Assisting)
**** 0 0% 0 0 0 0 00% $**,*** ***%0%0 ***%1743020100 Fire Science Technology (feshe Model)
14 12 86% 10 7 0 13 1271% $12,560 92%50%9 75%
Page 2

1490 GULF COAST STATE COLLEGE
Total Freq.Found Employed Employed Full Qtr. Full Qtr.
Avg. EarningsCont. Ed.
# In MilIdentified Job Rel Current
Placement Rate %
Total"Pool" Count
Total # Training Related
12.00# %# %# %# %
Totals: 166 137 83% 125 75% 85%$11,301 61 37% 0 139 133 96%117
Page 3

FLORIDA COLLEGE SYSTEM VOCATIONAL PROGRAMS AGGREGATED OUTCOME DATA
2011-12 AS DEGREE - COMPLETERSFETPIP FOLLOW-UP OUTCOMES
CURRENT PLACEMENT RATE = Total number training related divided by total "pool" count.
TOTAL FREQ = Total number of individuals reported for follow-up to FETPIP.
# FOUND EMPLOYED = The number of individuals with wages during the 4th qtr of 2012.
% FOUND EMPLOYED = Number found employed divided by total frequency.
# EMPLOYED FULL QTR = Total number of individuals employed and earning at least $3,988 (min. wage ($7.67) x 40 hours per week x 13).
% EMPLOYED FULL QTR = Number found employed full quarter divided by total frequency.
# IDENTIFIED JOB TRNG REL = Total number of individuals found employed with jobs related to training.
% IDENTIFIED AS JOB REL = Number found employed with jobs related to their training divided by number found employed.
FULL QTR AVG EARNINGS = Average quarterly earnings for those employed full quarter.
# CONT ED = Total number of individuals found enrolled in a post secondary institution.
% CONT ED = Number found continuing education divided by total frequency.
# IN MIL = Number found in military service. (Percent not provided due to small incidence rate)
TOTAL "POOL" COUNT = Total number of individuals found employed, continuing education, or in the military.
TOTAL # TRAINING RELATED = Total number of individuals found with employment related to training (This total may include individuals who are continuing their education or are in the military.)
INDIAN RIVER STATE COLLEGE
1/6/2014 Path/Program - Q:\Eval1112\FCS\AnnualReports\ByCollege\APPR\FCS1112 BY SCHL (APPR).rpt

1493 INDIAN RIVER STATE COLLEGE
PROGRAM Total Freq.Found Employed Employed Full Qtr. Full Qtr.
Avg. EarningsCont. Ed.
# In MilIdentified Job Rel Current
Placement Rate %
Total"Pool" Count
Total # Training Related
28.00# %# %# %# %
1206140100 Marketing Management
**** 4 50% 2 3 0 4 425% $**,*** 100%38%2 50%1317010104 Dental Assisting Technology and Management
12 11 92% 9 6 0 10 1075% $**,*** 100%50%5 45%1317010200 Dental Hygiene
10 10 100% 9 3 0 10 1090% $**,*** 100%30%10 100%1317020601 Emergency Medical Services
28 22 79% 18 11 0 15 1364% $12,554 87%39%5 23%1317020900 Radiography
10 10 100% 9 4 0 10 1090% $**,*** 100%40%10 100%1317030900 Medical Laboratory Technology
13 12 92% 12 5 0 13 1392% $10,489 100%38%12 100%1317040600 Human Services - Addiction Studies-Generalist
25 16 64% 10 16 0 20 1940% $7,938 95%64%7 44%1317050600 Health Information Management
19 18 95% 15 5 0 17 1079% $8,731 59%26%10 56%1317081500 Physical Therapist Assistant
18 17 94% 16 2 0 17 1789% $8,993 100%11%17 100%1317081800 Respiratory Care
10 9 90% 9 1 0 9 990% $**,*** 100%10%9 100%1318070100 Health Services Management
**** 3 100% 2 1 0 3 267% $**,*** 67%33%1 33%1318110100 Nursing RN
128 115 90% 111 40 0 114 11287% $11,878 98%31%105 91%1404050100 Interior Design Technology
**** 3 33% 2 1 0 4 322% $**,*** 75%11%2 67%
Page 2

1493 INDIAN RIVER STATE COLLEGE
PROGRAM Total Freq.Found Employed Employed Full Qtr. Full Qtr.
Avg. EarningsCont. Ed.
# In MilIdentified Job Rel Current
Placement Rate %
Total"Pool" Count
Total # Training Related
28.00# %# %# %# %
1420020203 Early Childhood Education Associate Degree
36 32 89% 19 17 0 32 2853% $6,439 88%47%23 72%1506040102 Business Administration
**** 1 100% 1 1 0 1 1100% $**,*** 100%100%0 0%1507010100 Accounting Technology
**** 6 67% 3 3 0 6 433% $**,*** 67%33%2 33%1507030600 Computer Information Technology
38 25 66% 23 20 0 29 2661% $11,826 90%53%9 36%1610010202 Digital Media/Multimedia Technology
**** 2 50% 2 3 0 4 350% $**,*** 75%75%0 0%1615010100 Architectural Design & Construction Technology
**** 1 33% 1 1 0 2 233% $**,*** 100%33%1 100%1615020200 Drafting and Design Technology
**** 6 86% 2 3 0 6 429% $**,*** 67%43%2 33%1615030200 Electrical Power Technology
23 23 100% 22 3 0 23 2396% $18,881 100%13%22 96%1615100101 Building Construction Technology
**** 5 83% 5 3 0 5 483% $**,*** 80%50%1 20%1650040200 Graphics Technology
35 21 60% 8 20 0 30 2323% $**,*** 77%57%4 19%1715020101 Civil Engineering Technology
**** 1 100% 1 0 0 1 0100% $**,*** 0%0%0 0%1722010300 Paralegal (Legal Assisting)
38 28 74% 21 23 0 33 2855% $7,881 85%61%12 43%1743010300 Criminal Justice Technology
49 39 80% 21 27 2 43 3843% $8,468 88%55%13 33%
Page 3

1493 INDIAN RIVER STATE COLLEGE
PROGRAM Total Freq.Found Employed Employed Full Qtr. Full Qtr.
Avg. EarningsCont. Ed.
# In MilIdentified Job Rel Current
Placement Rate %
Total"Pool" Count
Total # Training Related
28.00# %# %# %# %
1743020100 Fire Science Technology (feshe Model)
19 12 63% 6 11 0 16 1332% $**,*** 81%58%4 33%1744040102 Emergency Administration and Management
**** 1 50% 0 0 0 1 10% $**,*** 100%0%1 100%
Total Freq.Found Employed Employed Full Qtr. Full Qtr.
Avg. EarningsCont. Ed.
# In MilIdentified Job Rel Current
Placement Rate %
Total"Pool" Count
Total # Training Related
28.00# %# % # % # %
Totals: 564 453 80% 359 64% 64%$10,627 233 41% 2 478 430 90%289
Page 4

FLORIDA COLLEGE SYSTEM VOCATIONAL PROGRAMS AGGREGATED OUTCOME DATA
2011-12 AS DEGREE - COMPLETERSFETPIP FOLLOW-UP OUTCOMES
CURRENT PLACEMENT RATE = Total number training related divided by total "pool" count.
TOTAL FREQ = Total number of individuals reported for follow-up to FETPIP.
# FOUND EMPLOYED = The number of individuals with wages during the 4th qtr of 2012.
% FOUND EMPLOYED = Number found employed divided by total frequency.
# EMPLOYED FULL QTR = Total number of individuals employed and earning at least $3,988 (min. wage ($7.67) x 40 hours per week x 13).
% EMPLOYED FULL QTR = Number found employed full quarter divided by total frequency.
# IDENTIFIED JOB TRNG REL = Total number of individuals found employed with jobs related to training.
% IDENTIFIED AS JOB REL = Number found employed with jobs related to their training divided by number found employed.
FULL QTR AVG EARNINGS = Average quarterly earnings for those employed full quarter.
# CONT ED = Total number of individuals found enrolled in a post secondary institution.
% CONT ED = Number found continuing education divided by total frequency.
# IN MIL = Number found in military service. (Percent not provided due to small incidence rate)
TOTAL "POOL" COUNT = Total number of individuals found employed, continuing education, or in the military.
TOTAL # TRAINING RELATED = Total number of individuals found with employment related to training (This total may include individuals who are continuing their education or are in the military.)
BROWARD COLLEGE
1/6/2014 Path/Program - Q:\Eval1112\FCS\AnnualReports\ByCollege\APPR\FCS1112 BY SCHL (APPR).rpt

1500 BROWARD COLLEGE
PROGRAM Total Freq.Found Employed Employed Full Qtr. Full Qtr.
Avg. EarningsCont. Ed.
# In MilIdentified Job Rel Current
Placement Rate %
Total"Pool" Count
Total # Training Related
36.00# %# %# %# %
1206079900 Hospitality & Tourism Management
**** 6 75% 4 5 0 7 550% $**,*** 71%63%2 33%1206140100 Marketing Management
**** 2 50% 2 0 0 2 150% $**,*** 50%0%1 50%1317010200 Dental Hygiene
16 15 94% 12 2 0 12 975% $8,961 75%13%8 53%1317020601 Emergency Medical Services
101 88 87% 71 37 1 73 5970% $15,607 81%37%36 41%1317020800 Nuclear Medicine Technology
10 8 80% 7 0 0 8 570% $**,*** 63%0%5 63%1317020901 Radiation Therapy
12 8 67% 7 1 0 8 458% $**,*** 50%8%3 38%1317021200 Diagnostic Medical Sonography Technology
**** 1 33% 1 0 0 1 133% $**,*** 100%0%1 100%1317050600 Health Information Management
25 20 80% 18 5 0 21 1272% $8,527 57%20%8 40%1317070100 Optician
**** 5 100% 5 2 0 5 4100% $**,*** 80%40%2 40%1317081500 Physical Therapist Assistant
36 28 78% 24 4 0 27 2467% $11,016 89%11%23 82%1317081800 Respiratory Care
21 15 71% 12 10 0 18 1557% $9,085 83%48%11 73%1318070100 Health Services Management
**** 2 100% 2 2 0 2 2100% $**,*** 100%100%2 100%1318110100 Nursing RN
353 316 90% 301 167 0 313 30285% $12,780 96%47%272 86%
Page 2

1500 BROWARD COLLEGE
PROGRAM Total Freq.Found Employed Employed Full Qtr. Full Qtr.
Avg. EarningsCont. Ed.
# In MilIdentified Job Rel Current
Placement Rate %
Total"Pool" Count
Total # Training Related
36.00# %# %# %# %
1420020203 Early Childhood Education Associate Degree
24 16 67% 10 11 0 16 1442% $6,437 88%46%9 56%1506040102 Business Administration
13 12 92% 11 9 0 12 1285% $7,854 100%69%9 75%1507010100 Accounting Technology
16 9 56% 7 4 0 10 644% $**,*** 60%25%2 22%1507030401 Networking Services Technology
20 16 80% 13 13 0 17 1665% $11,850 94%65%9 56%1507030500 Computer Programming and Analysis
**** 2 40% 2 4 0 4 440% $**,*** 100%80%1 50%1507030600 Computer Information Technology
**** 2 29% 1 5 0 5 514% $**,*** 100%71%0 0%1507039902 Internet Services Technology
**** 1 50% 0 0 0 1 00% $**,*** 0%0%0 0%1606200101 Industrial Management Technology
**** 1 50% 1 2 0 2 250% $**,*** 100%100%1 100%1615080300 Automotive Service Management Technology
**** 3 75% 2 0 0 3 150% $**,*** 33%0%1 33%1615080400 Marine Engineering, Management & Seamanship
**** 4 100% 3 1 0 4 375% $**,*** 75%25%2 50%1615100101 Building Construction Technology
**** 5 83% 4 3 0 5 367% $**,*** 60%50%1 20%1620040100 Culinary Management
**** 3 100% 3 1 0 2 1100% $**,*** 50%33%0 0%1647060407 Dealer-Specific Automotive Technology
**** 0 0% 0 1 0 1 10% $**,*** 100%50%0 ***%
Page 3

1500 BROWARD COLLEGE
PROGRAM Total Freq.Found Employed Employed Full Qtr. Full Qtr.
Avg. EarningsCont. Ed.
# In MilIdentified Job Rel Current
Placement Rate %
Total"Pool" Count
Total # Training Related
36.00# %# %# %# %
1649010200 Professional Pilot Technology
15 9 60% 7 2 0 9 647% $**,*** 67%13%4 44%1649010400 Aviation Operations
14 10 71% 8 7 0 11 1057% $**,*** 91%50%5 50%1649010401 Aviation Maintenance Management
**** 6 100% 6 4 0 6 6100% $**,*** 100%67%5 83%1650040200 Graphics Technology
12 4 33% 2 2 0 4 217% $**,*** 50%17%1 25%1715020101 Civil Engineering Technology
**** 1 100% 0 1 0 1 10% $**,*** 100%100%0 0%1715059901 Environmental Science Technology
**** 2 100% 2 1 0 2 2100% $**,*** 100%50%1 50%1722010300 Paralegal (Legal Assisting)
55 43 78% 36 20 0 43 4165% $9,254 95%36%26 60%1736019901 Recreation Technology
**** 1 100% 1 0 0 1 0100% $**,*** 0%0%0 0%1743010300 Criminal Justice Technology
42 27 64% 20 19 0 31 2348% $8,911 74%45%6 22%1743020100 Fire Science Technology (feshe Model)
19 19 100% 19 6 0 19 19100% $21,516 100%32%19 100%
Total Freq.Found Employed Employed Full Qtr. Full Qtr.
Avg. EarningsCont. Ed.
# In MilIdentified Job Rel Current
Placement Rate %
Total"Pool" Count
Total # Training Related
36.00# %# % # % # %
Totals: 871 710 82% 624 72% 67%$12,117 351 40% 1 706 621 88%476
Page 4

FLORIDA COLLEGE SYSTEM VOCATIONAL PROGRAMS AGGREGATED OUTCOME DATA
2011-12 AS DEGREE - COMPLETERSFETPIP FOLLOW-UP OUTCOMES
CURRENT PLACEMENT RATE = Total number training related divided by total "pool" count.
TOTAL FREQ = Total number of individuals reported for follow-up to FETPIP.
# FOUND EMPLOYED = The number of individuals with wages during the 4th qtr of 2012.
% FOUND EMPLOYED = Number found employed divided by total frequency.
# EMPLOYED FULL QTR = Total number of individuals employed and earning at least $3,988 (min. wage ($7.67) x 40 hours per week x 13).
% EMPLOYED FULL QTR = Number found employed full quarter divided by total frequency.
# IDENTIFIED JOB TRNG REL = Total number of individuals found employed with jobs related to training.
% IDENTIFIED AS JOB REL = Number found employed with jobs related to their training divided by number found employed.
FULL QTR AVG EARNINGS = Average quarterly earnings for those employed full quarter.
# CONT ED = Total number of individuals found enrolled in a post secondary institution.
% CONT ED = Number found continuing education divided by total frequency.
# IN MIL = Number found in military service. (Percent not provided due to small incidence rate)
TOTAL "POOL" COUNT = Total number of individuals found employed, continuing education, or in the military.
TOTAL # TRAINING RELATED = Total number of individuals found with employment related to training (This total may include individuals who are continuing their education or are in the military.)
FLORIDA GATEWAY COLLEGE
1/6/2014 Path/Program - Q:\Eval1112\FCS\AnnualReports\ByCollege\APPR\FCS1112 BY SCHL (APPR).rpt

1501 FLORIDA GATEWAY COLLEGE
PROGRAM Total Freq.Found Employed Employed Full Qtr. Full Qtr.
Avg. EarningsCont. Ed.
# In MilIdentified Job Rel Current
Placement Rate %
Total"Pool" Count
Total # Training Related
11.00# %# %# %# %
1101060500 Landscape & Horticulture Technology
**** 1 25% 1 0 0 1 125% $**,*** 100%0%1 100%1101060701 Golf Course Operations
**** 8 89% 8 1 0 8 589% $**,*** 63%11%5 63%1317020601 Emergency Medical Services
**** 3 100% 3 1 0 3 3100% $**,*** 100%33%2 67%1317081500 Physical Therapist Assistant
22 15 68% 14 1 0 15 1464% $10,667 93%5%13 87%1318110100 Nursing RN
78 71 91% 68 9 0 69 6687% $12,541 96%12%66 93%1420020203 Early Childhood Education Associate Degree
**** 5 83% 4 2 0 6 467% $**,*** 67%33%2 40%1506040102 Business Administration
**** 1 100% 1 0 0 1 1100% $**,*** 100%0%1 100%1507030500 Computer Programming and Analysis
**** 1 100% 1 0 0 0 0100% $**,*** ***%0%0 0%1507030600 Computer Information Technology
**** 1 50% 1 1 0 1 150% $**,*** 100%50%0 0%1507060300 Office Administration
**** 0 0% 0 0 0 0 00% $**,*** ***%0%0 ***%1652020900 Supply Chain Management
**** 1 100% 1 0 0 1 1100% $**,*** 100%0%1 100%
Total Freq.Found Employed Employed Full Qtr. Full Qtr.
Avg. EarningsCont. Ed.
# In MilIdentified Job Rel Current
Placement Rate %
Total"Pool" Count
Total # Training Related
11.00# %# % # % # %
Totals: 128 107 84% 102 80% 85%$11,580 15 12% 0 105 96 91%91
Page 2

FLORIDA COLLEGE SYSTEM VOCATIONAL PROGRAMS AGGREGATED OUTCOME DATA
2011-12 AS DEGREE - COMPLETERSFETPIP FOLLOW-UP OUTCOMES
CURRENT PLACEMENT RATE = Total number training related divided by total "pool" count.
TOTAL FREQ = Total number of individuals reported for follow-up to FETPIP.
# FOUND EMPLOYED = The number of individuals with wages during the 4th qtr of 2012.
% FOUND EMPLOYED = Number found employed divided by total frequency.
# EMPLOYED FULL QTR = Total number of individuals employed and earning at least $3,988 (min. wage ($7.67) x 40 hours per week x 13).
% EMPLOYED FULL QTR = Number found employed full quarter divided by total frequency.
# IDENTIFIED JOB TRNG REL = Total number of individuals found employed with jobs related to training.
% IDENTIFIED AS JOB REL = Number found employed with jobs related to their training divided by number found employed.
FULL QTR AVG EARNINGS = Average quarterly earnings for those employed full quarter.
# CONT ED = Total number of individuals found enrolled in a post secondary institution.
% CONT ED = Number found continuing education divided by total frequency.
# IN MIL = Number found in military service. (Percent not provided due to small incidence rate)
TOTAL "POOL" COUNT = Total number of individuals found employed, continuing education, or in the military.
TOTAL # TRAINING RELATED = Total number of individuals found with employment related to training (This total may include individuals who are continuing their education or are in the military.)
LAKE-SUMTER STATE COLLEGE
1/6/2014 Path/Program - Q:\Eval1112\FCS\AnnualReports\ByCollege\APPR\FCS1112 BY SCHL (APPR).rpt

1502 LAKE-SUMTER STATE COLLEGE
PROGRAM Total Freq.Found Employed Employed Full Qtr. Full Qtr.
Avg. EarningsCont. Ed.
# In MilIdentified Job Rel Current
Placement Rate %
Total"Pool" Count
Total # Training Related
6.00# %# %# %# %
1317020601 Emergency Medical Services
**** 2 100% 2 2 0 2 2100% $**,*** 100%100%1 50%1317050600 Health Information Management
**** 1 100% 1 0 0 1 1100% $**,*** 100%0%1 100%1318110100 Nursing RN
81 71 88% 65 10 0 69 6780% $10,700 97%12%67 94%1420020203 Early Childhood Education Associate Degree
**** 0 0% 0 1 0 1 10% $**,*** 100%100%0 ***%1507030600 Computer Information Technology
**** 5 71% 3 1 0 5 243% $**,*** 40%14%1 20%1743010300 Criminal Justice Technology
**** 3 100% 3 1 0 3 2100% $**,*** 67%33%2 67%
Total Freq.Found Employed Employed Full Qtr. Full Qtr.
Avg. EarningsCont. Ed.
# In MilIdentified Job Rel Current
Placement Rate %
Total"Pool" Count
Total # Training Related
6.00# %# % # % # %
Totals: 95 82 86% 74 78% 88%$10,521 15 16% 0 81 75 93%72
Page 2

FLORIDA COLLEGE SYSTEM VOCATIONAL PROGRAMS AGGREGATED OUTCOME DATA
2011-12 AS DEGREE - COMPLETERSFETPIP FOLLOW-UP OUTCOMES
CURRENT PLACEMENT RATE = Total number training related divided by total "pool" count.
TOTAL FREQ = Total number of individuals reported for follow-up to FETPIP.
# FOUND EMPLOYED = The number of individuals with wages during the 4th qtr of 2012.
% FOUND EMPLOYED = Number found employed divided by total frequency.
# EMPLOYED FULL QTR = Total number of individuals employed and earning at least $3,988 (min. wage ($7.67) x 40 hours per week x 13).
% EMPLOYED FULL QTR = Number found employed full quarter divided by total frequency.
# IDENTIFIED JOB TRNG REL = Total number of individuals found employed with jobs related to training.
% IDENTIFIED AS JOB REL = Number found employed with jobs related to their training divided by number found employed.
FULL QTR AVG EARNINGS = Average quarterly earnings for those employed full quarter.
# CONT ED = Total number of individuals found enrolled in a post secondary institution.
% CONT ED = Number found continuing education divided by total frequency.
# IN MIL = Number found in military service. (Percent not provided due to small incidence rate)
TOTAL "POOL" COUNT = Total number of individuals found employed, continuing education, or in the military.
TOTAL # TRAINING RELATED = Total number of individuals found with employment related to training (This total may include individuals who are continuing their education or are in the military.)
STATE COLLEGE OF FLORIDA, MANATEE-SARASOTA
1/6/2014 Path/Program - Q:\Eval1112\FCS\AnnualReports\ByCollege\APPR\FCS1112 BY SCHL (APPR).rpt

1504 STATE COLLEGE OF FLORIDA, MANATEE-SARASOTA
PROGRAM Total Freq.Found Employed Employed Full Qtr. Full Qtr.
Avg. EarningsCont. Ed.
# In MilIdentified Job Rel Current
Placement Rate %
Total"Pool" Count
Total # Training Related
2.00# %# %# %# %
1506040102 Business Administration
**** 7 78% 5 5 0 7 656% $**,*** 86%56%3 43%1646041200 Construction Management Technology
**** 0 0% 0 1 0 1 10% $**,*** 100%100%0 ***%
Total Freq.Found Employed Employed Full Qtr. Full Qtr.
Avg. EarningsCont. Ed.
# In MilIdentified Job Rel Current
Placement Rate %
Total"Pool" Count
Total # Training Related
2.00# %# % # % # %
Totals: 10 7 70% 5 50% 43%$**,*** 6 60% 0 8 7 88%3
Page 2

FLORIDA COLLEGE SYSTEM VOCATIONAL PROGRAMS AGGREGATED OUTCOME DATA
2011-12 AS DEGREE - COMPLETERSFETPIP FOLLOW-UP OUTCOMES
CURRENT PLACEMENT RATE = Total number training related divided by total "pool" count.
TOTAL FREQ = Total number of individuals reported for follow-up to FETPIP.
# FOUND EMPLOYED = The number of individuals with wages during the 4th qtr of 2012.
% FOUND EMPLOYED = Number found employed divided by total frequency.
# EMPLOYED FULL QTR = Total number of individuals employed and earning at least $3,988 (min. wage ($7.67) x 40 hours per week x 13).
% EMPLOYED FULL QTR = Number found employed full quarter divided by total frequency.
# IDENTIFIED JOB TRNG REL = Total number of individuals found employed with jobs related to training.
% IDENTIFIED AS JOB REL = Number found employed with jobs related to their training divided by number found employed.
FULL QTR AVG EARNINGS = Average quarterly earnings for those employed full quarter.
# CONT ED = Total number of individuals found enrolled in a post secondary institution.
% CONT ED = Number found continuing education divided by total frequency.
# IN MIL = Number found in military service. (Percent not provided due to small incidence rate)
TOTAL "POOL" COUNT = Total number of individuals found employed, continuing education, or in the military.
TOTAL # TRAINING RELATED = Total number of individuals found with employment related to training (This total may include individuals who are continuing their education or are in the military.)
MIAMI DADE COLLEGE
1/6/2014 Path/Program - Q:\Eval1112\FCS\AnnualReports\ByCollege\APPR\FCS1112 BY SCHL (APPR).rpt

1506 MIAMI DADE COLLEGE
PROGRAM Total Freq.Found Employed Employed Full Qtr. Full Qtr.
Avg. EarningsCont. Ed.
# In MilIdentified Job Rel Current
Placement Rate %
Total"Pool" Count
Total # Training Related
55.00# %# %# %# %
1101060500 Landscape & Horticulture Technology
**** 0 0% 0 0 0 0 00% $**,*** ***%0%0 ***%1206030100 Financial Services
**** 1 25% 1 2 0 3 325% $**,*** 100%50%1 100%1206070500 Travel & Tourism Industry Management
**** 4 80% 1 4 0 5 420% $**,*** 80%80%0 0%1206079900 Hospitality & Tourism Management
**** 3 50% 1 1 0 3 317% $**,*** 100%17%3 100%1206140100 Marketing Management
**** 5 71% 5 6 0 6 671% $**,*** 100%86%3 60%1312030100 Funeral Services
17 13 76% 11 4 0 13 1065% $8,767 77%24%8 62%1317010200 Dental Hygiene
31 19 61% 10 17 0 24 2332% $6,654 96%55%12 63%1317020601 Emergency Medical Services
74 66 89% 58 40 0 52 4678% $12,811 88%54%24 36%1317020800 Nuclear Medicine Technology
10 7 70% 5 5 0 8 750% $**,*** 88%50%5 71%1317021200 Diagnostic Medical Sonography Technology
16 14 88% 14 1 0 13 1188% $11,167 85%6%11 79%1317030800 Histologic Technology
16 12 75% 10 5 0 14 1063% $7,571 71%31%7 58%1317030900 Medical Laboratory Technology
42 39 93% 34 6 0 38 3481% $10,297 89%14%31 79%1317040600 Human Services - Addiction Studies-Generalist
11 7 64% 6 5 0 10 955% $**,*** 90%45%5 71%
Page 2

1506 MIAMI DADE COLLEGE
PROGRAM Total Freq.Found Employed Employed Full Qtr. Full Qtr.
Avg. EarningsCont. Ed.
# In MilIdentified Job Rel Current
Placement Rate %
Total"Pool" Count
Total # Training Related
55.00# %# %# %# %
1317050600 Health Information Management
12 12 100% 11 1 0 12 892% $8,570 67%8%7 58%1317050800 Physician Assistant
41 29 71% 27 5 0 27 2566% $22,746 93%12%23 79%1317051200 Veterinary Technology
**** 6 100% 5 2 0 5 383% $**,*** 60%33%2 33%1317070100 Optician
25 22 88% 16 8 0 21 2064% $6,385 95%32%18 82%1317081500 Physical Therapist Assistant
45 29 64% 26 14 0 27 2658% $12,664 96%31%21 72%1317081800 Respiratory Care
29 20 69% 14 10 0 24 1548% $8,081 63%34%7 35%1318110100 Nursing RN
532 401 75% 347 277 0 434 41065% $12,100 94%52%298 74%1404050100 Interior Design Technology
**** 3 43% 1 2 0 4 314% $**,*** 75%29%1 33%1420020203 Early Childhood Education Associate Degree
34 23 68% 15 16 0 24 2144% $7,617 88%47%11 48%1506040102 Business Administration
17 9 53% 7 11 0 13 1241% $**,*** 92%65%5 56%1507010100 Accounting Technology
39 27 69% 25 20 0 31 2864% $9,143 90%51%21 78%1507030401 Networking Services Technology
24 19 79% 12 9 0 21 1250% $11,080 57%38%7 37%1507030500 Computer Programming and Analysis
**** 3 60% 2 2 0 4 340% $**,*** 75%40%2 67%
Page 3

1506 MIAMI DADE COLLEGE
PROGRAM Total Freq.Found Employed Employed Full Qtr. Full Qtr.
Avg. EarningsCont. Ed.
# In MilIdentified Job Rel Current
Placement Rate %
Total"Pool" Count
Total # Training Related
55.00# %# %# %# %
1507030600 Computer Information Technology
**** 5 71% 4 4 0 7 557% $**,*** 71%57%2 40%1507030601 Database Technology
**** 4 80% 4 1 0 5 280% $**,*** 40%20%1 25%1507039902 Internet Services Technology
**** 6 75% 3 3 0 7 738% $**,*** 100%38%5 83%1507060201 Court Reporting Technology
**** 1 100% 1 1 0 1 1100% $**,*** 100%100%0 0%1507060300 Office Administration
**** 8 89% 7 4 0 8 878% $**,*** 100%44%7 88%1610010200 Film Production Technology
29 17 59% 8 17 0 22 1728% $**,*** 77%59%1 6%1610010202 Digital Media/Multimedia Technology
**** 3 60% 2 2 0 3 240% $**,*** 67%40%1 33%1610010300 Photographic Technology
**** 2 67% 2 2 0 3 267% $**,*** 67%67%0 0%1610010402 Radio and Television Broadcast Programming
16 7 44% 5 6 0 11 931% $**,*** 82%38%4 57%1615010100 Architectural Design & Construction Technology
11 7 64% 5 4 1 9 745% $**,*** 78%36%4 57%1615030200 Electrical Power Technology
32 30 94% 24 12 0 30 2575% $17,610 83%38%21 70%1615030301 Electronics Engineering Technology
**** 1 33% 0 2 0 3 20% $**,*** 67%67%0 0%1615030302 Telecommunications Engineering Technology
**** 1 50% 0 0 0 1 10% $**,*** 100%0%1 100%
Page 4

1506 MIAMI DADE COLLEGE
PROGRAM Total Freq.Found Employed Employed Full Qtr. Full Qtr.
Avg. EarningsCont. Ed.
# In MilIdentified Job Rel Current
Placement Rate %
Total"Pool" Count
Total # Training Related
55.00# %# %# %# %
1615040200 Computer Engineering Technology
**** 4 80% 1 3 0 5 320% $**,*** 60%60%1 25%1615080300 Automotive Service Management Technology
**** 4 100% 4 2 0 4 4100% $**,*** 100%50%2 50%1615100101 Building Construction Technology
**** 5 71% 5 1 0 3 171% $**,*** 33%14%0 0%1620040100 Culinary Management
**** 0 0% 0 1 0 1 10% $**,*** 100%100%0 ***%1626061600 Biotechnology
**** 1 25% 1 0 0 1 025% $**,*** 0%0%0 0%1649010200 Professional Pilot Technology
10 3 30% 1 1 0 4 410% $**,*** 100%10%3 100%1649010401 Aviation Maintenance Management
**** 6 100% 6 5 0 5 5100% $**,*** 100%83%5 83%1649010402 Aviation Administration
65 43 66% 31 15 0 40 1948% $7,955 48%23%6 14%1650040200 Graphics Technology
14 4 29% 3 3 0 7 321% $**,*** 43%21%0 0%1650099900 Music Production Technology
21 11 52% 4 9 0 16 1019% $**,*** 63%43%2 18%1713100301 Sign Language Interpretation
**** 3 43% 1 1 0 4 114% $**,*** 25%14%0 0%1713100303 Translation-interpretation Studies: English-Spanish Track
**** 3 50% 2 2 0 3 333% $**,*** 100%33%1 33%1715020101 Civil Engineering Technology
**** 2 100% 2 2 0 2 2100% $**,*** 100%100%1 50%
Page 5

1506 MIAMI DADE COLLEGE
PROGRAM Total Freq.Found Employed Employed Full Qtr. Full Qtr.
Avg. EarningsCont. Ed.
# In MilIdentified Job Rel Current
Placement Rate %
Total"Pool" Count
Total # Training Related
55.00# %# %# %# %
1722010300 Paralegal (Legal Assisting)
61 44 72% 35 24 0 54 5057% $9,122 93%39%33 75%1743010300 Criminal Justice Technology
24 17 71% 13 12 0 21 1454% $8,195 67%50%6 35%1743020100 Fire Science Technology (feshe Model)
**** 7 100% 6 2 0 7 686% $**,*** 86%29%5 71%
Total Freq.Found Employed Employed Full Qtr. Full Qtr.
Avg. EarningsCont. Ed.
# In MilIdentified Job Rel Current
Placement Rate %
Total"Pool" Count
Total # Training Related
55.00# %# % # % # %
Totals: 1,432 1,042 73% 844 59% 62%$11,421 614 43% 1 1,123 966 86%645
Page 6

FLORIDA COLLEGE SYSTEM VOCATIONAL PROGRAMS AGGREGATED OUTCOME DATA
2011-12 AS DEGREE - COMPLETERSFETPIP FOLLOW-UP OUTCOMES
CURRENT PLACEMENT RATE = Total number training related divided by total "pool" count.
TOTAL FREQ = Total number of individuals reported for follow-up to FETPIP.
# FOUND EMPLOYED = The number of individuals with wages during the 4th qtr of 2012.
% FOUND EMPLOYED = Number found employed divided by total frequency.
# EMPLOYED FULL QTR = Total number of individuals employed and earning at least $3,988 (min. wage ($7.67) x 40 hours per week x 13).
% EMPLOYED FULL QTR = Number found employed full quarter divided by total frequency.
# IDENTIFIED JOB TRNG REL = Total number of individuals found employed with jobs related to training.
% IDENTIFIED AS JOB REL = Number found employed with jobs related to their training divided by number found employed.
FULL QTR AVG EARNINGS = Average quarterly earnings for those employed full quarter.
# CONT ED = Total number of individuals found enrolled in a post secondary institution.
% CONT ED = Number found continuing education divided by total frequency.
# IN MIL = Number found in military service. (Percent not provided due to small incidence rate)
TOTAL "POOL" COUNT = Total number of individuals found employed, continuing education, or in the military.
TOTAL # TRAINING RELATED = Total number of individuals found with employment related to training (This total may include individuals who are continuing their education or are in the military.)
NORTH FLORIDA COMMUNITY COLLEGE
1/6/2014 Path/Program - Q:\Eval1112\FCS\AnnualReports\ByCollege\APPR\FCS1112 BY SCHL (APPR).rpt

1508 NORTH FLORIDA COMMUNITY COLLEGE
PROGRAM Total Freq.Found Employed Employed Full Qtr. Full Qtr.
Avg. EarningsCont. Ed.
# In MilIdentified Job Rel Current
Placement Rate %
Total"Pool" Count
Total # Training Related
3.00# %# %# %# %
1317020601 Emergency Medical Services
**** 2 50% 2 1 0 1 150% $**,*** 100%25%1 50%1318110100 Nursing RN
21 11 52% 10 4 0 11 1148% $11,749 100%19%10 91%1506040102 Business Administration
**** 0 0% 0 2 0 2 20% $**,*** 100%100%0 ***%
Total Freq.Found Employed Employed Full Qtr. Full Qtr.
Avg. EarningsCont. Ed.
# In MilIdentified Job Rel Current
Placement Rate %
Total"Pool" Count
Total # Training Related
3.00# %# % # % # %
Totals: 27 13 48% 12 44% 85%$11,516 7 26% 0 14 14 100%11
Page 2

FLORIDA COLLEGE SYSTEM VOCATIONAL PROGRAMS AGGREGATED OUTCOME DATA
2011-12 AS DEGREE - COMPLETERSFETPIP FOLLOW-UP OUTCOMES
CURRENT PLACEMENT RATE = Total number training related divided by total "pool" count.
TOTAL FREQ = Total number of individuals reported for follow-up to FETPIP.
# FOUND EMPLOYED = The number of individuals with wages during the 4th qtr of 2012.
% FOUND EMPLOYED = Number found employed divided by total frequency.
# EMPLOYED FULL QTR = Total number of individuals employed and earning at least $3,988 (min. wage ($7.67) x 40 hours per week x 13).
% EMPLOYED FULL QTR = Number found employed full quarter divided by total frequency.
# IDENTIFIED JOB TRNG REL = Total number of individuals found employed with jobs related to training.
% IDENTIFIED AS JOB REL = Number found employed with jobs related to their training divided by number found employed.
FULL QTR AVG EARNINGS = Average quarterly earnings for those employed full quarter.
# CONT ED = Total number of individuals found enrolled in a post secondary institution.
% CONT ED = Number found continuing education divided by total frequency.
# IN MIL = Number found in military service. (Percent not provided due to small incidence rate)
TOTAL "POOL" COUNT = Total number of individuals found employed, continuing education, or in the military.
TOTAL # TRAINING RELATED = Total number of individuals found with employment related to training (This total may include individuals who are continuing their education or are in the military.)
NORTHWEST FLORIDA STATE COLLEGE
1/6/2014 Path/Program - Q:\Eval1112\FCS\AnnualReports\ByCollege\APPR\FCS1112 BY SCHL (APPR).rpt

1510 NORTHWEST FLORIDA STATE COLLEGE
PROGRAM Total Freq.Found Employed Employed Full Qtr. Full Qtr.
Avg. EarningsCont. Ed.
# In MilIdentified Job Rel Current
Placement Rate %
Total"Pool" Count
Total # Training Related
10.00# %# %# %# %
1317020601 Emergency Medical Services
**** 4 67% 4 2 0 4 267% $**,*** 50%33%0 0%1317020900 Radiography
21 17 81% 8 4 0 14 838% $**,*** 57%19%6 35%1318110100 Nursing RN
47 40 85% 37 18 0 39 3779% $10,184 95%38%34 85%1420020203 Early Childhood Education Associate Degree
**** 6 75% 5 4 0 6 563% $**,*** 83%50%3 50%1507010100 Accounting Technology
**** 4 57% 4 6 0 7 657% $**,*** 86%86%1 25%1507030401 Networking Services Technology
**** 1 100% 1 1 0 1 1100% $**,*** 100%100%1 100%1507030500 Computer Programming and Analysis
**** 3 60% 3 3 0 3 360% $**,*** 100%60%1 33%1507030600 Computer Information Technology
**** 1 25% 1 1 0 1 125% $**,*** 100%25%0 0%1650040200 Graphics Technology
**** 2 100% 0 0 0 2 00% $**,*** 0%0%0 0%1736019901 Recreation Technology
**** 0 0% 0 1 0 1 10% $**,*** 100%100%0 ***%
Total Freq.Found Employed Employed Full Qtr. Full Qtr.
Avg. EarningsCont. Ed.
# In MilIdentified Job Rel Current
Placement Rate %
Total"Pool" Count
Total # Training Related
10.00# %# % # % # %
Totals: 102 78 76% 63 62% 59%$9,348 40 39% 0 78 64 82%46
Page 2

FLORIDA COLLEGE SYSTEM VOCATIONAL PROGRAMS AGGREGATED OUTCOME DATA
2011-12 AS DEGREE - COMPLETERSFETPIP FOLLOW-UP OUTCOMES
CURRENT PLACEMENT RATE = Total number training related divided by total "pool" count.
TOTAL FREQ = Total number of individuals reported for follow-up to FETPIP.
# FOUND EMPLOYED = The number of individuals with wages during the 4th qtr of 2012.
% FOUND EMPLOYED = Number found employed divided by total frequency.
# EMPLOYED FULL QTR = Total number of individuals employed and earning at least $3,988 (min. wage ($7.67) x 40 hours per week x 13).
% EMPLOYED FULL QTR = Number found employed full quarter divided by total frequency.
# IDENTIFIED JOB TRNG REL = Total number of individuals found employed with jobs related to training.
% IDENTIFIED AS JOB REL = Number found employed with jobs related to their training divided by number found employed.
FULL QTR AVG EARNINGS = Average quarterly earnings for those employed full quarter.
# CONT ED = Total number of individuals found enrolled in a post secondary institution.
% CONT ED = Number found continuing education divided by total frequency.
# IN MIL = Number found in military service. (Percent not provided due to small incidence rate)
TOTAL "POOL" COUNT = Total number of individuals found employed, continuing education, or in the military.
TOTAL # TRAINING RELATED = Total number of individuals found with employment related to training (This total may include individuals who are continuing their education or are in the military.)
PALM BEACH STATE COLLEGE
1/6/2014 Path/Program - Q:\Eval1112\FCS\AnnualReports\ByCollege\APPR\FCS1112 BY SCHL (APPR).rpt

1512 PALM BEACH STATE COLLEGE
PROGRAM Total Freq.Found Employed Employed Full Qtr. Full Qtr.
Avg. EarningsCont. Ed.
# In MilIdentified Job Rel Current
Placement Rate %
Total"Pool" Count
Total # Training Related
29.00# %# %# %# %
1101060500 Landscape & Horticulture Technology
**** 1 25% 1 1 0 2 125% $**,*** 50%25%0 0%1206079900 Hospitality & Tourism Management
**** 2 67% 0 2 0 3 30% $**,*** 100%67%1 50%1317010200 Dental Hygiene
25 22 88% 16 11 0 23 2064% $7,630 87%44%15 68%1317020601 Emergency Medical Services
42 39 93% 36 23 0 30 2986% $16,612 97%55%14 36%1317020900 Radiography
20 17 85% 14 4 0 15 1470% $8,732 93%20%11 65%1317021200 Diagnostic Medical Sonography Technology
**** 2 100% 2 1 0 2 2100% $**,*** 100%50%2 100%1317040600 Human Services - Addiction Studies-Generalist
28 13 46% 6 22 0 24 2421% $**,*** 100%79%3 23%1317050600 Health Information Management
**** 1 50% 1 1 0 1 150% $**,*** 100%50%0 0%1317081800 Respiratory Care
17 14 82% 13 1 0 14 1476% $11,972 100%6%13 93%1318110100 Nursing RN
161 134 83% 128 43 0 129 11880% $12,836 91%27%108 81%1326061600 Biotechnology Laboratory Technology
**** 2 40% 0 3 0 3 30% $**,*** 100%60%0 0%1404050100 Interior Design Technology
**** 5 56% 2 2 0 5 422% $**,*** 80%22%2 40%1420020203 Early Childhood Education Associate Degree
45 35 78% 31 28 0 39 3969% $6,626 100%62%23 66%
Page 2

1512 PALM BEACH STATE COLLEGE
PROGRAM Total Freq.Found Employed Employed Full Qtr. Full Qtr.
Avg. EarningsCont. Ed.
# In MilIdentified Job Rel Current
Placement Rate %
Total"Pool" Count
Total # Training Related
29.00# %# %# %# %
1507010100 Accounting Technology
10 7 70% 4 5 0 8 840% $**,*** 100%50%4 57%1507030401 Networking Services Technology
24 17 71% 14 13 0 22 1458% $7,198 64%54%2 12%1507030600 Computer Information Technology
12 8 67% 5 5 0 7 642% $**,*** 86%42%4 50%1507039902 Internet Services Technology
**** 5 71% 4 2 0 5 457% $**,*** 80%29%3 60%1606200101 Industrial Management Technology
**** 0 0% 0 0 0 0 00% $**,*** ***%0%0 ***%1610010200 Film Production Technology
**** 4 80% 2 2 0 5 240% $**,*** 40%40%0 0%1615030200 Electrical Power Technology
14 10 71% 10 5 0 12 1171% $10,939 92%36%7 70%1615100101 Building Construction Technology
**** 2 67% 2 0 0 2 067% $**,*** 0%0%0 0%1649010200 Professional Pilot Technology
**** 3 38% 2 2 0 4 225% $**,*** 50%25%0 0%1650040200 Graphics Technology
13 7 54% 5 5 0 9 738% $**,*** 78%38%2 29%1713129901 Instructional Services Technology
**** 7 100% 5 2 0 6 471% $**,*** 67%29%3 43%1715059901 Environmental Science Technology
**** 3 60% 2 2 0 4 340% $**,*** 75%40%2 67%1722010300 Paralegal (Legal Assisting)
38 31 82% 26 14 0 35 2868% $7,715 80%37%18 58%
Page 3

1512 PALM BEACH STATE COLLEGE
PROGRAM Total Freq.Found Employed Employed Full Qtr. Full Qtr.
Avg. EarningsCont. Ed.
# In MilIdentified Job Rel Current
Placement Rate %
Total"Pool" Count
Total # Training Related
29.00# %# %# %# %
1743010300 Criminal Justice Technology
**** 3 100% 2 1 0 3 267% $**,*** 67%33%2 67%1743010600 Crime Scene Technology
17 14 82% 10 10 1 17 1159% $6,280 65%59%1 7%1743020100 Fire Science Technology (feshe Model)
**** 5 100% 5 2 0 5 5100% $**,*** 100%40%4 80%
Total Freq.Found Employed Employed Full Qtr. Full Qtr.
Avg. EarningsCont. Ed.
# In MilIdentified Job Rel Current
Placement Rate %
Total"Pool" Count
Total # Training Related
29.00# %# % # % # %
Totals: 535 413 77% 348 65% 59%$10,976 212 40% 1 434 379 87%244
Page 4

FLORIDA COLLEGE SYSTEM VOCATIONAL PROGRAMS AGGREGATED OUTCOME DATA
2011-12 AS DEGREE - COMPLETERSFETPIP FOLLOW-UP OUTCOMES
CURRENT PLACEMENT RATE = Total number training related divided by total "pool" count.
TOTAL FREQ = Total number of individuals reported for follow-up to FETPIP.
# FOUND EMPLOYED = The number of individuals with wages during the 4th qtr of 2012.
% FOUND EMPLOYED = Number found employed divided by total frequency.
# EMPLOYED FULL QTR = Total number of individuals employed and earning at least $3,988 (min. wage ($7.67) x 40 hours per week x 13).
% EMPLOYED FULL QTR = Number found employed full quarter divided by total frequency.
# IDENTIFIED JOB TRNG REL = Total number of individuals found employed with jobs related to training.
% IDENTIFIED AS JOB REL = Number found employed with jobs related to their training divided by number found employed.
FULL QTR AVG EARNINGS = Average quarterly earnings for those employed full quarter.
# CONT ED = Total number of individuals found enrolled in a post secondary institution.
% CONT ED = Number found continuing education divided by total frequency.
# IN MIL = Number found in military service. (Percent not provided due to small incidence rate)
TOTAL "POOL" COUNT = Total number of individuals found employed, continuing education, or in the military.
TOTAL # TRAINING RELATED = Total number of individuals found with employment related to training (This total may include individuals who are continuing their education or are in the military.)
PENSACOLA STATE COLLEGE
1/6/2014 Path/Program - Q:\Eval1112\FCS\AnnualReports\ByCollege\APPR\FCS1112 BY SCHL (APPR).rpt
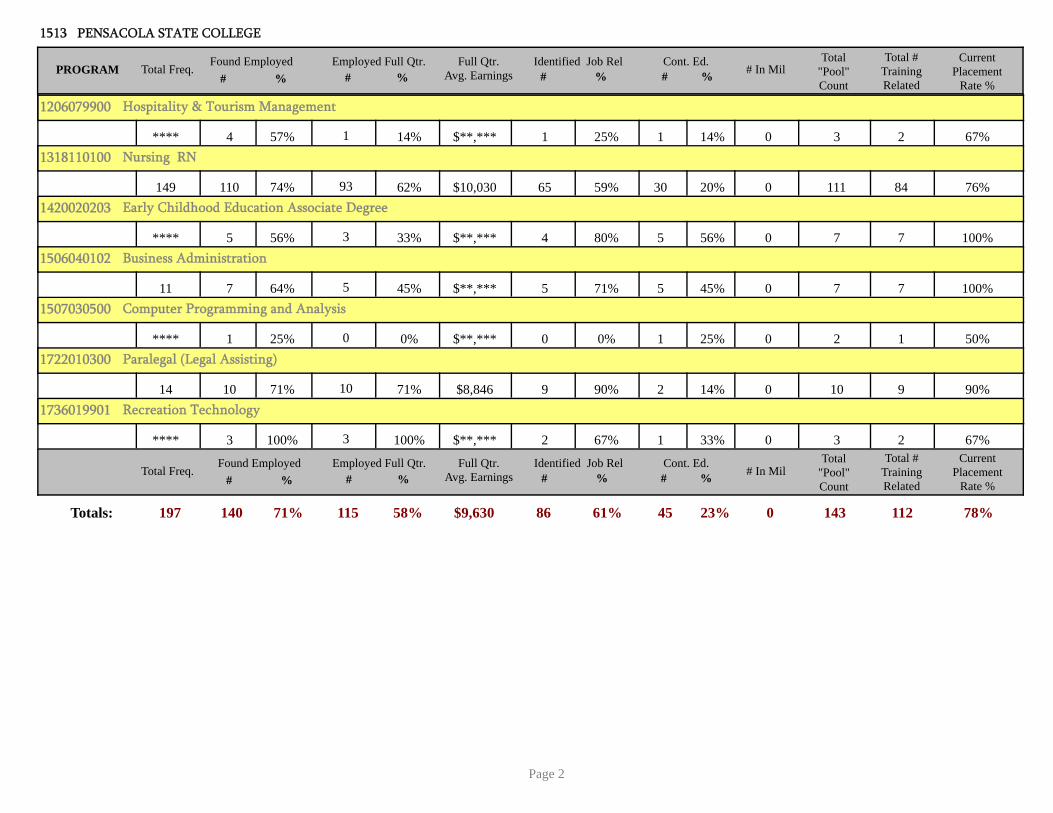
1513 PENSACOLA STATE COLLEGE
PROGRAM Total Freq.Found Employed Employed Full Qtr. Full Qtr.
Avg. EarningsCont. Ed.
# In MilIdentified Job Rel Current
Placement Rate %
Total"Pool" Count
Total # Training Related
7.00# %# %# %# %
1206079900 Hospitality & Tourism Management
**** 4 57% 1 1 0 3 214% $**,*** 67%14%1 25%1318110100 Nursing RN
149 110 74% 93 30 0 111 8462% $10,030 76%20%65 59%1420020203 Early Childhood Education Associate Degree
**** 5 56% 3 5 0 7 733% $**,*** 100%56%4 80%1506040102 Business Administration
11 7 64% 5 5 0 7 745% $**,*** 100%45%5 71%1507030500 Computer Programming and Analysis
**** 1 25% 0 1 0 2 10% $**,*** 50%25%0 0%1722010300 Paralegal (Legal Assisting)
14 10 71% 10 2 0 10 971% $8,846 90%14%9 90%1736019901 Recreation Technology
**** 3 100% 3 1 0 3 2100% $**,*** 67%33%2 67%
Total Freq.Found Employed Employed Full Qtr. Full Qtr.
Avg. EarningsCont. Ed.
# In MilIdentified Job Rel Current
Placement Rate %
Total"Pool" Count
Total # Training Related
7.00# %# % # % # %
Totals: 197 140 71% 115 58% 61%$9,630 45 23% 0 143 112 78%86
Page 2

FLORIDA COLLEGE SYSTEM VOCATIONAL PROGRAMS AGGREGATED OUTCOME DATA
2011-12 AS DEGREE - COMPLETERSFETPIP FOLLOW-UP OUTCOMES
CURRENT PLACEMENT RATE = Total number training related divided by total "pool" count.
TOTAL FREQ = Total number of individuals reported for follow-up to FETPIP.
# FOUND EMPLOYED = The number of individuals with wages during the 4th qtr of 2012.
% FOUND EMPLOYED = Number found employed divided by total frequency.
# EMPLOYED FULL QTR = Total number of individuals employed and earning at least $3,988 (min. wage ($7.67) x 40 hours per week x 13).
% EMPLOYED FULL QTR = Number found employed full quarter divided by total frequency.
# IDENTIFIED JOB TRNG REL = Total number of individuals found employed with jobs related to training.
% IDENTIFIED AS JOB REL = Number found employed with jobs related to their training divided by number found employed.
FULL QTR AVG EARNINGS = Average quarterly earnings for those employed full quarter.
# CONT ED = Total number of individuals found enrolled in a post secondary institution.
% CONT ED = Number found continuing education divided by total frequency.
# IN MIL = Number found in military service. (Percent not provided due to small incidence rate)
TOTAL "POOL" COUNT = Total number of individuals found employed, continuing education, or in the military.
TOTAL # TRAINING RELATED = Total number of individuals found with employment related to training (This total may include individuals who are continuing their education or are in the military.)
POLK STATE COLLEGE
1/6/2014 Path/Program - Q:\Eval1112\FCS\AnnualReports\ByCollege\APPR\FCS1112 BY SCHL (APPR).rpt

1514 POLK STATE COLLEGE
PROGRAM Total Freq.Found Employed Employed Full Qtr. Full Qtr.
Avg. EarningsCont. Ed.
# In MilIdentified Job Rel Current
Placement Rate %
Total"Pool" Count
Total # Training Related
21.00# %# %# %# %
1206030100 Financial Services
**** 2 67% 1 3 0 3 333% $**,*** 100%100%1 50%1317020100 Cardiovascular/Cardiopulmonary Technology
14 12 86% 11 2 0 12 1179% $14,930 92%14%11 92%1317020601 Emergency Medical Services
**** 5 83% 4 2 0 5 567% $**,*** 100%33%3 60%1317021200 Diagnostic Medical Sonography Technology
11 7 64% 6 0 0 7 655% $**,*** 86%0%6 86%1317050600 Health Information Management
**** 8 100% 7 2 0 8 688% $**,*** 75%25%4 50%1317080800 Occupational Therapy Assistant
13 12 92% 11 2 0 10 985% $11,966 90%15%9 75%1317081500 Physical Therapist Assistant
15 13 87% 10 0 0 12 867% $11,419 67%0%8 62%1317081800 Respiratory Care
**** 6 100% 5 2 0 6 583% $**,*** 83%33%5 83%1318110100 Nursing RN
132 129 98% 125 58 0 131 12895% $12,796 98%44%125 97%1420020300 Early Childhood Management
25 19 76% 14 15 0 22 2156% $6,376 95%60%16 84%1506040102 Business Administration
**** 3 100% 2 3 0 3 367% $**,*** 100%100%3 100%1507010100 Accounting Technology
**** 3 60% 2 3 0 3 340% $**,*** 100%60%1 33%1507030500 Computer Programming and Analysis
**** 7 78% 3 3 0 7 433% $**,*** 57%33%1 14%
Page 2

1514 POLK STATE COLLEGE
PROGRAM Total Freq.Found Employed Employed Full Qtr. Full Qtr.
Avg. EarningsCont. Ed.
# In MilIdentified Job Rel Current
Placement Rate %
Total"Pool" Count
Total # Training Related
21.00# %# %# %# %
1507060300 Office Administration
**** 5 71% 2 3 0 5 529% $**,*** 100%43%4 80%1606200101 Industrial Management Technology
**** 0 0% 0 1 0 1 10% $**,*** 100%100%0 ***%1610010202 Digital Media/Multimedia Technology
10 7 70% 1 4 0 9 510% $**,*** 56%40%2 29%1615000001 Engineering Technology
**** 2 67% 1 2 0 2 233% $**,*** 100%67%0 0%1615030201 Electrical Distribution Technology
**** 1 100% 1 0 0 1 0100% $**,*** 0%0%0 0%1615040200 Computer Engineering Technology
17 10 59% 6 8 0 13 1235% $**,*** 92%47%5 50%1743010300 Criminal Justice Technology
24 15 63% 13 15 0 20 1754% $9,016 85%63%6 40%1743020100 Fire Science Technology (feshe Model)
**** 1 100% 1 0 0 1 1100% $**,*** 100%0%1 100%
Total Freq.Found Employed Employed Full Qtr. Full Qtr.
Avg. EarningsCont. Ed.
# In MilIdentified Job Rel Current
Placement Rate %
Total"Pool" Count
Total # Training Related
21.00# %# % # % # %
Totals: 314 267 85% 226 72% 79%$11,703 128 41% 0 281 255 91%211
Page 3

FLORIDA COLLEGE SYSTEM VOCATIONAL PROGRAMS AGGREGATED OUTCOME DATA
2011-12 AS DEGREE - COMPLETERSFETPIP FOLLOW-UP OUTCOMES
CURRENT PLACEMENT RATE = Total number training related divided by total "pool" count.
TOTAL FREQ = Total number of individuals reported for follow-up to FETPIP.
# FOUND EMPLOYED = The number of individuals with wages during the 4th qtr of 2012.
% FOUND EMPLOYED = Number found employed divided by total frequency.
# EMPLOYED FULL QTR = Total number of individuals employed and earning at least $3,988 (min. wage ($7.67) x 40 hours per week x 13).
% EMPLOYED FULL QTR = Number found employed full quarter divided by total frequency.
# IDENTIFIED JOB TRNG REL = Total number of individuals found employed with jobs related to training.
% IDENTIFIED AS JOB REL = Number found employed with jobs related to their training divided by number found employed.
FULL QTR AVG EARNINGS = Average quarterly earnings for those employed full quarter.
# CONT ED = Total number of individuals found enrolled in a post secondary institution.
% CONT ED = Number found continuing education divided by total frequency.
# IN MIL = Number found in military service. (Percent not provided due to small incidence rate)
TOTAL "POOL" COUNT = Total number of individuals found employed, continuing education, or in the military.
TOTAL # TRAINING RELATED = Total number of individuals found with employment related to training (This total may include individuals who are continuing their education or are in the military.)
SANTA FE COLLEGE
1/6/2014 Path/Program - Q:\Eval1112\FCS\AnnualReports\ByCollege\APPR\FCS1112 BY SCHL (APPR).rpt

1519 SANTA FE COLLEGE
PROGRAM Total Freq.Found Employed Employed Full Qtr. Full Qtr.
Avg. EarningsCont. Ed.
# In MilIdentified Job Rel Current
Placement Rate %
Total"Pool" Count
Total # Training Related
22.00# %# %# %# %
1102029900 Zoo Animal Technology
64 39 61% 21 15 0 43 3133% $6,111 72%23%21 54%1317010200 Dental Hygiene
23 19 83% 17 6 0 19 1874% $11,554 95%26%18 95%1317020100 Cardiovascular/Cardiopulmonary Technology
39 35 90% 33 4 0 35 3585% $11,895 100%10%33 94%1317020601 Emergency Medical Services
13 10 77% 8 2 0 8 362% $**,*** 38%15%1 10%1317020800 Nuclear Medicine Technology
14 12 86% 11 4 0 11 979% $12,050 82%29%8 67%1317020900 Radiography
29 24 83% 23 1 0 22 1979% $8,657 86%3%19 79%1317021200 Diagnostic Medical Sonography Technology
**** 2 100% 2 0 0 2 2100% $**,*** 100%0%2 100%1317050600 Health Information Management
13 9 69% 8 6 0 10 762% $**,*** 70%46%3 33%1317081800 Respiratory Care
20 18 90% 17 5 0 19 1985% $11,643 100%25%17 94%1318110100 Nursing RN
132 115 87% 112 38 0 119 11885% $12,156 99%29%111 97%1326061600 Biotechnology Laboratory Technology
13 8 62% 3 9 0 12 1123% $**,*** 92%69%7 88%1420020203 Early Childhood Education Associate Degree
12 9 75% 6 5 0 10 1050% $**,*** 100%42%8 89%1506040102 Business Administration
**** 3 100% 1 1 0 2 133% $**,*** 50%33%0 0%
Page 2

1519 SANTA FE COLLEGE
PROGRAM Total Freq.Found Employed Employed Full Qtr. Full Qtr.
Avg. EarningsCont. Ed.
# In MilIdentified Job Rel Current
Placement Rate %
Total"Pool" Count
Total # Training Related
22.00# %# %# %# %
1507030401 Networking Services Technology
20 15 75% 14 9 0 15 1270% $9,282 80%45%6 40%1507039902 Internet Services Technology
15 13 87% 11 4 0 13 973% $9,332 69%27%6 46%1507060300 Office Administration
**** 1 33% 1 2 0 3 233% $**,*** 67%67%0 0%1610010202 Digital Media/Multimedia Technology
51 29 57% 17 9 0 31 1433% $6,808 45%18%6 21%1615040101 Biomedical Engineering Technology
**** 5 83% 4 0 0 5 367% $**,*** 60%0%3 60%1649010200 Professional Pilot Technology
**** 1 100% 0 1 0 1 10% $**,*** 100%100%0 0%1649010402 Aviation Administration
**** 3 75% 1 2 0 4 325% $**,*** 75%50%2 67%1722010300 Paralegal (Legal Assisting)
**** 5 71% 2 1 0 5 229% $**,*** 40%14%1 20%1743010300 Criminal Justice Technology
**** 3 75% 2 3 0 4 350% $**,*** 75%75%2 67%
Total Freq.Found Employed Employed Full Qtr. Full Qtr.
Avg. EarningsCont. Ed.
# In MilIdentified Job Rel Current
Placement Rate %
Total"Pool" Count
Total # Training Related
22.00# %# % # % # %
Totals: 488 378 77% 314 64% 72%$10,504 127 26% 0 393 332 84%274
Page 3

FLORIDA COLLEGE SYSTEM VOCATIONAL PROGRAMS AGGREGATED OUTCOME DATA
2011-12 AS DEGREE - COMPLETERSFETPIP FOLLOW-UP OUTCOMES
CURRENT PLACEMENT RATE = Total number training related divided by total "pool" count.
TOTAL FREQ = Total number of individuals reported for follow-up to FETPIP.
# FOUND EMPLOYED = The number of individuals with wages during the 4th qtr of 2012.
% FOUND EMPLOYED = Number found employed divided by total frequency.
# EMPLOYED FULL QTR = Total number of individuals employed and earning at least $3,988 (min. wage ($7.67) x 40 hours per week x 13).
% EMPLOYED FULL QTR = Number found employed full quarter divided by total frequency.
# IDENTIFIED JOB TRNG REL = Total number of individuals found employed with jobs related to training.
% IDENTIFIED AS JOB REL = Number found employed with jobs related to their training divided by number found employed.
FULL QTR AVG EARNINGS = Average quarterly earnings for those employed full quarter.
# CONT ED = Total number of individuals found enrolled in a post secondary institution.
% CONT ED = Number found continuing education divided by total frequency.
# IN MIL = Number found in military service. (Percent not provided due to small incidence rate)
TOTAL "POOL" COUNT = Total number of individuals found employed, continuing education, or in the military.
TOTAL # TRAINING RELATED = Total number of individuals found with employment related to training (This total may include individuals who are continuing their education or are in the military.)
SEMINOLE STATE COLLEGE OF FLORIDA
1/6/2014 Path/Program - Q:\Eval1112\FCS\AnnualReports\ByCollege\APPR\FCS1112 BY SCHL (APPR).rpt

1520 SEMINOLE STATE COLLEGE OF FLORIDA
PROGRAM Total Freq.Found Employed Employed Full Qtr. Full Qtr.
Avg. EarningsCont. Ed.
# In MilIdentified Job Rel Current
Placement Rate %
Total"Pool" Count
Total # Training Related
25.00# %# %# %# %
1206140100 Marketing Management
18 11 61% 8 7 0 14 1144% $**,*** 79%39%7 64%1317020601 Emergency Medical Services
30 27 90% 25 16 1 23 1983% $12,085 83%53%8 30%1317050600 Health Information Management
**** 3 60% 3 2 0 4 260% $**,*** 50%40%0 0%1317081500 Physical Therapist Assistant
22 18 82% 18 0 0 16 1582% $10,877 94%0%15 83%1317081800 Respiratory Care
25 21 84% 18 4 0 19 1872% $8,931 95%16%17 81%1318110100 Nursing RN
185 171 92% 163 55 0 170 16788% $12,144 98%30%165 96%1404050100 Interior Design Technology
33 20 61% 14 15 0 25 2042% $8,220 80%45%8 40%1420020203 Early Childhood Education Associate Degree
15 11 73% 6 7 0 11 1040% $**,*** 91%47%7 64%1420020300 Early Childhood Management
**** 5 63% 4 3 0 6 650% $**,*** 100%38%4 80%1506040102 Business Administration
**** 3 43% 3 2 0 3 243% $**,*** 67%29%0 0%1507010100 Accounting Technology
11 7 64% 5 6 0 10 945% $**,*** 90%55%4 57%1507030401 Networking Services Technology
22 13 59% 11 14 0 17 1750% $12,094 100%64%5 38%1507030500 Computer Programming and Analysis
**** 5 56% 3 5 0 5 533% $**,*** 100%56%3 60%
Page 2
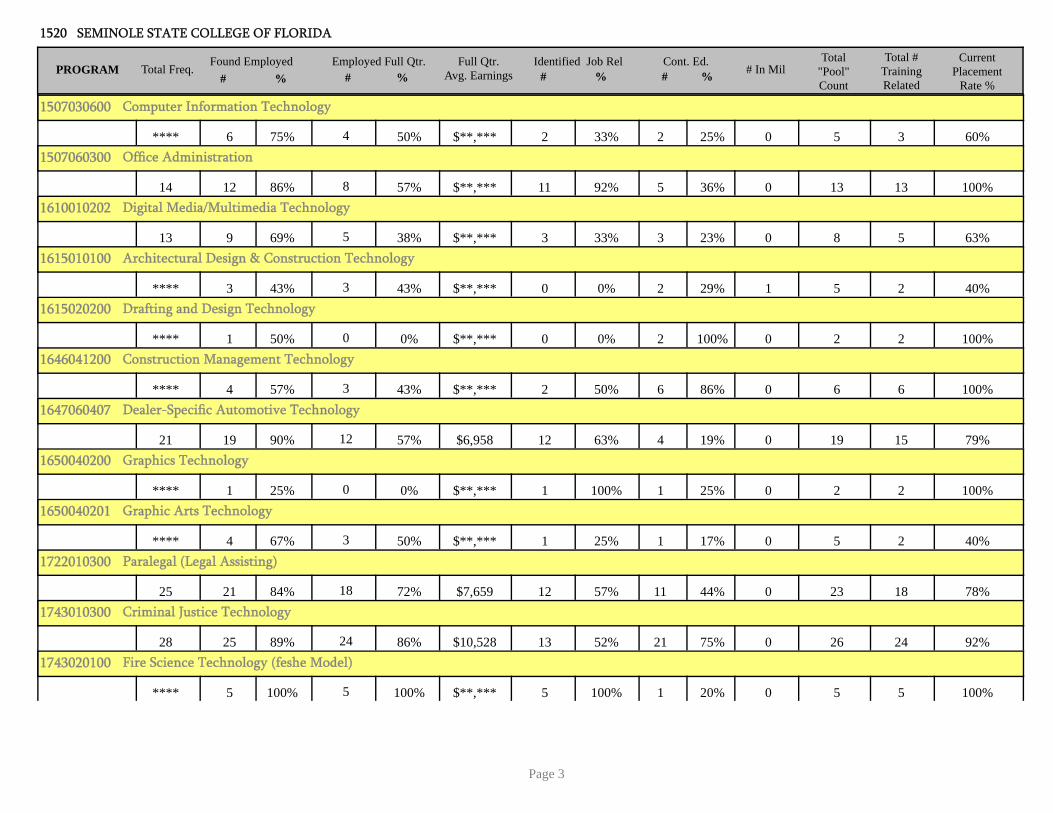
1520 SEMINOLE STATE COLLEGE OF FLORIDA
PROGRAM Total Freq.Found Employed Employed Full Qtr. Full Qtr.
Avg. EarningsCont. Ed.
# In MilIdentified Job Rel Current
Placement Rate %
Total"Pool" Count
Total # Training Related
25.00# %# %# %# %
1507030600 Computer Information Technology
**** 6 75% 4 2 0 5 350% $**,*** 60%25%2 33%1507060300 Office Administration
14 12 86% 8 5 0 13 1357% $**,*** 100%36%11 92%1610010202 Digital Media/Multimedia Technology
13 9 69% 5 3 0 8 538% $**,*** 63%23%3 33%1615010100 Architectural Design & Construction Technology
**** 3 43% 3 2 1 5 243% $**,*** 40%29%0 0%1615020200 Drafting and Design Technology
**** 1 50% 0 2 0 2 20% $**,*** 100%100%0 0%1646041200 Construction Management Technology
**** 4 57% 3 6 0 6 643% $**,*** 100%86%2 50%1647060407 Dealer-Specific Automotive Technology
21 19 90% 12 4 0 19 1557% $6,958 79%19%12 63%1650040200 Graphics Technology
**** 1 25% 0 1 0 2 20% $**,*** 100%25%1 100%1650040201 Graphic Arts Technology
**** 4 67% 3 1 0 5 250% $**,*** 40%17%1 25%1722010300 Paralegal (Legal Assisting)
25 21 84% 18 11 0 23 1872% $7,659 78%44%12 57%1743010300 Criminal Justice Technology
28 25 89% 24 21 0 26 2486% $10,528 92%75%13 52%1743020100 Fire Science Technology (feshe Model)
**** 5 100% 5 1 0 5 5100% $**,*** 100%20%5 100%
Page 3

1520 SEMINOLE STATE COLLEGE OF FLORIDA
Total Freq.Found Employed Employed Full Qtr. Full Qtr.
Avg. EarningsCont. Ed.
# In MilIdentified Job Rel Current
Placement Rate %
Total"Pool" Count
Total # Training Related
25.00# %# %# %# %
Totals: 530 425 80% 366 69% 72%$10,931 195 37% 2 442 398 90%305
Page 4

FLORIDA COLLEGE SYSTEM VOCATIONAL PROGRAMS AGGREGATED OUTCOME DATA
2011-12 AS DEGREE - COMPLETERSFETPIP FOLLOW-UP OUTCOMES
CURRENT PLACEMENT RATE = Total number training related divided by total "pool" count.
TOTAL FREQ = Total number of individuals reported for follow-up to FETPIP.
# FOUND EMPLOYED = The number of individuals with wages during the 4th qtr of 2012.
% FOUND EMPLOYED = Number found employed divided by total frequency.
# EMPLOYED FULL QTR = Total number of individuals employed and earning at least $3,988 (min. wage ($7.67) x 40 hours per week x 13).
% EMPLOYED FULL QTR = Number found employed full quarter divided by total frequency.
# IDENTIFIED JOB TRNG REL = Total number of individuals found employed with jobs related to training.
% IDENTIFIED AS JOB REL = Number found employed with jobs related to their training divided by number found employed.
FULL QTR AVG EARNINGS = Average quarterly earnings for those employed full quarter.
# CONT ED = Total number of individuals found enrolled in a post secondary institution.
% CONT ED = Number found continuing education divided by total frequency.
# IN MIL = Number found in military service. (Percent not provided due to small incidence rate)
TOTAL "POOL" COUNT = Total number of individuals found employed, continuing education, or in the military.
TOTAL # TRAINING RELATED = Total number of individuals found with employment related to training (This total may include individuals who are continuing their education or are in the military.)
SOUTH FLORIDA STATE COLLEGE
1/6/2014 Path/Program - Q:\Eval1112\FCS\AnnualReports\ByCollege\APPR\FCS1112 BY SCHL (APPR).rpt

1522 SOUTH FLORIDA STATE COLLEGE
PROGRAM Total Freq.Found Employed Employed Full Qtr. Full Qtr.
Avg. EarningsCont. Ed.
# In MilIdentified Job Rel Current
Placement Rate %
Total"Pool" Count
Total # Training Related
3.00# %# %# %# %
1318110100 Nursing RN
10 10 100% 10 7 0 10 10100% $12,953 100%70%10 100%1507030500 Computer Programming and Analysis
**** 0 0% 0 1 0 1 10% $**,*** 100%100%0 ***%1743010300 Criminal Justice Technology
**** 4 80% 4 3 0 4 380% $**,*** 75%60%2 50%
Total Freq.Found Employed Employed Full Qtr. Full Qtr.
Avg. EarningsCont. Ed.
# In MilIdentified Job Rel Current
Placement Rate %
Total"Pool" Count
Total # Training Related
3.00# %# % # % # %
Totals: 16 14 88% 14 88% 86%$12,680 11 69% 0 15 14 93%12
Page 2

FLORIDA COLLEGE SYSTEM VOCATIONAL PROGRAMS AGGREGATED OUTCOME DATA
2011-12 AS DEGREE - COMPLETERSFETPIP FOLLOW-UP OUTCOMES
CURRENT PLACEMENT RATE = Total number training related divided by total "pool" count.
TOTAL FREQ = Total number of individuals reported for follow-up to FETPIP.
# FOUND EMPLOYED = The number of individuals with wages during the 4th qtr of 2012.
% FOUND EMPLOYED = Number found employed divided by total frequency.
# EMPLOYED FULL QTR = Total number of individuals employed and earning at least $3,988 (min. wage ($7.67) x 40 hours per week x 13).
% EMPLOYED FULL QTR = Number found employed full quarter divided by total frequency.
# IDENTIFIED JOB TRNG REL = Total number of individuals found employed with jobs related to training.
% IDENTIFIED AS JOB REL = Number found employed with jobs related to their training divided by number found employed.
FULL QTR AVG EARNINGS = Average quarterly earnings for those employed full quarter.
# CONT ED = Total number of individuals found enrolled in a post secondary institution.
% CONT ED = Number found continuing education divided by total frequency.
# IN MIL = Number found in military service. (Percent not provided due to small incidence rate)
TOTAL "POOL" COUNT = Total number of individuals found employed, continuing education, or in the military.
TOTAL # TRAINING RELATED = Total number of individuals found with employment related to training (This total may include individuals who are continuing their education or are in the military.)
ST. JOHNS RIVER STATE COLLEGE
1/6/2014 Path/Program - Q:\Eval1112\FCS\AnnualReports\ByCollege\APPR\FCS1112 BY SCHL (APPR).rpt

1523 ST. JOHNS RIVER STATE COLLEGE
PROGRAM Total Freq.Found Employed Employed Full Qtr. Full Qtr.
Avg. EarningsCont. Ed.
# In MilIdentified Job Rel Current
Placement Rate %
Total"Pool" Count
Total # Training Related
20.00# %# %# %# %
1206030100 Financial Services
**** 1 100% 1 1 0 1 1100% $**,*** 100%100%1 100%1317020601 Emergency Medical Services
**** 5 83% 5 4 0 4 483% $**,*** 100%67%2 40%1317020900 Radiography
21 17 81% 14 8 0 19 1767% $9,114 89%38%12 71%1317050600 Health Information Management
12 8 67% 7 4 0 9 958% $**,*** 100%33%6 75%1317081800 Respiratory Care
16 13 81% 12 1 0 13 1375% $11,869 100%6%13 100%1318070100 Health Services Management
**** 1 25% 1 3 0 3 325% $**,*** 100%75%1 100%1318110100 Nursing RN
70 64 91% 60 14 0 65 6586% $13,086 100%20%63 98%1506040102 Business Administration
**** 5 83% 4 1 0 3 267% $**,*** 67%17%1 20%1507010100 Accounting Technology
**** 4 80% 2 3 0 4 340% $**,*** 75%60%2 50%1507030401 Networking Services Technology
**** 3 60% 1 0 0 1 120% $**,*** 100%0%1 33%1507030500 Computer Programming and Analysis
**** 4 80% 4 1 0 4 280% $**,*** 50%20%1 25%1507030600 Computer Information Technology
**** 1 25% 1 1 0 2 225% $**,*** 100%25%1 100%1507060300 Office Administration
**** 1 33% 0 1 0 2 20% $**,*** 100%33%1 100%
Page 2

1523 ST. JOHNS RIVER STATE COLLEGE
PROGRAM Total Freq.Found Employed Employed Full Qtr. Full Qtr.
Avg. EarningsCont. Ed.
# In MilIdentified Job Rel Current
Placement Rate %
Total"Pool" Count
Total # Training Related
20.00# %# %# %# %
1606200101 Industrial Management Technology
**** 2 100% 1 1 0 2 250% $**,*** 100%50%1 50%1615010100 Architectural Design & Construction Technology
**** 2 50% 2 0 0 1 150% $**,*** 100%0%1 50%1615040200 Computer Engineering Technology
**** 1 100% 1 0 0 1 0100% $**,*** 0%0%0 0%1650040200 Graphics Technology
**** 5 71% 0 2 0 5 40% $**,*** 80%29%2 40%1650999901 Theater and Entertainment Technology
14 4 29% 1 9 0 9 97% $**,*** 100%64%0 0%1743010300 Criminal Justice Technology
**** 3 100% 3 2 0 3 2100% $**,*** 67%67%1 33%1743020100 Fire Science Technology (feshe Model)
**** 1 33% 1 2 0 2 233% $**,*** 100%67%1 100%
Total Freq.Found Employed Employed Full Qtr. Full Qtr.
Avg. EarningsCont. Ed.
# In MilIdentified Job Rel Current
Placement Rate %
Total"Pool" Count
Total # Training Related
20.00# %# % # % # %
Totals: 192 145 76% 121 63% 77%$11,226 58 30% 0 153 144 94%111
Page 3

FLORIDA COLLEGE SYSTEM VOCATIONAL PROGRAMS AGGREGATED OUTCOME DATA
2011-12 AS DEGREE - COMPLETERSFETPIP FOLLOW-UP OUTCOMES
CURRENT PLACEMENT RATE = Total number training related divided by total "pool" count.
TOTAL FREQ = Total number of individuals reported for follow-up to FETPIP.
# FOUND EMPLOYED = The number of individuals with wages during the 4th qtr of 2012.
% FOUND EMPLOYED = Number found employed divided by total frequency.
# EMPLOYED FULL QTR = Total number of individuals employed and earning at least $3,988 (min. wage ($7.67) x 40 hours per week x 13).
% EMPLOYED FULL QTR = Number found employed full quarter divided by total frequency.
# IDENTIFIED JOB TRNG REL = Total number of individuals found employed with jobs related to training.
% IDENTIFIED AS JOB REL = Number found employed with jobs related to their training divided by number found employed.
FULL QTR AVG EARNINGS = Average quarterly earnings for those employed full quarter.
# CONT ED = Total number of individuals found enrolled in a post secondary institution.
% CONT ED = Number found continuing education divided by total frequency.
# IN MIL = Number found in military service. (Percent not provided due to small incidence rate)
TOTAL "POOL" COUNT = Total number of individuals found employed, continuing education, or in the military.
TOTAL # TRAINING RELATED = Total number of individuals found with employment related to training (This total may include individuals who are continuing their education or are in the military.)
ST. PETERSBURG COLLEGE
1/6/2014 Path/Program - Q:\Eval1112\FCS\AnnualReports\ByCollege\APPR\FCS1112 BY SCHL (APPR).rpt

1528 ST. PETERSBURG COLLEGE
PROGRAM Total Freq.Found Employed Employed Full Qtr. Full Qtr.
Avg. EarningsCont. Ed.
# In MilIdentified Job Rel Current
Placement Rate %
Total"Pool" Count
Total # Training Related
37.00# %# %# %# %
1206079900 Hospitality & Tourism Management
12 10 83% 6 7 0 8 850% $**,*** 100%58%5 50%1312030100 Funeral Services
16 13 81% 13 1 0 11 981% $8,928 82%6%9 69%1317010200 Dental Hygiene
30 21 70% 18 12 5 27 2560% $9,362 93%40%17 81%1317020601 Emergency Medical Services
11 10 91% 8 9 0 10 973% $**,*** 90%82%5 50%1317020900 Radiography
17 15 88% 14 2 0 14 1482% $9,116 100%12%12 80%1317030900 Medical Laboratory Technology
15 11 73% 8 1 0 11 1053% $**,*** 91%7%10 91%1317040600 Human Services - Addiction Studies-Generalist
27 20 74% 14 20 0 25 2352% $6,865 92%74%11 55%1317050600 Health Information Management
30 20 67% 18 10 0 21 1760% $8,604 81%33%11 55%1317051200 Veterinary Technology
75 61 81% 48 15 0 58 5464% $6,620 93%20%48 79%1317081500 Physical Therapist Assistant
24 20 83% 17 9 0 19 1871% $10,414 95%38%16 80%1317081800 Respiratory Care
15 13 87% 12 4 0 13 1280% $13,131 92%27%11 85%1318110100 Nursing RN
344 320 93% 305 160 1 322 31889% $12,636 99%47%296 93%1420020203 Early Childhood Education Associate Degree
22 15 68% 12 8 0 13 1355% $6,996 100%36%8 53%
Page 2

1528 ST. PETERSBURG COLLEGE
PROGRAM Total Freq.Found Employed Employed Full Qtr. Full Qtr.
Avg. EarningsCont. Ed.
# In MilIdentified Job Rel Current
Placement Rate %
Total"Pool" Count
Total # Training Related
37.00# %# %# %# %
1506040102 Business Administration
19 14 74% 12 13 0 17 1563% $7,529 88%68%7 50%1506120106 IT Security
18 13 72% 12 12 0 18 1767% $9,034 94%67%9 69%1506120107 Technology Project Management
17 12 71% 10 11 0 15 1259% $12,359 80%65%3 25%1507010100 Accounting Technology
12 6 50% 6 3 0 6 550% $**,*** 83%25%4 67%1507030401 Networking Services Technology
31 22 71% 19 18 1 25 2061% $11,720 80%58%8 36%1507030500 Computer Programming and Analysis
12 9 75% 9 6 0 11 975% $**,*** 82%50%6 67%1507030600 Computer Information Technology
**** 0 0% 0 0 0 0 00% $**,*** ***%0%0 ***%1507039902 Internet Services Technology
**** 5 83% 2 2 0 5 333% $**,*** 60%33%2 40%1610010202 Digital Media/Multimedia Technology
24 14 58% 7 9 0 14 1029% $**,*** 71%38%3 21%1610010300 Photographic Technology
**** 1 50% 0 2 0 2 20% $**,*** 100%100%0 0%1615000001 Engineering Technology
10 8 80% 8 2 1 9 880% $**,*** 89%20%6 75%1615010100 Architectural Design & Construction Technology
17 11 65% 9 7 0 14 953% $**,*** 64%41%3 27%1615020200 Drafting and Design Technology
**** 2 50% 2 1 0 2 250% $**,*** 100%25%1 50%
Page 3

1528 ST. PETERSBURG COLLEGE
PROGRAM Total Freq.Found Employed Employed Full Qtr. Full Qtr.
Avg. EarningsCont. Ed.
# In MilIdentified Job Rel Current
Placement Rate %
Total"Pool" Count
Total # Training Related
37.00# %# %# %# %
1649010401 Aviation Maintenance Management
**** 4 50% 1 3 0 5 413% $**,*** 80%38%2 50%1650040200 Graphics Technology
**** 2 100% 1 1 0 2 250% $**,*** 100%50%1 50%1650099900 Music Production Technology
10 7 70% 3 3 0 9 530% $**,*** 56%30%2 29%1713100301 Sign Language Interpretation
10 6 60% 5 6 0 10 650% $**,*** 60%60%0 0%1715059901 Environmental Science Technology
**** 1 100% 1 0 0 1 0100% $**,*** 0%0%0 0%1722010300 Paralegal (Legal Assisting)
27 18 67% 14 19 0 23 2152% $7,953 91%70%10 56%1731010100 Parks and Leisure Services Technology
**** 1 33% 1 1 0 1 133% $**,*** 100%33%0 0%1743010300 Criminal Justice Technology
21 14 67% 11 13 1 19 1852% $8,936 95%62%7 50%1743010600 Crime Scene Technology
27 16 59% 14 12 2 22 1752% $7,138 77%44%3 19%1743020100 Fire Science Technology (feshe Model)
30 27 90% 26 14 0 27 2687% $17,596 96%47%26 96%1744040102 Emergency Administration and Management
**** 0 0% 0 0 0 0 00% $**,*** ***%0%0 ***%
Total Freq.Found Employed Employed Full Qtr. Full Qtr.
Avg. EarningsCont. Ed.
# In MilIdentified Job Rel Current
Placement Rate %
Total"Pool" Count
Total # Training Related
37.00# %# % # % # %
Totals: 952 762 80% 666 70% 74%$10,891 416 44% 11 809 742 92%562
Page 4

FLORIDA COLLEGE SYSTEM VOCATIONAL PROGRAMS AGGREGATED OUTCOME DATA
2011-12 AS DEGREE - COMPLETERSFETPIP FOLLOW-UP OUTCOMES
CURRENT PLACEMENT RATE = Total number training related divided by total "pool" count.
TOTAL FREQ = Total number of individuals reported for follow-up to FETPIP.
# FOUND EMPLOYED = The number of individuals with wages during the 4th qtr of 2012.
% FOUND EMPLOYED = Number found employed divided by total frequency.
# EMPLOYED FULL QTR = Total number of individuals employed and earning at least $3,988 (min. wage ($7.67) x 40 hours per week x 13).
% EMPLOYED FULL QTR = Number found employed full quarter divided by total frequency.
# IDENTIFIED JOB TRNG REL = Total number of individuals found employed with jobs related to training.
% IDENTIFIED AS JOB REL = Number found employed with jobs related to their training divided by number found employed.
FULL QTR AVG EARNINGS = Average quarterly earnings for those employed full quarter.
# CONT ED = Total number of individuals found enrolled in a post secondary institution.
% CONT ED = Number found continuing education divided by total frequency.
# IN MIL = Number found in military service. (Percent not provided due to small incidence rate)
TOTAL "POOL" COUNT = Total number of individuals found employed, continuing education, or in the military.
TOTAL # TRAINING RELATED = Total number of individuals found with employment related to training (This total may include individuals who are continuing their education or are in the military.)
TALLAHASSEE COMMUNITY COLLEGE
1/6/2014 Path/Program - Q:\Eval1112\FCS\AnnualReports\ByCollege\APPR\FCS1112 BY SCHL (APPR).rpt

1533 TALLAHASSEE COMMUNITY COLLEGE
PROGRAM Total Freq.Found Employed Employed Full Qtr. Full Qtr.
Avg. EarningsCont. Ed.
# In MilIdentified Job Rel Current
Placement Rate %
Total"Pool" Count
Total # Training Related
18.00# %# %# %# %
1317010200 Dental Hygiene
23 18 78% 11 2 0 17 1248% $7,830 71%9%10 56%1317020601 Emergency Medical Services
**** 5 100% 5 4 0 4 4100% $**,*** 100%80%2 40%1317020900 Radiography
13 10 77% 8 4 0 11 862% $**,*** 73%31%6 60%1317081800 Respiratory Care
18 13 72% 9 0 0 12 750% $**,*** 58%0%7 54%1318110100 Nursing RN
75 67 89% 66 19 0 68 6888% $11,226 100%25%67 100%1420020203 Early Childhood Education Associate Degree
57 36 63% 28 29 0 43 4149% $6,936 95%51%28 78%1506040102 Business Administration
**** 2 100% 2 2 0 2 2100% $**,*** 100%100%0 0%1507030401 Networking Services Technology
**** 7 88% 5 2 0 7 563% $**,*** 71%25%5 71%1507030500 Computer Programming and Analysis
**** 1 50% 1 1 0 2 250% $**,*** 100%50%1 100%1507030600 Computer Information Technology
**** 1 100% 0 0 0 1 10% $**,*** 100%0%1 100%1507039902 Internet Services Technology
**** 2 40% 1 1 0 3 320% $**,*** 100%20%2 100%1507060300 Office Administration
**** 7 88% 6 3 0 7 775% $**,*** 100%38%7 100%1615020200 Drafting and Design Technology
**** 1 33% 1 1 0 2 133% $**,*** 50%33%0 0%
Page 2
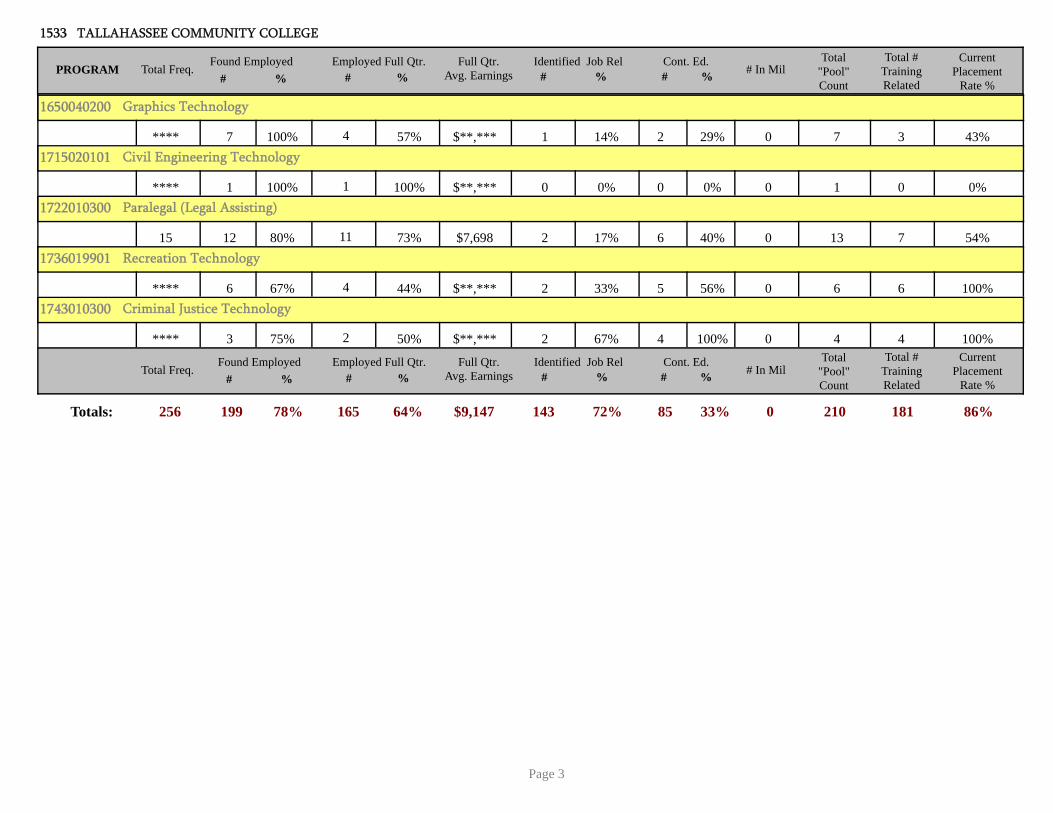
1533 TALLAHASSEE COMMUNITY COLLEGE
PROGRAM Total Freq.Found Employed Employed Full Qtr. Full Qtr.
Avg. EarningsCont. Ed.
# In MilIdentified Job Rel Current
Placement Rate %
Total"Pool" Count
Total # Training Related
18.00# %# %# %# %
1650040200 Graphics Technology
**** 7 100% 4 2 0 7 357% $**,*** 43%29%1 14%1715020101 Civil Engineering Technology
**** 1 100% 1 0 0 1 0100% $**,*** 0%0%0 0%1722010300 Paralegal (Legal Assisting)
15 12 80% 11 6 0 13 773% $7,698 54%40%2 17%1736019901 Recreation Technology
**** 6 67% 4 5 0 6 644% $**,*** 100%56%2 33%1743010300 Criminal Justice Technology
**** 3 75% 2 4 0 4 450% $**,*** 100%100%2 67%
Total Freq.Found Employed Employed Full Qtr. Full Qtr.
Avg. EarningsCont. Ed.
# In MilIdentified Job Rel Current
Placement Rate %
Total"Pool" Count
Total # Training Related
18.00# %# % # % # %
Totals: 256 199 78% 165 64% 72%$9,147 85 33% 0 210 181 86%143
Page 3

FLORIDA COLLEGE SYSTEM VOCATIONAL PROGRAMS AGGREGATED OUTCOME DATA
2011-12 AS DEGREE - COMPLETERSFETPIP FOLLOW-UP OUTCOMES
CURRENT PLACEMENT RATE = Total number training related divided by total "pool" count.
TOTAL FREQ = Total number of individuals reported for follow-up to FETPIP.
# FOUND EMPLOYED = The number of individuals with wages during the 4th qtr of 2012.
% FOUND EMPLOYED = Number found employed divided by total frequency.
# EMPLOYED FULL QTR = Total number of individuals employed and earning at least $3,988 (min. wage ($7.67) x 40 hours per week x 13).
% EMPLOYED FULL QTR = Number found employed full quarter divided by total frequency.
# IDENTIFIED JOB TRNG REL = Total number of individuals found employed with jobs related to training.
% IDENTIFIED AS JOB REL = Number found employed with jobs related to their training divided by number found employed.
FULL QTR AVG EARNINGS = Average quarterly earnings for those employed full quarter.
# CONT ED = Total number of individuals found enrolled in a post secondary institution.
% CONT ED = Number found continuing education divided by total frequency.
# IN MIL = Number found in military service. (Percent not provided due to small incidence rate)
TOTAL "POOL" COUNT = Total number of individuals found employed, continuing education, or in the military.
TOTAL # TRAINING RELATED = Total number of individuals found with employment related to training (This total may include individuals who are continuing their education or are in the military.)
VALENCIA COLLEGE
1/6/2014 Path/Program - Q:\Eval1112\FCS\AnnualReports\ByCollege\APPR\FCS1112 BY SCHL (APPR).rpt

6750 VALENCIA COLLEGE
PROGRAM Total Freq.Found Employed Employed Full Qtr. Full Qtr.
Avg. EarningsCont. Ed.
# In MilIdentified Job Rel Current
Placement Rate %
Total"Pool" Count
Total # Training Related
31.00# %# %# %# %
0092401012 General Transfer Degree - As
**** 3 60% 3 1 0 1 160% $**,*** 100%20%0 0%1101060500 Landscape & Horticulture Technology
**** 2 67% 1 0 0 1 133% $**,*** 100%0%1 50%1206070400 Restaurant Management
**** 3 75% 1 1 0 3 225% $**,*** 67%25%1 33%1206079900 Hospitality & Tourism Management
40 32 80% 26 21 0 32 2965% $6,578 91%53%20 63%1317010200 Dental Hygiene
17 17 100% 16 7 0 14 1494% $11,339 100%41%11 65%1317020100 Cardiovascular/Cardiopulmonary Technology
**** 7 100% 7 4 0 7 7100% $**,*** 100%57%4 57%1317020601 Emergency Medical Services
53 53 100% 49 30 0 41 3892% $12,799 93%57%21 40%1317020900 Radiography
39 35 90% 33 10 0 33 2885% $10,896 85%26%26 74%1317021200 Diagnostic Medical Sonography Technology
10 9 90% 8 2 0 9 980% $**,*** 100%20%9 100%1317081800 Respiratory Care
17 15 88% 14 2 0 15 1482% $11,926 93%12%14 93%1318110100 Nursing RN
274 246 90% 232 98 0 247 23585% $12,394 95%36%221 90%1506040102 Business Administration
113 81 72% 52 68 0 92 8846% $8,515 96%60%56 69%1507010100 Accounting Technology
36 25 69% 17 15 0 27 2147% $7,744 78%42%14 56%
Page 2

6750 VALENCIA COLLEGE
PROGRAM Total Freq.Found Employed Employed Full Qtr. Full Qtr.
Avg. EarningsCont. Ed.
# In MilIdentified Job Rel Current
Placement Rate %
Total"Pool" Count
Total # Training Related
31.00# %# %# %# %
1507030500 Computer Programming and Analysis
43 30 70% 23 25 0 37 3353% $12,714 89%58%16 53%1507030600 Computer Information Technology
53 40 75% 32 23 0 43 3260% $8,121 74%43%14 35%1507060300 Office Administration
111 87 78% 58 26 0 75 6952% $6,589 92%23%55 63%1606200101 Industrial Management Technology
**** 3 75% 1 2 0 3 225% $**,*** 67%50%0 0%1610010200 Film Production Technology
34 20 59% 7 11 0 23 1121% $**,*** 48%32%1 5%1610010202 Digital Media/Multimedia Technology
**** 7 88% 5 2 0 8 663% $**,*** 75%25%4 57%1615020200 Drafting and Design Technology
22 20 91% 16 8 0 20 1373% $8,890 65%36%6 30%1615030301 Electronics Engineering Technology
19 13 68% 12 13 0 16 1663% $9,828 100%68%5 38%1615040200 Computer Engineering Technology
66 53 80% 40 25 1 57 4161% $8,726 72%38%19 36%1615100101 Building Construction Technology
12 7 58% 6 5 0 10 750% $**,*** 70%42%3 43%1620040100 Culinary Management
33 25 76% 15 5 0 26 1645% $7,904 62%15%11 44%1620040201 Baking & Pastry Management
33 25 76% 16 8 0 26 2248% $6,115 85%24%18 72%1650040200 Graphics Technology
54 38 70% 30 5 1 34 1356% $7,504 38%9%9 24%
Page 3

6750 VALENCIA COLLEGE
PROGRAM Total Freq.Found Employed Employed Full Qtr. Full Qtr.
Avg. EarningsCont. Ed.
# In MilIdentified Job Rel Current
Placement Rate %
Total"Pool" Count
Total # Training Related
31.00# %# %# %# %
1650099900 Music Production Technology
35 21 60% 10 10 0 23 1629% $5,712 70%29%6 29%1650999901 Theater and Entertainment Technology
**** 7 78% 5 2 0 7 556% $**,*** 71%22%4 57%1715020101 Civil Engineering Technology
10 5 50% 2 7 0 9 820% $**,*** 89%70%1 20%1722010300 Paralegal (Legal Assisting)
53 42 79% 29 21 0 42 3855% $8,068 90%40%21 50%1743010300 Criminal Justice Technology
91 73 80% 51 57 0 79 5956% $6,863 75%63%13 18%
Total Freq.Found Employed Employed Full Qtr. Full Qtr.
Avg. EarningsCont. Ed.
# In MilIdentified Job Rel Current
Placement Rate %
Total"Pool" Count
Total # Training Related
31.00# %# % # % # %
Totals: 1,308 1,044 80% 817 62% 58%$9,810 514 39% 2 1,060 894 84%604
Page 4

FLORIDA COLLEGE SYSTEM VOCATIONAL PROGRAMS AGGREGATED OUTCOME DATA
2011-12 AS DEGREE - COMPLETERSFETPIP FOLLOW-UP OUTCOMES
CURRENT PLACEMENT RATE = Total number training related divided by total "pool" count.
TOTAL FREQ = Total number of individuals reported for follow-up to FETPIP.
# FOUND EMPLOYED = The number of individuals with wages during the 4th qtr of 2012.
% FOUND EMPLOYED = Number found employed divided by total frequency.
# EMPLOYED FULL QTR = Total number of individuals employed and earning at least $3,988 (min. wage ($7.67) x 40 hours per week x 13).
% EMPLOYED FULL QTR = Number found employed full quarter divided by total frequency.
# IDENTIFIED JOB TRNG REL = Total number of individuals found employed with jobs related to training.
% IDENTIFIED AS JOB REL = Number found employed with jobs related to their training divided by number found employed.
FULL QTR AVG EARNINGS = Average quarterly earnings for those employed full quarter.
# CONT ED = Total number of individuals found enrolled in a post secondary institution.
% CONT ED = Number found continuing education divided by total frequency.
# IN MIL = Number found in military service. (Percent not provided due to small incidence rate)
TOTAL "POOL" COUNT = Total number of individuals found employed, continuing education, or in the military.
TOTAL # TRAINING RELATED = Total number of individuals found with employment related to training (This total may include individuals who are continuing their education or are in the military.)
HILLSBOROUGH COMMUNITY COLLEGE
1/6/2014 Path/Program - Q:\Eval1112\FCS\AnnualReports\ByCollege\APPR\FCS1112 BY SCHL (APPR).rpt

7870 HILLSBOROUGH COMMUNITY COLLEGE
PROGRAM Total Freq.Found Employed Employed Full Qtr. Full Qtr.
Avg. EarningsCont. Ed.
# In MilIdentified Job Rel Current
Placement Rate %
Total"Pool" Count
Total # Training Related
32.00# %# %# %# %
1101030301 Aquaculture Management
**** 2 67% 1 2 0 3 233% $**,*** 67%67%0 0%1206079900 Hospitality & Tourism Management
**** 3 50% 2 2 0 5 333% $**,*** 60%33%1 33%1317010200 Dental Hygiene
12 11 92% 7 4 0 10 1058% $**,*** 100%33%8 73%1317020601 Emergency Medical Services
**** 9 100% 9 5 0 9 8100% $**,*** 89%56%4 44%1317020900 Radiography
20 13 65% 11 2 0 13 1155% $10,914 85%10%11 85%1317020901 Radiation Therapy
16 12 75% 11 2 0 13 1269% $14,754 92%13%10 83%1317021200 Diagnostic Medical Sonography Technology
18 15 83% 15 1 0 15 1383% $11,920 87%6%13 87%1317040600 Human Services - Addiction Studies-Generalist
23 16 70% 10 18 0 21 1943% $6,129 90%78%6 38%1317051200 Veterinary Technology
15 14 93% 11 3 0 13 1273% $6,558 92%20%12 86%1317070100 Optician
13 11 85% 11 1 0 11 985% $9,682 82%8%9 82%1318110100 Nursing RN
329 278 84% 255 99 1 288 26878% $11,663 93%30%246 88%1420020300 Early Childhood Management
14 10 71% 6 5 0 12 1043% $**,*** 83%36%8 80%1420040401 Dietetic Technician
12 9 75% 6 1 0 9 650% $**,*** 67%8%5 56%
Page 2

7870 HILLSBOROUGH COMMUNITY COLLEGE
PROGRAM Total Freq.Found Employed Employed Full Qtr. Full Qtr.
Avg. EarningsCont. Ed.
# In MilIdentified Job Rel Current
Placement Rate %
Total"Pool" Count
Total # Training Related
32.00# %# %# %# %
1506040102 Business Administration
18 12 67% 8 9 0 13 1244% $**,*** 92%50%8 67%1506120106 IT Security
**** 0 0% 0 1 0 1 10% $**,*** 100%100%0 ***%1507030401 Networking Services Technology
11 6 55% 3 7 0 10 727% $**,*** 70%64%1 17%1507030500 Computer Programming and Analysis
**** 4 100% 4 1 0 4 3100% $**,*** 75%25%2 50%1507030600 Computer Information Technology
**** 6 86% 5 3 0 7 571% $**,*** 71%43%2 33%1507030601 Database Technology
**** 2 67% 2 3 0 3 367% $**,*** 100%100%2 100%1507060300 Office Administration
**** 2 100% 0 0 0 1 00% $**,*** 0%0%0 0%1610010202 Digital Media/Multimedia Technology
**** 2 40% 1 2 0 4 320% $**,*** 75%40%1 50%1610010212 Digital Television and Media Production
**** 4 100% 2 2 0 4 350% $**,*** 75%50%2 50%1615000001 Engineering Technology
**** 0 0% 0 1 1 1 10% $**,*** 100%100%0 ***%1615010100 Architectural Design & Construction Technology
**** 2 33% 0 3 0 3 30% $**,*** 100%50%0 0%1615030301 Electronics Engineering Technology
**** 6 67% 5 6 0 9 756% $**,*** 78%67%2 33%1615040200 Computer Engineering Technology
**** 3 75% 3 2 0 4 275% $**,*** 50%50%1 33%
Page 3

7870 HILLSBOROUGH COMMUNITY COLLEGE
PROGRAM Total Freq.Found Employed Employed Full Qtr. Full Qtr.
Avg. EarningsCont. Ed.
# In MilIdentified Job Rel Current
Placement Rate %
Total"Pool" Count
Total # Training Related
32.00# %# %# %# %
1620040100 Culinary Management
**** 2 67% 1 0 0 2 133% $**,*** 50%0%1 50%1713100301 Sign Language Interpretation
**** 1 100% 1 0 0 1 0100% $**,*** 0%0%0 0%1715059901 Environmental Science Technology
**** 5 71% 2 3 0 5 429% $**,*** 80%43%1 20%1722010300 Paralegal (Legal Assisting)
34 26 76% 23 13 0 26 2468% $9,066 92%38%18 69%1743010300 Criminal Justice Technology
92 64 70% 43 56 2 81 6547% $7,746 80%61%12 19%1743020100 Fire Science Technology (feshe Model)
**** 5 71% 5 4 0 7 771% $**,*** 100%57%5 100%
Total Freq.Found Employed Employed Full Qtr. Full Qtr.
Avg. EarningsCont. Ed.
# In MilIdentified Job Rel Current
Placement Rate %
Total"Pool" Count
Total # Training Related
32.00# %# % # % # %
Totals: 709 555 78% 463 65% 70%$10,729 261 37% 4 608 534 88%391
Page 4