flowcharts algo
DESCRIPTION
csiTRANSCRIPT

An algorithm is a step-by-step procedure to solve a given problem to produce desired output”.
It is very close to a computer language. Pseudocode is very similar to everyday
English• An artificial and informal language
that helps programmers develop Program.
Input Output Effectiveness .
• Finiteness• • An algorithm must always terminate
after a finite number of steps• • Definiteness• • Each step of an algorithm must be
precisely defined, Clear •
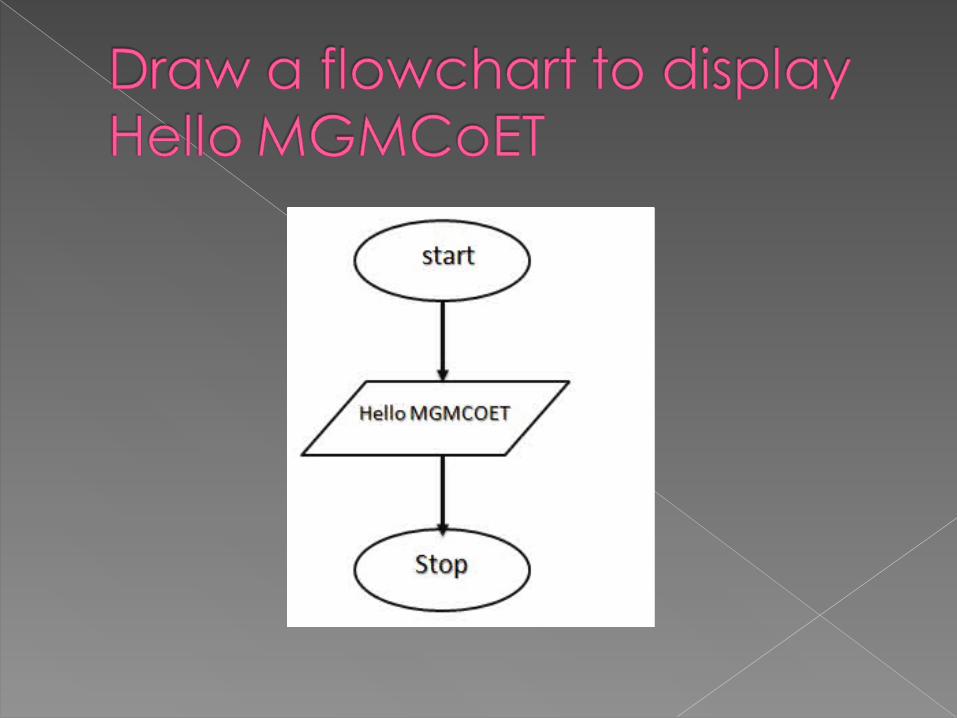
Step 1: BEGIN Step 2: DISPLAY “Hello MGMCoET” Step 3: END
Step1: Start Step2: Read\Input the first num1. Step3: Read\input the second num2. Step4: Sum num1+num2 // calculation
of sum Step5: Print Sum Step6: End
Step 1: BEGIN Step 2: ENTER the values of X,Y and Z Step 3: Sum= X+Y+Z, Average
=Sum/3 and Product= X*Y*Z Step 4: DISPLAY the Sum, Average and
the Product Step 5: END
Algorithm: Step1: Read\input the Radius r of the
Circle Step2: Area PI*r*r // calculation of area Step3: Print Area
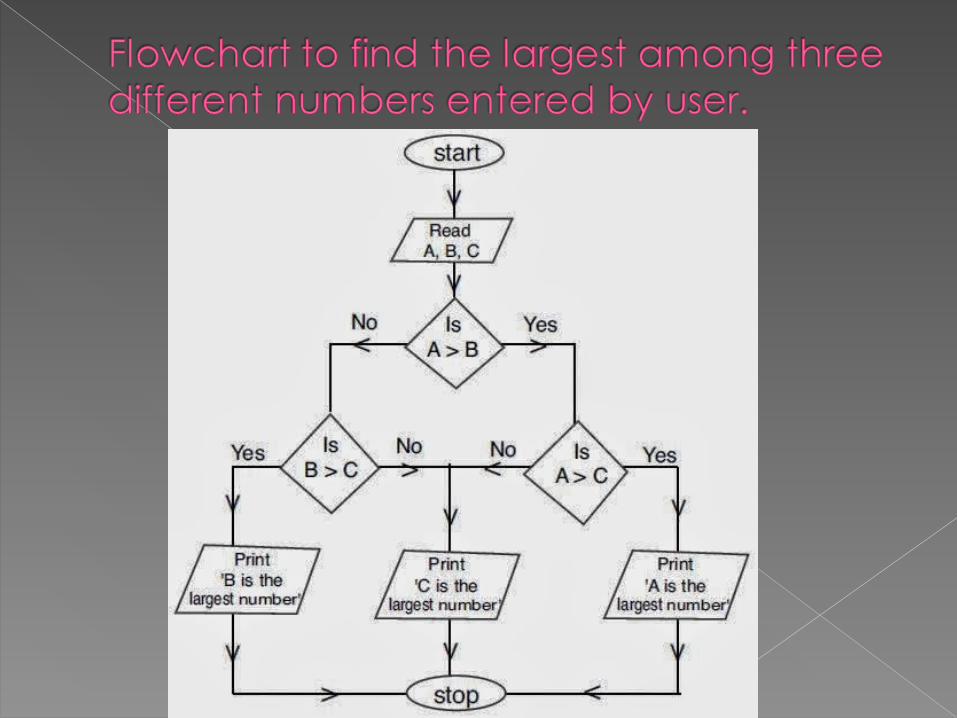
• Step 1: BEGIN • Step 2: ENTER value of A, B and C.• Step 3: If A is greater than C• Display A is the largest number• Else If B is greater than C• Display B is the largest number.• Else• Display C is the greatest number. • Step 5: END
Step 1: Input M1,M2,M3,M4Step 2: GRADE
(M1+M2+M3+M4)/4 Step 3: if (GRADE < 50) then
Print “FAIL” else
Print “PASS”endif
Write an Algorithm and Draw a flowchart to test whether a given number is odd or even.
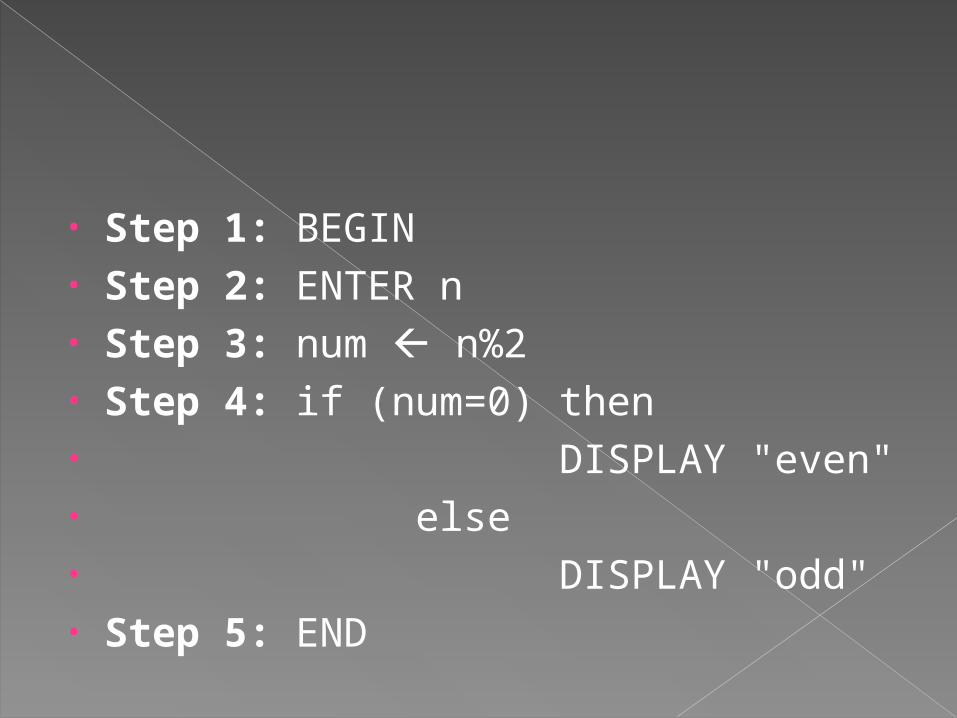
• Step 1: BEGIN • Step 2: ENTER n• Step 3: num n%2• Step 4: if (num=0) then • DISPLAY "even"• else• DISPLAY "odd"• Step 5: END
Write down an Algorithm and draw a flowchart to calculate weather a given year is a leap Year or Not.
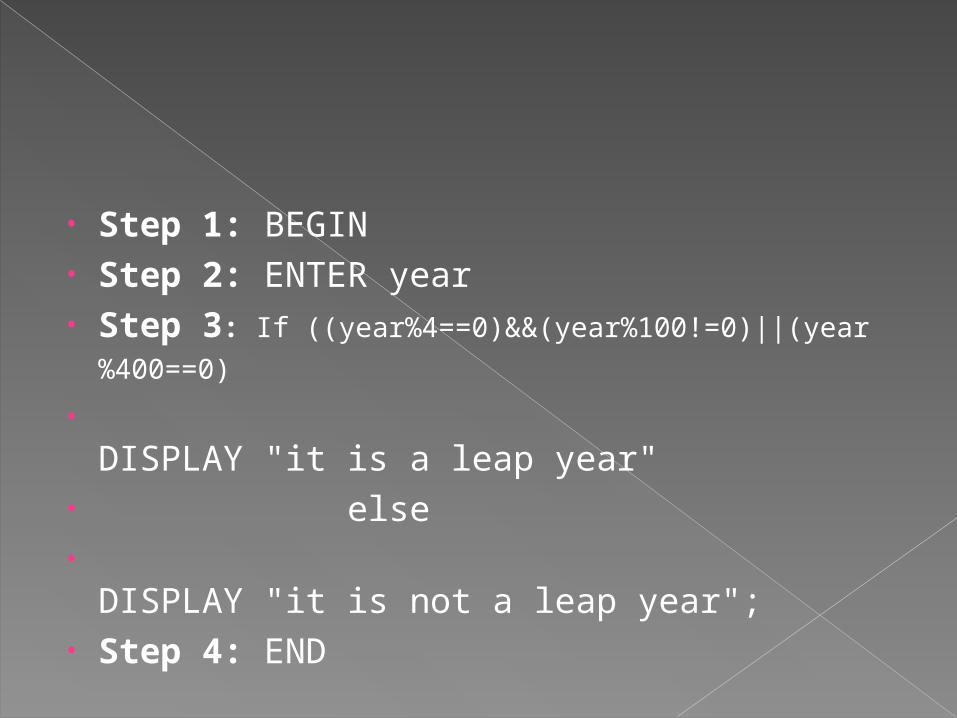
• Step 1: BEGIN • Step 2: ENTER year• Step 3: If ((year%4==0)&&(year%100!=0)||
(year%400==0) • DISPLAY "it is a leap year" • else •
DISPLAY "it is not a leap year";• Step 4: END
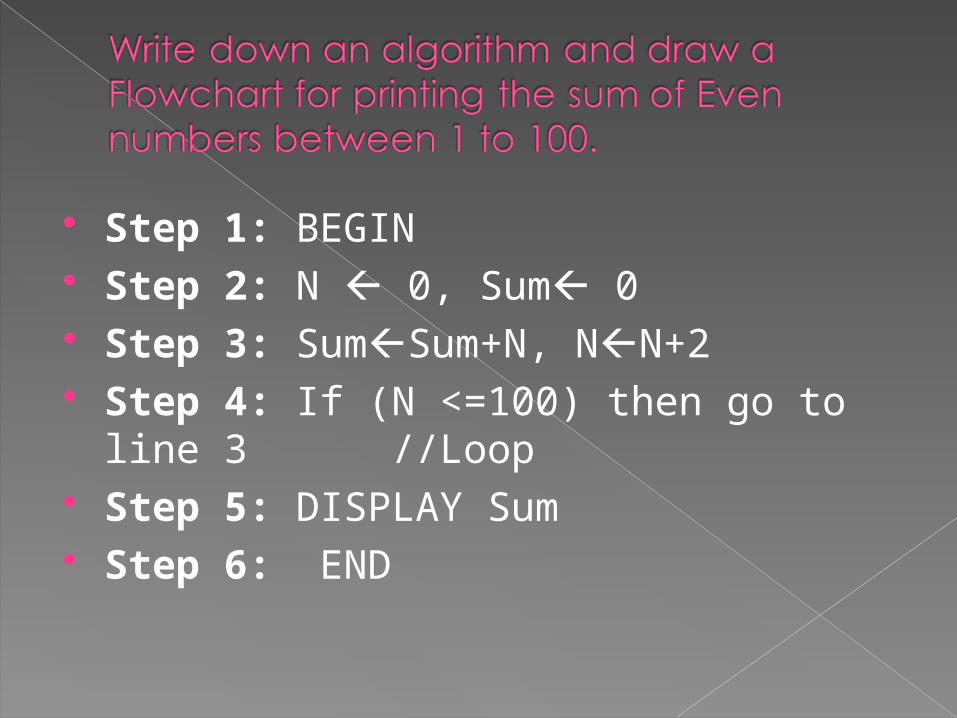
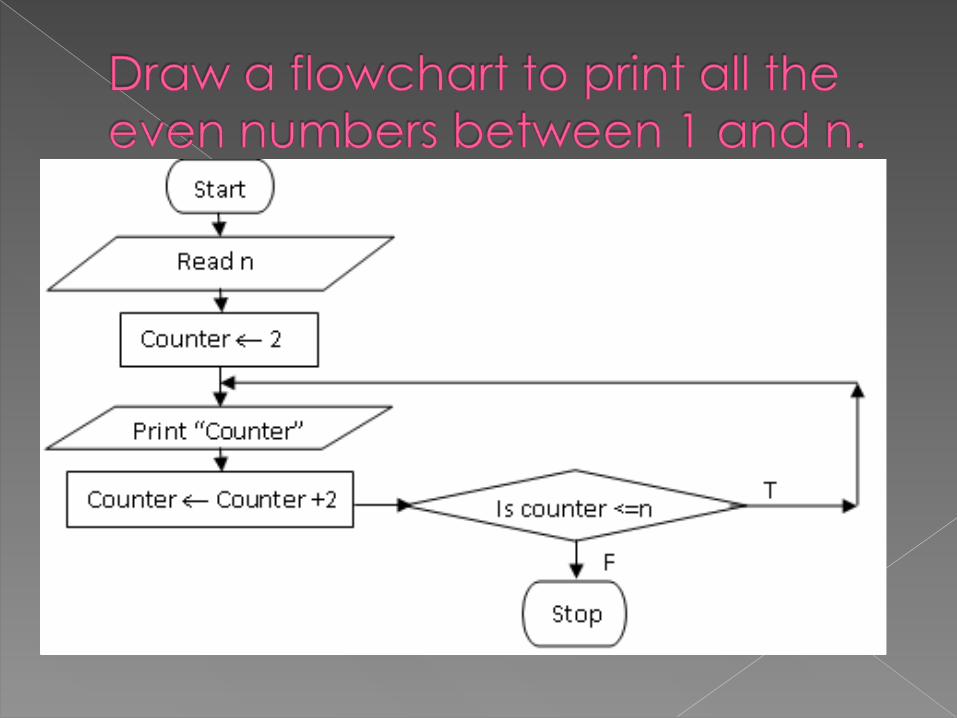
Step 1: BEGIN Step 2: N 0, Sum 0 Step 3: SumSum+N, NN+2 Step 4: If (N <=100) then go to line 3
//Loop Step 5: DISPLAY Sum Step 6: END
It is simple to understand step by step solution of a problem.
It is easy to debug i.e errors can be easily pointed out.
It is Independent of Programming Language.
It is Compatible to computers in the sense that each algo can be easily coded into its equivalent HLL.
A graphical representation of the sequence of operations in an algorithm. A Flowchart depicts all the activities in a process, from beginning to end. You can use a Transactional Flowchart to:
• Provide a pictorial representation of each activity in a process
• Show the sequence of tasks for each activity
• Show the flow of inputs and outputs for each task in a process
• Analyze the relationship of tasks involved in each activity
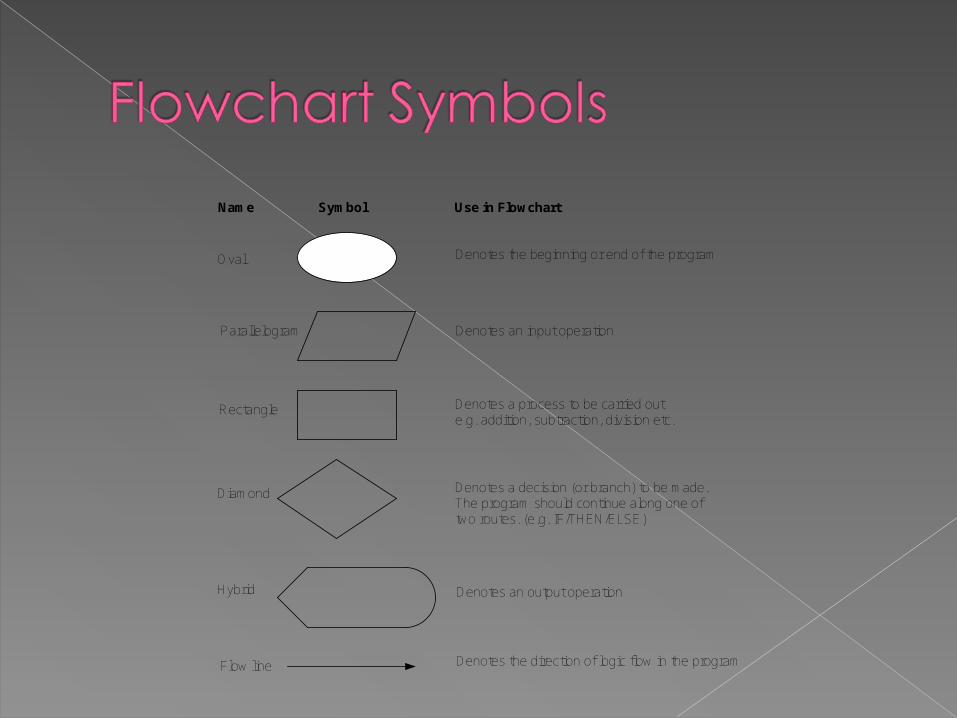
Oval
Parallelogram
Rectangle
Diamond
Hybrid
Name Symbol Use in Flowchart
Denotes the beginning or end of the program
Denotes an input operation
Denotes an output operation
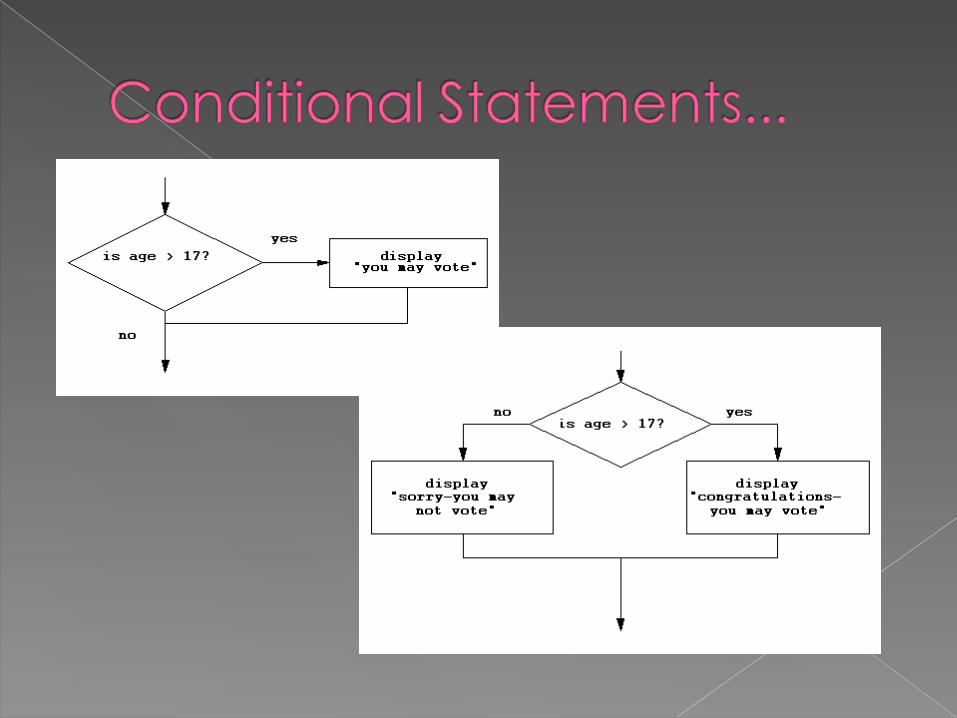
Denotes a decision (or branch) to be made. The program should continue along one of two routes. (e.g. IF/THEN/ELSE)
Denotes a process to be carried oute.g. addition, subtraction, division etc.
Flow line Denotes the direction of logic flow in the program

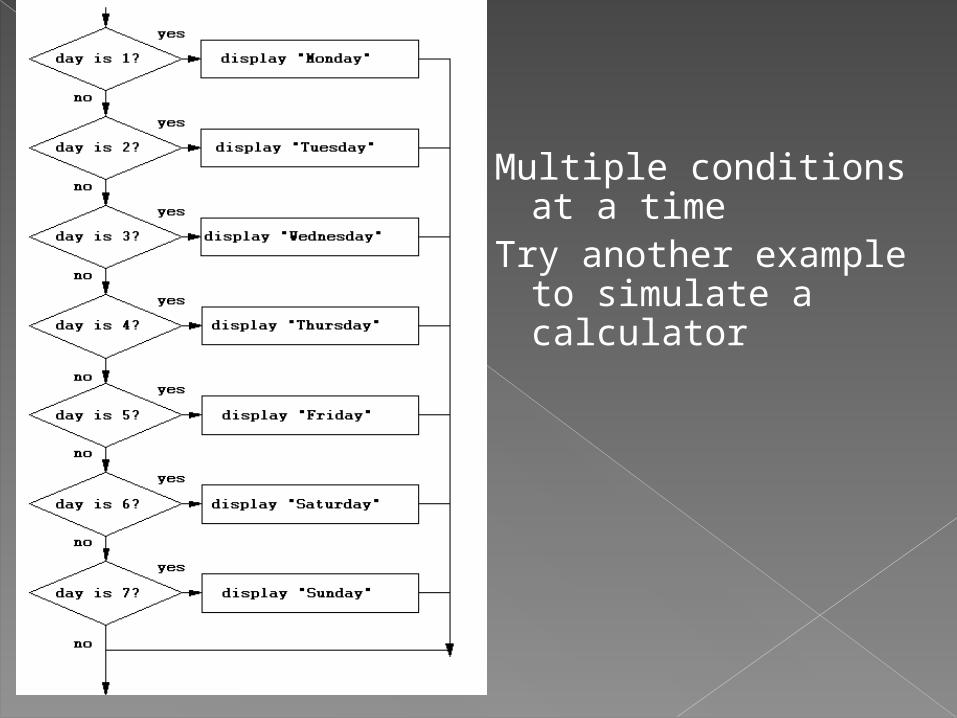
Multiple conditions at a time
Try another example to simulate a calculator