flowmonitor --- a network monitoring framework for the...
TRANSCRIPT

Introduction The FlowMonitor NS-3 module Example Validation and Results Conclusions
FlowMonitor — a network monitoringframework for the Network Simulator 3
(NS-3)
Gustavo Carneiro Pedro Fortuna Manuel Ricardo
INESC Porto — Unidade de Telecomunicacoes e MultimediaFaculdade de Engenharia da Universidade do Porto
2009-10-19 / NSTools 2009

Introduction The FlowMonitor NS-3 module Example Validation and Results Conclusions
Outline1 Introduction
Network MonitoringSimulation OverviewNS-3
2 The FlowMonitor NS-3 moduleRequirementsArchitectureFlow Data Structures
Basic Metrics3 Example4 Validation and Results
ValidationPerformance Results
5 ConclusionsConclusionsFuture Work

Introduction The FlowMonitor NS-3 module Example Validation and Results Conclusions
Network Monitoring
Traditional network monitoring issues:strategy: passive (just measures) or active (injects traffic
to be measured)In simulation, the researcher is already injectingflows, we just need to measure them
monitoring points: not every network element can beeasily monitored (lack of SNMP)
In simulation, every node is monitorablemonitoring duration: must be large enough to enable the
gathering of statistically sound resultsIn simulation, this can be easily controlled
synchronization: events to monitor must be orderedamong a set of nodes
Usually a time stamp in messages is requiredProblem: synchronizing the clocksIn simulation, the clocks are always synchronized
transparency: monitoring control traffic affects resultsIn simulation, monitoring data is reported viamethod calls, not packets

Introduction The FlowMonitor NS-3 module Example Validation and Results Conclusions
Simulation Overview
Writing simulations is a complex taskWrite a modelDefine a topologyAdd flowsDebug...Measure the flows (tracing plus pre-processing)Write the flow statistics to a file for post-processing
Significant portion of time dedicated to write code tomeasure flows and collect statisticsSolution: “Flow Monitor” for NS-3
Just a few lines of codeMeasures all flows in the simulation, no questions askedProvides flow statistics as
1 Simple in-memory data structures2 Serialized to an XML file

Introduction The FlowMonitor NS-3 module Example Validation and Results Conclusions
NS-3
node
simulator
core
common
mobility
Devices:csma | wifi | ...
Internet-stack(ipv4 impl.)
Routing:olsr,global-routing
helper
core base runtime system:attributes, tracing, smartpointers, callbacks
common packets, buffers, andpacket headers
simulator event scheduler,high precision time class
node network simulatorfundamentals: Node,NetDevice, addresses
mobility mobility models(describe the trajectoryof a node)
olsr the OLSR routingprotocol (adhoc)
global-routing “GOD” routinginternet-stack
UDP/TCP/IPv4/6implementation
csma, wifi, etc. actualimplementations of theNetDevice class
helper a “facade” that keepsscripting nice and neat

Introduction The FlowMonitor NS-3 module Example Validation and Results Conclusions
Outline1 Introduction
Network MonitoringSimulation OverviewNS-3
2 The FlowMonitor NS-3 moduleRequirementsArchitectureFlow Data Structures
Basic Metrics3 Example4 Validation and Results
ValidationPerformance Results
5 ConclusionsConclusionsFuture Work

Introduction The FlowMonitor NS-3 module Example Validation and Results Conclusions
Requirements
ease of use: It must be easy to useActivate with just a few lines of codeDetect passing flows automaticallyLittle or no configuration required
amount of data to capture: Balanced amount of dataToo much captured data:
Incurs disk I/O bandwidthSlows down simulationsMakes data transfer and manipulation painfully slow
Too little and we may miss something importantOften we do not realize it is important until too late
support python: “fire-and-forget” approach, no callbacksNS-3’s Config::Connect uses callbacks to processper-packet eventsIn Python, per-packet processing is unpractical, waytoo slow

Introduction The FlowMonitor NS-3 module Example Validation and Results Conclusions
Requirements
output data format: must be easy to processCandidates:binary files (e.g. HDF): disk efficient, fast, difficult
to read, difficult to extendASCII traces: verbose, difficult to extend,
potentially slow to readXML files: verbose, easy to extend, slow but easy
to readSQL database: efficient and fast, difficult to read
(table format is hidden away), difficult toextend
Chosen method: XMLRunner up (future work): SQL databaseBesides, in-memory data structures alwaysavailable!

Introduction The FlowMonitor NS-3 module Example Validation and Results Conclusions
Requirements
extensible: allow extension to monitor different kinds of flowsThe concept of “flow” is not set in stoneWe usually mean TCP-or-UDP L4 flows
The five-tuple filter: (source IP, destination IP,protocol, source port, destination port)
Sometimes we want other kinds of flows, e.g.:L2 flows: (source mac, destination mac, ethertype)
The way to detect flows may varyOverlay networksTunnels
minimize overhead: monitoring adds time/memory overhead

Introduction The FlowMonitor NS-3 module Example Validation and Results Conclusions
Architecture

Introduction The FlowMonitor NS-3 module Example Validation and Results Conclusions
Architecture
FlowId: 32-bit identifier of a flowPacketId: 32-bit identifier of a packet within a flowThe class FlowMonitor remains unaware of whether it ismonitoring IPv4, IPv6, or MAC, flows
Only abstract identifiers are used, not packet headersMost of the flow monitoring design, data structures, andcode is reused when extending to monitor different kinds offlows

Introduction The FlowMonitor NS-3 module Example Validation and Results Conclusions
Flow Data Structures

Introduction The FlowMonitor NS-3 module Example Validation and Results Conclusions
Flow Data Structures
Per-probe flow statistics can answer:Which hop accounts for most of the packet losses?Which hop accounts for most of the end-to-end delay?
Introduction The FlowMonitor NS-3 module Example Validation and Results Conclusions
Flow Data Structures
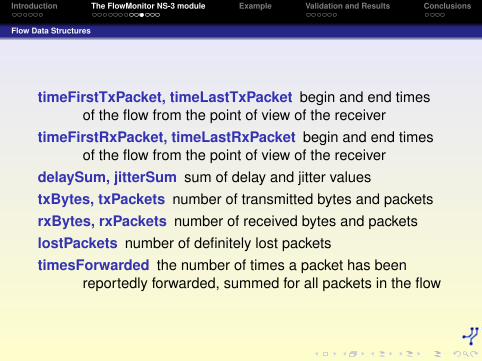
timeFirstTxPacket, timeLastTxPacket begin and end timesof the flow from the point of view of the receiver
timeFirstRxPacket, timeLastRxPacket begin and end timesof the flow from the point of view of the receiver
delaySum, jitterSum sum of delay and jitter valuestxBytes, txPackets number of transmitted bytes and packetsrxBytes, rxPackets number of received bytes and packetslostPackets number of definitely lost packetstimesForwarded the number of times a packet has been
reportedly forwarded, summed for all packets in the flow

Introduction The FlowMonitor NS-3 module Example Validation and Results Conclusions
Flow Data Structures
delayHistogram, jitterHistogram, packetSizeHistogramHistogram versions for the delay, jitter, and packet sizes,respectively
packetsDropped, bytesDropped discriminates the losses bya reason codeDROP NO ROUTE no IPv4 route found for a packetDROP TTL EXPIRE a packet was dropped due to an
IPv4 TTL field decremented and reaching zeroDROP BAD CHECKSUM a packet had a bad IPv4
header checksum and had to be dropped

Introduction The FlowMonitor NS-3 module Example Validation and Results Conclusions
Flow Data Structures
Other metrics can be derived from the basic metrics:mean delay: delay = delaySum
rxPacketsmean jitter: jitter = jitterSum
rxPackets−1
mean transmitted packet size (byte): Stx = txBytestxPackets
mean received packet size (byte): Srx = rxBytesrxPackets
mean transmitted bitrate (bit/s):
Btx =8 · txBytes
timeLastTxPacket − timeFirstTxPacket
mean received bitrate (bit/s):
Brx =8 · rxBytes
timeLastRxPacket − timeFirstRxPacket
mean hop count: hopcount = 1 + timesForwardedrxPackets
packet loss ratio: q = lostPacketsrxPackets+lostPackets

Introduction The FlowMonitor NS-3 module Example Validation and Results Conclusions
Outline1 Introduction
Network MonitoringSimulation OverviewNS-3
2 The FlowMonitor NS-3 moduleRequirementsArchitectureFlow Data Structures
Basic Metrics3 Example4 Validation and Results
ValidationPerformance Results
5 ConclusionsConclusionsFuture Work

Introduction The FlowMonitor NS-3 module Example Validation and Results Conclusions
f lowmon helper = ns3 . FlowMonitorHelper ( )moni tor = f lowmon helper . I n s t a l l A l l ( )moni tor . S e t A t t r i b u t e ( ” DelayBinWidth ” ,
ns3 . DoubleValue ( 0 . 0 0 1 ) )moni tor . S e t A t t r i b u t e ( ” J i t t e r B i n W i d t h ” ,
ns3 . DoubleValue ( 0 . 0 0 1 ) )moni tor . S e t A t t r i b u t e ( ” PacketSizeBinWidth ” ,
ns3 . DoubleValue ( 2 0 ) )
ns3 . S imula tor . Run ( )
moni tor . Se r ia l i zeToXmlF i l e ( ” r e s u l t s . xml ” , True , True )
1 Create a new FlowMonitorHelper object;2 Call the method InstallAll on this object
FlowMonitor is createdIPv4 probes are installed in all nodes
3 Configure some histogram attributes4 Run the simulation, as before, calling ns3.Simulator.Run()5 Finally, write the flow monitored results to a XML file

Introduction The FlowMonitor NS-3 module Example Validation and Results Conclusions
Outline1 Introduction
Network MonitoringSimulation OverviewNS-3
2 The FlowMonitor NS-3 moduleRequirementsArchitectureFlow Data Structures
Basic Metrics3 Example4 Validation and Results
ValidationPerformance Results
5 ConclusionsConclusionsFuture Work

Introduction The FlowMonitor NS-3 module Example Validation and Results Conclusions
Validation
Point-to-point links connecting the nodesLink capacities alternating between 100kbit/s and 50kbit/sMaximum queue size: 100 packetsEvery other nodes sends a 100 kbit/s flow to node twohops awayHalf the packets expected to be lost

Introduction The FlowMonitor NS-3 module Example Validation and Results Conclusions
Validation
C1 = 100000 bit/sS = (512 + 20 + 8 + 2)× 8 = 4336 bit
d1 =SC1
= 0.04336 s
C2 = 50000 bit/s
d2 = 101× SC2
= 8.75872 s
dtotal = d1 + d2 = 8.80208 s
Btx =512 + 20 + 8
512 + 20 + 8 + 2× C1 = 99631.00 bit/s
Brx =512 + 20 + 8
512 + 20 + 8 + 2× C2 = 49815.50 bit/s
Metric Measured Value (95% C. I.) Expected Value Mean ErrorTx. bitrate 99646.06± 2.68× 10⁻⁵ 99631.00 +0.015 %Rx. bitrate 49832.11± 7.83× 10⁻⁵ 49815.50 +0.033 %Delays 8.8005± 8.8× 10⁻⁹ 8.80208 -0.018 %Losses 0.4978± 1.5× 10⁻⁶ 0.5000 -0.44 %
Table: Validation results

Introduction The FlowMonitor NS-3 module Example Validation and Results Conclusions
Performance Results
Run series of simulations, validation scenarioIncreasing the network size between 16 and 1024 nodesMeasure time and memory taken to simulate scenarioCompare three variants:
1 Without collecting any results2 With flow monitoring3 With ascii tracing to a file

Introduction The FlowMonitor NS-3 module Example Validation and Results Conclusions
Performance Results
0 200 400 600 800 1000 1200Number of Nodes
40
45
50
55
60
65
70
75
80
Mem
ory
(M
iB)
BaseFlow MonitorTrace File
0 200 400 600 800 1000 1200Number of Nodes
0
50
100
150
200
250
300
350
Tim
e (
s)
BaseFlow MonitorTrace File
0 200 400 600 800 1000 1200Number of Nodes
0
5
10
15
20
25
30
Mem
ory
Overh
ead (
%)
Flow MonitorTrace File
0 200 400 600 800 1000 1200Number of Nodes
0
100
200
300
400
500
600
700
800
Tim
e O
verh
ead (
%)
Flow MonitorTrace file
Figure: Performance results of the flow monitor

Introduction The FlowMonitor NS-3 module Example Validation and Results Conclusions
Outline1 Introduction
Network MonitoringSimulation OverviewNS-3
2 The FlowMonitor NS-3 moduleRequirementsArchitectureFlow Data Structures
Basic Metrics3 Example4 Validation and Results
ValidationPerformance Results
5 ConclusionsConclusionsFuture Work

Introduction The FlowMonitor NS-3 module Example Validation and Results Conclusions
Conclusions
A common problem was identified“how to easily extract flow metrics from arbitrarysimulations?”
Existing solutions do not solve this problem effectivelyThe Flow Monitor solves the problem
Requires significant less programming time than NS-3callback based tracingA lot more efficient than ascii tracing
Introduction The FlowMonitor NS-3 module Example Validation and Results Conclusions
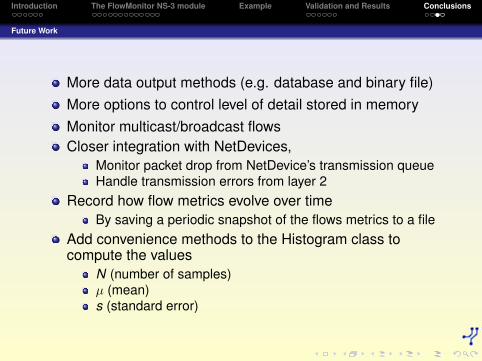
Future Work
More data output methods (e.g. database and binary file)More options to control level of detail stored in memoryMonitor multicast/broadcast flowsCloser integration with NetDevices,
Monitor packet drop from NetDevice’s transmission queueHandle transmission errors from layer 2
Record how flow metrics evolve over timeBy saving a periodic snapshot of the flows metrics to a file
Add convenience methods to the Histogram class tocompute the values
N (number of samples)µ (mean)s (standard error)