fluorescence measurements of the thermal … · phone: 205/880-7481; fax: 205/880-7483 summary...
TRANSCRIPT

N93
FLUORESCENCE MEASUREMENTS OF THE THERMAL CONTROLEXPERIMENTS COATINGS ON LDEF S0069 AND A0114
_, R.J. Mell, P.N. Peters
NASA/Marshall Space Flight CenterHuntsville, AL 35812
Phone: 205/544-2528 Fax: 205/544-0212
J.C. GregoryUniversity of Alabama - Huntsville
Huntsville, AL 35899Phone: 205/895-6028; Fax: 205/895-6349
D.R. Wilkes, E.R. Miller
AZ Technology, Inc.3322 Memorial Parkway SW, Suite 93
Huntsville, AL 35801Phone: 205/880-7481; Fax: 205/880-7483
SUMMARY
Fluorescence measurements have been made on the thermal control coatings from the LDEF S0069,Thermal Control Surfaces Experiment (TCSE); and the A0114, Interaction of Atomic Oxygen with MaterialSurfaces in Low Earth Orbit. Fluorescence was observed in two types of thermal control coatings and isattributed to pigments or binders. In addition, fluorescence measurement on the silver Teflon* from the
front cover of TCSE led to confirmation of damage (cracking) to the metal layers during application.
INTRODUCTION
When the TCSE experiment was inspected upon its return to the laboratory, one technique employedwas the use of an ultraviolet source ("black light") to look for fluorescing contaminants such as cloth fibersand oils or greases. It was obvious, when compared with similar unexposed materials and with samplecontrols, that changes had occurred in the visible fluorescent brightness of the thermal control samples andof the TCSE experiment hardware itself (Figure 1). The fluorescence was so striking in some cases, suchas the black urethane based coating Z302, that it was decided to try to obtain quantitative measurements ofthe changes. The goals were to try to characterize the various types of coatings in terms of their fluorescent
properties and to possibly learn if the observed changes could further elucidate effects of exposure to thespace environment.
Measurement Equipment and Set-ups
Absolute fluorescence measurements were made using the following experiment set up andcalibration procedure.
*Teflon is a trademark of Dupont
1111
https://ntrs.nasa.gov/search.jsp?R=19930019091 2018-11-11T02:10:58+00:00Z

A Beckman DK-2 Spectrophotometer using its 1P28 photo multiplier tube mounted in thespectroradiometric position was used to detect any fluorescent behavior from the samples. Fluorescencewas induced by irradiating the sample, mounted at 45* to the optical beam, in line with the sample entranceport of the spectrophotometer (Figure 2). For these measurements, a one kw mercury-xenon lamp with aSchoeffel monochromator was used. It was found that use of the strong peak of 280 nm was convenient.Overall, the illuminating band was from 265 to 290 nm with the monochromator slits set at 1.5 mm.Measurements of output with this set up using a molectron radiometer indicated an irradiance level of 0.5m2/cm2 at the sample (equivalent to about 1 sun in this band). To provide a calibration of the DK-2spectrophotometer, a one kw quartz-halogen tungsten Standard of Total and Spectral Irradiance (Model200H) supplied by Optronics Laboratories (traceable to Ms'r), was used in place of the Hg-Xe source(Figure 3). A 99% diffuse reflectance standard (from Labsphere, Inc. SRS-99-010-6561A) was placed atthe sample location. Since this non-fluorescing standard provided essentially Lambertian reflectance of aknown irradiance level, a calibration of the DK-2 as a system was made over its sensitive wavelengths(-300-650 nm). For ZnO pigmented coatings, it was also determined that the fluorescent energy isproportional to irradiance, over a factor of 5.5; and that there was no detectable change in fluorescent
wavelength peaks for irradiance bands of 265 to 290 nm. 295 to 320 nm, and 310 to 340 nm. Othercoatings were not tested in this manner, but probably would behave similarly.
Fluorescence Measurements
Two types of thermal control coating samples were found to exhibit rather strong fluorescence.These were: 1) coatings that used urethane as a binder and, 2) coatings that used ZnO as a pigment. Inaddition, there were variations of the above coatings with a thin overcoat of silicone to test the feasibility ofan additional protective layer against the deleterious effects of atomic oxygen (AO) bombardment at orbitalvelocities. Controls for the TCSE experiment were maintained in covered containers in a limited-accesssteel cabinet.
Other TCSE thermal control coatings samples that were measured and found not to have significantfluorescence were Z306 ( a urethane based black pain0, YB71 (silicate), and D111 (silicate). A whiteTedlar* flight sample did not fluoresce, while a laboratory specimen exhibited very weak fluorescencepeaks at about 420 to 440 nm. Also measured, were silver Teflon samples cut from the front cover ofTCSE. Similar materials that were unexposed to the space environment were used for comparison.
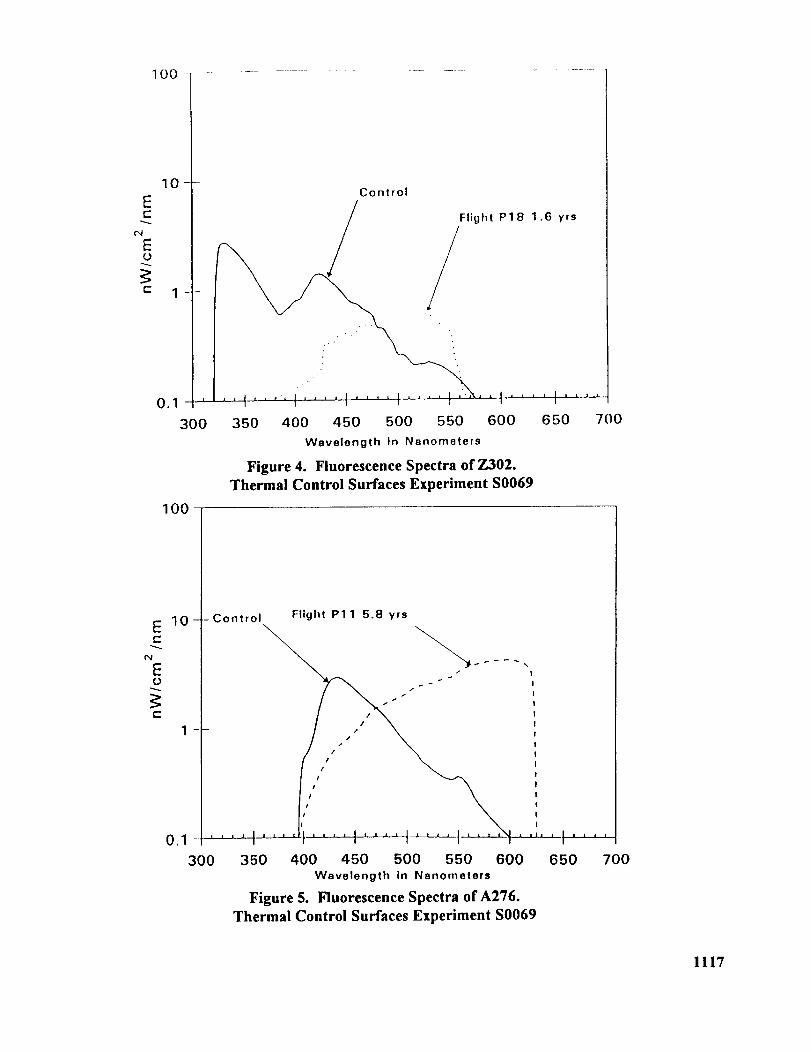
Figures 4 and 5 allow comparison of the flight and control fluorescent spectra of Z302 and A276urethane based coatings. The similarity in the control spectra from 400-575 nm is likely attributable to thefluorescence characteristics of the polyurethane binder. However, the spectra for the flight exposed sample
of Z302 is somewhat unique in that the magnitude and band width of the fluorescence is less than most ofthe other polyurethane samples. This may be due to the erosion of the sample by AO and/or as a naturalfrequency shift of the material caused by exposure to the LEO environment. Fluorescence data is notavailable for Z302, exposed in the RAM direction for 5.8 years, since it was completely eroded.
The similarities shown in the spectra of Z302 and A276 with a 01650 silicone overcoat are even more
striking (Figures 6 and 7). These figures tend to illustrate that the polyurethane samples, both Z302 andA276, overcoated with 01650 and then exposed to the flight environment fluoresce very similar to oneanother. In addition, the similarities between the overcoated and neat A276 polyurethane coatingsfluorescence spectra are shown in Figures 5 and 7. The 01650 overcoated control samples have enhancedultraviolet fluorescence attributable to the overcoat itself. This effect is not present in the flight exposedsamples and, in fact, there is no fluorescence evidence that the overcoat is still present. The similarity inexposed A276 (neat and overcoated) spectra may be due to extensive crosslinking of the silane polymer onthe surface. The crosslinking of the polymer modified the electronic and molecular structure and may havemore effectively bonded the available electrons. The result is the electrons could no longer be excited to a
*Tedlar is a trademark of Dupont
1112

higher, unstable energy level when exposed to UV irradiation and therefore the overcoat no longerfluoresced, but the fluorescence of the A276 was transmitted through the overcoat. Further evidence thatcrosslinking of the silane overcoat is a likely explanation for this phenomenon is that visual inspection ofthe surface of the overcoated samples shows significant cracking. This can be the result of the hardening
and embrittlement of the polymer from increasing crosslinking based on optical properties measurementsl.The overcoat has served its purpose to protect the Z302 from eroding.
The ZnO pigmented Z93 and S 13GLO coatings show remarkably similar fluorescence spectra forthe control samples as well as those that were protected by an aluminum cover during flight (Figures 8-13).The spectra from the exposed samples generally appear similar, with unexplained weaker fluorescence onthe TCSE P7, 5.8 years exposure S13GLO sample (figure 9) and on AO114 Wake mounted S13GLOsample (Figure 13). Especially, the Wake mounted sample shows a weak fluorescence and the absence ofthe 380 mm peak.
From Figure 8, Z93 spectra for 1.6 and 5.8 years exposure are shown, providing evidence that thechange occurring is not linear with time and that the 380 and 520 nm fluorescence change rates may bedifferent.
The slight fluorescent glow noticed on the TCSE front cover was measured and is shown inFigure 14. Measurements on non-flight Teflon failed to produce any detectable fluorescence. However,measurements of the 3M 966 high temperature acrylic adhesive used to apply the silver Teflon producedfluorescence that, like the silicone overcoat, extended into the ultraviolet (Figure 15). Upon exposure to
strong ultraviolet for various periods of time, the spectra shifted toward the visible region during the firstshort exposure and did not continue to shift significantly, but fluorescence intensity continued to grow inthis band.
Discussion and Summary
It is clear that the fluorescence of the urethane based paints is produced by the urethane binder itself
and not the various pigments. Hill2 has correlated laser-induced fluorescence (LIF) with tensile strength ofseveral polyurethane based materials. He also found LIF changes in LDEF Tray Clamps samples of A276
and Z306 supplied to him by Boeing3. It is not apparent if the specific LIF changes detected in the thermalcontrol coatings are the same as polyurethane/tensile strength LIF changes. Hill attributes the latter to"complex molecular and intermolecular relationships (such as cross-linking, scission, oxidation) that are
altered during degradation."2 Silicone overcoated urethane paints, although severely cracked and sometimespeeling seem to provide protection from atomic oxygen erosion. From the measurements, not only does theinitial enhanced ultraviolet fluorescence disappear after space exposure, but the resulting spectra closelymatches that of the urethane paints without the silicone. If polyurethanes are to continue to be used in thespace environment, it is necessary to better understand the degradation mechanisms involved. Fluorescencemay prove to be a useful tool in this understanding as well as in the valuation of the condition ofpolyurethane based materials.
The coatings containing ZnO (S 13G/LO and Z93) exhibited fluorescent spectra apparently dominated
by ZnO. Nicoll4 showed that the ultraviolet (-380 nm) band wavelength peak shifts with wavelengthtoward the visible at about 0.12 nm/°C (Figure 16). This shift seems to correlate with the fundamental
absorption edge shift. There is no shift in the visible band, but its intensity decreases with temperature.
Kroeger5 attributes this visible fluorescence (-520 nm) in ZnO to the presence of oxygen vacancies, that is,a non-stoichiometric zinc rich condition. It is tempting to attribute the reduction seen in this band for theLDEF S 13GFLO and Z93 to the reaction of ZnO with atomic oxygen. Streed6 shows, in ground chamber
tests, that fluorescence reduction in this band may be caused by ultraviolet and/or proton irradiation.Perhaps, in space, the reaction is indeed proceeding toward a stoichiometric mixture aided by the presenceof zinc and oxygen in the lattice reacting as a result of exposure to the various high-energy environments.
1113

Fluorescenceof silverTeflon (TCSEfrontcover)isattributedto themicrocrackingthatoccurredduringinstallation.Thematchingspectraof ultravioletirradiatedadhesiveusedto applythesilverTeflonleaveslittle doubtof thesourceof theflight materialfluorescenceandalsois anexampleof fluorescenceasanadditionalanalyticaltool availableto materialsresearchersandtechnologists.
REFERENCES
*
,
.
o
.
.
Wilkes, D.R., et. al., Thermal Control Surfaces on the MSFC & LDEF Experiments, LDEFMaterials Workshop, Hampton, VA, November, 1991.
Hill, R.H. Jr., Feuer, H.O. Jr., Laser-Induced Fluorescence Inspection of Polyurethane,Proceedings of the 17th Symposium on Nondestructive Evaluation, April 17-20, 1989, SanAntonio, TX.
Hill, R.H. Jr., Laser-Induced Fluorescence of Space-Exposed Polyurethane, Southwest ResearchInstitute Report 15-9682, April 6, 1992.
Nicoll, F.H., Temperature Dependence of Emission Bands of ZnO Phosphors, Journal of theOptical Society of America, Vol. 39, 1948.
Kroeger, Vink, et. al., The Origin of Fluorescence in Self-Activated ZnS, CdS, and ZnO, Journal ofChemical Physics, Vol. 22, No. 2, p. 250, 1954.
Streed, E.R., Experimental Study of the Combined Space Environment Effects on ZnO/PotassiurnSilicate, Thermophysics of Spacecraft and Planetary Bodies, ed. by G. Heller, 1967.
1114

A276/01650
Z302/RTV670
YB71
&
Z302/01650
-I. AWhite Light
Ultraviolet Light
Figure 1. Fluorescence of Thermal Control Coatings Comparison of Samples Under
White and Ultraviolet Light.
SLY, C!-', AND WHITE P!.:OTO_t_APH
1115

DK,2A
SPECTRORADfOMETER
MODE
/FLUORESCENCE
m
SOURCEMONOCHROMATOR
WAVELENGTHBANDSET
FOR265Ihru290nm
/ INCIDENTFLUX=0.5rnW/cm_
4s_ t
°\• TEST SAMPLE
4P
Figure 2. Schematic of Fluorescence Measurement.
DK.2A
SPECTRORADIOMETER
MODE
_ 1KW NBS SPECTRAL
_k IRRADIANCE STANDARD
_CALIBRATION SAMPLE
99% DIFFUSEREFLECTANCE
I_' STANDARD (NON-FLUORESCENCE)
CALIBRATEDINPUT JRRADIANCE
Figure 3. Schematic of Calibration Setup for Fluorescence Measurements.
1116
100 .........................
E
E
10
1 ----
0.1- '
300
100
Control
Flight P18 1.6 yrs
I , .
'I I .... I I I 'I .... ,' ....
350 400 450 500 550 600 650 700
Wavelength In Nanometers
Figure 4. Fluorescence Spectra of Z302.
Thermal Control Surfaces Experiment S0069
E¢-
t'4
E
r-
10----
_
0.1
300
Control Flight Pll 5.8 yrs
I i 1 i iI i i i I
350 400 450 500 550 600 650 700
Wavelength in Nanometers
Figure 5. Fluorescence Spectra ofA276.
Thermal Control Surfaces Experiment S0069
1117

I00
e-l
Ifllllll I _ _d
300 350 400 450 500 550 600 650 700
Wavelength In Nanometers
Figure 6. Fluorescence Spectra of Z302 with OI650 Overcoat.
Thermal Control Surfaces Experiment S0069
100
10Er-
r'4E
Control
,._. _ Flight P13 5.8 yrs
0.1300 350 400 450 500 550 600
Wavelength In Nanometers
Figure 7. Fluorescence Spectra of A276 with OI650 Overcoat.
Thermal Control Surfaces Experiment S0069
I
650 700
1118

100
10Et"
¢N
E(3
t-"1
0.1
300
100
Control
Flight P5 1.6 yr.¢
Flight P5 5.8 yrs
350 400 450 500 550 600 650
Wavelength in Nanometers
Figure 8. Fluorescence Spectra of Z93.
Thermal Control Surfaces Experiment S0069
700
10Er-
N
E(.)
f-
1
0.1300
!
350
Control
5.8 yrs
J t
/ I
i tJ
j I
/ !
4 !
! I I,," I I =1 I
400 450 500 550 600 650Wavelength in Nanometers
Figure 9. Fluorescence Spectra of SI3G/LO.
Thermal Control Surfaces Experiment S0069
700
1119

I00
10E
P4
Eo
r-1
01. ...... ,_'J
300 350
Protected
/Unprotected
I _ _ _ d
I \ ! \,
x f
I _ I
I
"'I .... I .... I .... I .... I ''_'' "''
400 450 500 550 600 650 700Wavelength in Nenometers
Figure 10. Fluorescence Spectra of Z93 (RAM).Interaction of AO with Material Surfaces in LEO AOl14
IO0
Er-
NE
f-
10-
_
I I a i i /'
0.1 ,
300 350
Protected
ected
,,,I .... I .... I ' ' ' ' I .... I ....I
400 450 500 550 600 650Wavelength In Nenometer$
Figure 11. Fluorescence Spectra of Z93 (WAKE)Interaction of AO with.Material Surfaces in LEO AO114
||lli
7OO
1120

k •
100
Er-
E
e-
EE
¢N
E¢J
e-
10----
1 ----
i i i 1 I n0.1- l
300 350
Protected
cted
% /
X I
%
n n I .... I .... |I .... II .... |_ i
400 450 500 550 600Wavelength in Nanometers
\
11
I
650 700
Figure 12. Fluorescence Spectra of S13G/LO (RAM).
Interaction of AO with Material Surfaces in LEO AO114
100
10-
0,1 , , , , I ,,i
300 350
Protected
! t
I
I
I
, , I , i t , I , , . I I .... I .... , ....I I I I I
400 450 500 550 600 650Wavelength In Nanometers
Figure 13. Fluorescence Spectra of S13G/LO (WAKE)Interaction of AO with Material Surfaces in LEO AO114
i | i !I
700
1121

100
E
I'4Eo
10
0"I 'I300 350 400 450 500 550 600 650 700
Wavelength in Nanometers
Figure 14. Fluorescence Spectra of Front Cover Silver Teflon.
Thermal Control Surfaces Experiment S0069
100
I
I °
I:[
I
Control
0.1
300 350 400 450 500 550 600 650 700Wavelength In Nanometers
Figure 15. Fluorescence Spectra of Adhesive 966 After UV Exposure.Thermal Control Surfaces Experiment S0069
1122

@
@
1=25°C
T=90 °C ,/_=90 °C
=154 °C
I _T-- ! 54 °C
_ T=200 °CT::250 °C
.... I .... I .... I ,., ,I .... I, , , ,
WB)'_®O®nggh (_)
Relative energy emitted by hex, ZnO: [Zn] phosphor as a function of wavelength
for different temperatures. Emission produced by a high current density electron
beam, 100 MA focused and scanning a 3-in. × 4-in. televisio, pattern at 20 kV.
Refer: Nicoll, F.H.; J.Opt. Soc. Amer. 38,817 (1948).
[Reprinted with permission of the Journal of the Optical Society of America.]
Figure 16. Fluorescence ZnO.
1123
