flush: a reliable bulk transport protocol for multihop wireless networks sukun kim †#, rodrigo...
Post on 22-Dec-2015
221 views
TRANSCRIPT
Flush: A Reliable Bulk Transport Protocol for
Multihop Wireless Networks
Sukun Kim†#, Rodrigo Fonseca†, Prabal Dutta†, Arsalan Tavakoli†, David Culler†, Philip Levis*, Scott
Shenker†‡, and Ion Stoica†
University of California at Berkeley
Samsung Electronics
International Computer Science Institute
Stanford University
SenSys 2007
† ‡ * #
2/26
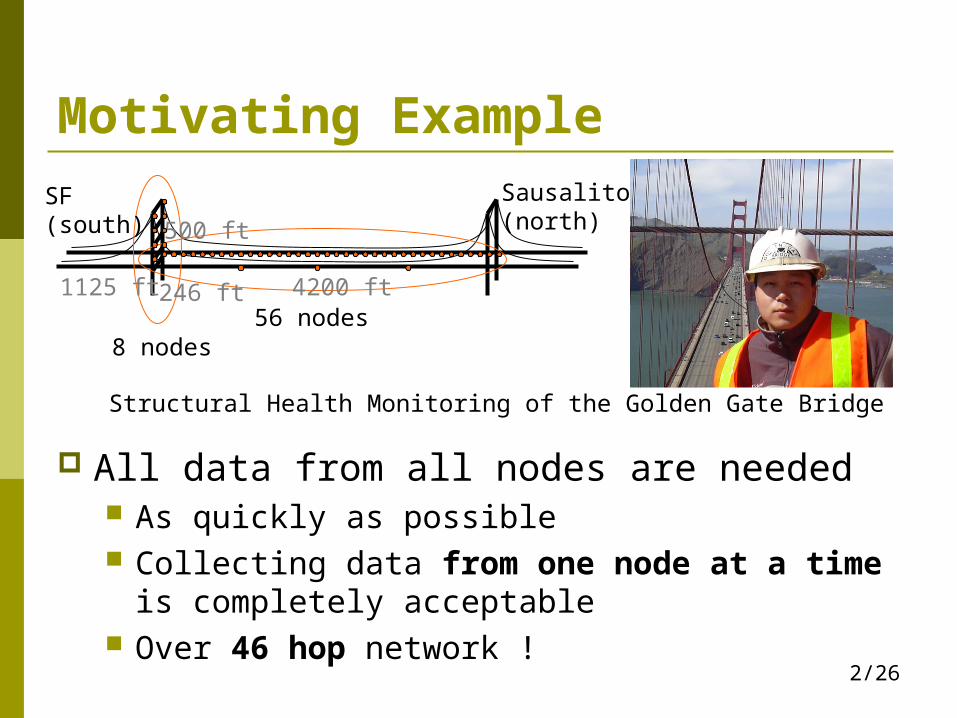
All data from all nodes are needed As quickly as possible Collecting data from one node at a time is
completely acceptable Over 46 hop network !
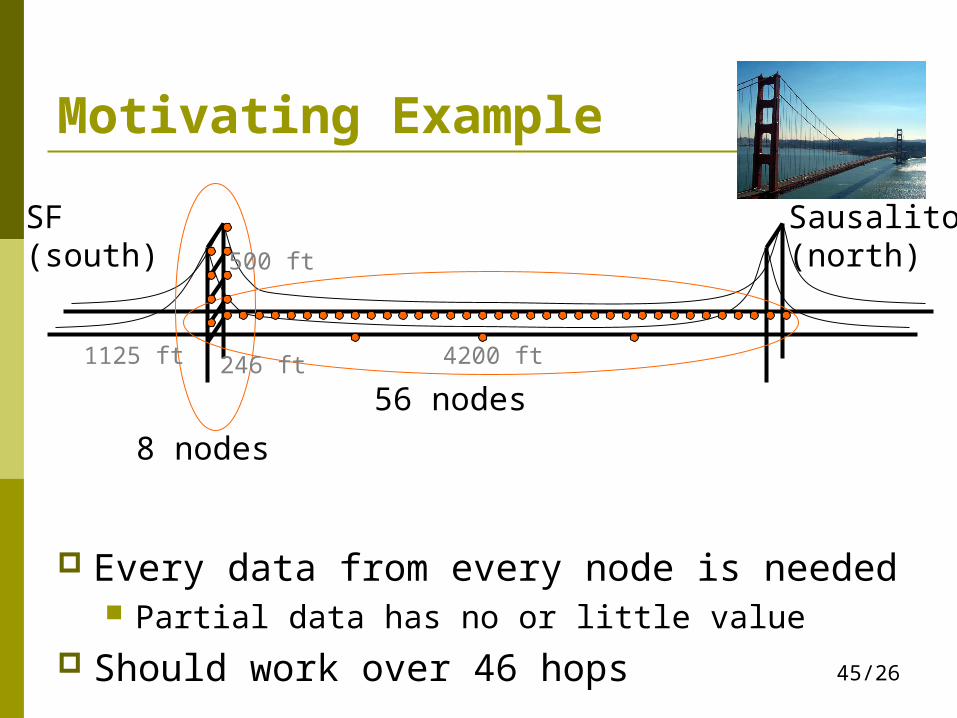
Motivating Example
8 nodes56 nodes
1125 ft 4200 ft
500 ft
246 ft
SF(south)
Sausalito(north)
Structural Health Monitoring of the Golden Gate Bridge
3/26
Introduction Target applications
Structural health monitoring, volcanic activity monitoring, bulk data collection
One flow at a time Remove inter-path interference Easier to optimize for intra-path interference
Built on top of MAC layer No merging with MAC layer for easy porting

4/26
Table of Contents Introduction Algorithm Implementation Evaluation Discussion Related Work Conclusion

5/26
Flush Algorithm Overview Receiver-initiated
Selective-NACK
Hop-by-hop Rate Control
Empirically Measure Interference Range
6/26
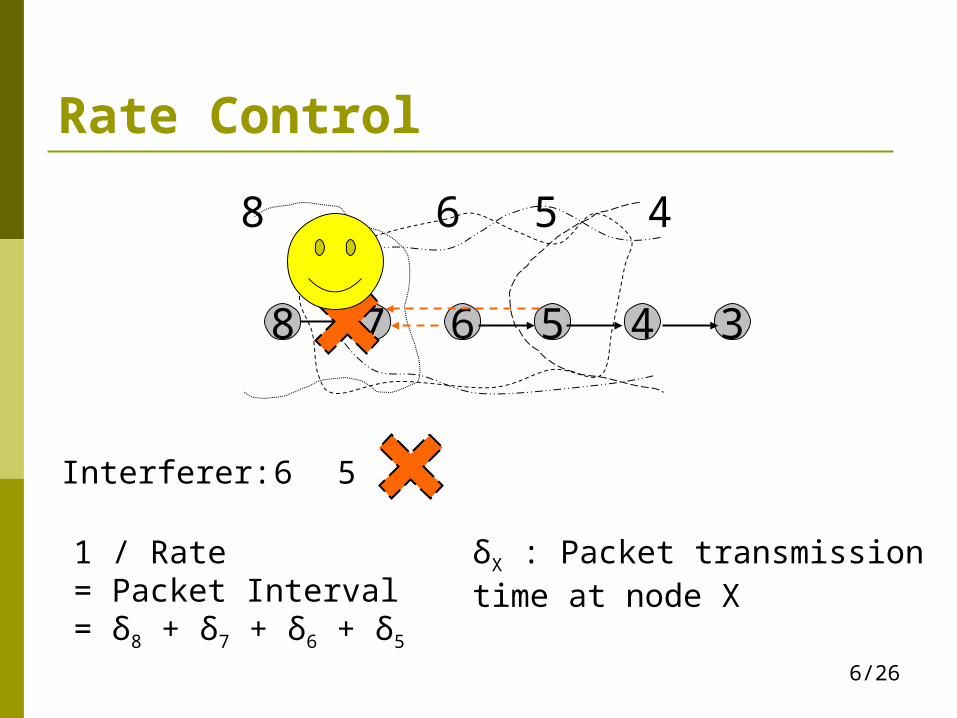
Rate Control
8 6
8 6 5
4
4
37 5
1 / Rate= Packet Interval= δ8 + δ7 + δ6 + δ5
δX : Packet transmission timeat node X
Interferer: 6 5 4
7/26
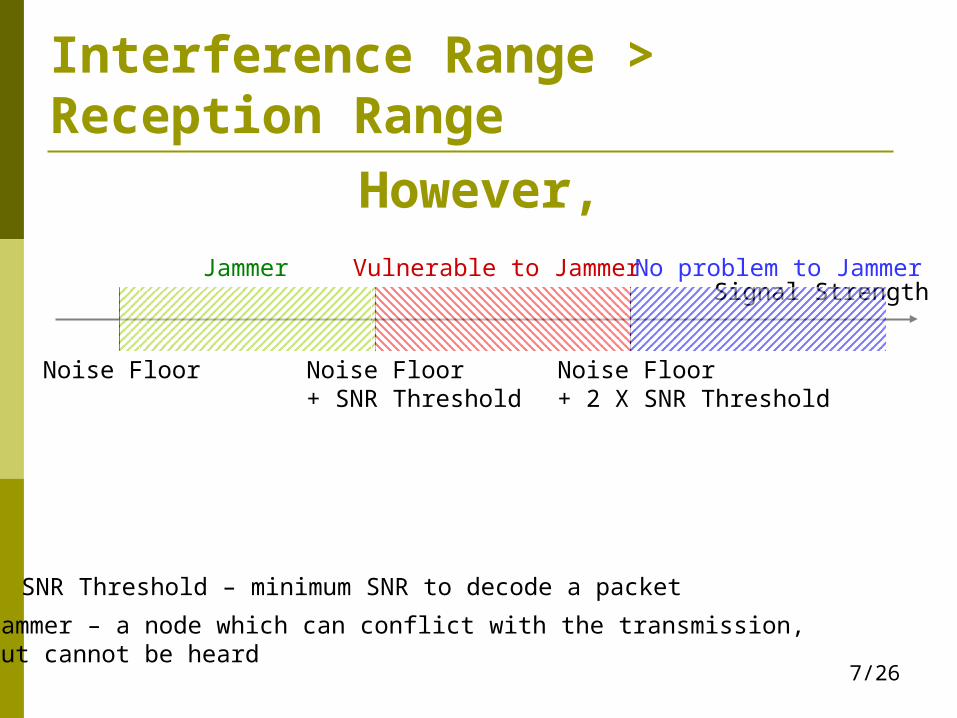
Interference Range > Reception Range
However,
Signal Strength
Noise Floor Noise Floor+ SNR Threshold
Noise Floor+ 2 X SNR Threshold
SNR Threshold – minimum SNR to decode a packet
Jammer – a node which can conflict with the transmission,but cannot be heard
Jammer Vulnerable to Jammer No problem to Jammer
8/26
0
0.2
0.4
0.6
0.8
1
0 5 10 15 20 25 30
Fra
ctio
n of
Lin
ks
Difference Between Received Signal Strength and Noise Floor (dBm)
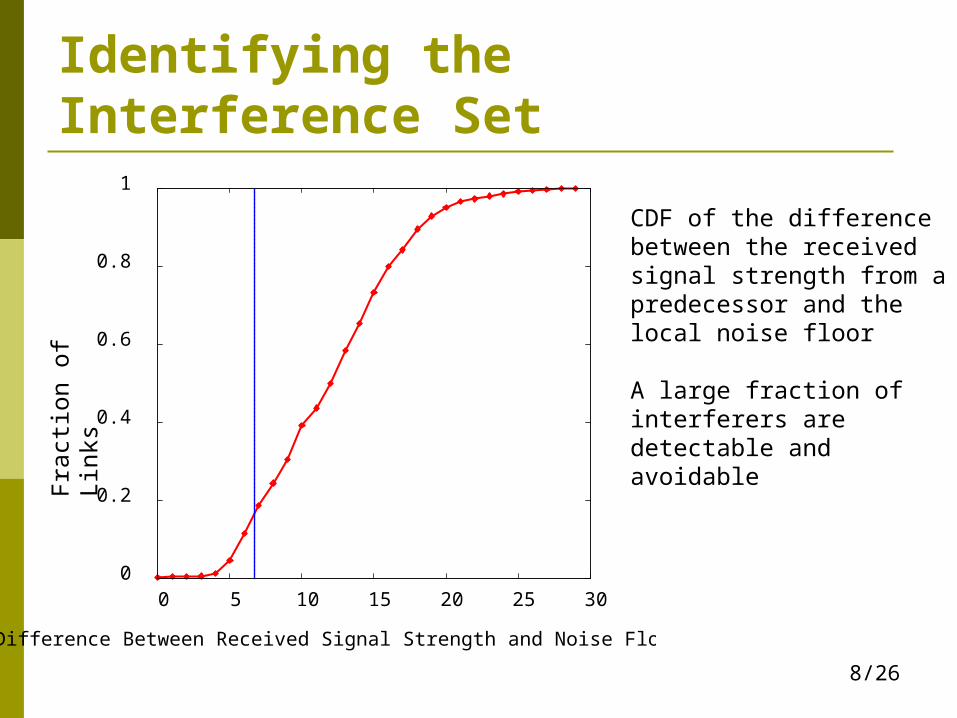
Identifying the Interference Set
Fract
ion o
f Li
nks
CDF of the difference between the received signal strength from a predecessor and the local noise floor
A large fraction of interferers are detectable and avoidable
9/26
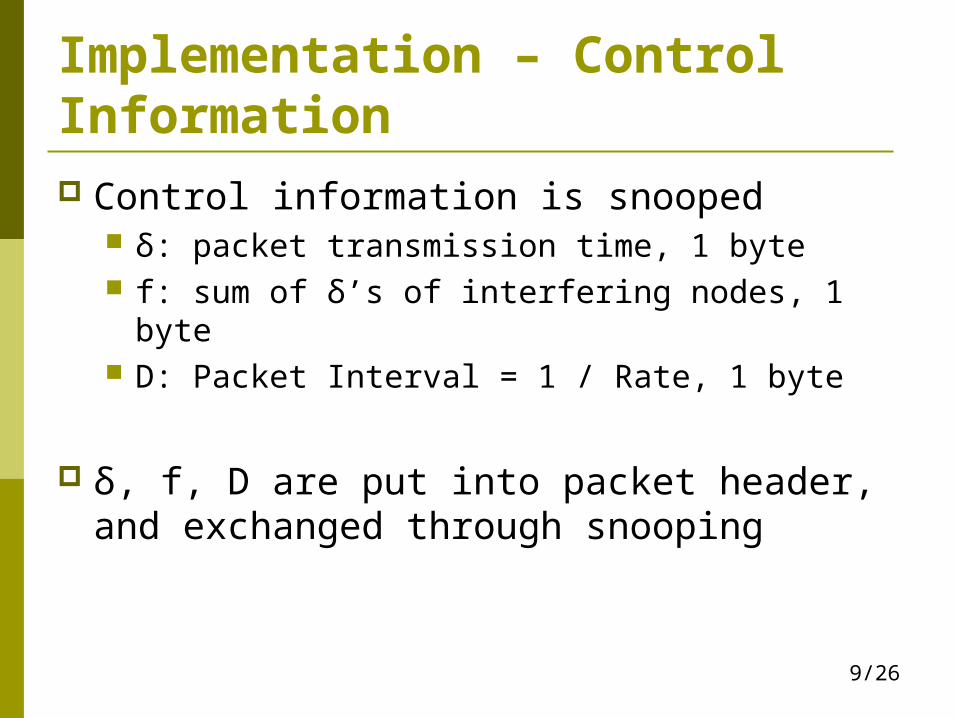
Implementation – Control Information Control information is snooped
δ: packet transmission time, 1 byte f: sum of δ’s of interfering nodes, 1 byte D: Packet Interval = 1 / Rate, 1 byte
δ, f, D are put into packet header, and exchanged through snooping
10/26
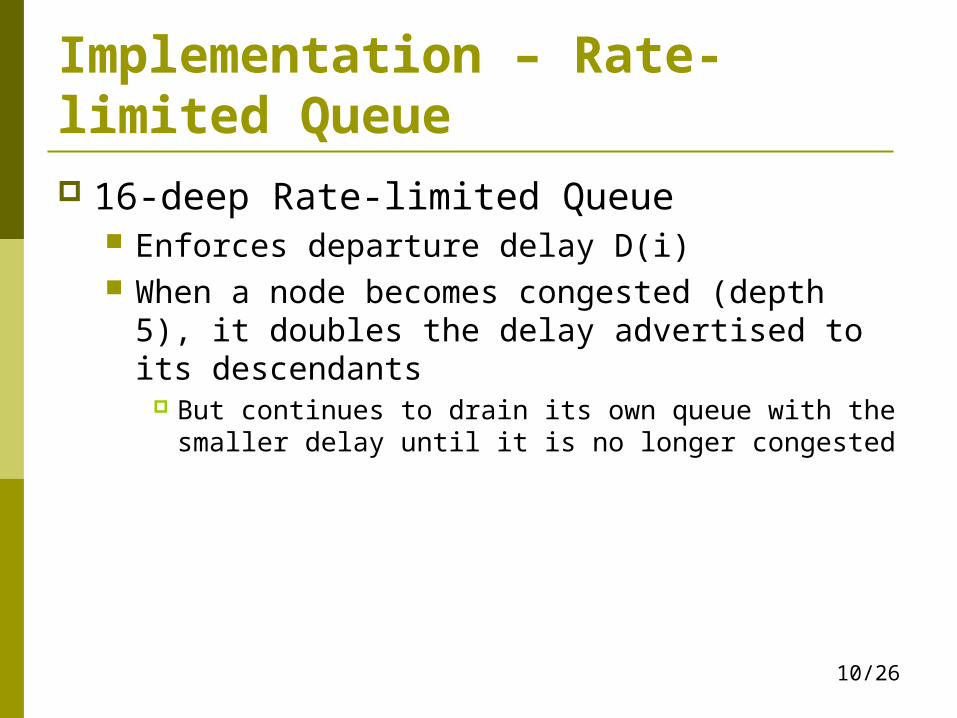
Implementation – Rate-limited Queue 16-deep Rate-limited Queue
Enforces departure delay D(i) When a node becomes congested (depth 5), it
doubles the delay advertised to its descendants
But continues to drain its own queue with the smaller delay until it is no longer congested
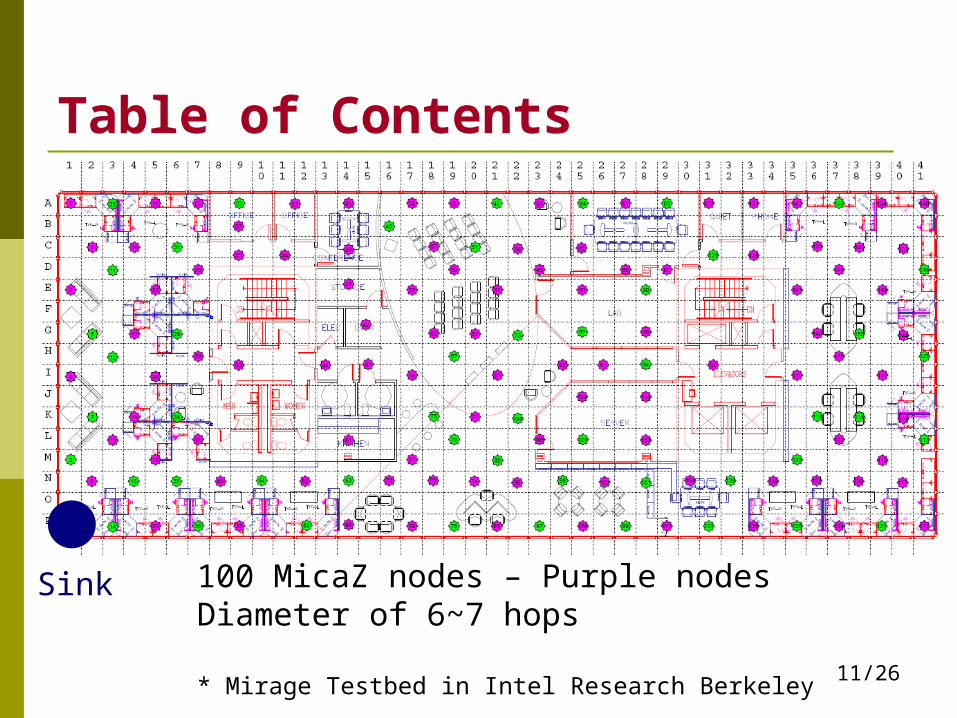
11/26
Table of Contents Introduction Algorithm Implementation Evaluation Discussion Related Work Conclusion
100 MicaZ nodes – Purple nodesDiameter of 6~7 hops
* Mirage Testbed in Intel Research Berkeley
Sink
12/26
Packet Throughput of Different Fixed Rates
0
5
10
15
20
25
30
35
40
45
0 1 2 3 4 5 6
Effe
ctiv
e T
hrou
ghpu
t (pk
t/s)
Hops from Sink
Fixed 10msFixed 20msFixed 40ms
Eff
ect
ive T
hro
ughput
(pkt
/s)
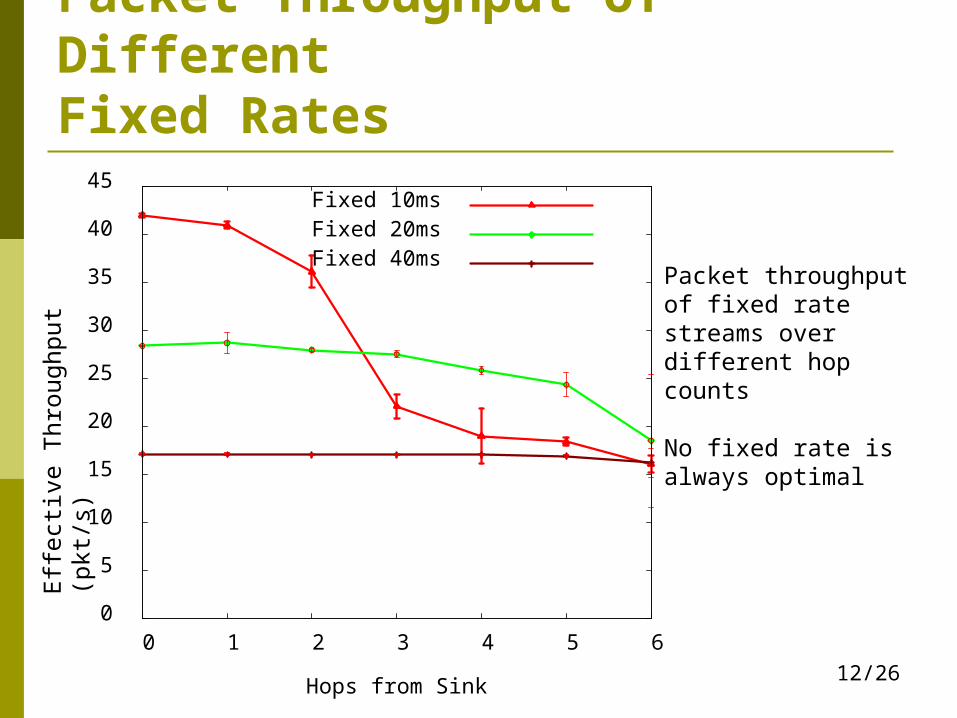
Packet throughput of fixed rate streams over different hop counts
No fixed rate is always optimal
13/26
0
10
20
30
40
50
60
0 1 2 3 4 5 6
Ove
rall
Thr
ough
put (
pkt/s
)
Hops from Sink
FlushBest Fixed Rate
Packet Throughput of FlushO
vera
ll Thro
ugh
put
(pkt
/s)
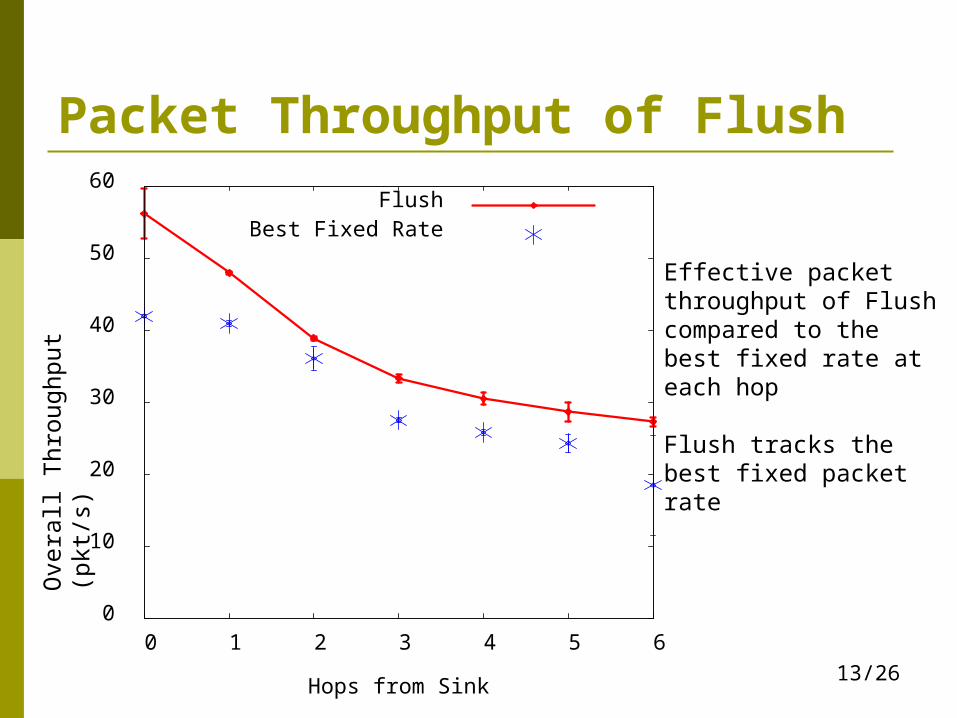
Effective packet throughput of Flush compared to the best fixed rate at each hop
Flush tracks the best fixed packet rate
14/26
0
200
400
600
800
1000
1200
0 1 2 3 4 5 6
Ove
rall
Ban
dwid
th (
B/s
)
Hops from Sink
FlushBest Fixed Rate
Bandwidth of FlushO
vera
ll B
andw
idth
(B
/s)
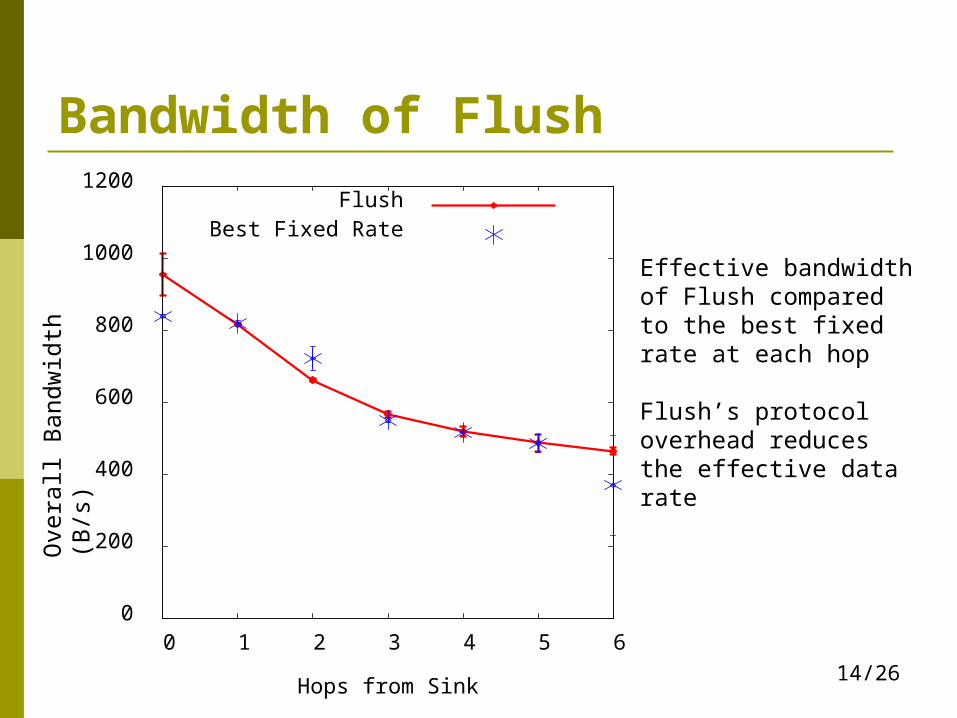
Effective bandwidth of Flush compared to the best fixed rate at each hop
Flush’s protocol overhead reduces the effective data rate
15/26
0
0.2
0.4
0.6
0.8
1
1.2
Flush Fixed 40 Fixed 20 Fixed 10 ASAP
Fra
ctio
n
ACK PhaseTransfer Phase
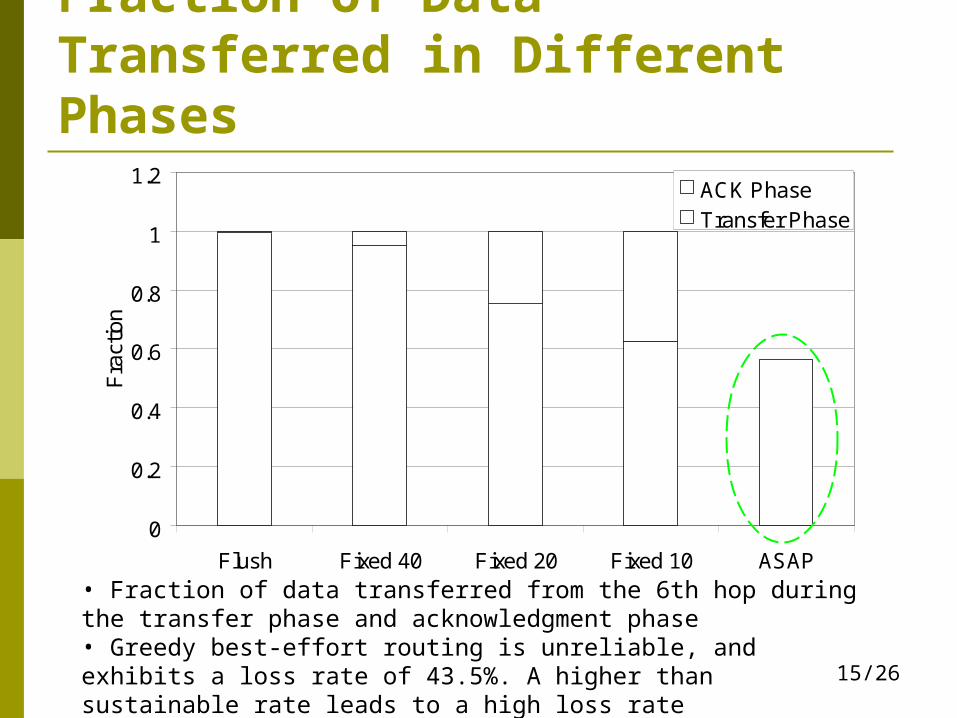
Fraction of Data Transferred in Different Phases
• Fraction of data transferred from the 6th hop during the transfer phase and acknowledgment phase• Greedy best-effort routing is unreliable, and exhibits a loss rate of 43.5%. A higher than sustainable rate leads to a high loss rate
16/26
0
5
10
15
20
25
30
35
40
45
50
Flush Fixed 40 Fixed 20 Fixed 10 ASAP
Tim
e (s
)
IntegrityCheckACK Phase
TransferPhaseTopologyQuery
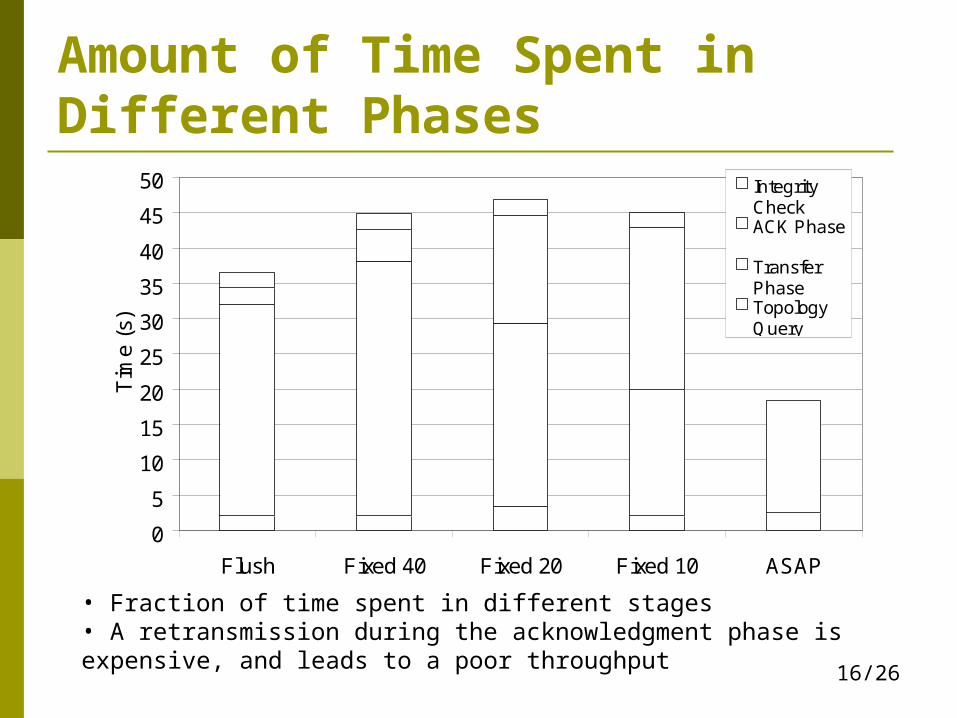
Amount of Time Spent in Different Phases
• Fraction of time spent in different stages• A retransmission during the acknowledgment phase is expensive, and leads to a poor throughput
17/26
0
10
20
30
40
50
60
70
80
90
100
0 1 2 3 4 5 6
Tra
nsfe
r P
hase
Thr
ough
put (
pkt/s
)
Hops from Sink
FlushFixed 40Fixed 20Fixed 10
ASAP
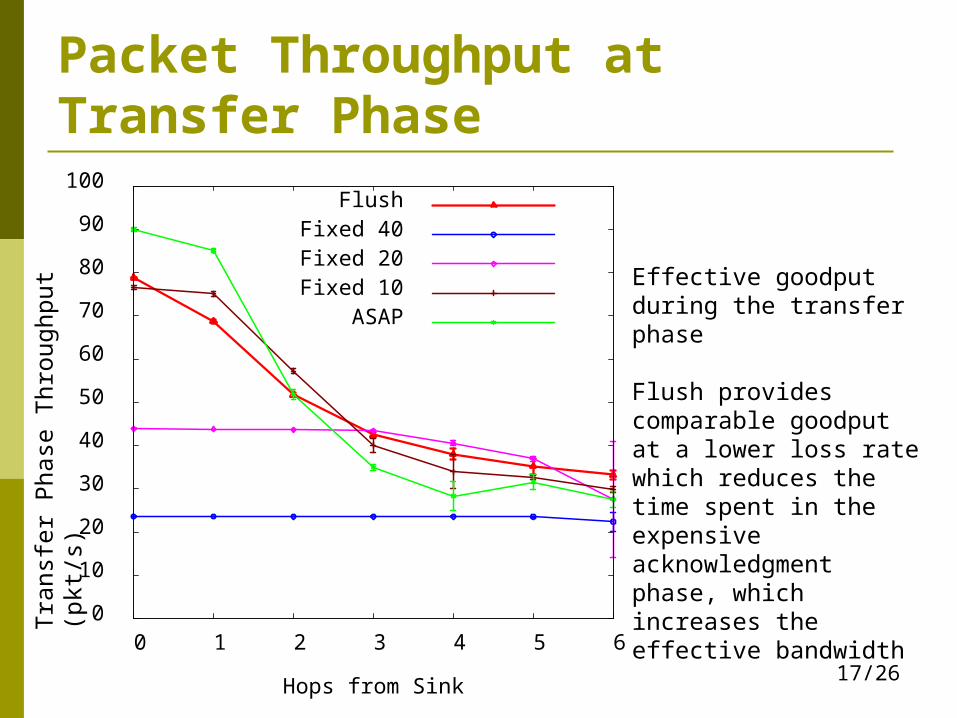
Packet Throughput at Transfer Phase
Tra
nsf
er
Phase
Thro
ughput
(pkt
/s)
Effective goodput during the transfer phase
Flush provides comparable goodput at a lower loss rate which reduces the time spent in the expensive acknowledgment phase, which increases the effective bandwidth
18/26
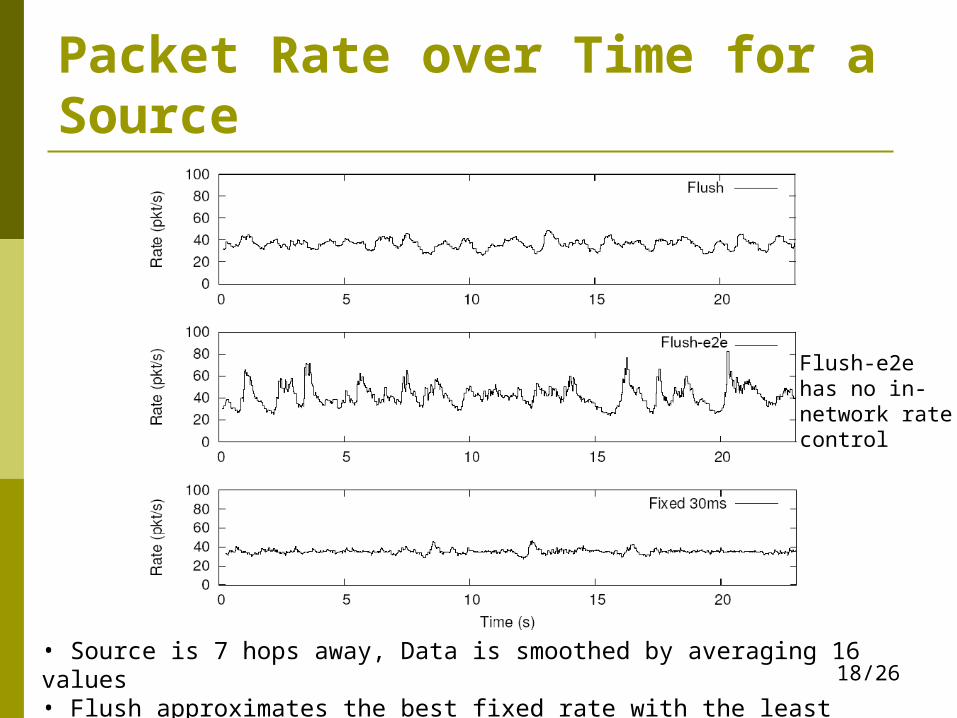
Packet Rate over Time for a Source
• Source is 7 hops away, Data is smoothed by averaging 16 values• Flush approximates the best fixed rate with the least variance
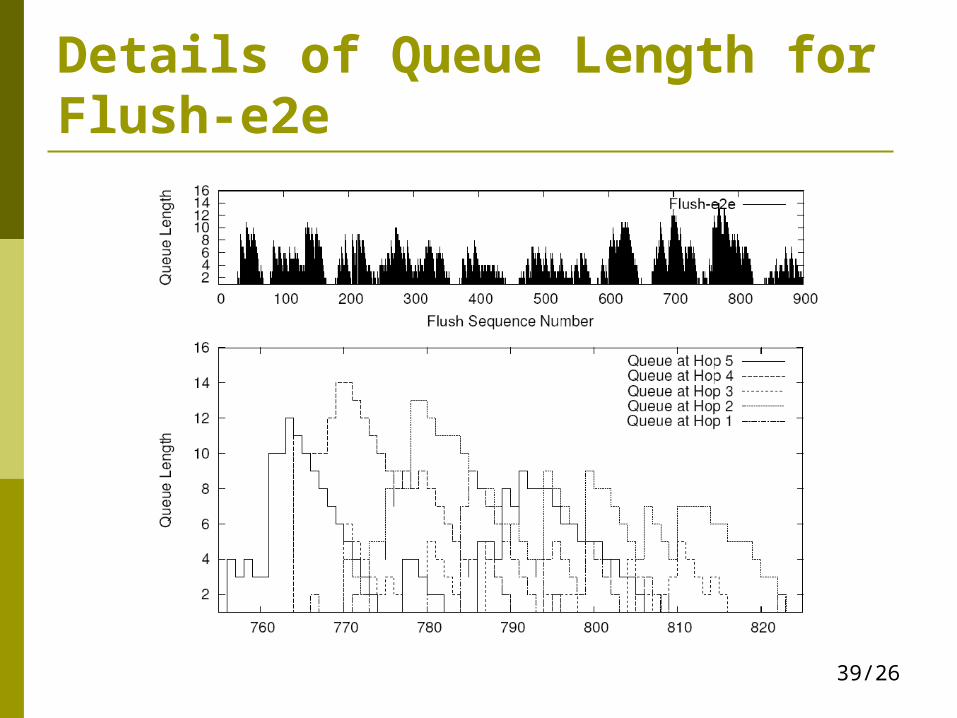
Flush-e2e has no in-network rate control
19/26
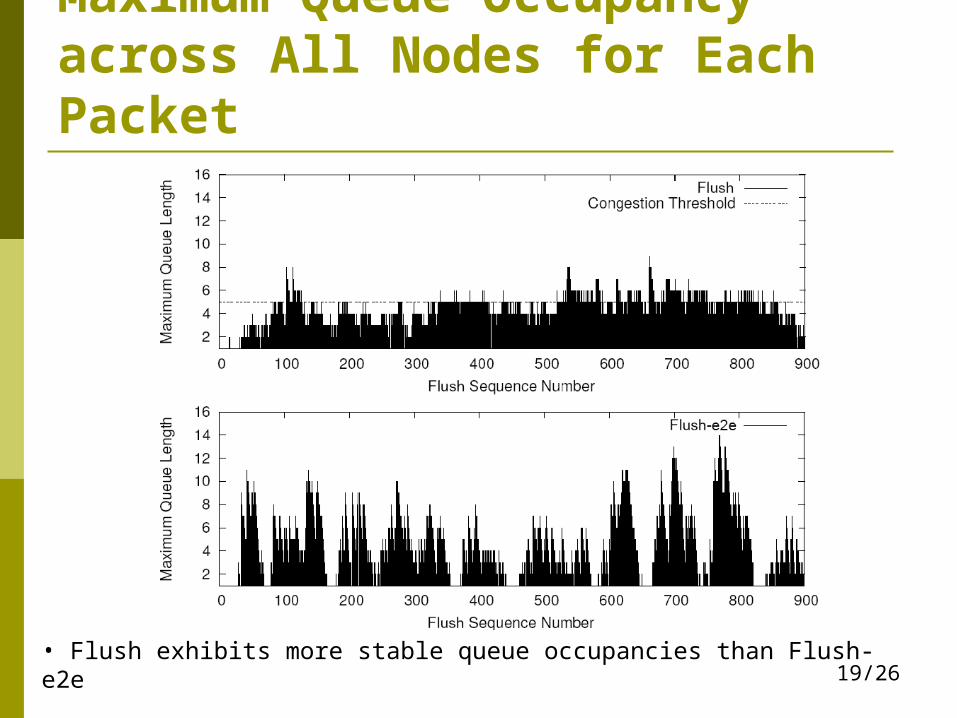
Maximum Queue Occupancy across All Nodes for Each Packet
• Flush exhibits more stable queue occupancies than Flush-e2e
20/26
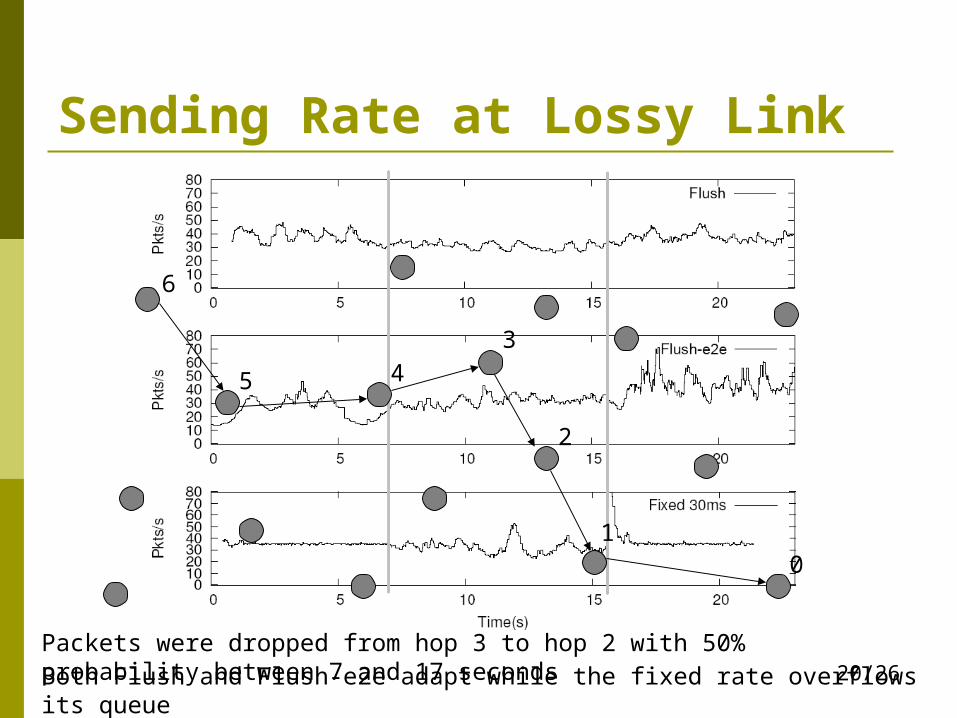
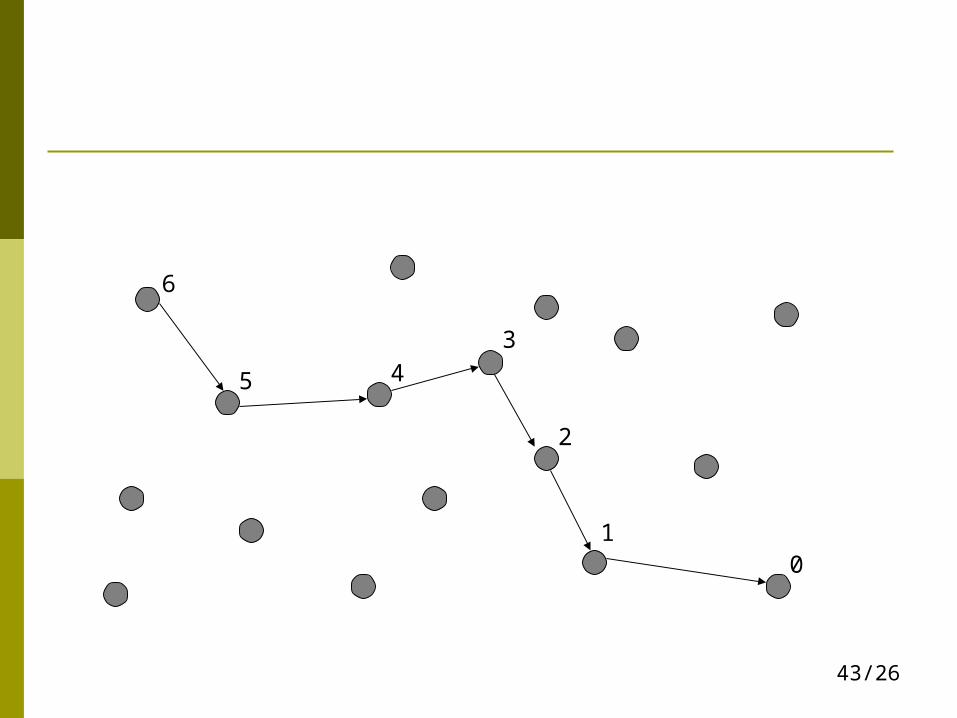
Sending Rate at Lossy Link
Both Flush and Flush-e2e adapt while the fixed rate overflows its queue
6
5 43
2
10
Packets were dropped from hop 3 to hop 2 with 50% probability between 7 and 17 seconds
21/26
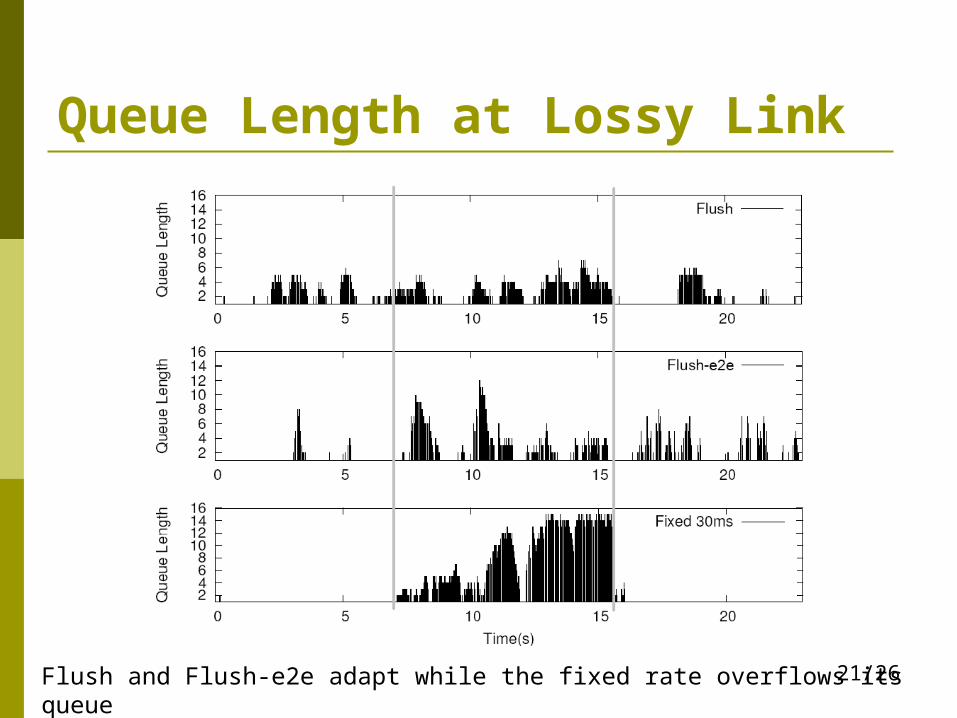
Queue Length at Lossy Link
Flush and Flush-e2e adapt while the fixed rate overflows its queue
22/26
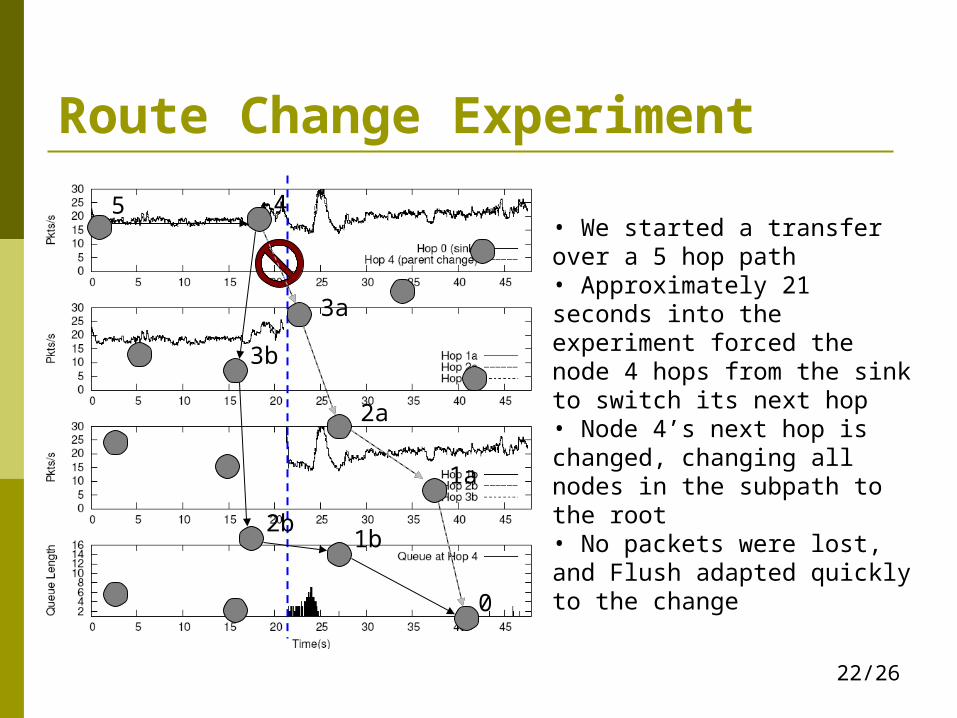
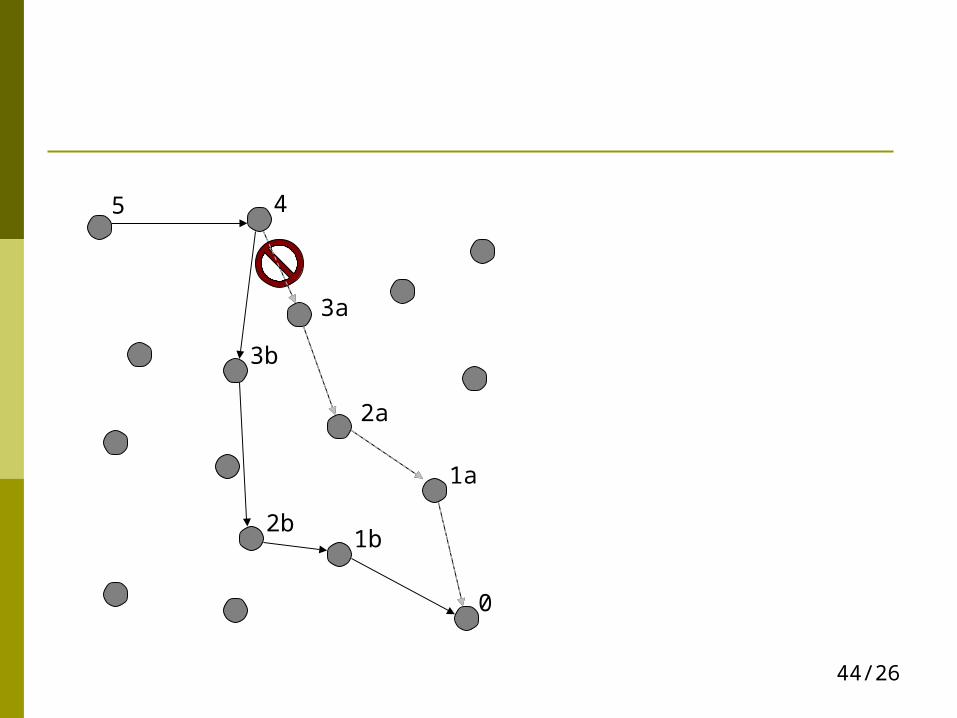
Route Change Experiment
• We started a transfer over a 5 hop path• Approximately 21 seconds into the experiment forced the node 4 hops from the sink to switch its next hop• Node 4’s next hop is changed, changing all nodes in the subpath to the root• No packets were lost, and Flush adapted quickly to the change
0
1a
2a
3a
1b2b
3b
45
23/26
0
200
400
600
800
1000
1200
1400
0 5 10 15 20 25 30 35 40 45 50
Ove
rall
Thr
ough
put (
B/s
)
Hops from Sink
FlushFixed 20msFixed 40msFixed 60ms
Scalability TestO
vera
ll Thro
ugh
put
(B/s
)
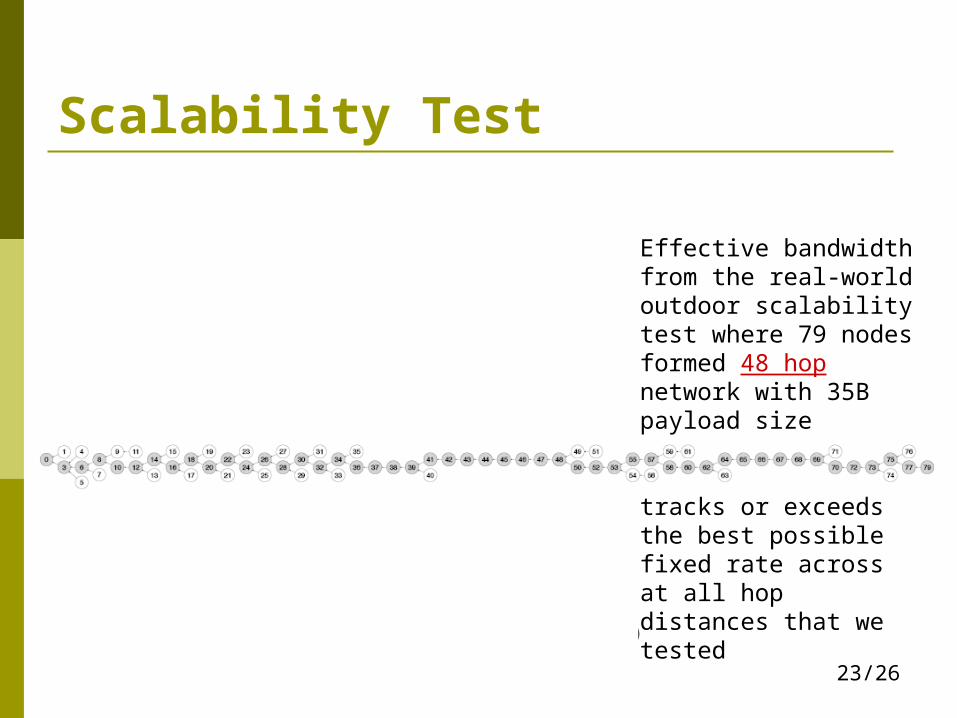
Effective bandwidth from the real-world outdoor scalability test where 79 nodes formed 48 hop network with 35B payload size
Flush closely tracks or exceeds the best possible fixed rate across at all hop distances that we tested

24/26
Table of Contents Introduction Algorithm Implementation Evaluation Discussion Related Work Conclusion
25/26
Discussion High-power node
reduces hop count and interference Not an option on many structural health
monitoring due to power and space problems
Interactions with Routing Link estimator of a routing layer breaks down
under heavy traffic
26/26
Related Work Li et al – capacity of a chain of nodes
limited by interference using 802.11 ATP, W-TCP – rate-based transmission in
the Internet Wisden – concurrent transmission without
a mechanism for a congestion control Fetch – single flow, selective-NACK, no
mention about rate control
27/26
Conclusion Rate-based flow control
Directly measure intra-path interference at each hop Control rate based on interference information
Light-weight solution reduces complexity Overhearing is used to measure interference and to
exchange information Two rules to determine a rate
At each node, Flush attempts to send as fast as possible without causing interference at the next hop along the flow
A node’s sending rate cannot exceed the sending rate of its successor
In combination, Flush provides as good bandwidth as fixed rate, and also gives a better adaptability

Questions

29/26
30/26
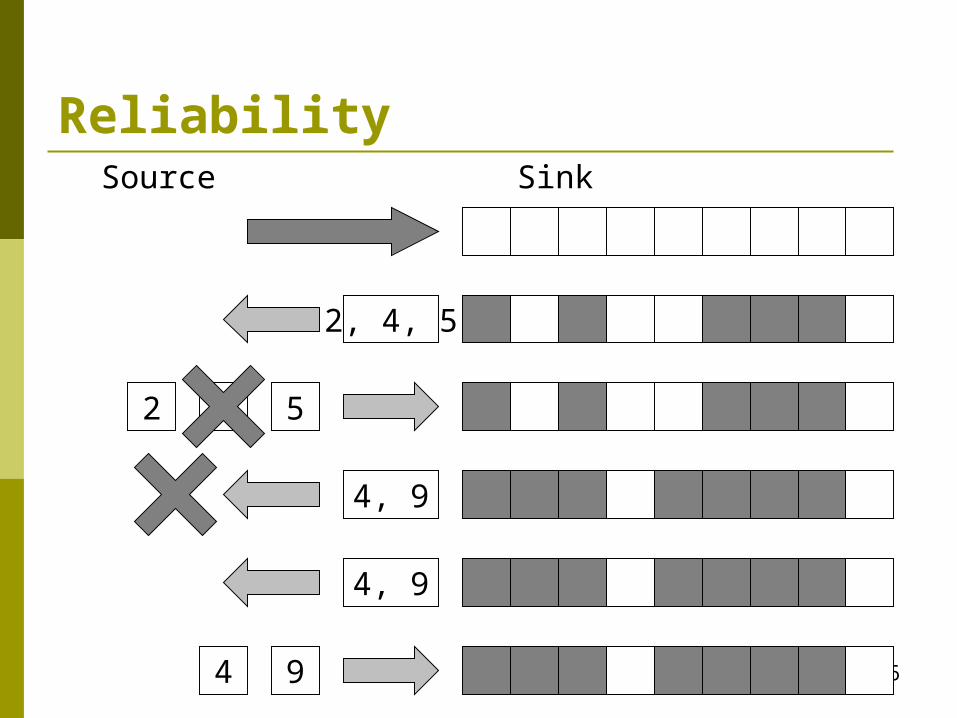
Reliability
2 4 5
4 9
2, 4, 5
4, 9
4, 9
Source Sink
31/26
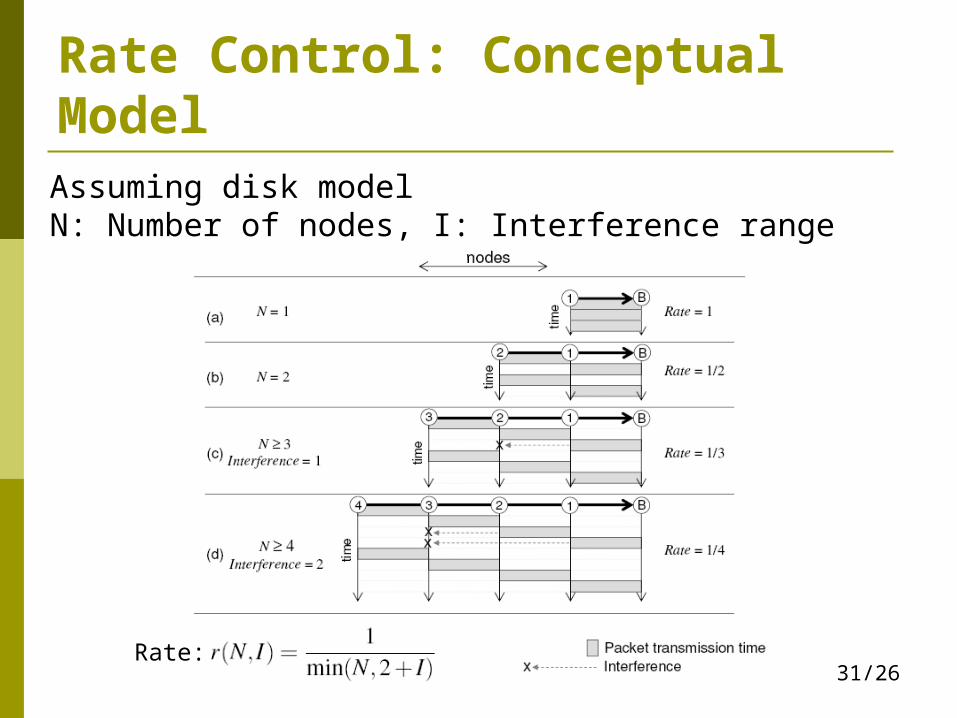
Rate Control: Conceptual Model
Rate:
Assuming disk modelN: Number of nodes, I: Interference range
32/26
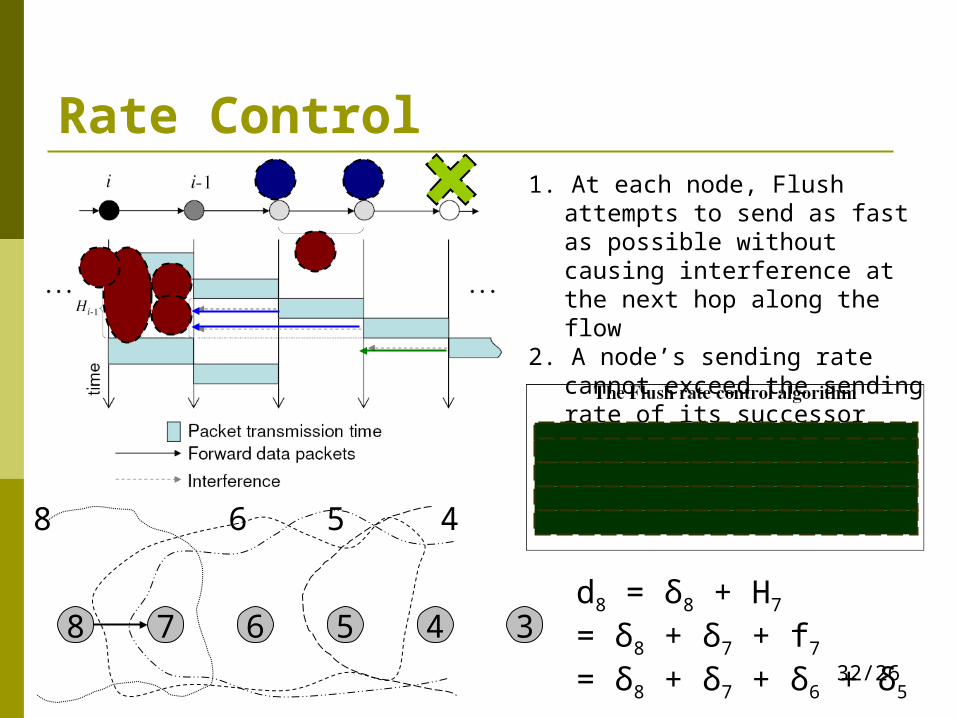
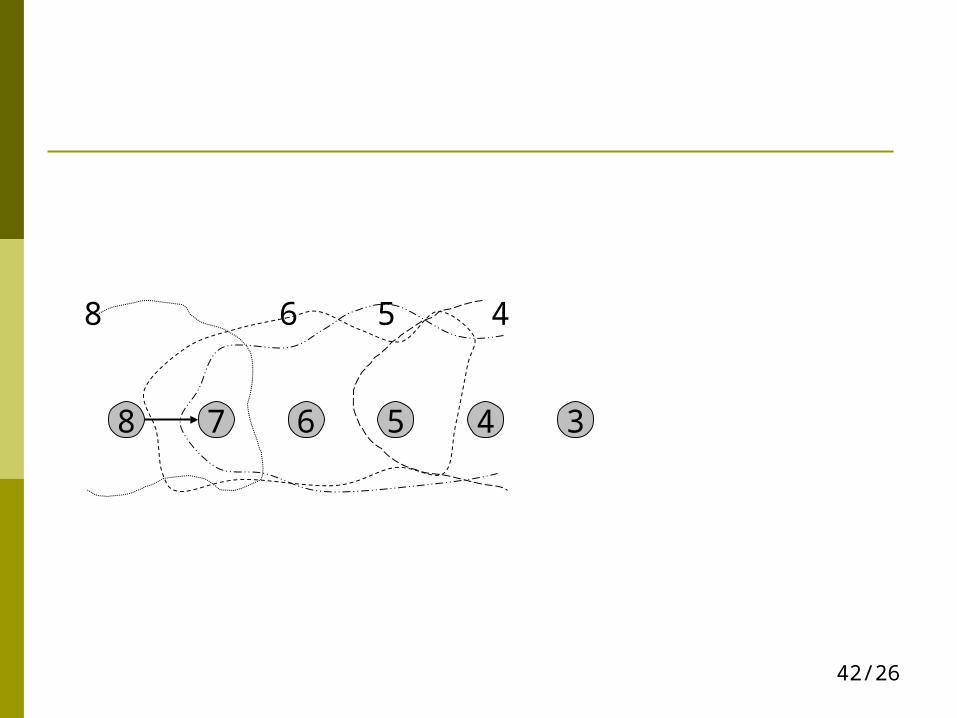
Rate Control
d8 = δ8 + H7
= δ8 + δ7 + f7
= δ8 + δ7 + δ6 + δ5
1. At each node, Flush attempts to send as fast as possible without causing interference at the next hop along the flow
2. A node’s sending rate cannot exceed the sending rate of its successor
8 7 6 5
8 6 5
4
4
3
33/26
Implementation RSSI is measured by snooping Information is also snooped
δ, f, D are put into packet header, and exchanged through snooping
δ, f, D take 1 byte each, 3 bytes total Cutoff
A node i considers a successor node (i− j) an interferer of node i+1 if, for any j > 1, rssi(i+1) − rssi(i−j) < 10 dBm
The threshold of 10 dBm was chosen after empirically evaluating a range of values
34/26
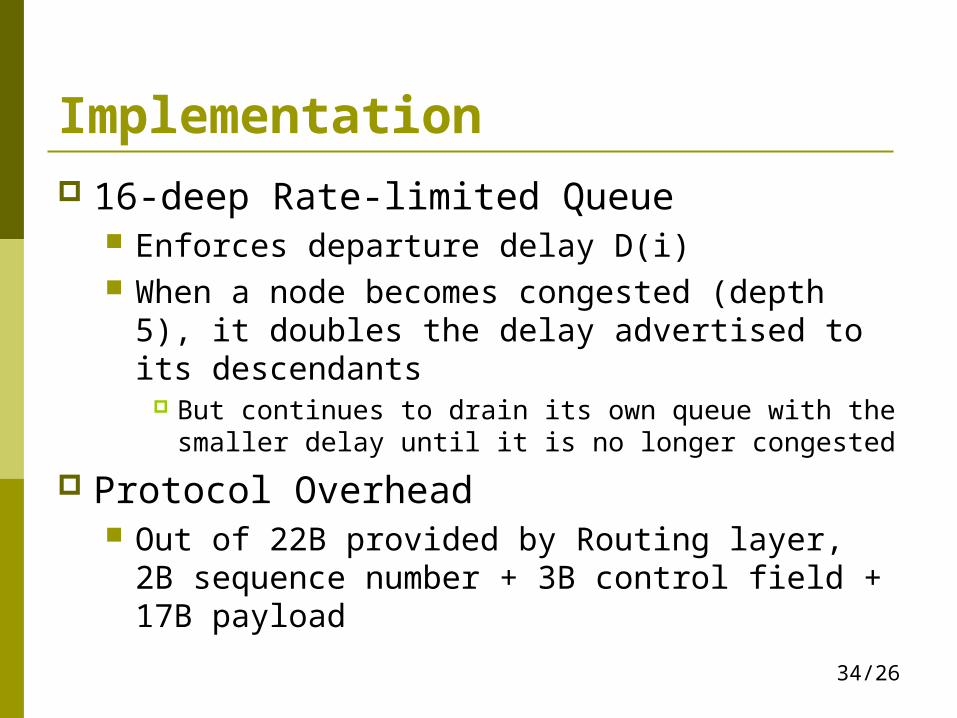
Implementation 16-deep Rate-limited Queue
Enforces departure delay D(i) When a node becomes congested (depth 5), it
doubles the delay advertised to its descendants
But continues to drain its own queue with the smaller delay until it is no longer congested
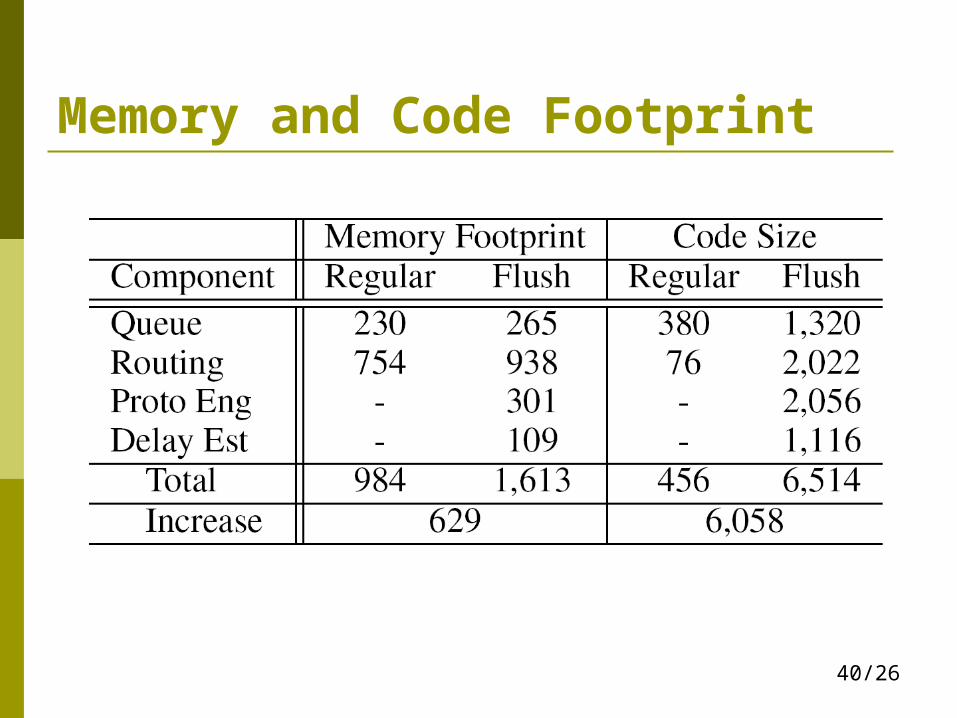
Protocol Overhead Out of 22B provided by Routing layer, 2B
sequence number + 3B control field + 17B payload
35/26
Test Methodology Mirage testbed in Intel Research Berkeley,
consists of 100 MicaZ -11 dBm Diameter of 6~7 hops Average of 4 runs
36/26
Bottom line performance High-power node
reduces hop count and interference Not an option on the Golden Gate Bridge due
to power and space problems Interactions with Routing
Link estimator of a routing layer breaks down under heavy traffic
Bottom line performance???
37/26
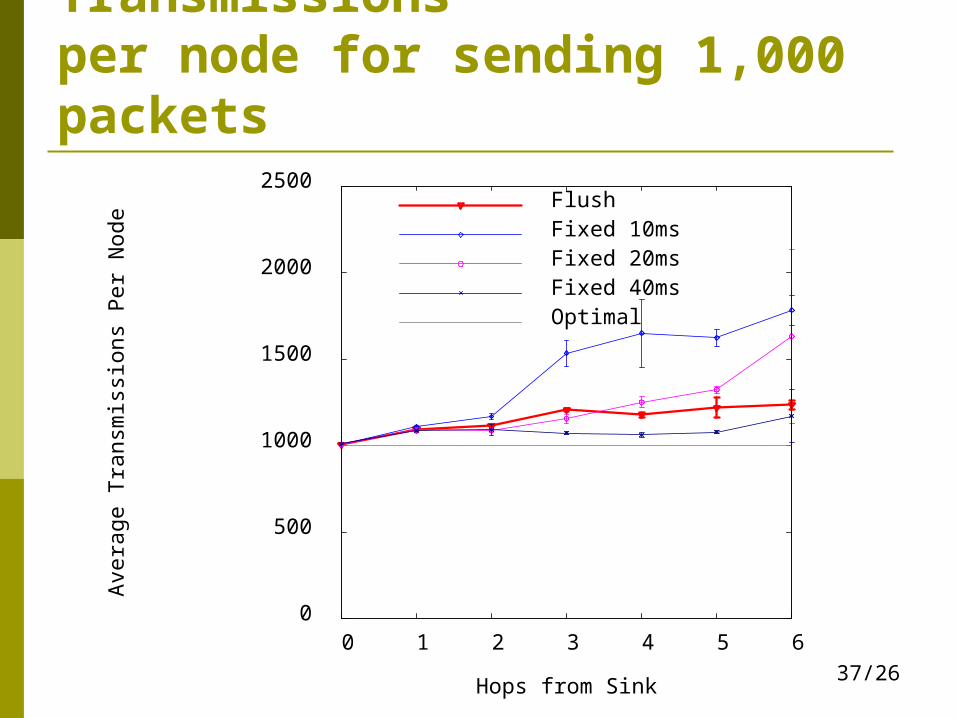
Average Number of Transmissions per node for sending 1,000 packets
0
500
1000
1500
2000
2500
0 1 2 3 4 5 6
Ave
rage
Tra
nsm
issi
ons
Per
Nod
e
Hops from Sink
FlushFixed 10msFixed 20msFixed 40msOptimal
38/26
0
200
400
600
800
1000
1200
1400
1600
1800
2000
0 1 2 3 4 5 6
Tra
nsfe
r P
hase
Thr
ough
put (
B/s
)
Hops from Sink
FlushFixed 40Fixed 20Fixed 10
ASAP
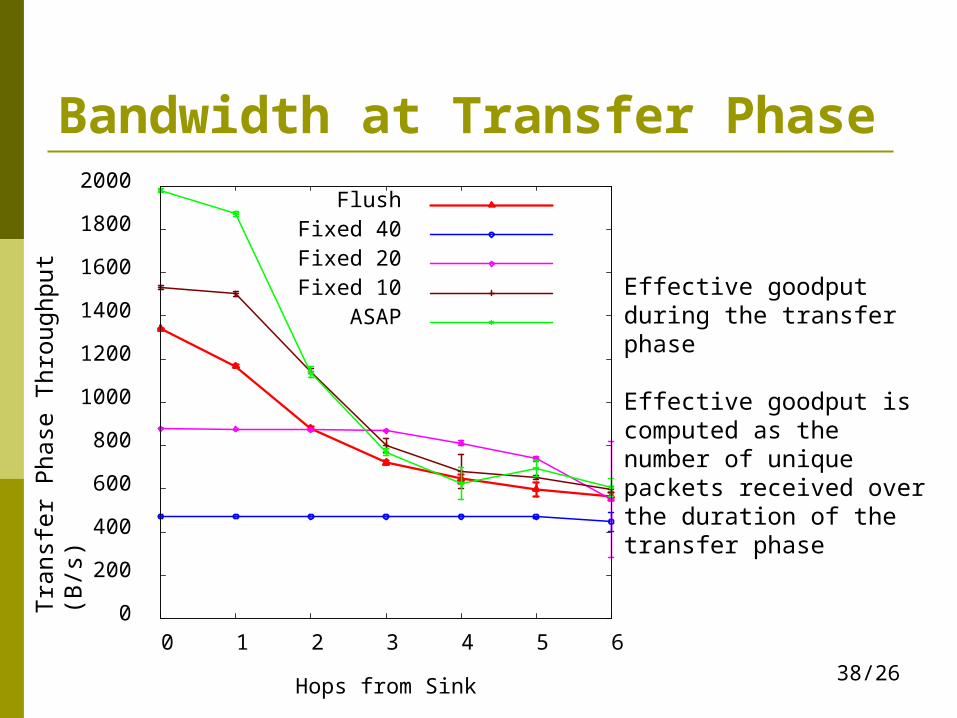
Bandwidth at Transfer Phase
Tra
nsf
er
Phase
Thro
ughput
(B/s
)
Effective goodput during the transfer phase
Effective goodput is computed as the number of unique packets received over the duration of the transfer phase
39/26
Details of Queue Length for Flush-e2e
40/26
Memory and Code Footprint

41/26
42/26
8 7 6 5
8 6 5
4
4
3
43/26
6
5 43
2
10
44/26
0
1a
2a
3a
1b2b
3b
45
45/26
Every data from every node is needed Partial data has no or little value
Should work over 46 hops
8 nodes
56 nodes
1125 ft 4200 ft
500 ft
246 ft
SF(south)
Sausalito(north)
Motivating Example