focus on outcomes: developing a comprehensive measurement framework in afterschool may 28, 2014...
TRANSCRIPT

Focus on Outcomes: Developing a Comprehensive Measurement
Framework in Afterschool
May 28, 2014
@AYPF_Tweets

Webinar Technical Support
• GoToWebinar Technical Assistance: 1-800-263-6317
• To submit live questions, please use the “Questions” box
• A recording of the webinar and other resources will be available at www.aypf.org

PresentersCharles Smith, Executive Director,David P. Weikart Center for Youth Program Quality
Jocelyn Wiedow, Sprockets Quality and Network Organizer,YWCA St Paul
Patricia Nagelkirk, Director, Community Impact, United Way of Greater Cincinnati
Emily Centeio, Student Support Coordinator, Epiphany School, Boston, MA

Comprehensive Measurement in Afterschool Systems: A “How to” Focus on Youth Skills
Comprehensive Measurement in Afterschool Systems: A “How to” Focus on Youth Skills
• Charles Smith, Executive Director, David P. Weikart Center for Youth Program Quality
• Patricia Nagelkirk, Director, Community Impact, United Way of Greater Cincinnati
• Jocelyn Wiedow, Youth Community Coordinator, Sprockets Network Organizer, YWCA St. Paul
• Emily Centeio, Student Support Coordinator, Epiphany School, Boston

Comprehensive Measurement in Afterschool Systems: A “How to” Focus on Youth Skills
City wideSystems
Quality Assessments
YouthSkills

Comprehensive Measurement in Afterschool Systems: A “How to” Focus on Youth Skills
Staff Engagement
Quality Management
Quality Instruction
Youth Skills
Youth Engagement
Skill Transfer
Program Outputs
Inpu
tsLogic Model for Comprehensive Measurement Systems (YPQI 2.0)
Outcomes

Comprehensive Measurement in Afterschool Systems: A “How to” Focus on Youth Skills
Soft Skills
© 2012 The Forum for Youth Investment.

Comprehensive Measurement in Afterschool Systems: A “How to” Focus on Youth Skills
Measures Reviewed
• California Healthy Kids Survey Resilience & Youth Development Module
• Developmental Assets Profile • Devereux Student Strengths Assessment • Holistic Student Assessment • San Francisco Beacons Youth Survey • Social Skills Improvement System Rating Scales • Survey of Academic and Youth Outcomes • Youth Experiences Survey 2.0 • Youth Outcomes Battery • Youth Outcome Measures Online Toolbox

Comprehensive Measurement in Afterschool Systems: A “How to” Focus on Youth Skills
Purposes for Skill Measurement
• Community Positioning - Communicate intended outputs and outcomes to internal and external stakeholders
• Performance Improvement - Local performance data supports real-time action for improvement against local norms
• Rigorous Proof - Evaluation design implemented by third party estimates individual growth or program impact

Comprehensive Measurement in Afterschool Systems: A “How to” Focus on Youth Skills
Question for the exemplary sites:
• Please describe your current efforts to assess youth skills in afterschool programs:
– Which purposes – position, performance, proof – are you most focused on?

Social and Emotional Competence A Strategy to Accelerate Student Success
Patricia Nagelkirk, Community Impact DirectorUnited Way of Greater Cincinnati

12
21 funded agency partners in a Learning Community, 22 programs of varying design and purpose operating in numerous sites
Initial Driver:
Common measures and shared databases had provided great value in Greater Cincinnati. In 2011, youth-serving providers agreed to a third attempt to select a common measure
Initial Purposes: Community Positioning - Communicate intended outputs and
outcomes to internal and external stakeholders Performance Improvement - Local performance data supports
real-time action for improvement against local norms
Social and Emotional Competence Creating Common Ground Led to a Community-Wide Strategy

13
Benefits of common measures to providers Aids in communicating the program’s value Demonstrates program’s fit in a broader story of impact Leads to continuous learning and improvement
Benefits to children and families Programs become more effective and impactful Access to services improves when providers can
advocate for “more” based on “what works”
Benefits to United Way and other funders Deepens confidence in investments Increases potential for alignment on outcome reporting Strengthens ability to tell a compelling story to donors
• 2012 – United Way leading two distinct pilots: 1) common measures for social-emotional competencies predictive of academic success and 2) the youth program quality initiative in Cincinnati Public Schools
Developing Common MeasuresEarly Activities: United Way and Funded Partners Created a Case

14
Concepts considered for common measure selection
Academic performance
School attendance
Parenting knowledge and behaviors
Risky behaviors in children
Social and emotional competence in children
Developing Common MeasuresEarly Activities: Scanned Research / Reviewed Funded Programs
15
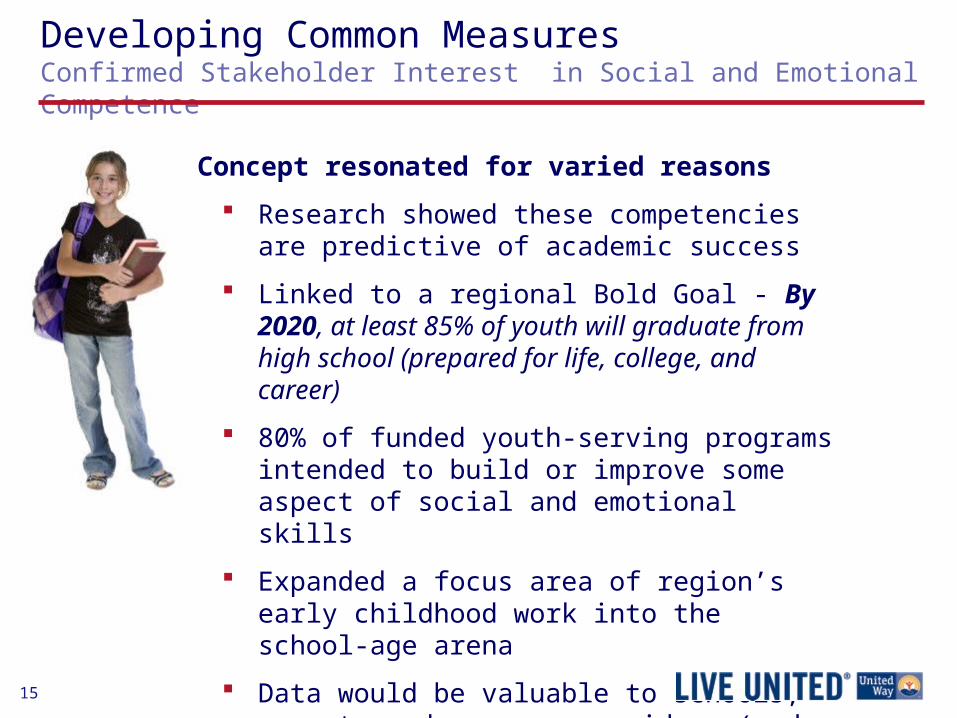
Concept resonated for varied reasons
Research showed these competencies are predictive of academic success
Linked to a regional Bold Goal - By 2020, at least 85% of youth will graduate from high school (prepared for life, college, and career)
80% of funded youth-serving programs intended to build or improve some aspect of social and emotional skills
Expanded a focus area of region’s early childhood work into the school-age arena
Data would be valuable to schools, parents and program providers (and not just the funder)
Developing Common MeasuresConfirmed Stakeholder Interest in Social and Emotional Competence

16
Built our confidence Based on resilience theory and Social Emotional Learning principles Valid and reliable Eight scales of the DESSA grounded in research
- Self-Awareness
- Self-Management
Total score falls into three categories: Strength, Typical, Needs DESSA-mini has a composite score , correlates with DESSA
Suited our needs Measures children in grades K-8 User friendly Cost-effective Applicable to multiple types of programs and settings
Developing Common MeasuresPartner Choice of Tool – the Devereux Student Strengths Assessment
– Social-Awareness
– Relationship Skills
– Goal-Directed Behavior
– Personal Responsibility
– Decision Making
– Optimistic Thinking

17
Programs determined their own reasonable approach to the pilot; measurement ranged from 10 children to over 1000.
Provider interest spurred a second cohort of providers – Cincinnati Public Schools Afterschool programs
Emphasis was on shared learning
Most chose the DESSA-mini
Pilot Year: 2012 - 2013United Way Open to Possibility – Few Restrictions Made on Partners
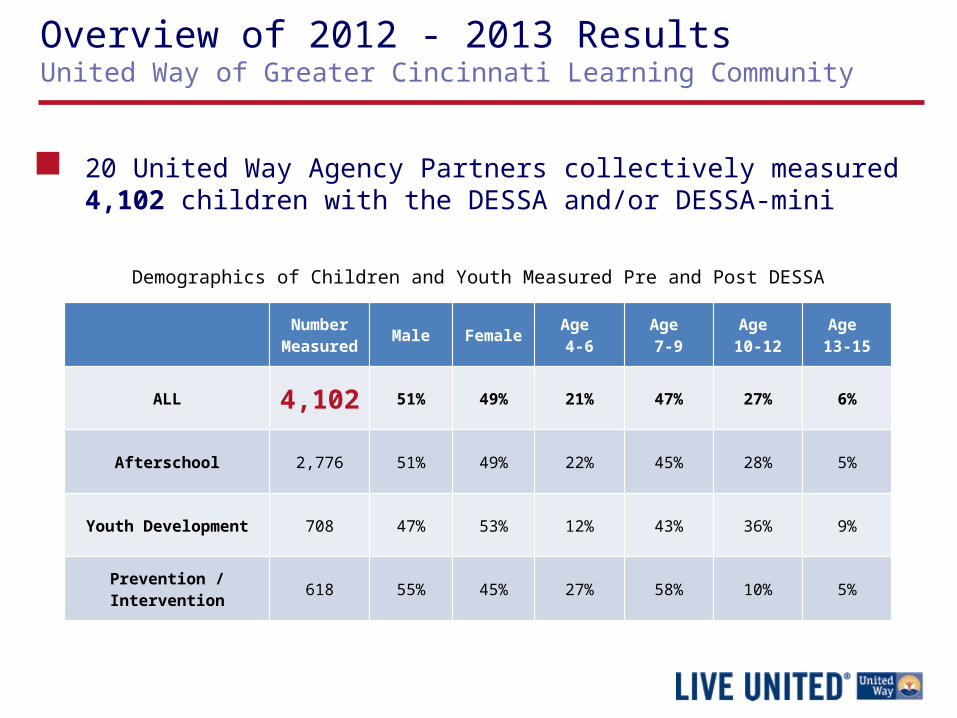
Demographics of Children and Youth Measured Pre and Post DESSA
Number
MeasuredMale Female
Age 4-6
Age 7-9
Age 10-12
Age 13-15
ALL 4,102 51% 49% 21% 47% 27% 6%
Afterschool 2,776 51% 49% 22% 45% 28% 5%
Youth Development 708 47% 53% 12% 43% 36% 9%
Prevention / Intervention 618 55% 45% 27% 58% 10% 5%
Overview of 2012 - 2013 ResultsUnited Way of Greater Cincinnati Learning Community
20 United Way Agency Partners collectively measured 4,102 children with the DESSA and/or DESSA-mini
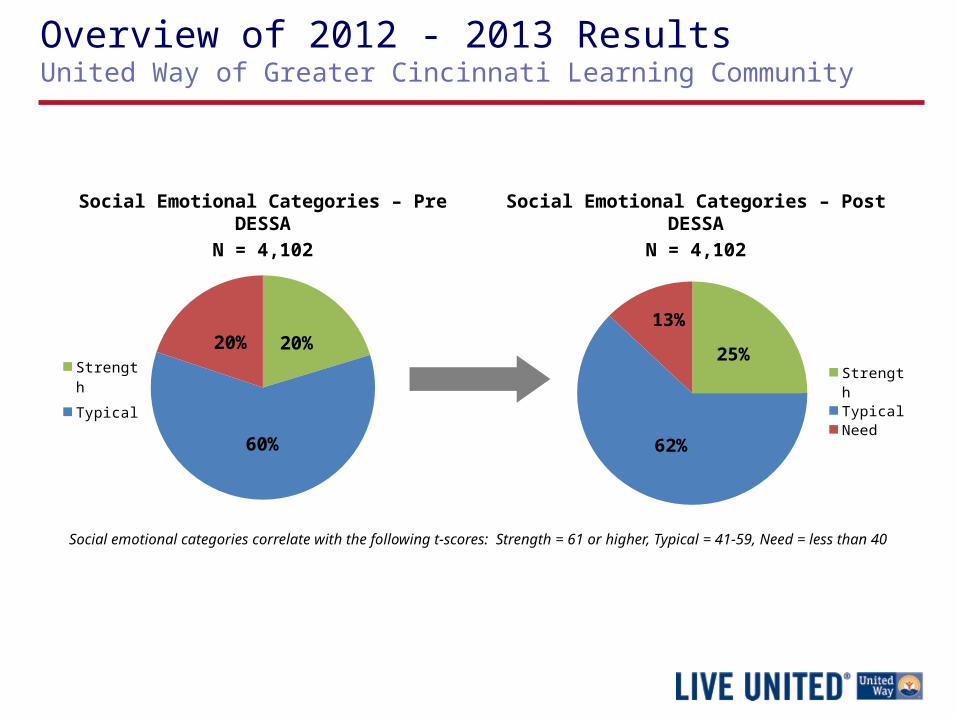
20%
60%
20%Strength
Typical
Need
25%
62%
13%
Strength
Typical
Need
Social Emotional Categories – Pre DESSA
N = 4,102
Social Emotional Categories – Post DESSA
N = 4,102
Social emotional categories correlate with the following t-scores: Strength = 61 or higher, Typical = 41-59, Need = less than 40
Overview of 2012 - 2013 ResultsUnited Way of Greater Cincinnati Learning Community

Pre to Post Comparison of Social Emotional Categories by Program Type
Overview of 2012 - 2013 ResultsUnited Way of Greater Cincinnati Learning Community
Pre
Po
st
Pre
Po
st
Pre
Po
st
Pre
Po
st
ALLN = 4,102
Afterschooln = 2,776
Youth Development
n = 708
Prevention/ Intervention
n = 618
DESSA Normal Dis-
tribution
20%13% 18%
11%22% 16%
25%17% 16%
60%62%
60%64%
62%64%
58%
54%68%
20% 25% 22% 25%16% 20% 17%
28%16%
Need Typical Strength

Change in Social Emotional Competence from Pre to Post DESSA by Program Type
• No assumptions about program effectiveness can be made based on percentage of children demonstrating No Change
• NEW! In 2014, we will capture “negative” change. This was included in “no change” in the past
*
Overview of 2012 – 2013 ResultsUnited Way of Greater Cincinnati Learning Community
Prevention/Intervention
n = 618
Youth Development
n = 708
Afterschooln = 2,776
ALLN = 4,102
45%
50%
52%
50%
11%
18%
11%
12%
13%
11%
8%
9%
31%
21%
29%
28%
No Change Small Change Medium Change Large Change

Cause for celebration
Unexpected buy-in from providers / significant learnings reported
Unexpected groundswell of interest (funders, systems, schools, other program providers)
Shifting tide in community from a sole focus on academic measures of success to inclusion of “softer” measures
Pause to reflect Some challenges in data collection/analysis to connect
Cincinnati Public School afterschool data to academic data Some audiences question the value of our aggregate data as
there is neither a common database nor rigorous evaluation
What WorkedMajor Successes / Unforeseen Barriers

23
Clear accomplishments
Develop capacity in youth programs to collect and use data Build a learning community around social and emotional learning
(plan, implement, improve); examine changes over time Create a compelling message and unified story for stakeholders See if our children have the skills to succeed in school and life
Mixed success
Describe social and emotional competence of children in Greater Cincinnati Region
Link social and emotional data to academic and other data
Compare our community to others
What Worked Reflecting on Objectives Identified in 2012

24
Deepen the learning
Review data submitted May 2014 Share the learnings with internal and external
external audiences Facilitate use of data to support in
real-time action for improvement
Connect social-emotional competence to other data
Continue to assess linkages between DESSA-mini scores, program-specific data and academic measures
Exploring local interest for use in classroom Exploring value of a more rigorous approach to evaluation
Next Steps for Greater CincinnatiSmarter and Better