foliage penetration radar - hour of the timehourofthetime.com/1-lf/foliagepenetrationradar.pdf ·...
TRANSCRIPT

Foliage Penetration radar
This book covers all aspects of foliage penetration (FOPEN) radar for both airborne military systems and earth resource mapping. It is the first book to be published on the subject.
Readers will learn the characteristics of clutter, foliage scattering, and propagation that affect the detection and characterization of vehicles, buildings, and terrain features that are present under trees.
Military radar systems engineers will find methods for using ultrawideband waveform design and analysis for generating signals that will not interfere with emergency or flight safety frequencies, as well as adaptive processing techniques to reconstruct signals in a dense frequency interference environment.
earth resource and remote monitoring planners will use this foundational reference for years to come as they apply this technology for crop monitoring, land mine remediation, creating digital maps under trees, and many other uses of FOPEN radar that will benefit mankind.
KeY teCHniQUeS and teCHnologieS• Ultrawideband waveform design and analysis.• Characteristics of clutter, foliage scattering, and propagation.• Polarization for reduction of false alarms and characterizing vehicles under trees.• Generation of digital elevation maps for “bare earth” under trees.• Image formation processing, emphasizing real time high performance processing,
change detection, and automatic target detection and classification.• Simultaneous SAR and GMTI operation.• Bistatic SAR utilizing a FOPEN GMTI radar’s waveform.
aBoUt tHe aUtHorDr. Mark E. Davis has over 40 years experience in radar technology and systems development. He has held senior management positions in the Defense Advanced Research Projects Agency (DARPA), the Air Force Research Laboratory, and General Electric Aerospace. At DARPA, he was the government program manager on both the foliage penetration radar advanced development program and the GeoSAR foliage penetration mapping radar. He is a Fellow of both the IEEE and Military Sensing Symposia. Dr. Davis has published well over 100 papers in journals and proceedings.
Raleigh, North Carolinawww.scitechpub.com
Davis-7200017 book February 22, 2011 12:47
CHAPTER 2
Foliage Penetration SARCollection Systems2.1 SAR Resolution . . . . . . . . . . . . . . . . . . . . . . . . . . . . . . . . . . . . . . . . . . . . . . . . . 272.2 FOPEN SAR Systems . . . . . . . . . . . . . . . . . . . . . . . . . . . . . . . . . . . . . . . . . . . . 312.3 References . . . . . . . . . . . . . . . . . . . . . . . . . . . . . . . . . . . . . . . . . . . . . . . . . . . . . 54
Both the military and scientific imaging communities learned from the earlyfoliage penetration (FOPEN) developmental RADAR systems operated in thelate-1960 to mid-1970 time frame. Two important system realities affectedthe growth of the technology: (1) foliage attenuation limited the systemsto short-to-medium-range operation; and (2) manned aircraft could not beadequately protected at these ranges. Remotely piloted vehicles (RPV; alsoknown as unmanned air systems, or UAS, in today’s vocabulary) were juststarting to be developed. They would address the ability to collect data inin hospitable environments. More importantly, the development of widebanddata links would enable significant processing and image interpretation on theground.
By the late 1980s, the image collection community had determined thatSAR could provide acceptable and useful detection and characterization offorested regions. These SAR systems required small antennas and modestpower; which was acceptable for experiments and might be possible on RPVinstallations. In 1988, the NASA Jet Propulsion Laboratory started the AIR-SAR program and flew a multiple-frequency SAR platform until 2004 [1].At approximately the same time, several research groups started experimen-tal FOPEN SAR systems, notably Stanford Research Institute (SRI) [2] andSweden’s Defence Research Agency (FOA) [3].
Airborne ground-moving target indication (GMTI) FOPEN RADAR sys-tems were significantly more difficult to implement, especially on airbornemoving platforms. The size of the antenna for both detection and localiza-tion of moving targets prohibited installation on a fixed-wing aircraft. Aspresented in Section 1.1, the X-band SOTAS development verified the ben-efit of stationary rotary wing operation for GMTI RADAR. But the size ofthe antenna at UHF and the lack of unmanned helicopters would not giverise to airborne FOPEN GMTI RADAR for more than 2 decades, when the
23

Davis-7200017 book February 22, 2011 12:47
24 Foliage Penetration SAR Collection Systems
FOPEN reconnaissance, surveillance, tracking, and engagement RADAR(FORESTER) system would be developed for the remotely piloted A-160Hummingbird [4].
With the advances in critical RADAR technologies of wideband waveformgeneration and digital image formation, the community could start the task ofunderstanding the capabilities and limitations of FOPEN SAR. SAR systemswere just starting to gain acceptance in the surveillance community, which hadrelied on high-resolution optical pictures for decades. Figure 2–1 presents themotivation for the need for tactical FOPEN SAR and an advanced look at whatit will provide the operational user—whether it is the military or commercialcustomer of the image products [5]. All four panes in the figure are of thesame scene; a forested region with several vehicles parked under the foliageand in the tree lines, but collected with different imaging technologies. On theleft is a moderate to high-resolution optical picture, but the vehicles cannotbe observed until the sensor is nadir looking.
The next image to the right is a typical 1 meter resolution X-band image ofthe scene taken on the same day. Sporadic detections were obtained, but onlywhen the glint of targets could be captured in the image. Neither of these twoimage products would satisfy the user, especially when high area coveragerate is needed. The next two images to the right, which are UHF and VHF SARimages, show a more optimistic ability to detect the fixed targets. The UHF
FIGURE 2--1
Comparison of optical and several RADAR image sourcesSource: MIT Lincoln Laboratory [5]

Davis-7200017 book February 22, 2011 12:47
Foliage Penetration SAR Collection Systems 25
panel shows images of many of the man-made targets but high false alarmswith the foliage clutter in the scene. The detection at VHF is higher wherethe foliage attenuation is significantly lower and the target cross sections arelarger than the clutter. However, there is limited resolution (i.e., pixels ontarget) to characterize the objects in the image.
This realization of reliable imaging capabilities for FOPEN SAR was im-portant. It started a 5-year campaign to recharacterize the foliage clutter so thatbetter SAR system engineering could be made possible. It was also realizedat that time that a better understanding of the foliage scattering phenomenol-ogy would derive civilian uses for the systems. There was a definite dual-usemessage in the development objectives in the early 1990s.
Every new FOPEN RADAR system developed needed to answer the ques-tion of “why VHF or UHF?” This question is easy to answer. Optical pho-tographs and microwave RADARs cannot reliably detect man-made objectsthat have been hidden in the dense forest cover. Two emerging technologieswere being developed that could reduce the unreliable detection of targets un-der foliage. The first technology was ultra wideband (UWB) waveforms thatwould enable high-resolution SAR images at both VHF and UHF frequencies.The second technology was use of polarization of the RADAR signal in theFOPEN SAR processing.
High-resolution imagery serves two purposes: (1) provide a better sepa-ration of the object scattering from the background clutter; and (2) providemore detail of scattering of objects for characterization. In applications forfoliage or terrain characterization, this factor is not as strong a motivation.However, to find a small vehicle or a buried land mine, image resolution is amajor consideration.
Polarization diversity has been evolving as a significant capability forboth target detection and characterization of terrain and man-made objects. Ifcharacterization is an important system objective, then polarization must befactored into the system waveform and processing approach from the start.
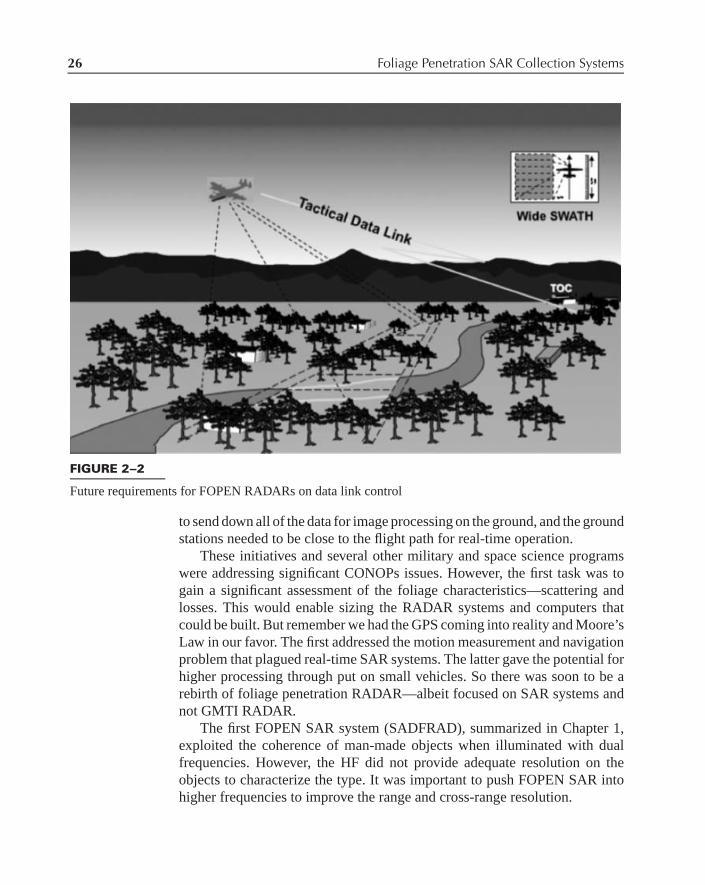
The system engineering task was for not only the FOPEN SAR design butalso the concept of operations (CONOPS), as illustrated in Figure 2–2.Therelevant questions were how much of the system:
■ Could be installed on either a small manned or unmanned vehicle?■ Could be processed in real time and onboard the UAS?■ Needed motion measurement and compensation for collection geo-
metries?
The global positioning system (GPS) was not generally available at that time;so inertial measurement and guidance systems were stressed for the long dataruns while obtaining a strip map.Tactical data links did not have the bandwidth
Davis-7200017 book February 22, 2011 12:47
26 Foliage Penetration SAR Collection Systems
FIGURE 2--2
Future requirements for FOPEN RADARs on data link control
to send down all of the data for image processing on the ground, and the groundstations needed to be close to the flight path for real-time operation.
These initiatives and several other military and space science programswere addressing significant CONOPs issues. However, the first task was togain a significant assessment of the foliage characteristics—scattering andlosses. This would enable sizing the RADAR systems and computers thatcould be built. But remember we had the GPS coming into reality and Moore’sLaw in our favor. The first addressed the motion measurement and navigationproblem that plagued real-time SAR systems. The latter gave the potential forhigher processing through put on small vehicles. So there was soon to be arebirth of foliage penetration RADAR—albeit focused on SAR systems andnot GMTI RADAR.
The first FOPEN SAR system (SADFRAD), summarized in Chapter 1,exploited the coherence of man-made objects when illuminated with dualfrequencies. However, the HF did not provide adequate resolution on theobjects to characterize the type. It was important to push FOPEN SAR intohigher frequencies to improve the range and cross-range resolution.
Davis-7200017 book February 22, 2011 12:47
2.1 SAR Resolution 27
Both applications provided strong existence proof of the utility of VHF andUHF propagation through forests and the detection mechanism.However, thedevelopment of efficient signal processors and the ability to counter the effectsof moving clutter and radio frequency interference (RFI) needed significantdevelopment. These capabilities were more than a decade in the future.
This chapter will give details on early FOPEN SAR data collection sys-tems built for both civilian and military experimental evaluation. We will firstrevisit the merits of VHF and UHF for foliage penetration operation. Both areeffective for part of the detection and characterization of foliage and of man-made objects under foliage. Understanding the relative merits was importantin choice of frequency, bandwidth, and polarization for the several prototypesystems.
2.1 SAR Resolution
Synthetic aperture RADAR (SAR) obtains fine resolution for groundimages through two effects. The range resolution δR , similar to conventionalRADARs, is obtained primarily by the bandwidth of the waveform B. Cross-range resolution is obtained by a physical antenna angular pattern and theability to coarsely resolve objects within the real beam. However, for finecross-range resolution, it is necessary to form a synthetic aperture length byflying a length L and coherently integrating the returns to obtain the resolu-tion δC R . This is especially true for imaging from VHF and UHF RADARs,where real beam apertures with any reasonable angular pattern would be im-practical on airborne platforms. This section will treat the basic factors forobtaining resolution in range and cross-range with a SAR system. The exten-sion to an UWB SAR will be developed in more detail in Chapter 3 for UWBphenomenology and in Chapter 4 for UWB SAR image formation.
The range resolution δR of a pulse in the slant plane is directly related tothe bandwidth of the RADAR and any weighting to reduce the range sidelobelevels by [6]
δR = kRc
2B cos γg(2.1)
where:c Speed of light;B Bandwidth of the waveform;kR Range broadening factor due to aperture weighting;γg Grazing angle with respect to the local terrain.
Normally, a SAR system will illuminate the ground at small grazing angles,and the range resolution is determined primarily by the waveform bandwidth.

Davis-7200017 book February 22, 2011 12:47
28 Foliage Penetration SAR Collection Systems
Grazing(deg)
6040200
Ran
ge R
esol
utio
n (m
eter
s)
Bandwidth (MHz)
10
0.10
1.00
10.00
40 70 100
130
160
190
220
250
280
310
340
370
400
430
460
490
520
550
580
610
640
FIGURE 2--3
Ground range resolutionversus signal bandwidth andgrazing angle
However, for foliage penetration RADAR higher grazing angles is importantfor providing less foliage loss and better signal-to-clutter ratio. So at highergrazing angles the target signal return has the potential to be enhanced rel-ative to the background clutter but with a reduction in ground plane rangeresolution. Figure 2–3 illustrates the ground plane resolution for VHF andUHF waveforms as a function of bandwidth and grazing angle.
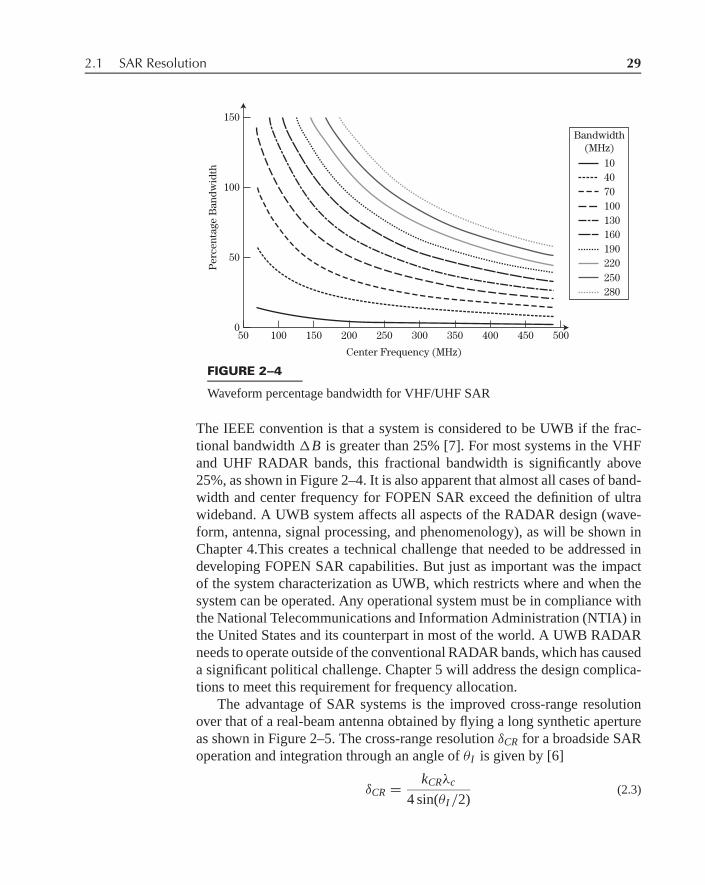
Figure 2–3 illustrates the importance of bandwidth when compared withthe carrier frequency as well as the importance to range resolution. For resolu-tions under a meter, the required bandwidth is above 150 MHz, independent ofany range sidelobe weighting. Since the FOPEN SAR must operate at centerfrequencies comparable to the signal bandwidth, it was necessary to considerthe impact of fractional bandwidth on the system design to achieve fine-rangeresolution.
The bandwidth of the signal waveform extends from the low-frequencycomponent fL to the high frequency fH . If a uniform distribution of thesignal spectral density is assumed, the bandwidth B is the difference betweenfH and fL . This spectral density is determined by the transmit waveformgeneration and any spectral effects that are provided by the antenna systemdispersion.The fractional bandwidth �B of the system is calculated by theratio of the bandwidth B to the center frequency
�B = 2( fH − fL )
( fH + fL )(2.2)
Davis-7200017 book February 22, 2011 12:47
2.1 SAR Resolution 29
50 100 150 200 250 300
Center Frequency (MHz)
350 400 450 5000
50
Per
cent
age
Ban
dwid
th
100
150
Bandwidth(MHz)
104070100130160190220250280
FIGURE 2--4
Waveform percentage bandwidth for VHF/UHF SAR
The IEEE convention is that a system is considered to be UWB if the frac-tional bandwidth �B is greater than 25% [7]. For most systems in the VHFand UHF RADAR bands, this fractional bandwidth is significantly above25%, as shown in Figure 2–4. It is also apparent that almost all cases of band-width and center frequency for FOPEN SAR exceed the definition of ultrawideband. A UWB system affects all aspects of the RADAR design (wave-form, antenna, signal processing, and phenomenology), as will be shown inChapter 4.This creates a technical challenge that needed to be addressed indeveloping FOPEN SAR capabilities. But just as important was the impactof the system characterization as UWB, which restricts where and when thesystem can be operated. Any operational system must be in compliance withthe National Telecommunications and Information Administration (NTIA) inthe United States and its counterpart in most of the world. A UWB RADARneeds to operate outside of the conventional RADAR bands, which has causeda significant political challenge. Chapter 5 will address the design complica-tions to meet this requirement for frequency allocation.
The advantage of SAR systems is the improved cross-range resolutionover that of a real-beam antenna obtained by flying a long synthetic apertureas shown in Figure 2–5. The cross-range resolution δCR for a broadside SARoperation and integration through an angle of θI is given by [6]
δCR = kCRλc
4 sin(θI /2)(2.3)

Davis-7200017 book February 22, 2011 12:47
30 Foliage Penetration SAR Collection Systems
�I �CR
FIGURE 2--5
SAR geometry forcross-range resolution
where:kCR Cross-range broadening factor due to aperture weighting;λc Wavelength of the RADAR’s center frequency;θI Azimuthal integration angle during SAR image formation.
For VHF and UHF frequencies, the angles needed to get significant resolu-tion are very large. As a result, both the fractional bandwidth and the integra-tion angle are UWB compared with conventional microwave frequency SARsystems. The achievable cross-range resolution as a function of the frequencyand integration angles is detailed in Figure 2–6. For VHF it is necessary to have
Frequency(MHz)
70140210280350420490
Res
olut
ion
(met
ers)
0.1
1.0
10.0
5 10 15 20 25 30 35
Integration Angle (degree)
40 45 50 55 60 65 70 75
FIGURE 2--6
SAR resolution with variable integration angle and frequency
Davis-7200017 book February 22, 2011 12:47
2.2 FOPEN SAR Systems 31
an integration angle over 45 degrees to obtain better than 5 meters of cross-range resolution. An integration angle this large posed a major developmentin system requirements for the integration times, motion measurement, andmotion compensation, as well as achieving the comparable range resolution.
The FOPEN SAR data collection systems built in the 1990s had to factorthese issues into many aspects of the RADAR design. The remaining parts ofthis chapter will summarize the differences in design chosen by the airborneRADARs used to demonstrate the capabilities for detecting man-made objectsunder dense foliage and buried in shallow ground.
2.2 FOPEN SAR Systems
The early FOPEN SAR systems were developed for detecting and character-izing objects under both foliage and through ground penetration. The lattercapability was important, as demining operations were required after mili-tary actions in war-torn areas. In addition, for finding objects that have beenhidden, the systems’long wavelengths and polarimetric sensing found use-fulness in characterizing land use, land cover, and terrain elevation in manygeographic areas.
Significant progress was made in the design of antennas and transmittersfor FOPEN SAR. The antennas needed to have wide azimuth coverage toenable the requisite illumination angle for achieving the desired cross-rangeresolution. They also needed to have an efficient match to the transmit wave-form over a very large bandwidth to support the range resolution. As willbe shown in the following two chapters, polarization has found an importantplace in FOPEN SAR for characterization of the clutter and objects. ProvidingUWB polarimetric antennas was an early challenge. The design of the transmitwaveform and match to the antenna was also important to limit the spectraltransmission as controlled by the need for frequency allocation constraints.These early systems addressed the technical obstacles that were important inthe design and use of operational FOPEN SAR systems.
Several early FOPEN SAR systems were developed and flown in the early1990s. They represent significantly different approaches for image formationprocessing, the details of which will be presented in Chapter 4. They alsoprovided extensive data on the characterization of both the clutter and thedetection of objects under and near the clutter. The five RADARs illustratedin the following sections present a wide variation in frequency, waveformdesign, image processing, and the use of polarization. Four of the systemshave been installed on fixed wing aircraft, which vary widely in size andspeed. Two were multiengine planes that allowed onboard signal processingand real-time observation of the data during flight, and two were flown on small
Davis-7200017 book February 22, 2011 12:47
32 Foliage Penetration SAR Collection Systems
Table 2--1 Comparison of technology from FOPEN SAR experimentalsystems
FOLPEN II Carabas II P3 UWB GeoSAR BoomSAR
Waveform Impulse Freq Jump Notched LFM Notched LFM ImpulseFrequency 200–400 20–80 225–740 280–460 50–1100
MHZPolarization HH HH HH, HV, VV HH, HV or VV Full PolTransmit N/A Freq Notch Notch N/A
RFI SequenceImage Back Back RMA INSAR Back
Formation Projection Projection Projection
tactical aircraft with onboard data recording and subsequent image formationprocessing and analysis after the flight.
Much had to be learned to refine the eventual design objective of instal-lation on unmanned air vehicles for operation over remote, and often hostile,environments. The fifth RADAR system to be examined was an instrumenta-tion RADAR installed on a computer controlled “cart” that would providedperformance verification of target characterization by allowing high dynamicrange collection of both foliage and ground penetration data.
Each of these experimental FOPEN SAR systems embodied a newtechnology that had the potential for enabling operational system design.Table 2–1 summarizes the critical technologies employed in the design anddevelopment of each of the systems. The critical RADAR designs and appli-cations, along with the sections that cover their design, include:
■ Impulse waveform: (Sections 2.2.4 and 4.2) A very narrow pulse that haswide spectral content
■ Frequency jump burst (FJB): (Section 5.1.2) A waveform that covers therequired bandwidth by incremental transmission of narrowband pulses,combined with coherent reconstruction
■ Notched linear frequency modulation (LFM): (Section 5.1.3) Use of anLFM waveform over a wide bandwidth, with narrow regions of exclusionof critical frequencies
■ Polarization: (Sections 3.4 and 6.1.1) Transmitting one linear polarizationand receiving one or more polarizations. The first letter is the transmit po-larization, and the second is the receive polarization (e.g., HV is transmithorizontal and receive vertical)
■ Back projection algorithm (BPA): (Section 4.3.1) An image formationprocess that directly, coherently adds the contribution of each pulse to the
Davis-7200017 book February 22, 2011 12:47
2.2 FOPEN SAR Systems 33
appropriate image resolution cell, after appropriate motion compensationfor the imaging platform position and orientation.
■ Range migration algorithm (RMA): (Section 4.3.2) The image formationprocess that uses a two-dimensional mapping of range and Doppler cur-vature during the imaging process to provide efficient image formationprocessing
■ Interferometric SAR (InSAR): (Sections 2.2.3 and 8.4) The technique offorming two SAR images, displaced by a distance to enhance differencesin either the terrain height or surface target motion for image processing
Details of these technologies and their experimental results for clutter andtarget characterization will be covered in subsequent chapters.
Significant publication of the design details and results occurred in thatdecade. As a result, the lessons have been shared and formed the designsof more recent systems for the next decade. Several SAR data collectionsprovided comparison on the same terrain and objects. These collections willbe covered in Chapter 3 along with the characterization of foliage clutter andattenuation. One of those collections included both an X-band and a UWBUHF collection over Camp Roberts in California to evaluate both foliagepenetration and digital elevation model (DEM) generation. The image is of asmall segment of the wooded area shown in Figure 2–7.
FIGURE 2--7
Comparison of X-band and UHF SAR images—forested hide position [5]
Davis-7200017 book February 22, 2011 12:47
34 Foliage Penetration SAR Collection Systems
The first image, Figure 2–7a, is an X-band SAR made by the ERIMIFSARE system to provide high area coverage rate DEM with fine eleva-tion accuracy [8]. This image was collected on the same day that severalmilitary vehicles were been placed under the foliage area known as “Sher-wood Forest.” It is apparent that only the tops of the trees are visible in theX-band image.
The second image, shown in Figure 2–7b, was collected with the UWBP-3 FOPEN SAR, also built by ERIM [9]. The three tactical targets under thefoliage were revealed only in the UHF image and at horizontal polarization.However, it is clear that false alarm rates would be very high if only thehorizontal polarization image were to be used. It should be noted that thestrong return in the foreground was from one of the instrumentation trihedralsdeployed to calibrate the multiple polarization sensitivity.
This comparison of X-band and UHF SAR provides sufficient evidenceto many operational users of the importance of UWB SAR at VHF or UHFfor detecting man-made objects under foliage. However, it was as importantto quantify the performance with available technology prior to developmentof an operational system. The next five sections provide the quantitative per-formance of the experimental FOPEN SAR systems employed from 1990 to1998 to obtain support for these important system developments.
2.2.1 SRI’s FOLPEN RADARsOne of the first FOPEN SAR systems to be built was the FOLPEN series thatwas developed by SRI. The FOLPEN II and FOLPEN III systems, shownin Figure 2–8, were both based on a very high peak voltage impulse trans-mitter. This was an effective source of UWB RADAR signal, whose spectral
FIGURE 2--8
SRI FOLPEN RADAR platforms employing impulse transmitters ©1989 IEEE [2] ©1991 IEEE [10]
Davis-7200017 book February 22, 2011 12:47
2.2 FOPEN SAR Systems 35
characteristics were determined by the impulse shape and the interface to theantenna assembly. Because the pulses were only a few nanoseconds in length,the average power of this RADAR was very limited.
FOLPEN II was used in early trials for foliage characterization and fordemonstrating land mine remediation [2]. The short-range operation was notan issue. As the need for wide area coverage and target discrimination evolved,SRI developed a two-channel polarimetric system (FOLPEN III) that wouldalternate horizontal and vertical polarization transmissions [10].
The earlier FOLPEN II system was limited to 200 MHz bandwidth, ornominally 1 meter resolution, due to the limited match between the impulsetransmitter and the multiple dipole antennas under the wing of the aircraft.The later FOLPEN III system was improved to 0.5 meter resolution, with thecloser coupling of the transmitter to the multiple polarization ridge waveguideantenna.
SRI pioneered using the BPA for image formation processing. By com-bining the aircraft navigation measurement with a differential GPS, they wereable to form moderately wide swath images with very good image quality.The later operation of FOLPEN III also included a real-time image formationprocessor followed by a target detection system [11]. Characteristics of theFOLPEN RADARs are summarized in Table 2-2.
The FOLPEN II RADAR participated in the 1993 Maine collection cam-paign. The collection scenario included several trucks in a narrow forest roadto determine both the clutter characteristics and the ability to detect and char-acterize man-made objects. The SRI RADAR provided high-quality SARimages as indicated in the figure, found on the SRI Web site. These clutterdata were analyzed by MIT Lincoln Laboratory and are included in the clutterscattering and loss characteristics shown in Section 3.3.
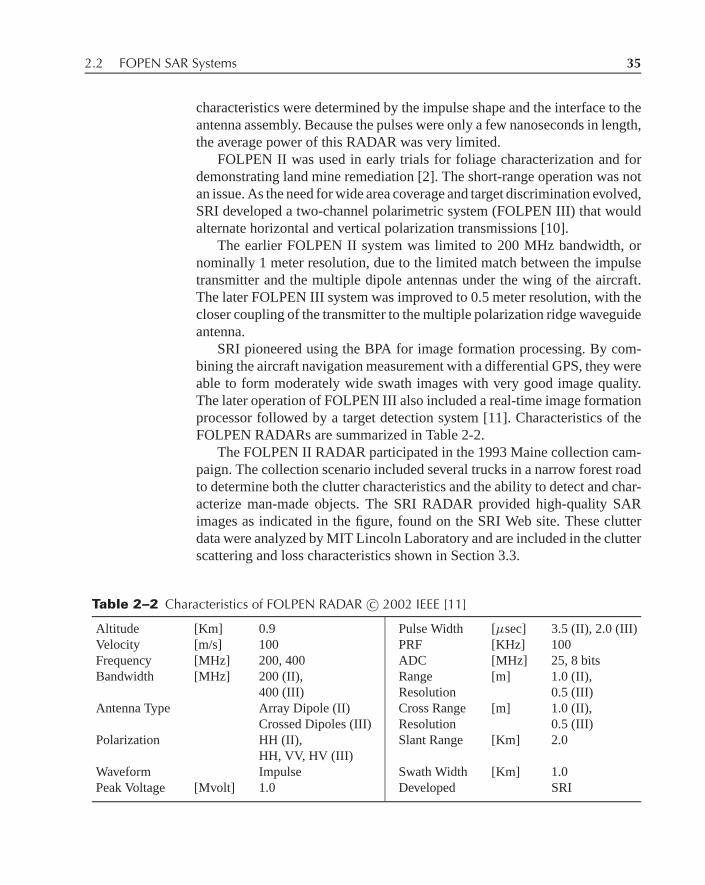
Table 2--2 Characteristics of FOLPEN RADAR c© 2002 IEEE [11]
Altitude [Km] 0.9 Pulse Width [μsec] 3.5 (II), 2.0 (III)Velocity [m/s] 100 PRF [KHz] 100Frequency [MHz] 200, 400 ADC [MHz] 25, 8 bitsBandwidth [MHz] 200 (II), Range [m] 1.0 (II),
400 (III) Resolution 0.5 (III)Antenna Type Array Dipole (II) Cross Range [m] 1.0 (II),
Crossed Dipoles (III) Resolution 0.5 (III)Polarization HH (II), Slant Range [Km] 2.0
HH, VV, HV (III)Waveform Impulse Swath Width [Km] 1.0Peak Voltage [Mvolt] 1.0 Developed SRI
Davis-7200017 book February 22, 2011 12:47
36 Foliage Penetration SAR Collection Systems
FIGURE 2--9
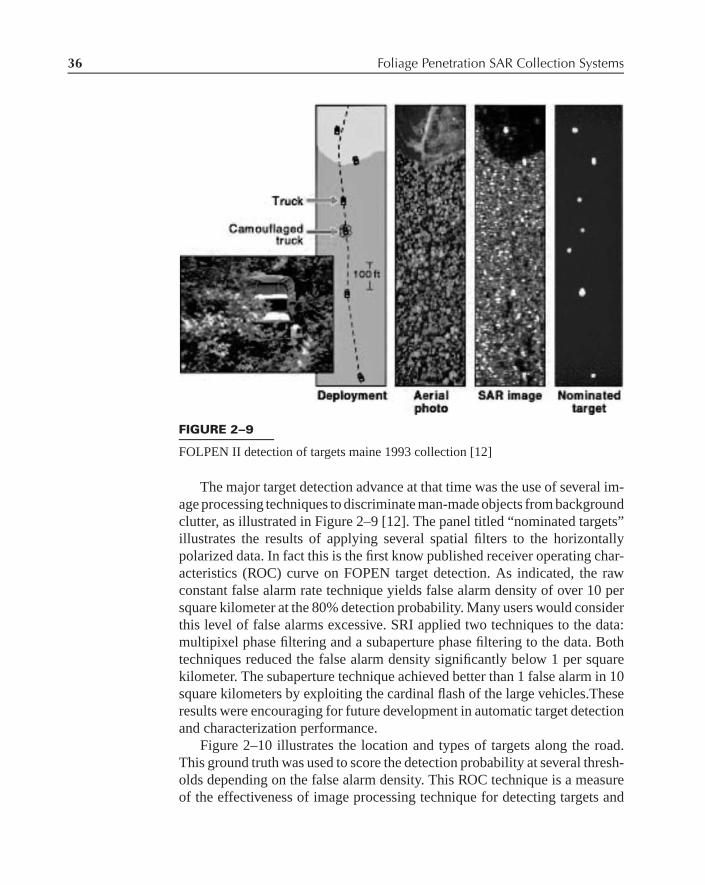
FOLPEN II detection of targets maine 1993 collection [12]
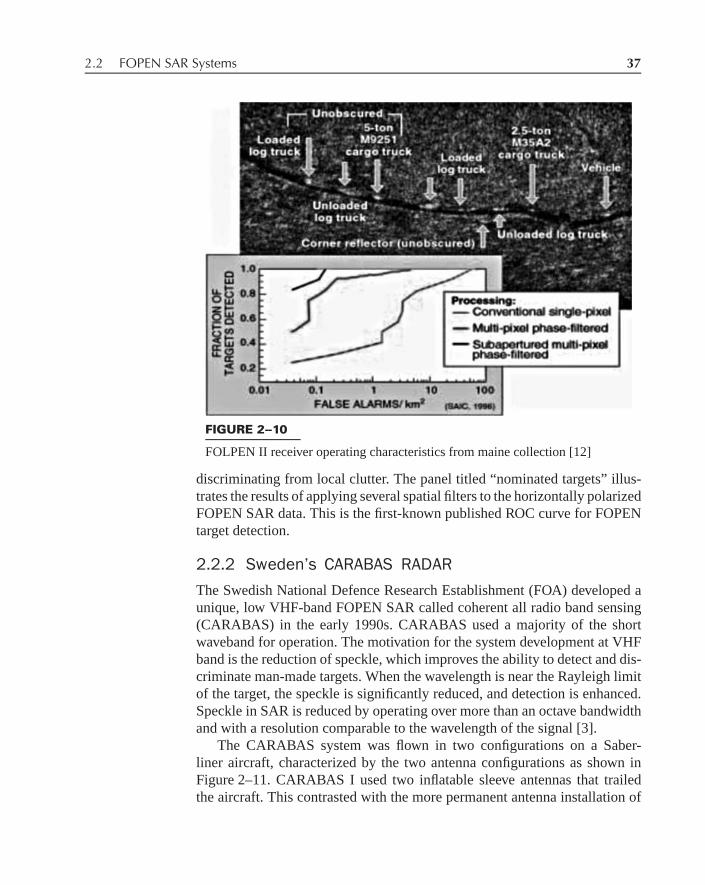
The major target detection advance at that time was the use of several im-age processing techniques to discriminate man-made objects from backgroundclutter, as illustrated in Figure 2–9 [12]. The panel titled “nominated targets”illustrates the results of applying several spatial filters to the horizontallypolarized data. In fact this is the first know published receiver operating char-acteristics (ROC) curve on FOPEN target detection. As indicated, the rawconstant false alarm rate technique yields false alarm density of over 10 persquare kilometer at the 80% detection probability. Many users would considerthis level of false alarms excessive. SRI applied two techniques to the data:multipixel phase filtering and a subaperture phase filtering to the data. Bothtechniques reduced the false alarm density significantly below 1 per squarekilometer. The subaperture technique achieved better than 1 false alarm in 10square kilometers by exploiting the cardinal flash of the large vehicles.Theseresults were encouraging for future development in automatic target detectionand characterization performance.
Figure 2–10 illustrates the location and types of targets along the road.This ground truth was used to score the detection probability at several thresh-olds depending on the false alarm density. This ROC technique is a measureof the effectiveness of image processing technique for detecting targets and
Davis-7200017 book February 22, 2011 12:47
2.2 FOPEN SAR Systems 37
FIGURE 2--10
FOLPEN II receiver operating characteristics from maine collection [12]
discriminating from local clutter. The panel titled “nominated targets” illus-trates the results of applying several spatial filters to the horizontally polarizedFOPEN SAR data. This is the first-known published ROC curve for FOPENtarget detection.
2.2.2 Sweden’s CARABAS RADARThe Swedish National Defence Research Establishment (FOA) developed aunique, low VHF-band FOPEN SAR called coherent all radio band sensing(CARABAS) in the early 1990s. CARABAS used a majority of the shortwaveband for operation. The motivation for the system development at VHFband is the reduction of speckle, which improves the ability to detect and dis-criminate man-made targets. When the wavelength is near the Rayleigh limitof the target, the speckle is significantly reduced, and detection is enhanced.Speckle in SAR is reduced by operating over more than an octave bandwidthand with a resolution comparable to the wavelength of the signal [3].
The CARABAS system was flown in two configurations on a Saber-liner aircraft, characterized by the two antenna configurations as shown inFigure 2–11. CARABAS I used two inflatable sleeve antennas that trailedthe aircraft. This contrasted with the more permanent antenna installation of
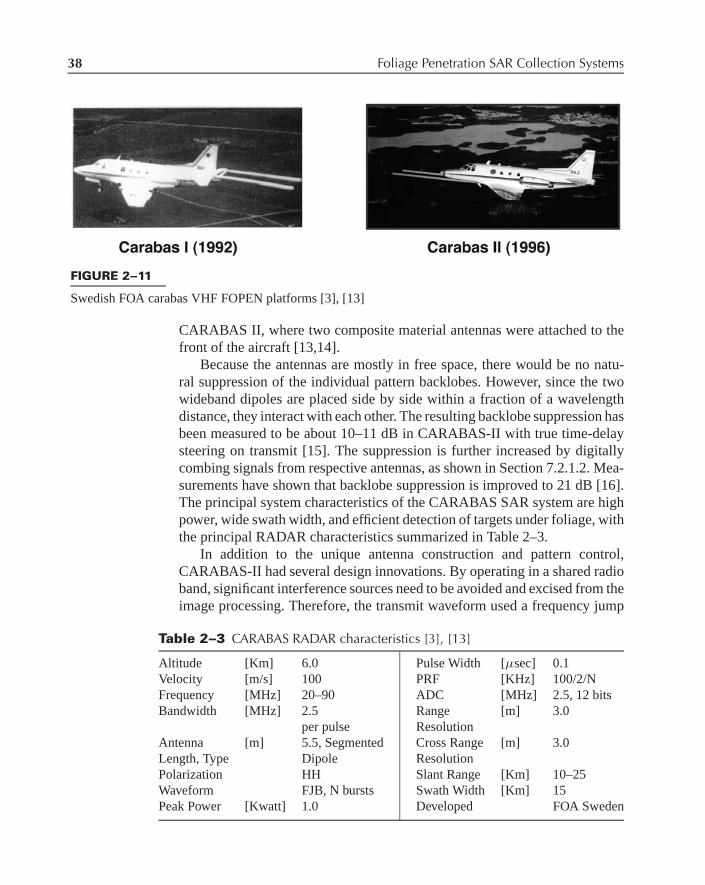
Davis-7200017 book February 22, 2011 12:47
38 Foliage Penetration SAR Collection Systems
FIGURE 2--11
Swedish FOA carabas VHF FOPEN platforms [3], [13]
CARABAS II, where two composite material antennas were attached to thefront of the aircraft [13,14].
Because the antennas are mostly in free space, there would be no natu-ral suppression of the individual pattern backlobes. However, since the twowideband dipoles are placed side by side within a fraction of a wavelengthdistance, they interact with each other. The resulting backlobe suppression hasbeen measured to be about 10–11 dB in CARABAS-II with true time-delaysteering on transmit [15]. The suppression is further increased by digitallycombing signals from respective antennas, as shown in Section 7.2.1.2. Mea-surements have shown that backlobe suppression is improved to 21 dB [16].The principal system characteristics of the CARABAS SAR system are highpower, wide swath width, and efficient detection of targets under foliage, withthe principal RADAR characteristics summarized in Table 2–3.
In addition to the unique antenna construction and pattern control,CARABAS-II had several design innovations. By operating in a shared radioband, significant interference sources need to be avoided and excised from theimage processing. Therefore, the transmit waveform used a frequency jump
Table 2--3 CARABAS RADAR characteristics [3], [13]
Altitude [Km] 6.0 Pulse Width [μsec] 0.1Velocity [m/s] 100 PRF [KHz] 100/2/NFrequency [MHz] 20–90 ADC [MHz] 2.5, 12 bitsBandwidth [MHz] 2.5 Range [m] 3.0
per pulse ResolutionAntenna [m] 5.5, Segmented Cross Range [m] 3.0Length, Type Dipole ResolutionPolarization HH Slant Range [Km] 10–25Waveform FJB, N bursts Swath Width [Km] 15Peak Power [Kwatt] 1.0 Developed FOA Sweden
Davis-7200017 book February 22, 2011 12:47
2.2 FOPEN SAR Systems 39
burst of up to 37 frequencies, with the first center frequency at 21.25 MHz anda 1.875 MHz step to cover the nominal band 20–90 MHz. The sequenceand spacing of the frequency steps were maintained between CARABAS-Iand CARABAS-II. However, in the later system, notching in the individualsteps was used to avoid the radio frequency interference. A wide dynamicrange analog-to-digital converter (ADC) provided very good imagery, evenin the presence of RFI [17].
The maximum bandwidth of CARABAS II operation was 70 MHz, yield-ing a 3 meter range resolution. Typically the collection angle was 60 degrees,providing a corresponding 3 meter azimuth resolution.The high peak powerprovides moderately long-range SAR maps, and use of BPA image formationprocessing enables wide swath operation. These characteristics of the VHFsystem design provided for the high area coverage rate of 1 km2/sec [17].
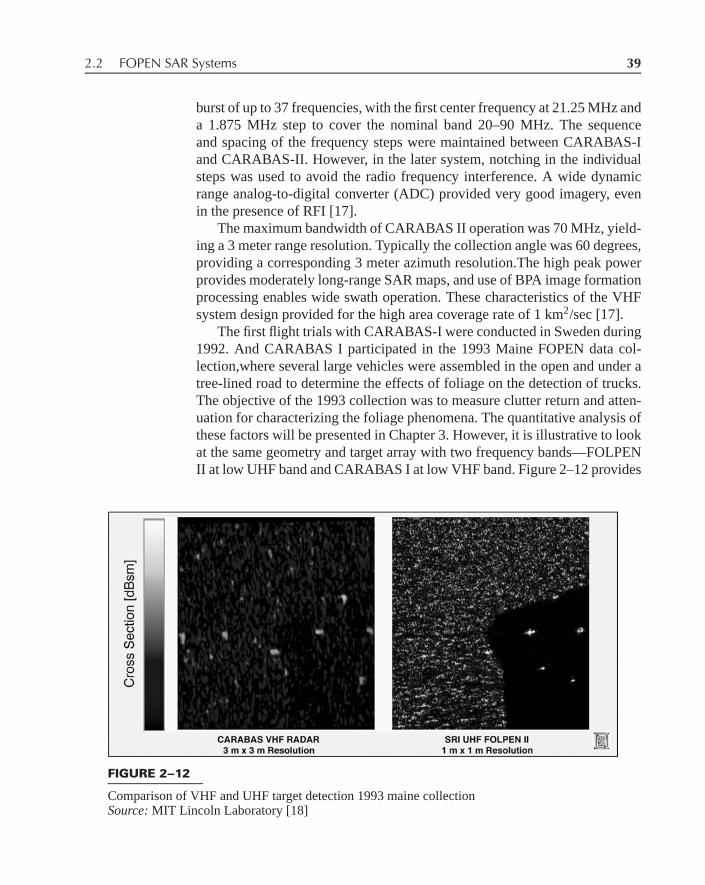
The first flight trials with CARABAS-I were conducted in Sweden during1992. And CARABAS I participated in the 1993 Maine FOPEN data col-lection,where several large vehicles were assembled in the open and under atree-lined road to determine the effects of foliage on the detection of trucks.The objective of the 1993 collection was to measure clutter return and atten-uation for characterizing the foliage phenomena. The quantitative analysis ofthese factors will be presented in Chapter 3. However, it is illustrative to lookat the same geometry and target array with two frequency bands—FOLPENII at low UHF band and CARABAS I at low VHF band. Figure 2–12 provides
FIGURE 2--12
Comparison of VHF and UHF target detection 1993 maine collectionSource: MIT Lincoln Laboratory [18]

Davis-7200017 book February 22, 2011 12:47
40 Foliage Penetration SAR Collection Systems
a side-by-side comparison of images from the two collection platforms. MITLincoln Laboratory carried out independent image formation processing andcalibration on recorded data from both platforms based on the respective SARsystem characteristics and recorded navigation data.As such this should be areal comparison of the phenomenology at two collection frequencies [18].
The attenuation on the targets in foliage is significantly less in VHF thanUHF, as is the clutter return. However, the targets in the low UHF band imageexhibit strong scattering characteristics that were considered as discriminationfor target characterization. These two points will be presented in Chapter 3 inmore quantitative detail.
CARABAS II also participated in the 1997 Keystone collection in Pennsyl-vania and demonstrated the improvements in performance of the intervening4 years. The major difference between the two was the change in the antennato rigid booms and refinement in signal processing. Other noteworthy differ-ences were (1) average power significantly increased (10 dB) by introducinglinear frequency modulation in each pulse; (2) Doppler aliasing above 55MHz eliminated by increasing effective PRF (one side illumination only andfewer frequency steps); and (3) narrowband notching introduced on transmit.
The images shown in Figure 2–13 provide further evidence of the benefitof VHF on target detection in foliage clutter. They are of different geographiclocations and a different array of targets; however, both have essentially the
FIGURE 2--13
Comparison of CARABAS I and CARABAS II target detectionSource: MIT Lincoln Laboratory [18]
Davis-7200017 book February 22, 2011 12:47
2.2 FOPEN SAR Systems 41
same image resolution. The image on the left was from CARABAS I andillustrates enhanced target cross section and lower clutter in low VHF band.The trucks were easily discerned from the cultural clutter providing gooddetection probability. In the image on the right, the focus of the foliage returnsappears to be sharper than in the earlier collection. In addition, it is clear thatthe ability to cancel the RFI has been improved. The area in the middle ofthe scene is a clearing in the trees, and the noise equivalent σ0 has beenimproved by approximately 7 dB. Unfortunately, no quantitative analysis ofthese observations was carried out.
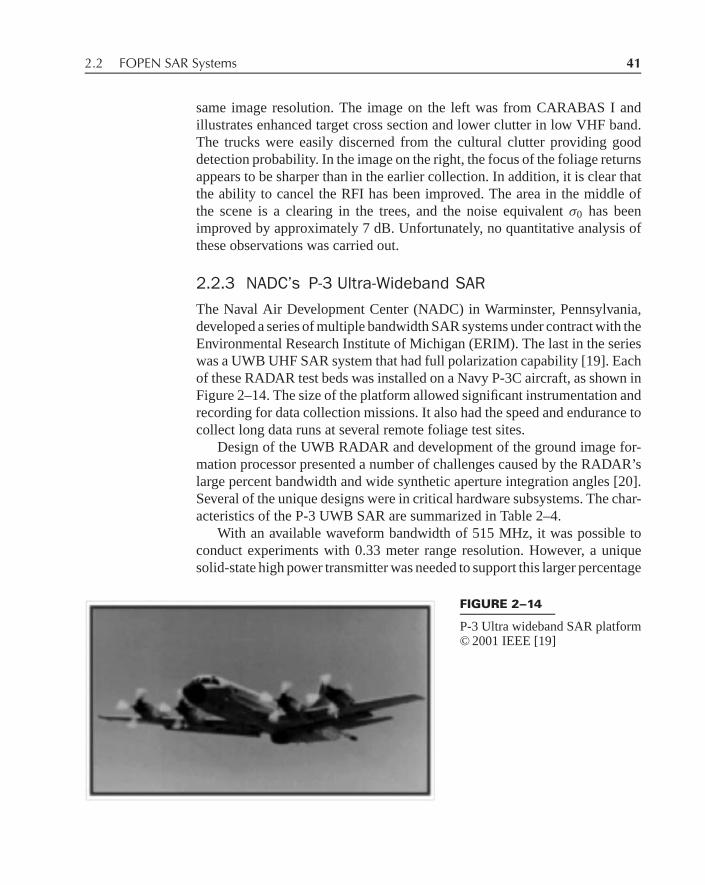
2.2.3 NADC’s P-3 Ultra-Wideband SARThe Naval Air Development Center (NADC) in Warminster, Pennsylvania,developed a series of multiple bandwidth SAR systems under contract with theEnvironmental Research Institute of Michigan (ERIM). The last in the serieswas a UWB UHF SAR system that had full polarization capability [19]. Eachof these RADAR test beds was installed on a Navy P-3C aircraft, as shown inFigure 2–14. The size of the platform allowed significant instrumentation andrecording for data collection missions. It also had the speed and endurance tocollect long data runs at several remote foliage test sites.
Design of the UWB RADAR and development of the ground image for-mation processor presented a number of challenges caused by the RADAR’slarge percent bandwidth and wide synthetic aperture integration angles [20].Several of the unique designs were in critical hardware subsystems. The char-acteristics of the P-3 UWB SAR are summarized in Table 2–4.
With an available waveform bandwidth of 515 MHz, it was possible toconduct experiments with 0.33 meter range resolution. However, a uniquesolid-state high power transmitter was needed to support this larger percentage
FIGURE 2--14
P-3 Ultra wideband SAR platform© 2001 IEEE [19]

Davis-7200017 book February 22, 2011 12:47
42 Foliage Penetration SAR Collection Systems
Table 2--4 ERIM navy P-3C UWB FOPEN characteristics c© 1996 IEEE [20]
Altitude [Km] 7.5 Pulse Width [μ sec] 26.3Velocity [m/s] 135 PRF [Hz] 500–1200Frequency [MHz] 215–730 ADC [MHz] 30, 6 bitsBandwidth [MHz] 515 Range Resolution [m] 0.33Antenna Area, [m2] 1.0, Cross Range [m] 0.66Type Flared Notch ResolutionPolarization HH, VV, HV Slant Range [Km] 6.24Waveform LFM, Notched Swath Width [m] 929Peak Power [Kwatt] 1.0 Developed ERIM
bandwidth and high average power. The wide UHF spectrum also presented anew problem, since there are many critical users with sensitive frequencies. Toaddress these issues, chirp waveform modulation techniques were developedto synthesize programmable notches and to avoid interfering with criticalusers.
The UWB transmitter was a challenge due to the need for matching theoutput power and impedance to the antenna. The state of the art in solid-stateamplifiers was such that the power versus frequency could vary by as muchas 8 dB over the band. This affected the UWB SAR waveform in two ways, asillustrated in Figure 2–15: (1) the average power transmitted would be de-graded by the low-power components; and (2) the range side lobes of thewaveform would be degraded by the amplitude variation over the spectrum.
60
45
50
55
200 400 600
Frequency (MHz)
a. UWB Transmitter Amplitude Before Correction
Pow
er (
dBm
)
800
60
45
50
55
200 400 600
Frequency (MHz)
b. Predistorted UWB Transmitter Response
Pow
er (
dBm
)
800
FIGURE 2--15
UWB SAR transmitter amplitude response [21]
Davis-7200017 book February 22, 2011 12:47
2.2 FOPEN SAR Systems 43
FIGURE 2--16
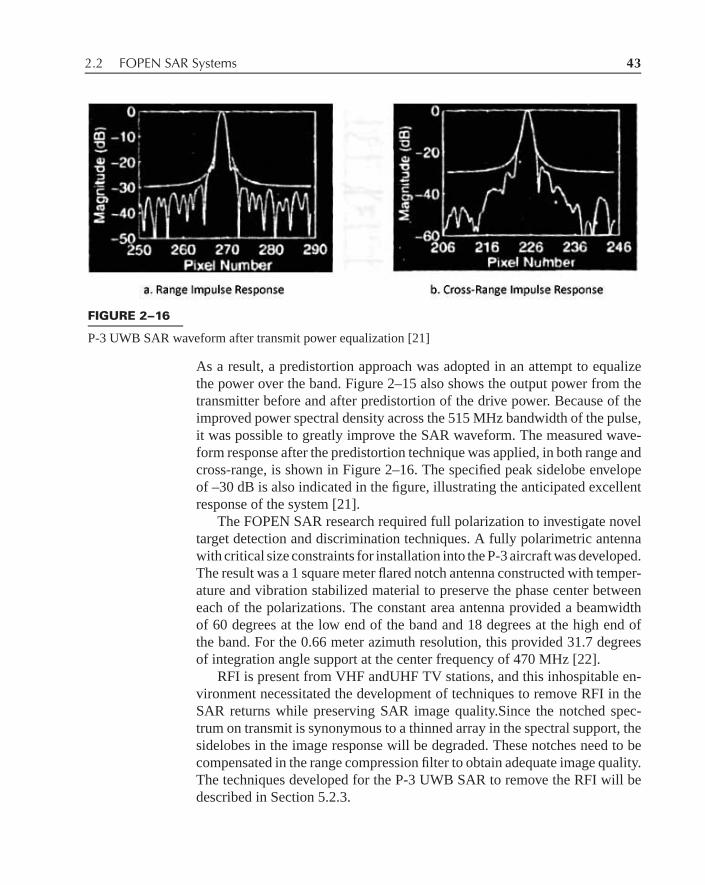
P-3 UWB SAR waveform after transmit power equalization [21]
As a result, a predistortion approach was adopted in an attempt to equalizethe power over the band. Figure 2–15 also shows the output power from thetransmitter before and after predistortion of the drive power. Because of theimproved power spectral density across the 515 MHz bandwidth of the pulse,it was possible to greatly improve the SAR waveform. The measured wave-form response after the predistortion technique was applied, in both range andcross-range, is shown in Figure 2–16. The specified peak sidelobe envelopeof –30 dB is also indicated in the figure, illustrating the anticipated excellentresponse of the system [21].
The FOPEN SAR research required full polarization to investigate noveltarget detection and discrimination techniques. A fully polarimetric antennawith critical size constraints for installation into the P-3 aircraft was developed.The result was a 1 square meter flared notch antenna constructed with temper-ature and vibration stabilized material to preserve the phase center betweeneach of the polarizations. The constant area antenna provided a beamwidthof 60 degrees at the low end of the band and 18 degrees at the high end ofthe band. For the 0.66 meter azimuth resolution, this provided 31.7 degreesof integration angle support at the center frequency of 470 MHz [22].
RFI is present from VHF andUHF TV stations, and this inhospitable en-vironment necessitated the development of techniques to remove RFI in theSAR returns while preserving SAR image quality.Since the notched spec-trum on transmit is synonymous to a thinned array in the spectral support, thesidelobes in the image response will be degraded. These notches need to becompensated in the range compression filter to obtain adequate image quality.The techniques developed for the P-3 UWB SAR to remove the RFI will bedescribed in Section 5.2.3.

Davis-7200017 book February 22, 2011 12:47
44 Foliage Penetration SAR Collection Systems
The FOPEN SAR’s low frequency of operation, together with its fineazimuth resolution (wide azimuth beamwidth), required the creation of longsynthetic apertures lengths or, equivalently, large integration angles. In turn,these large integration angles lead to severe range migration or differentialrange curvature of the scatterers during image formation, as presented inSection 4.1. Moreover, scatterers at different locations in an imaged sceneexperience different levels of range migration.This variation makes selectionof the proper image formation algorithm critical. Whileit is straightforward tocompensate range curvature for a given range bin, it is difficult to compensaterange curvature for all range bins simultaneously.
A number of algorithms are available for fine-resolution SAR image for-mation, as detailed in Section 4.2. Two algorithms that are commonly usedto minimize the motion of scatterers across the image are the BPA and theRMA. The former is computationally complex, requiring order of N3 opera-tions, where N is the number of pixels in the array. The RMA is unique in thatit provides an exact solution to the problem of differential range curvature andhas a computational complexity on the order of N2log2N. RMA was selectedto provide the most efficient image formation that could be integrated into thelong-term objective of a real-time onboard processor [22].
A final problem in low-frequency UWB SAR is the presence of dominantinterfering radio frequency signals. These signals originate from a numberof sources, the most serious being VHF and UHF television transmitters andcellular telephones. To improve the received image, a simple filtering schemewas employed to remove most of the interference energy prior to image for-mation. An important image quality metric is the multiplicative noise ratio(MNR), or the ratio of the image intensity in a low return area (e.g., water) tothe return from bright clutter, such as the foliage. Many factors contribute toMNR, as will be detailed in Section 7.3.1. However, RFI is a major contrib-utor to the background interference affecting target detection. Without RFIrejection, the MNR was –9 dBm2/m2, and after RFI rejection it was reducedto –20 dBm2/m2.
With approximately 1 km swath, moderate areas could be collected at threepolarizations to provide significant data for fully polarimetric SAR character-ization. The image shown in Figure 2–17, which was one of the early ERIMperformance verification tests, demonstrated the ability of multiple polariza-tions to provide improvements in target discrimination. The image covers abiological field station in Michigan with an array of trees and other culturalobjects. The figure includes some ground truth photographs of the instrumen-tation and the vehicles used for image characterization. It is interesting tonote in the image that the large trihedrals, used for calibrating the polariza-tion channels, have persistent sidelobes in the range dimension (horizontal,

Davis-7200017 book February 22, 2011 12:47
2.2 FOPEN SAR Systems 45
FIGURE 2--17
P-3 ultra wideband SAR image characterization © 1996 IEEE [20]
with far range to the right in this image). These sidelobes are due to notchingout of strong RFI sources, and, although quite persistent, are still over 30 dBdown. This prompted additional research into methods of RFI suppression tofill notches in the received spectrum.The low noise equivalent clutter returnis also evident in the open areas [22].
The P-3 carried a multiple-channel wideband recording system. All ofthe data were recorded and calibrated after each flight. Significant advancesin waveform generation, image formation processing, and automatic targetdetection and characterization were made with this instrument from 1995to 2000.
2.2.4 NASA JPL’s GeoSAR P-Band InterferometricMapping SAR
GeoSAR is an interferometric mapping SAR development in the late 1990sto enable digital terrain elevation data (DTED) formation and terrain char-acterization for a “bald earth.” The motivation for the program was a ma-jor earthquake in Los Angeles, California, where significant damage was
Davis-7200017 book February 22, 2011 12:47
46 Foliage Penetration SAR Collection Systems
exacerbated by insufficient knowledge of the terrain characteristics over muchof the state. If a single platform could collect terrain elevation and structuralcharacteristics at ground level, it was postulated that the loss of property couldbe avoided by better procedures for building and land-use planning. The de-velopment proceeded under a “dual-use” commercial consortium, where JPLprovided the technology, DARPA; and the California Department of Conser-vation provided the end-user requirements; and EarthData provided the air-craft and commercialization plan for worldwide mapping services. It shouldbe noted that the international geosciences community use the notation of P-band instead of UHF band for the frequency of operation. GeoSAR operatesin the middle of the frequencies for FOPEN SAR operation and shares manyof the same technical and geopolitical challenges for worldwide operation ofan UWB RADAR.
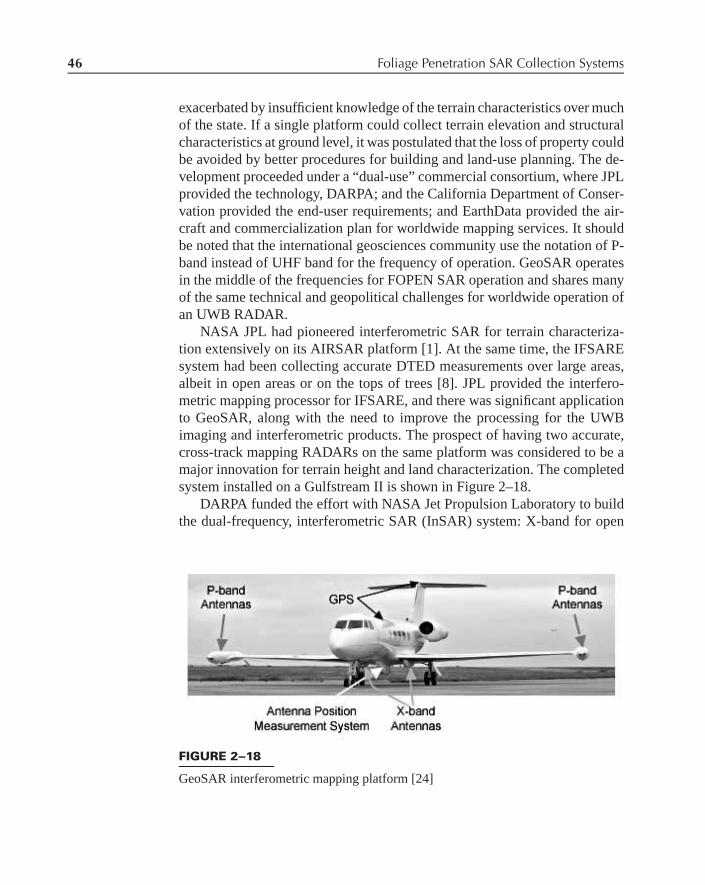
NASA JPL had pioneered interferometric SAR for terrain characteriza-tion extensively on its AIRSAR platform [1]. At the same time, the IFSAREsystem had been collecting accurate DTED measurements over large areas,albeit in open areas or on the tops of trees [8]. JPL provided the interfero-metric mapping processor for IFSARE, and there was significant applicationto GeoSAR, along with the need to improve the processing for the UWBimaging and interferometric products. The prospect of having two accurate,cross-track mapping RADARs on the same platform was considered to be amajor innovation for terrain height and land characterization. The completedsystem installed on a Gulfstream II is shown in Figure 2–18.
DARPA funded the effort with NASA Jet Propulsion Laboratory to buildthe dual-frequency, interferometric SAR (InSAR) system: X-band for open
FIGURE 2--18
GeoSAR interferometric mapping platform [24]
Davis-7200017 book February 22, 2011 12:47
2.2 FOPEN SAR Systems 47
Table 2--5 GeoSAR P-band interferometric SAR characteristics © 2001 IEEE [23, 24]
Altitude [Km] 10–12 Pulse Width [μsec] 40Velocity [m/s] 220 PRF [Hz] 500, per side
per antennaCenter Frequency [MHz] 350 ADC [MHz] 360, 10 bitsBandwidth [MHz] 80, 160 Range Resolution [m] 1.0Antenna Area, [m2] 0.57, Cross Range [m] 1.0Type 4-element Array ResolutionPolarization HH, HV; or Slant Range [Km] 25
VV, HVWaveform LFM, Notched Swath Width [Km] 10–12Peak Power [Kwatt] 4.0 Developed, NASA/JPL,
Operated Fugro Earth Data
terrain DTED, and P-band for DTED below the foliage. The P-band band-width of the GeoSAR system, as shown in Table 2–5, would not be as broadas FOPEN SARs used for tactical target detection. However, several inno-vations in waveform generation, multiple polarization antennas, and signalprocessing were made. These features provided well-calibrated data for twoobjectives: DTED under dense forest; and polarimetric characterization ofterrain features [23].
The operational objective was to collect four 10 km swaths simultaneously,one at each frequency and one on each side of the aircraft. Efficient imageformation, RFI rejection, and DTED formation processing were required forboth the civilian and commercial applications for GeoSAR.
The dual-polarization P-band antennas are housed in the wingtip podsas shown in Figure 2–18. Each pod has two antennas, one looking port andone starboard. GeoSAR is a dual-baseline, single-pass system simultaneouslycollecting both ping-pong and single-antenna transmit interferometric modes.Ping-pong processing is used for improved DTED resolution on relatively flatterrain and in single-antenna transmits processing for rugged terrain. Addi-tionally, the polarization channels on either pod can be used for land use datacharacterization. Fugro EarthData maintains, modernizes, and enhances theGeoSAR system and continues to provide commercial GeoSAR DTED andland use mapping services worldwide [24].
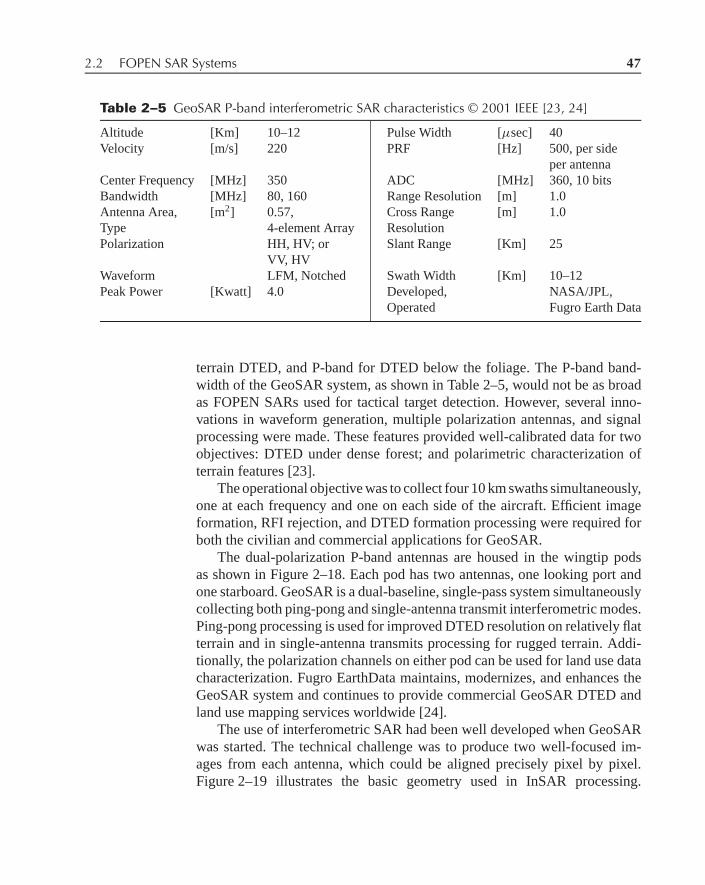
The use of interferometric SAR had been well developed when GeoSARwas started. The technical challenge was to produce two well-focused im-ages from each antenna, which could be aligned precisely pixel by pixel.Figure 2–19 illustrates the basic geometry used in InSAR processing.
Davis-7200017 book February 22, 2011 12:47
48 Foliage Penetration SAR Collection Systems
FIGURE 2--19
Two side operation of GeoSAR for P-band and X-band mapping [27]
However, this figure has been simplified by omitting the four additional illu-mination beams to form an interferometric pair, at the two frequencies and onthe port and starboard side of the aircraft.
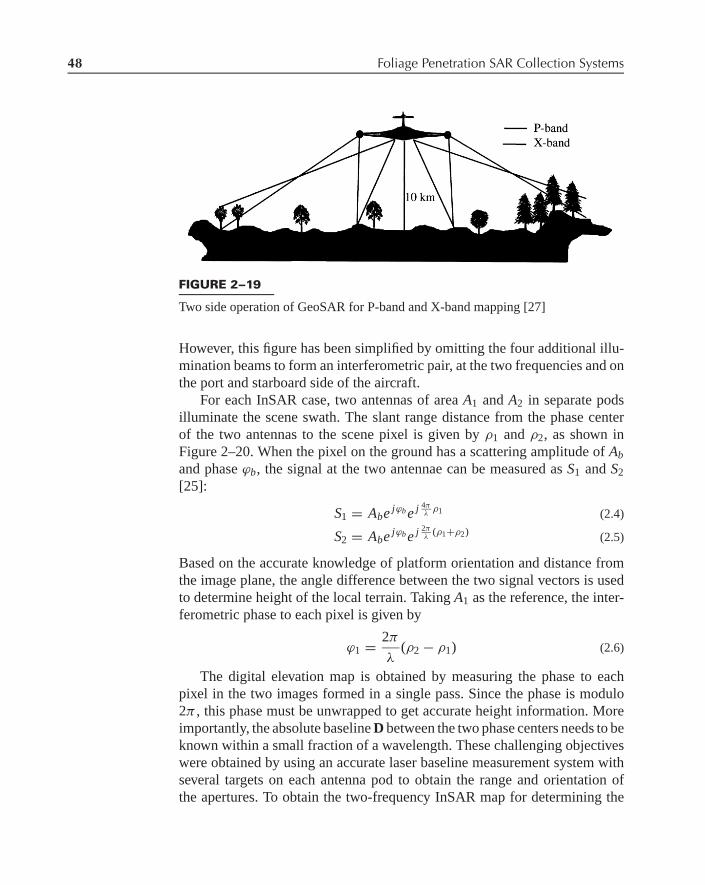
For each InSAR case, two antennas of area A1 and A2 in separate podsilluminate the scene swath. The slant range distance from the phase centerof the two antennas to the scene pixel is given by ρ1 and ρ2, as shown inFigure 2–20. When the pixel on the ground has a scattering amplitude of Ab
and phase ϕb, the signal at the two antennae can be measured as S1 and S2
[25]:
S1 = Abe jϕb e j 4πλ
ρ1 (2.4)
S2 = Abe jϕb e j 2πλ
(ρ1+ρ2) (2.5)
Based on the accurate knowledge of platform orientation and distance fromthe image plane, the angle difference between the two signal vectors is usedto determine height of the local terrain. Taking A1 as the reference, the inter-ferometric phase to each pixel is given by
ϕ1 = 2π
λ(ρ2 − ρ1) (2.6)
The digital elevation map is obtained by measuring the phase to eachpixel in the two images formed in a single pass. Since the phase is modulo2π , this phase must be unwrapped to get accurate height information. Moreimportantly, the absolute baseline D between the two phase centers needs to beknown within a small fraction of a wavelength. These challenging objectiveswere obtained by using an accurate laser baseline measurement system withseveral targets on each antenna pod to obtain the range and orientation ofthe apertures. To obtain the two-frequency InSAR map for determining the
Davis-7200017 book February 22, 2011 12:47
2.2 FOPEN SAR Systems 49
A1
Abej�
b
v
D
A2 �1
�2
FIGURE 2--20
Interferometric SARprocessing geometry [19]
scattering from the ground (as opposed to the tops of the trees), the pixels atP-band and X-band need to be similarly coaligned.
GeoSAR developed several innovations in image processing to make thispossible. First, the focusing of the images over wide angles and swath widthsare important [26]. If autofocus were used to take out variations in the phaseerrors due to terrain variation or propagation uncertainties, the absolute ac-curacy would be degraded. Second, the measurements in each band need tobe radiometrically calibrated for estimating the signal correlation and scat-tering center [27]. Finally, the effects of RFI and transmit notching need tobe accounted for in the waveform reconstruction [28]. These developmentshave been accomplished and are being used to provide commercial imagingservices with GeoSAR.
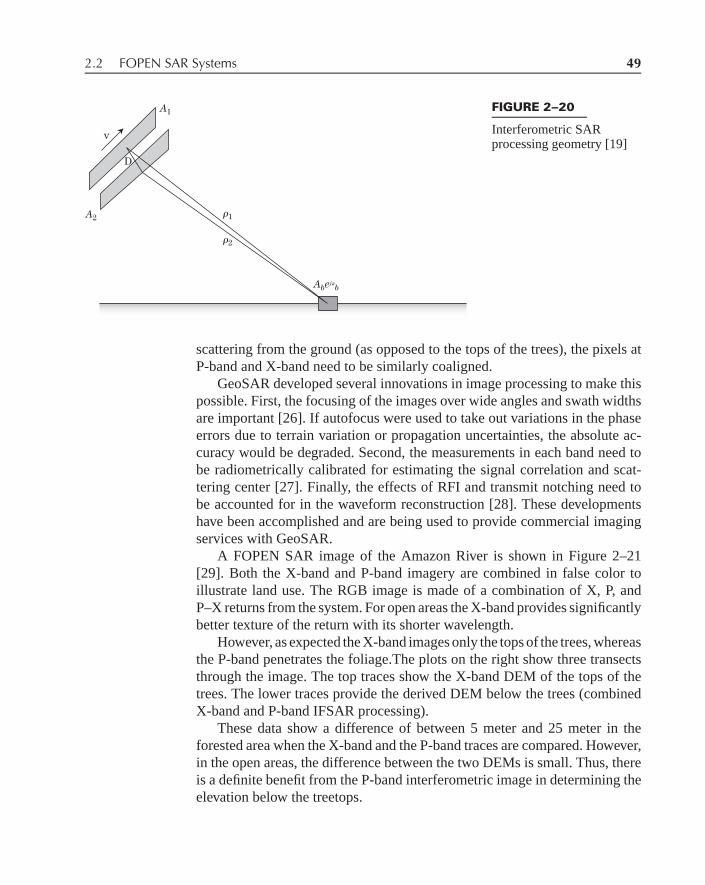
A FOPEN SAR image of the Amazon River is shown in Figure 2–21[29]. Both the X-band and P-band imagery are combined in false color toillustrate land use. The RGB image is made of a combination of X, P, andP–X returns from the system. For open areas the X-band provides significantlybetter texture of the return with its shorter wavelength.
However, as expected the X-band images only the tops of the trees, whereasthe P-band penetrates the foliage.The plots on the right show three transectsthrough the image. The top traces show the X-band DEM of the tops of thetrees. The lower traces provide the derived DEM below the trees (combinedX-band and P-band IFSAR processing).
These data show a difference of between 5 meter and 25 meter in theforested area when the X-band and the P-band traces are compared. However,in the open areas, the difference between the two DEMs is small. Thus, thereis a definite benefit from the P-band interferometric image in determining theelevation below the treetops.
Davis-7200017 book February 22, 2011 12:47
50 Foliage Penetration SAR Collection Systems
FIGURE 2--21
GeoSAR collection of terrain height characteristics—Amazon River [29]
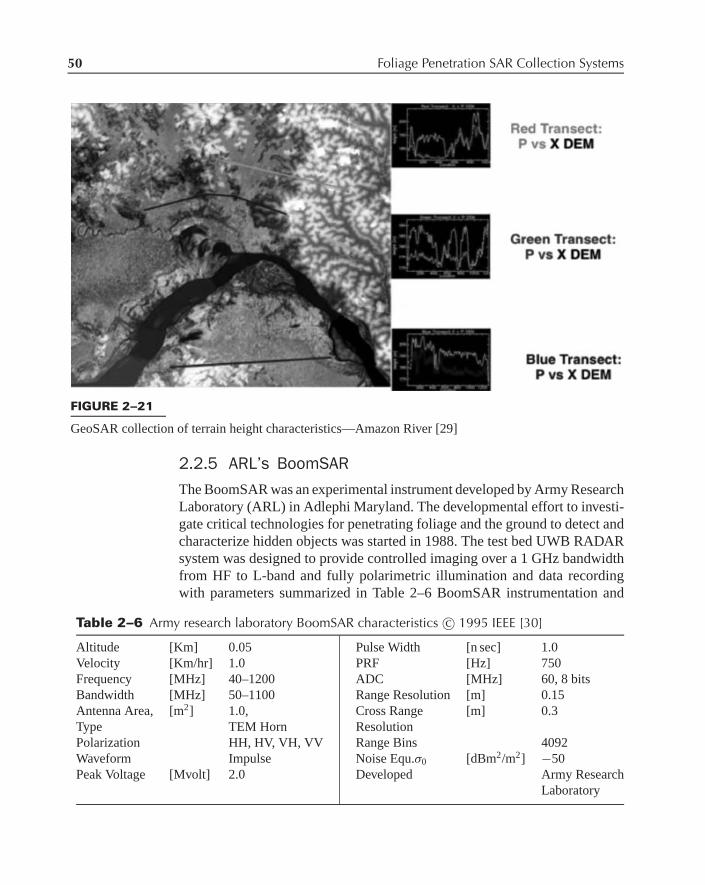
2.2.5 ARL’s BoomSARThe BoomSAR was an experimental instrument developed by Army ResearchLaboratory (ARL) in Adlephi Maryland. The developmental effort to investi-gate critical technologies for penetrating foliage and the ground to detect andcharacterize hidden objects was started in 1988. The test bed UWB RADARsystem was designed to provide controlled imaging over a 1 GHz bandwidthfrom HF to L-band and fully polarimetric illumination and data recordingwith parameters summarized in Table 2–6 BoomSAR instrumentation and
Table 2--6 Army research laboratory BoomSAR characteristics c© 1995 IEEE [30]
Altitude [Km] 0.05 Pulse Width [n sec] 1.0Velocity [Km/hr] 1.0 PRF [Hz] 750Frequency [MHz] 40–1200 ADC [MHz] 60, 8 bitsBandwidth [MHz] 50–1100 Range Resolution [m] 0.15Antenna Area, [m2] 1.0, Cross Range [m] 0.3Type TEM Horn ResolutionPolarization HH, HV, VH, VV Range Bins 4092Waveform Impulse Noise Equ.σ0 [dBm2/m2] −50Peak Voltage [Mvolt] 2.0 Developed Army Research
Laboratory
Davis-7200017 book February 22, 2011 12:47
2.2 FOPEN SAR Systems 51
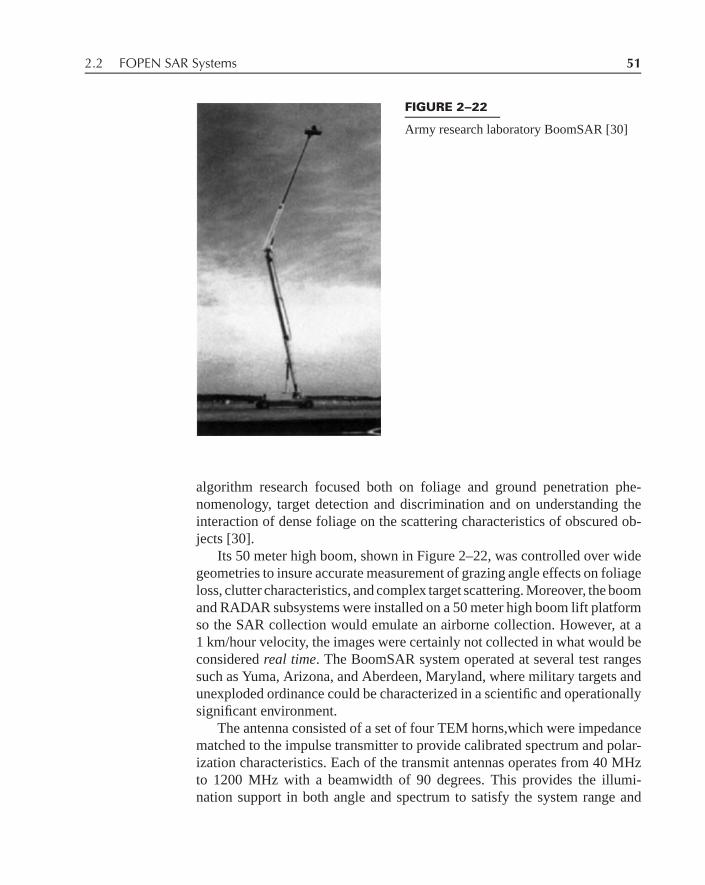
FIGURE 2--22
Army research laboratory BoomSAR [30]
algorithm research focused both on foliage and ground penetration phe-nomenology, target detection and discrimination and on understanding theinteraction of dense foliage on the scattering characteristics of obscured ob-jects [30].
Its 50 meter high boom, shown in Figure 2–22, was controlled over widegeometries to insure accurate measurement of grazing angle effects on foliageloss, clutter characteristics, and complex target scattering. Moreover, the boomand RADAR subsystems were installed on a 50 meter high boom lift platformso the SAR collection would emulate an airborne collection. However, at a1 km/hour velocity, the images were certainly not collected in what would beconsidered real time. The BoomSAR system operated at several test rangessuch as Yuma, Arizona, and Aberdeen, Maryland, where military targets andunexploded ordinance could be characterized in a scientific and operationallysignificant environment.
The antenna consisted of a set of four TEM horns,which were impedancematched to the impulse transmitter to provide calibrated spectrum and polar-ization characteristics. Each of the transmit antennas operates from 40 MHzto 1200 MHz with a beamwidth of 90 degrees. This provides the illumi-nation support in both angle and spectrum to satisfy the system range and
Davis-7200017 book February 22, 2011 12:47
52 Foliage Penetration SAR Collection Systems
cross-range resolution objectives. Two of the horns transmit and two receive,with orthogonal polarization, to provide the full polarization matrix.
The system was used extensively to collect high-resolution, fully po-larimetric data using the RADAR’s UWB waveform and to develop two-dimensional (down-range versus cross-range) images of a controlled swatharea. Within the controlled swath area were targets inthe clear, targets underfoliage, subsurface targets, and natural and man-made clutter. The systemprovided the image swaths of up to 300 meters down-range by 1 Km cross-range, with spatial resolution in each dimension of less than 0.3 meter. Thehigh-range resolution was obtained by using waveform bandwidth greaterthan 1 GHz and comparable high-speed sampling and recording techniques.A 2 megawatt impulse transmitter produced the UWB signal, having a spectralresponse extending from 60 MHz to over 1 GHz.
Through careful matching between the transmitter and the antenna andattention to receiver dynamic range and match to the ADC assemblies, theinstrumented noise equivalent sigma-naught σ 0
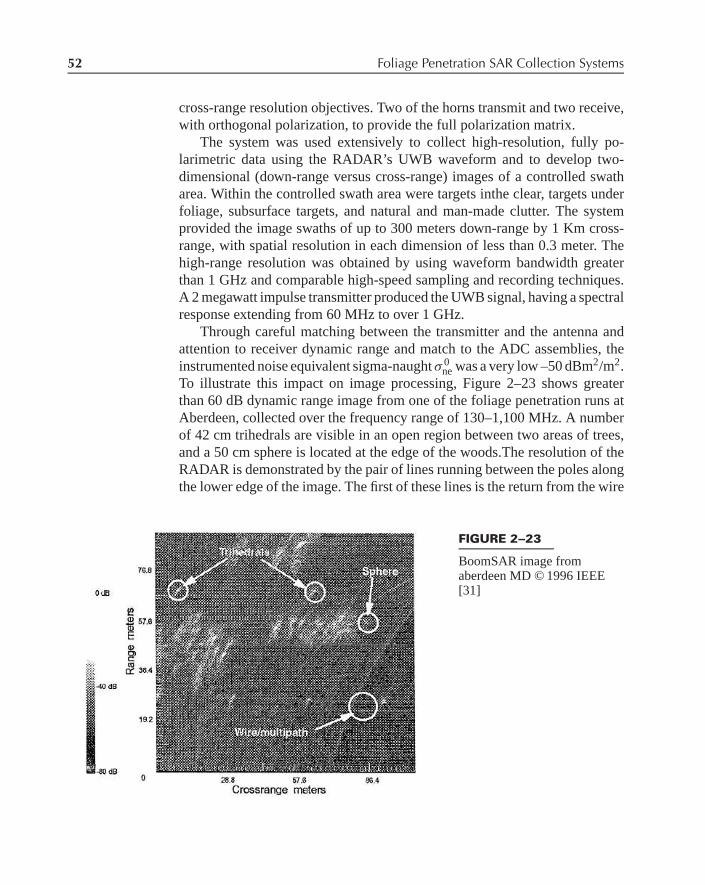
ne was a very low –50 dBm2/m2.To illustrate this impact on image processing, Figure 2–23 shows greaterthan 60 dB dynamic range image from one of the foliage penetration runs atAberdeen, collected over the frequency range of 130–1,100 MHz. A numberof 42 cm trihedrals are visible in an open region between two areas of trees,and a 50 cm sphere is located at the edge of the woods.The resolution of theRADAR is demonstrated by the pair of lines running between the poles alongthe lower edge of the image. The first of these lines is the return from the wire
FIGURE 2--23
BoomSAR image fromaberdeen MD © 1996 IEEE[31]

Davis-7200017 book February 22, 2011 12:47
2.2 FOPEN SAR Systems 53
FIGURE 2--24
Army research laboratory image processing evaluation tool © 1999 IEEE [32]
strung between the poles, whereas the second is the multipath return from theground reflection of the signal [31].
The Army Research Laboratory had a strong in-house team developingalgorithms for image formation and target recognition. The wide dynamicrange image recordings were processed in a high-performance computer to testand verify performance predictions. Figure 2–24 shows the screen capture ofdata from the test range at the Army Research Laboratory facility. Significantmetrology was built into the analysis tools to quantify the signal processingand target recognition figures of merit [32].
Several critical FOPEN phenomena are shown in Figure 2–24, from theARL image analysis tool. First, there is an excellent example of a long wireabove the ground, indicated by the parallel lines in the near range of the figure.The closest return is the direct path from the RADAR to the wire. The nexttwo parallel lines are the single and double bounce of the return from theground, respectively. This clear return is a benefit of collecting SAR imageover a wide beamwidth, with very fine-range resolution.
The second critical example is based on the return from two similar cornerreflectors, one in the open and one 40 meters in the woods. Figure 2–25 shows

Davis-7200017 book February 22, 2011 12:47
54 Foliage Penetration SAR Collection Systems
Inches
dBCorner 40 m back
Corner in clear
–90–39
–36
–33
–30
–27
–24
–21
–18
–15
–12
–9
–6
–3
0
–80 –70 –60 –50 –40 –30 –20 –10 0 10 20 30 40 50 60 70 80 90
FIGURE 2--25
Impact of foliage loss variation on corner reflector [33]
the cross-range resolution of the RADAR measure from the corner reflector.The narrow resolution is characteristic of the wide-angle SAR collection.However, the return from the corner reflector in the foliage has degradedcross-range resolution due to the variation of loss and blockage of the forest,as a function of collection angle [33].
2.3 References[1] Details of AIRSAR on NASA Jet Propulsion Laboratory, Pasaden CA, Website,
http://airsar.jpl.nasa.gov/
[2] Vickers, R.S., Lowry, R.T., and Schmidt, A.D., “A VHF RADAR to Make Terrain Ele-vation Models through Tropical Jungles,”Proc 1988 IEEE RADAR Conference.
[3] Hellsten, H., “CARABAS-an UWB Low Frequency SAR,”IEEE MTT-S InternationalSymposium Vol.3, June 1–5, 1992, pp. 1495–1498.
[4] Robinson, C.A., “Robots Counters Camouflage,” Signal Magazine, June 2007, p. 40.
[5] Davis, M.E., “Technical Challenges In Ultra-Wideband RADAR Development for TerrainMapping,” Proc”, Presented at IGARSS, Seattle, WA, April 1998.
[6] Carrara, W.G., Goodman, R.S., and Majewski, R.M., Spotlight Synthetic Aperture RADARSignal Processing Algorithms, Artech House, Boston, MA, 1995, Chapter. 2.
[7] IEEE Standard RADAR Definitions, IEEE STD 686-2008, IEEE, New York, May 2008,p. 38.
Davis-7200017 book February 22, 2011 12:47
2.3 References 55
[8] Adams, G., et al., “The ERIM Interferometric SAR: IFSARE,”Proc 1996 National RADARConference, Ann Arbor, MI, May 13–16, 1996, pp. 249–254.
[9] Vandenberg, N., et al., “P-3 Ultra Wide Band SAR: System Applications to FoliagePenetration,”SPIE Vol. 2757, Orlando, FL, April 1996, p. 130.
[10] Vickers, R. S., “Ultra Wideband RADAR—Potential and Limitations,”Proc 1991 IEEEMTTS Conference, June 1991, pp. 371–74.
[11] Vickers, R. S., “Design and Application of Airborne VHF/UHF RADAR,”AES SystemsMagazine, Vol. 17, No. 6, June 2002, pp. 26–29.
[12] Stanford Research Institute, Palo Alto CA, “Foliage Penetration Radar”, Web sitehttp://www.sri.com/esd/penetratingradar/folpen/folpen.html
[13] Hellsten, H., Ulander, L.M.H., Gustavsson, A., and Larsson, B.,“Development of VHFCARABAS II SAR,” Proc. RADAR SensorTechnology, SPIE Vol. 2747, Orlando, FL,April 8–9, 1996.
[14] Ulander, L.M.H., Frolind, P.-O., Gustavsson, A., Hellsten, H., Jonsson, T., Larsson, B.,et al., “Performance of the CARABAS-II VHF-Band Synthetic Aperture Radar,” Pro-ceedings of IGARSS 2001, Sydney, Australia, July 9–13, 2001, pp. 129–131.
[15] Murdin, D., Flood, B., Frolind, P.-O., Haapahlati, G., and Ulander, L., “Upgrade ofReal-time CARABAS-II Image Formation and Change Detection,” Technical Report,FOI-R-2371-SE, Division of Sensor Technology, Swedish Defence Research Agency,2007.
[16] Hellsten, H. and Ulander, L.M.H., “VHF/UHF Synthetic Aperture RADAR—Principlesand Motivation,” Proc 1999 IEEE RADAR Conference, Boston, MA, April 1999,p. 47.
[17] Ulander. L. and Frolind, P.-O., “Precision Processing of CARABAS HF/VHF-Band SARData,” Proceedings IGARSS, Hamburg, Germany, June, 1999, pp. 47–49.
[18] Courtesy of M. Toups, MIT Lincoln Laboratory, Lexington MA, June 1997.
[19] Lee, R.R., Verdi, J.S., and Soumekh, M., “Enhancements of NP-3 UHF Image QualityUsing Digital Spotlighting Technique,” Proc 2001 IEEE RADAR Conference, Atlanta,GA, May 2001.
[20] Sheen, D.R., Vandenberg, N.L., et al.,“P-3 Ultra-Wideband SAR:Description and Exam-ples,” IEEE AES Systems Magazine, November 1996, pp. 25–30.
[21] Carrara, W., Goodman, R., Rawson, R., et al., “A Foliage and Ground PenetratingSAR”, Proc. 41st Tri Services Radar Symposium, Unclassified, Laurel, MD, June 1995,pp. 187–202.
[22] Goodman, R., Tummala, S., and Carrara, W., “Issues in Ultra-Wideband, Widebeam SARImage Formation,” Proc. 1995 IEEE International RADAR Conference, Washington, DC,May 1995, pp. 479–485.
[23] Hensley, S., Chapin, E., Freedman, A., et al., “First P Band Results Using the GeoSARMapping System,” Proc 2001 IEEE RADAR Conference, Atlanta, GA, May 2001,p. 126.
[24] Reis, J.J, Fugro EarthData,Frederick, MD, www.earthdata.com, private communication.
[25] Rosen, P., et al., “Synthetic Aperture RADAR Interferometry,” Proceedings of the IEEEVol.88, No.3, March 2000, pp. 333–382.

Davis-7200017 book February 22, 2011 12:47
56 Foliage Penetration SAR Collection Systems
[26] Madsen, S., “Motion Compensation for Ultra Wide Band SAR,” Proc IGARSS ’01Vol.3,July 2001, pp. 1436–1438.
[27] Chapin, E., Hensley, S., and Michel, T.R., “Calibration of an Across Track InterferometricP-Band SAR,”Proc IGARSS 2001Vol. 1, July 2001, pp. 502–504.
[28] Le, C. and Hensley, S., “Removal of RFI in Wideband RADARs,” Proc 1998 IGARSSymposium, Seattle, WA, July 1998, p. 2032.
[29] Carson, T. M., “Topographical Mapping in the Equatorial Belt Using Dual FrequencyAirborne IFSAR (GeoSAR),”Photogrammeric Engineering & Remote Sensing, August2008, p. 939.
[30] Ressler, M., et al., “The Army Research LaboratoryUltra-Wide Band TestbedRADARs,”Proc. IEEE International RADAR Conference, Arlington, VA, May 1995,pp. 686–691.
[31] Ressler, M., “The Army Research Laboratory Ultra Wideband BoomSAR,” Proc IGARSSVol. 3, May 1996, pp. 1886–1888.
[32] Kapoor, R., Banerjee, A., Tsihrintzis, G. A., and Nandhakumar, N., “UWB RADARDetection of Targets in Foliage Using Alpha Stable Clutter Models,” IEEE Trans. AESSVol. 35, No. 3, July 1999, p. 819.
[33] McCorkle, J., “What’s So Special about UWB Propagation,” Presentation at 3rd IEEEUltrawideband Communications Workshop, Atlanta, GA, May 19–22, 2002.